Cellulosic Supply Chain Alternatives: The Opportunity for Food AND Fuel Joseph Carolan Joseph Carolan Dr. Satish Joshi Dept. of Agricultural, Food & Resource Economics Dr. Bruce E. Dale Dept. of Chemical Engineering & Materials Science Michigan State University Northern Plains Bio-Mass Economy: What Makes Sense? Fargo, North Dakota Monday September 29 2008 Monday, September 29, 2008
Transcript
Cellulosic Supply Chain Alternatives:The Opportunity for Food AND Fuel
Joseph CarolanJoseph CarolanDr. Satish Joshi
Dept. of Agricultural, Food & Resource Economics
Dr. Bruce E. DaleDept. of Chemical Engineering & Materials Science
Michigan State Universityg y
Northern Plains Bio-Mass Economy: What Makes Sense?Fargo, North Dakota
Monday September 29 2008Monday, September 29, 2008
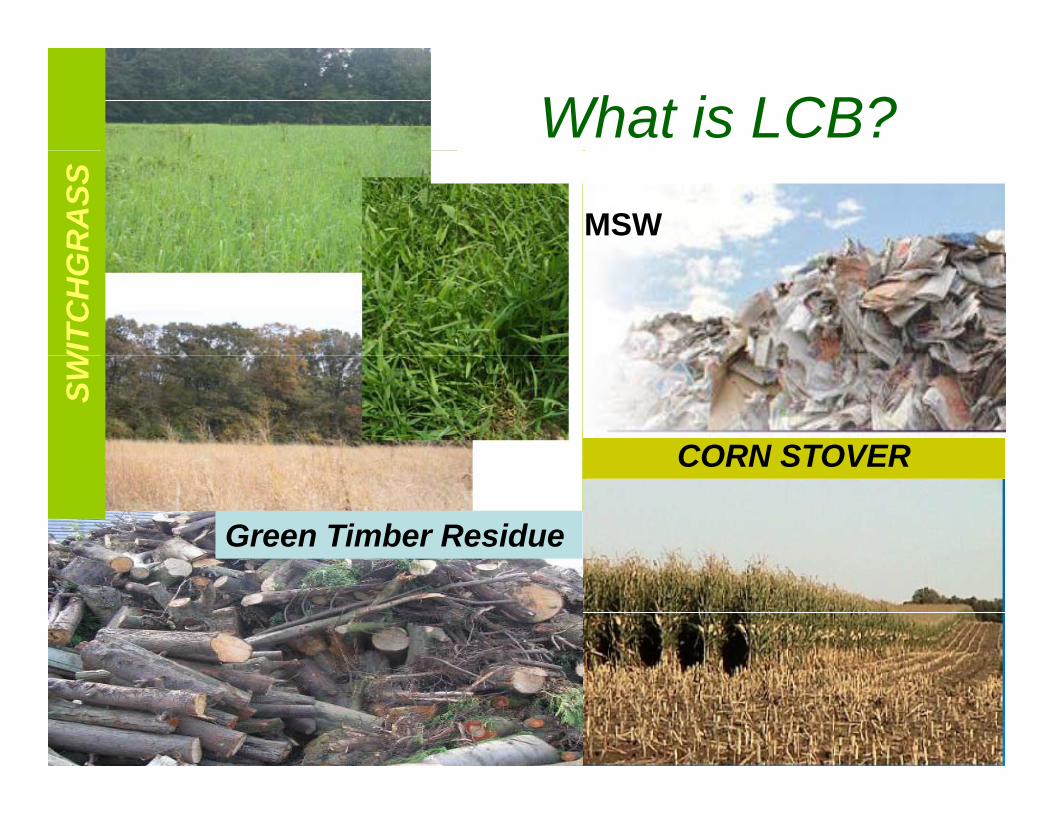
What is LCB?G
RA
SS
MSW
WIT
CH
GSW
CORN STOVERCORN STOVER
Green Timber Residue
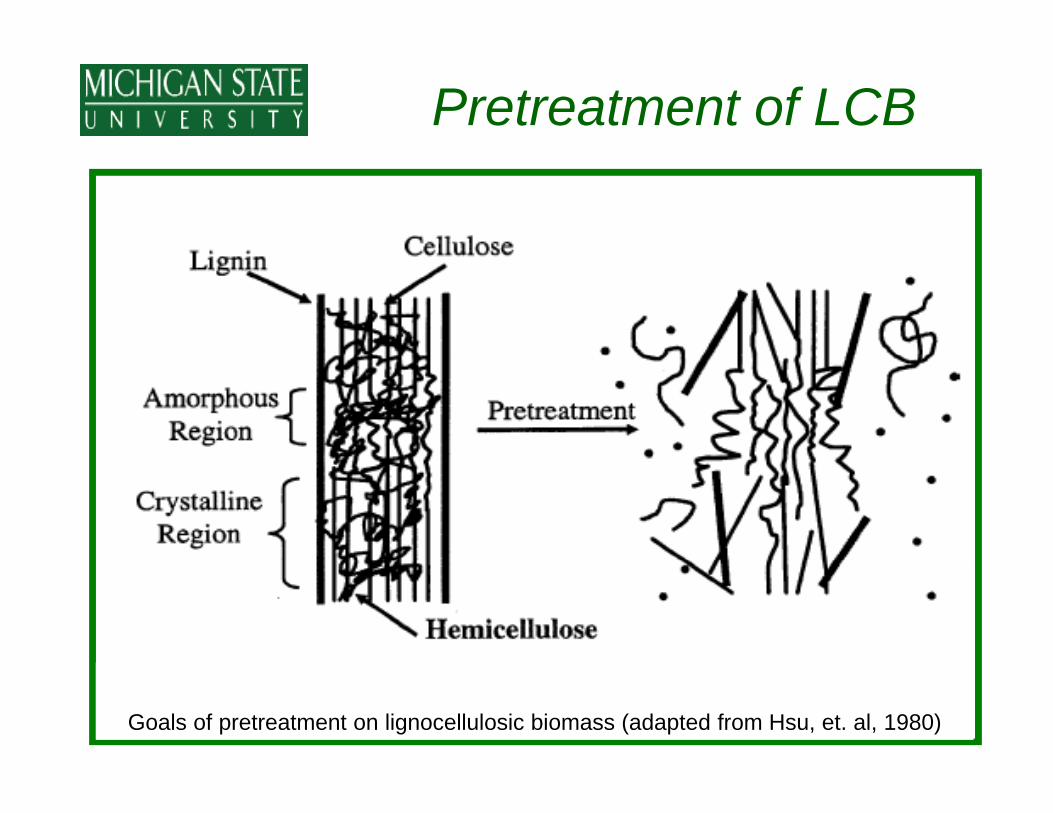
Pretreatment of LCB
Goals of pretreatment on lignocellulosic biomass (adapted from Hsu, et. al, 1980)
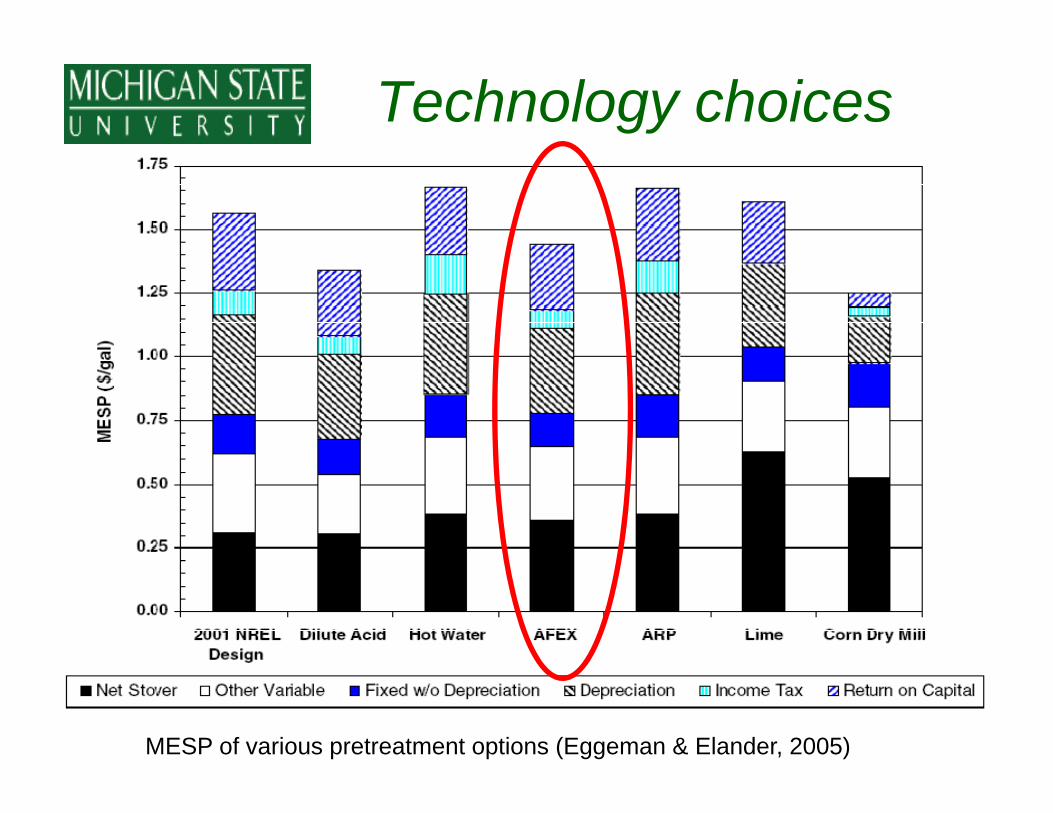
Technology choices
MESP of various pretreatment options (Eggeman & Elander, 2005)
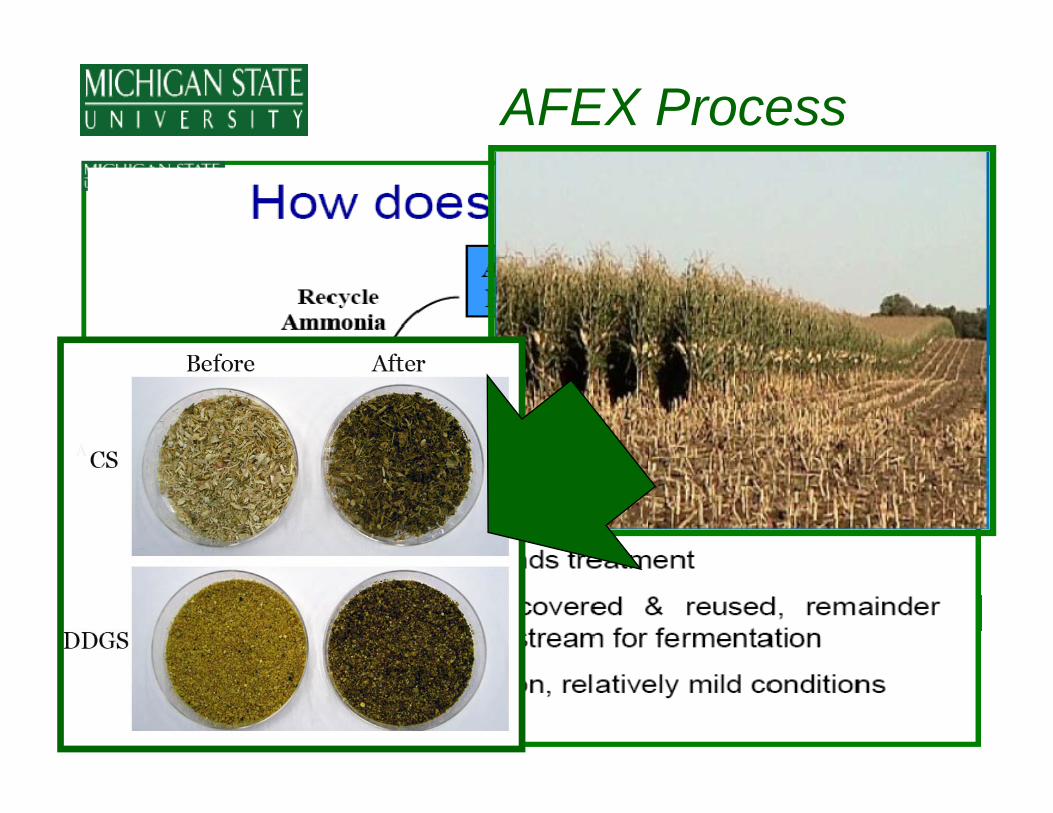
AFEX Process
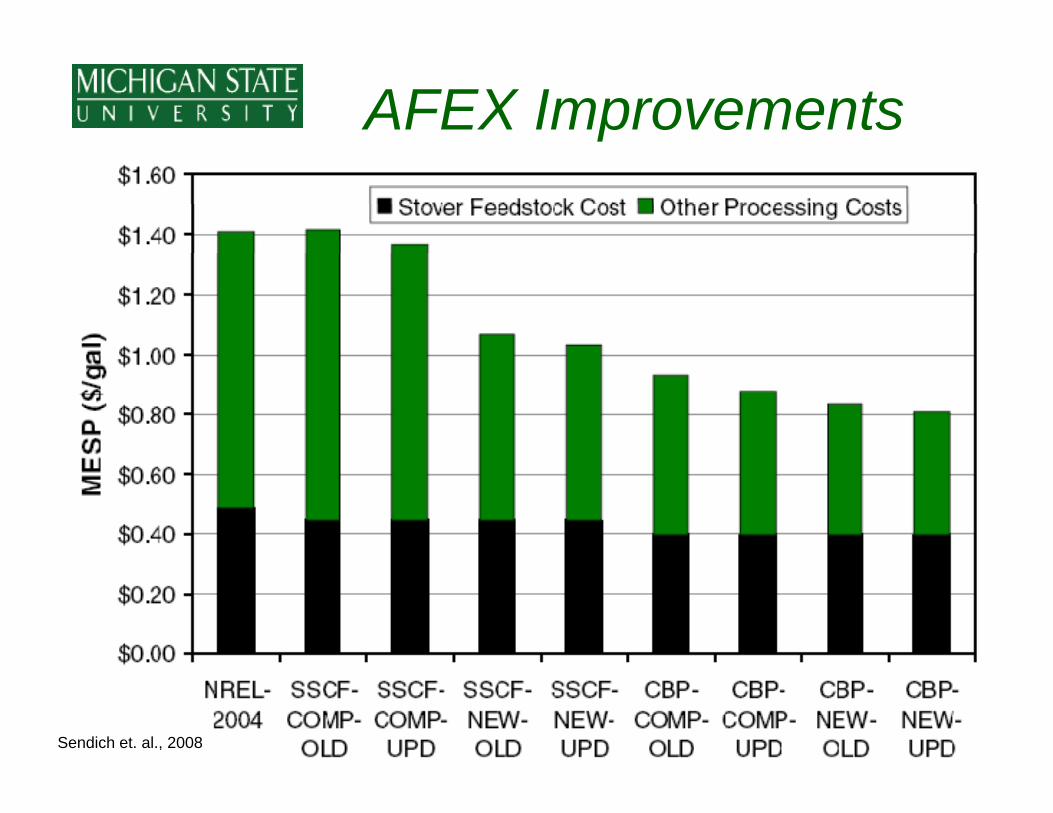
AFEX Improvements
Sendich et. al., 2008
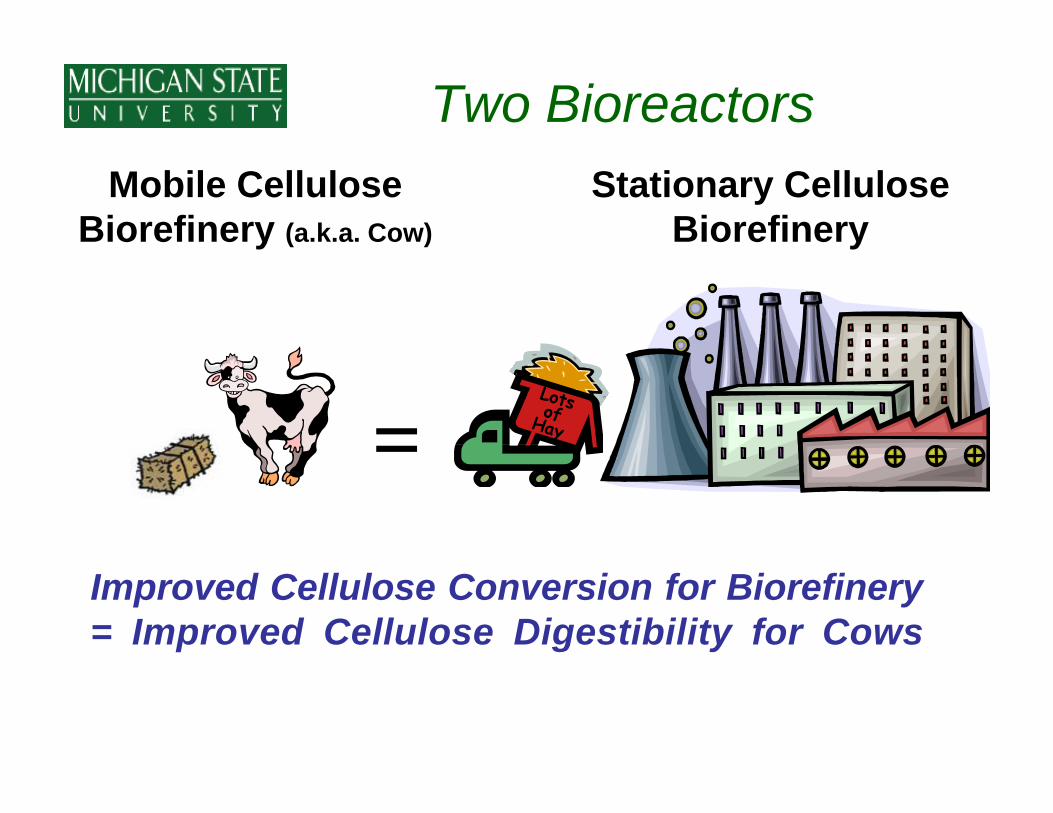
Two BioreactorsMobile Cellulose
Biorefinery (a.k.a. Cow)Stationary Cellulose
Biorefinery
=Improved Cellulose Conversion for Biorefinery= Improved Cellulose Digestibility for Cows
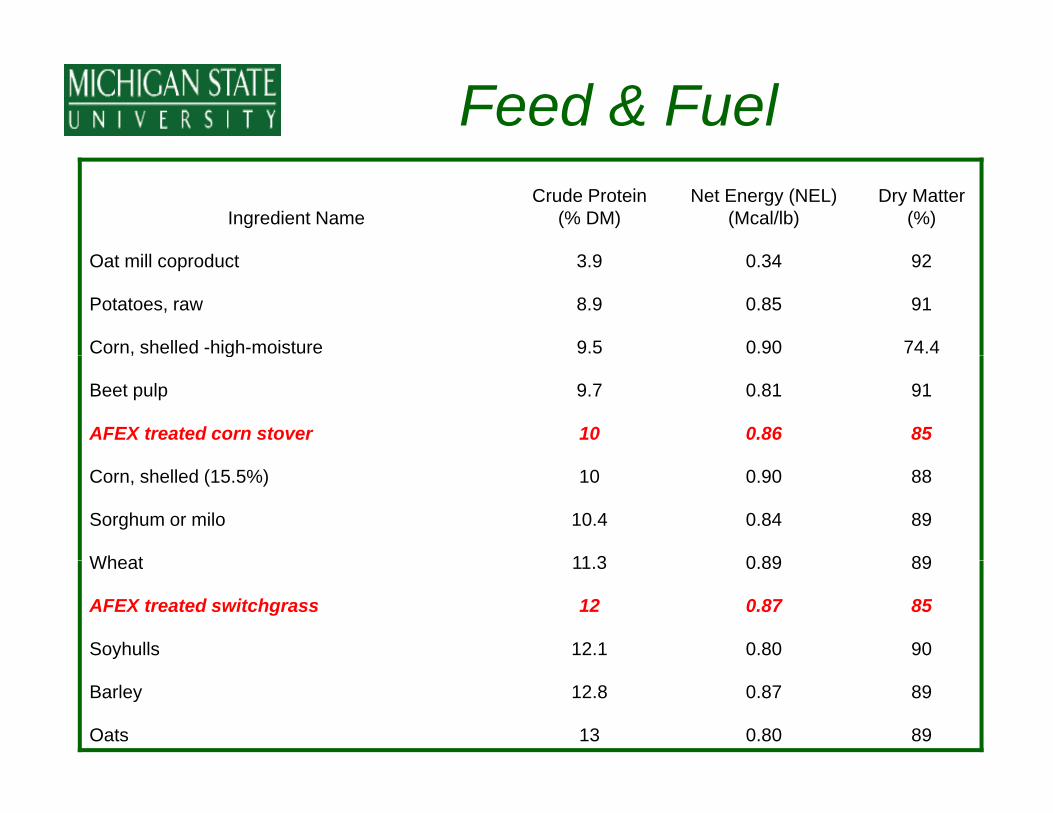
Feed & Fuel
Ingredient NameCrude Protein
(% DM)Net Energy (NEL)
(Mcal/lb)Dry Matter
(%)
Oat mill coproduct 3.9 0.34 92
Potatoes, raw 8.9 0.85 91
Corn, shelled -high-moisture 9.5 0.90 74.4, g
Beet pulp 9.7 0.81 91
AFEX treated corn stover 10 0.86 85
Corn, shelled (15.5%) 10 0.90 88
Sorghum or milo 10.4 0.84 89
Wheat 11 3 0 89 89Wheat 11.3 0.89 89
AFEX treated switchgrass 12 0.87 85
Soyhulls 12.1 0.80 90
Barley 12.8 0.87 89
Oats 13 0.80 89
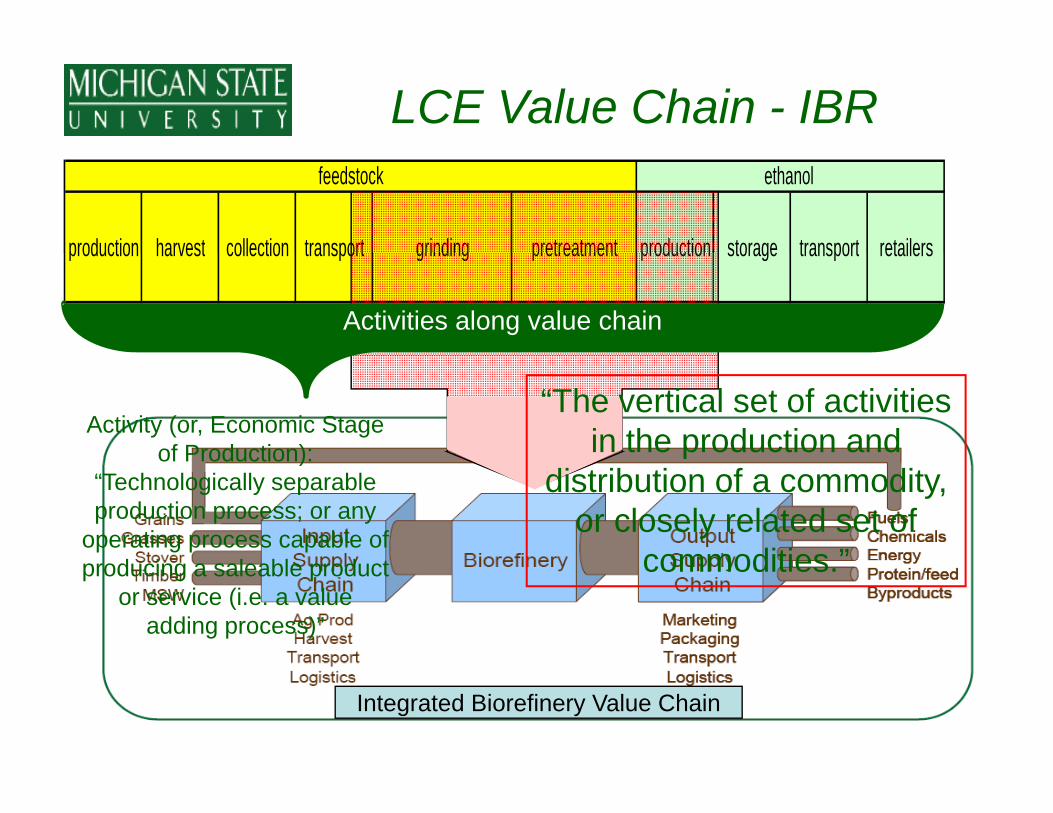
LCE Value Chain - IBR
production harvest collection transport grinding pretreatment production storage transport retailers
feedstock ethanol
production harvest collection transport grinding pretreatment production storage transport retailers
Activities along value chain
Activity (or, Economic Stage of Production):
“The vertical set of activities in the production and of Production):
“Technologically separable production process; or any
operating process capable of d i l bl d t
pdistribution of a commodity,
or closely related set of commodities ”producing a saleable product
or service (i.e. a value adding process)”
commodities.
Integrated Biorefinery Value Chain
Opposing Interests?
• Market Structure Issues– Chicken & egg supply issue– Potential for Asymmetric Market Power
• Sustainable rural development?– Marginal lands excluded– Investment for BR is huge – difficult for Ag producers to participate– Rural benefits will depend largely on local factors, like local control– Feed vs. Fuel
Supply chain logistics are huge• Supply chain logistics are huge– LCB bulky & difficult to transport – Variability in composition– Large # trading partners (5 000 tpd from ~ 1 000 farmers)– Large # trading partners (5,000 tpd from 1,000 farmers)– Chemical / fuels industry has minimal experience with large Ag
system like this– Farmers are more familiar; these exist for grains, not for grasses
Or common solution?Concept: Pre-treat LCB in smaller, geographically
distributed centers, or “Regional Biomass Processing Facilities” to produce fuel & feedFacilities”, to produce fuel & feed
• Market Structure issues addressed – Synergistic / co-operative concept– Integrated supply chain– Diversified markets for supply to BR & for Ag producers
S i bl l d l !• Sustainable rural development!– Marginal lands included– Much lower capital requirements – may be accessible to rural interests
Produces product that can be used as ruminant animal feed– Produces product that can be used as ruminant animal feed– Potential for high value uses – composites, nutra-ceuticals, enzymes, etc.
• Supply chain logistics addressedProduct is concentrated less bulky and more consistent– Product is concentrated, less bulky and more consistent
– Many fewer contracts to manage
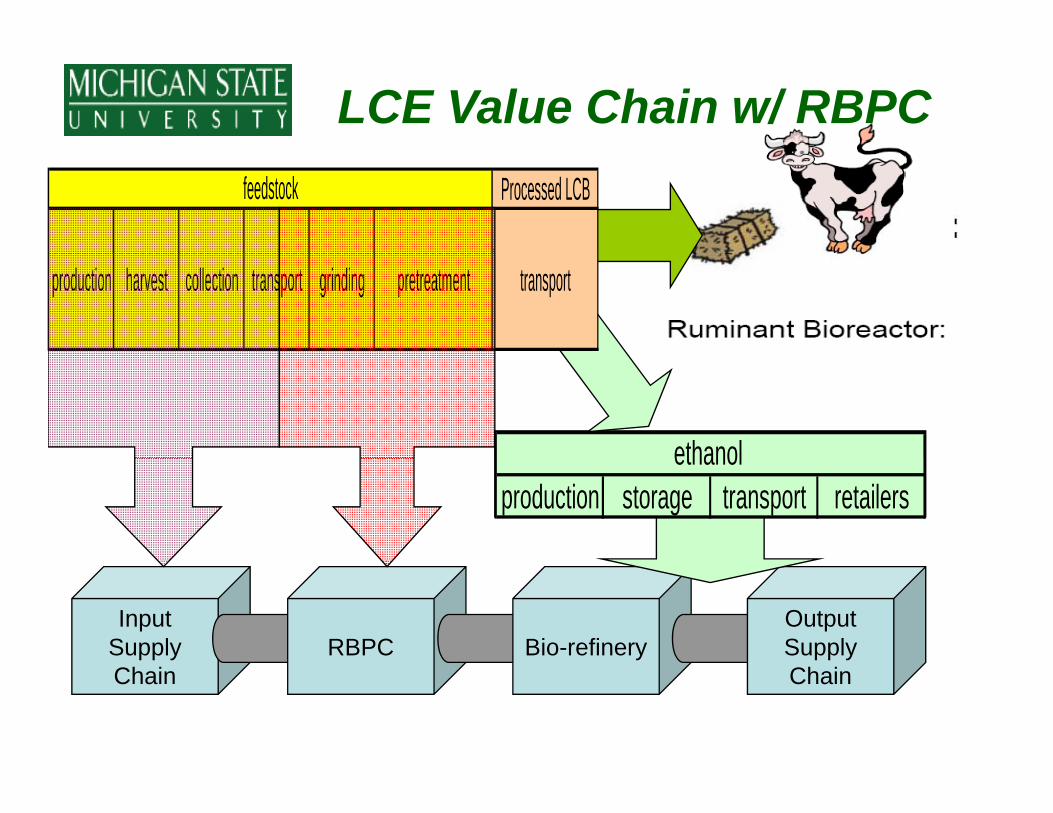
LCE Value Chain w/ RBPCProcessed LCBfeedstock
production harvest collection transport grinding pretreatment transport
ethanolproduction storage transport retailers
ethanol
Input Supply RBPC Bio-refinery
Output Supply
Chain Chain
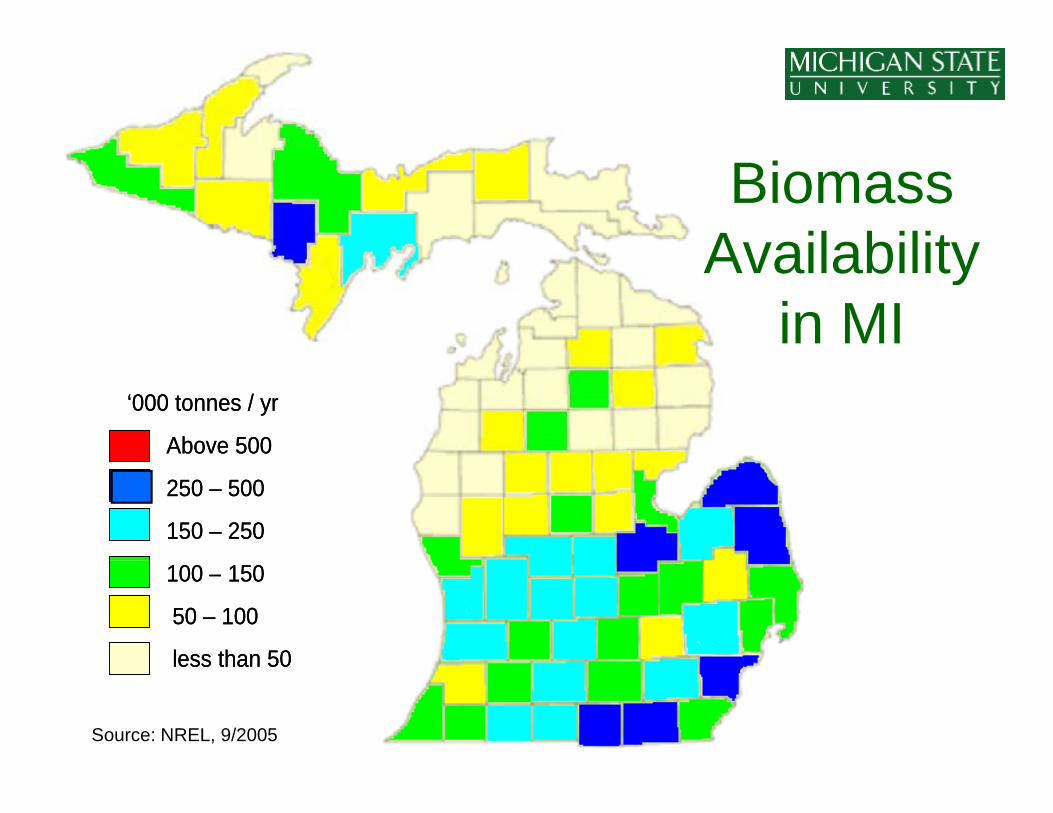
Biomass AvailabilityAvailability
in MI‘000 tonnes / yr
Above 500
‘000 tonnes / yr
Above 500
250 – 500
150 – 250
250 – 500
150 – 250
100 – 150
50 – 100
less than 50
100 – 150
50 – 100
less than 50
Source: NREL, 9/2005
less than 50less than 50
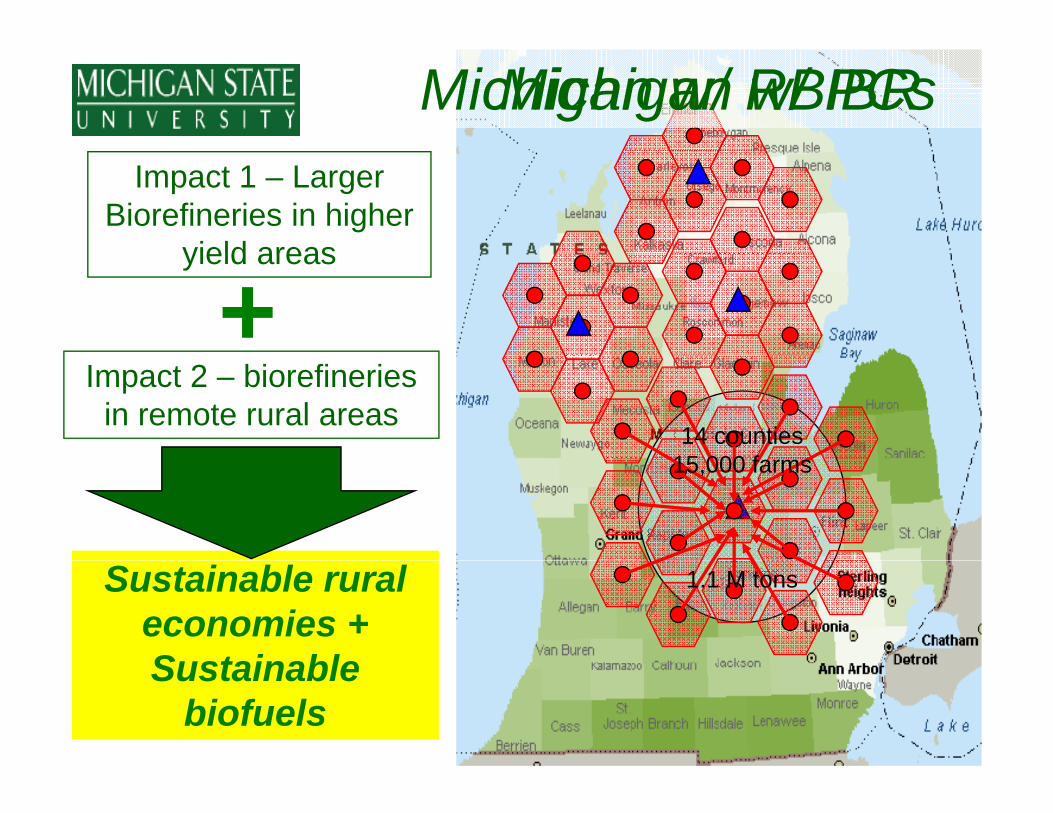
Michigan w/ RBPCsMichigan w/ IBRImpact 1 – Larger
Biorefineries in higher yield areasyield areas
+Impact 2 – biorefineries
in remote rural areas14 counties
15 000 f15,000 farms
Sustainable rural economies + Sustainable
1.1 M tons
Sustainable biofuels
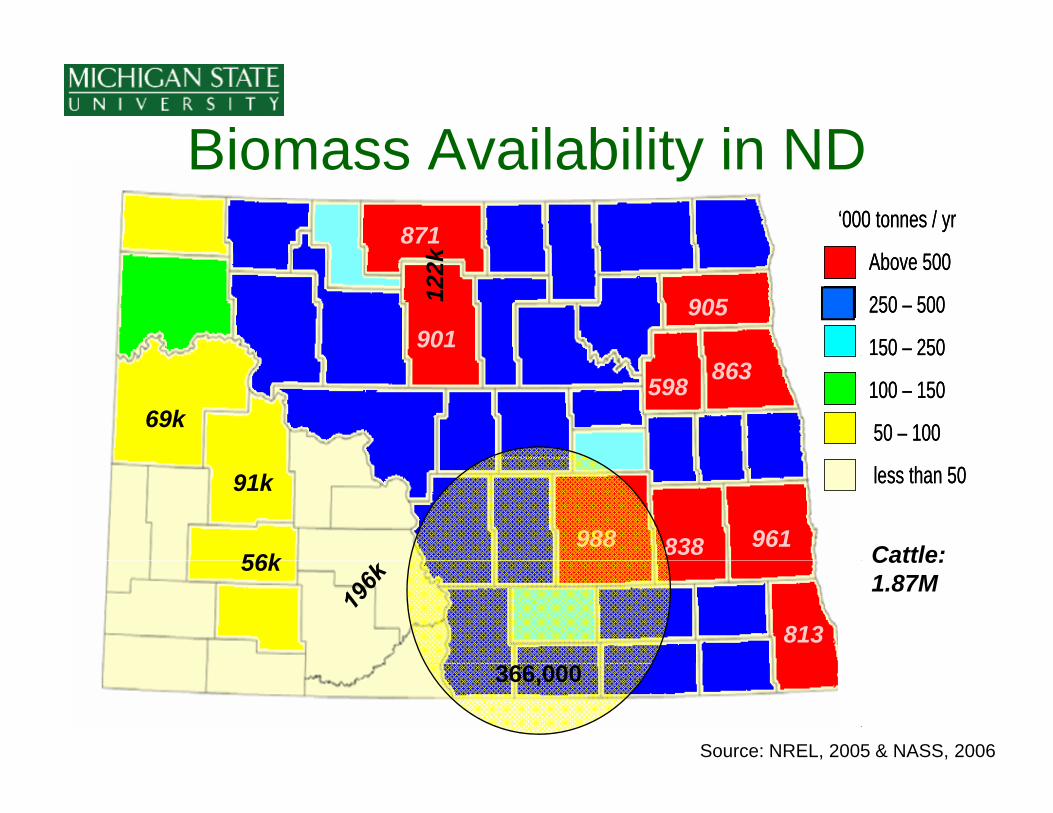
Biomass Availability in ND‘000 tonnes / yr
00
‘000 tonnes / yr
00
Biomass Availability in ND871
k Above 500
250 – 500
150 – 250
Above 500
250 – 500
150 – 25090190512
2k
50 50
100 – 150
50 – 100
50 50
100 – 150
50 – 100
598 863
69k
less than 50less than 50
988 838 961
91k
56k Cattle:
813
56k Cattle: 1.87M
Source: NREL, 2005 & NASS, 2006
366,000
Farmers & LCB
“More than a century of bitter experience has taught farmers that when theyhas taught farmers that when they simply sell a raw crop, they fall ever further behind ”further behind.
D id M i “Th A i P t” A il 2006David Morris “The American Prospect” April 2006