20
“Indian Cement Industry” An overview Presented By Manohar S Annappanavar
“Indian Cement Industry”
An overview
Presented By
Manohar S Annappanavar

Indian Cement Industry -Facts
Companies (Members) (Nos.) 52
Cement Plants (Nos.) 132
Installed Capacity (Mn. t .) 166.73
Cement Production (Mn. t .) 2006-07 155.66Plants with Capacity of Million tonnes and above (Nos.) 76
Manpower Employed (Nos.) Approx. 1,35,000
Large Plants
#Source:CMA

Indian Cement Industry -Facts
Cement Plants (Nos.) Approx. 365
Installed Capacity (Mn. t .) 11.10 (P)
Cement Production (Mn. t .) 2006-07 6.00 (P)
Mini & White Cement Plants

States with No Cement PlantUttaranchalCHANDIGARHARDelhi
Company Plant Location State CapacityACC Lakheri Lakheri RAJ 0.60Birla Corp Birla cement ChittorgarhRAJ 0.72Birla Corp Chanderia Cement ChittorgarhRAJ 1.28Grasim Indus Aditya cement ShambhupuraRAJ 1.75Guj Ambuja Group Rabriyawaas Pali RAJ 1.80JK Cements JK Nambahera Nibahera RAJ 2.80JK Cements JK Mngrol Mangrol RAJ 0.75JK Lakshmi Laksmi cement Sirohi RoadRAJ 2.23JK udaypur JK Udaypur Udyog Udaypur RAJ 0.90Mnglam cement Mangalam cement Morak RAJ 0.40Mnglam cement Neer Shree cement Morak RAJ 0.60Shree cement Shree cement Bewara RAJ 4.50Binani cemnent Binani cemnent Sirohi RoadRAJ 2.20DCM Shriram cements DCM Shriram cements Kota RAJ 0.20
20.73
Company Plant Location State CapacityJ&K ltd J&K ltd Khrew J&K 0.20ACC Gagal-1 Gagal-1 HP 2.00ACC Gagal-ii Gagal-ii HP 2.40CCI Rajban Rajban HP 0.20Guj Ambuja Group Ambuja cement -HP DarlaghatHP 1.16Grasim Indus Grasim Bhatinda * Bhatinda PUB 1.20Guj Ambuja Group Ropar* Ropae PUB 2.50Guj Ambuja Group Bhatinda* Bhatida PUB 0.50
10.16
North

Rajasthan
Capacity in MTPA% ot TOTAL Production (MTPA) % of Total Capacity UtilizationACC 0.60 2.4% 0.89 3.5% 148%Ambuja cement 1.80 7.2% 1.69 6.6% 94%Binani cement 2.20 8.8% 2.76 10.8% 125%Birla Corp Ltd 2.00 8.0% 2.35 9.2% 117%Grasim Industries 2.78 11.1% 3.26 12.8% 117%JK CEMENTS 4.15 16.6% 3.87 15.2% 93%JK LAKSHMI 3.40 13.6% 3.42 13.4% 101%JK udaypur 0.90 3.6% 0.00 0.0% 0%Mangalam cement 1.00 4.0% 1.34 5.3% 134%Shree cement 6.00 24.0% 5.71 22.4% 95%Shriram 0.20 0.8% 0.17 0.6% 83%Grand Total 25.03 100.0% 25.46 100.0% 102%
Details of companies in Rajasthan

Rajasthan
Capacity Production UtilisationACC RAJ 0.60 0.89 148%Ambuja cement RAJ 1.80 1.69 94%Birla Corp Ltd RAJ 0.72 0.74 103%Birla Corp Ltd RAJ 1.28 1.61 126%Grasim Industries RAJ 1.75 2.14 123%Grasim Industries RAJ 1.03 1.12 109%JK CEMENTS RAJ 3.30 2.84 86%JK CEMENTS RAJ 0.75 0.95 126%JK CEMENTS RAJ 0.10 0.08 85%JK LAKSHMI RAJ 3.40 3.42 101%JK udaypur RAJ 0.90 0.00 0%Mangalam cement RAJ 0.40 0.43 108%Mangalam cement RAJ 0.60 0.91 152%Shree cement RAJ 6.00 5.71 95%Binani cement RAJ 2.20 2.76 125%Shriram RAJ 0.20 0.17 83%
Analysis of Top Companies in Rajasthan

Himachal Pradesh
Capacity in MTPA % ot TOTAL Production (MTPA) % of Total Capacity UtilizationACC 4.31 74.1% 0.47 66.8% 11%Ambuja cement 1.32 22.7% 1.07 151.1% 81%CCI Ltd 0.18 3.2% 0.60 85.1% 327%Grand Total 5.81 100.0% 0.71 100.0% 12%
Capacity Production UtilisationACC HP 2.00 1.92 96%ACC HP 2.40 2.38 99%Ambuja cement HP 1.60 1.32 83%CCI Ltd HP 0.20 0.18 92%
Details of companies in Himachal Pradesh
Analysis of Top Companies in Himachal Pradesh

CentralCompany Plant State Annualized CapacityBirla Corp Birla cemetn Raibereli* UP 0.63(JAL) Jaypee-Sadva Khurd** UP 0.60(JAL) Jaypee Ayodhya* UP 1.00(JAL) Churk UP 0.47(JAL) Dalla UP 0.43(JAL) Chunar* UP 1.68Mysore cement Diamond cement-Jhansi* UP 0.50
Company Plant State Annualized CapacityACC Kymore MP 1.7ACC Kymore-Mehgaon MP 0.0Birla Corp Bila Vikas MP 0.8Birla Corp satna cement MP 0.8CCI Neemuch MP 0.4Century Textiles Mahihar cement MP 3.0Grasim Indus Vikram cement MP 3.0(JAL) Jaypee Rewa MP 2.8(JAL) Jaypee Bela MP 2.2Mysore cement Diamond cement-I MP 0.5Mysore cement Diamond cement-II MP 0.5Prism cement Prism cement MP 2.5
18.19

Madhya Pradesh
Capacity in MTPA % ot TOTAL Production (MTPA) % of Total Capacity UtilizationJaprakash assoc 5.00 27.5% 5.51 29.7% 110%Grasim Industries 3.00 16.5% 3.53 19.1% 118%Century Textiles 3.00 16.5% 3.26 17.6% 109%Prism cement 2.51 13.8% 2.19 11.8% 87%ACC 1.70 9.3% 1.78 9.6% 104%Birla Corp Ltd 1.55 8.5% 1.37 7.4% 88%Mysore cement 1.03 5.6% 0.88 4.7% 86%CCI Ltd 0.40 2.2% 0.00 0.0% 0%Grand Total 18.18 100.0% 18.53 100.0% 102%
Details of companies in Madhya Pradesh
Capacity Production UtilisationJaprakash assoc MP 2.80 2.87 102%Japrakash assoc MP 2.20 2.64 120%Grasim Industries MP 3.00 3.53 118%Century Textiles MP 3.00 3.26 109%Prism cement MP 2.51 2.19 87%
ACC MP 1.70 1.77648 104%
Analysis of Top Companies in MP

Uttar Pradesh
Capacity in MTPA % ot TOTAL Production (MTPA) % of Total Capacity UtilizationACC 2.00 27.3% 1.64 41.3% 82%Birla Corp Ltd 0.63 8.6% 0.42 10.6% 66%Japrakash assoc 4.19 57.2% 1.19 29.9% 28%Mysore cement 0.50 6.8% 0.72 18.2% 144%Grand Total 7.32 100.0% 3.96 100.0% 54%
Capacity Production UtilisationACC UP 2.00 1.64 82%Birla Corp Ltd UP 0.63 0.42 66%Japrakash assoc UP 0.60 0.48 80%Japrakash assoc UP 1.00 0.71 71%Japrakash assoc UP 0.47 0.00 0%
Japrakash assoc UP 0.43 0.00 0%Japrakash assoc UP 1.68 0.00 0%Mysore cement UP 0.50 0.72 144%
Details of companies in UP
Analysis of Top Companies in UP

Company Plant State Annualized CapacityKlyanpur cement Klyanpur cement BIHAR 1.00CCI Bokajan ASSAM 0.20Mawmluh Cherra Mawmluh Cherra MEG 0.20ACC Bhargarh cement ORISSA 0.96Ultratech cement JCW* ORISSA 0.80OCL India OCL India ORISSA 1.28Company Plant State Annualized CapacityACC Chaibasa JHK 0.87ACC sindri JHK 0.60Lafarge India(p) ltd Lafarge-Jojobera* JHK 3.00Lemos Cement Lemos Cement JHK 0.11Sone Valley Sone Valley JHK 0.25
Company Plant State Annualized CapacityACC Damodar cement WB 0.53Birla Corp Durgapur* WB 0.60Birla Corp Durgahitech * WB 1.00Guj Ambuja Group Ambuja eastern-WB* WB 1.00Ultratech cement WBCW* WB 1.00Company Plant State Annualized CapacityACC Jamul CTG 1.58CCI Akaltara CTG 0.40CCI Mandhar CTG 0.38Century Textiles Century Cements CTG 1.80Grasim Indus Grasim cement Raipur CTG 2.06Guj Ambuja Group Ambuja eastern -CTG CTG 1.00Lafarge India(p) ltd Arasmetha cement CTG 1.60Lafarge India(p) ltd Lafarge-Sonadih CTG 0.40Ultratech cement HCW CTG 1.60
States with No Cement PlantManipur MIZORAMTRIPURAARUNACHAL PRADESHSIKKIM
East

West Bengal
Capacity in MTPA % ot TOTAL Production (MTPA) % of Total Capacity UtilizationACC 0.525 10.2% 0.47 16.6% 90%Ambuja cement 1.99992 39.0% 1.07 37.5% 53%Birla Corp Ltd 1.59996 31.2% 0.60 21.1% 37%UltraTech 0.99996 19.5% 0.71 24.8% 71%Grand Total 5.12484 100.0% 2.84 100.0% 55%
Capacity Production UtilisationACC WB 0.53 0.47 90%Ambuja cement WB 1.00 1.03 103%Ambuja cement WB 1.00 0.03 3%Birla Corp Ltd WB 0.60 0.51 85%Birla Corp Ltd WB 1.00 0.09 9%
UltraTech WB 1.00 0.71 71%
Details of companies in West Bengal
Analysis of Top Companies in West Bengal
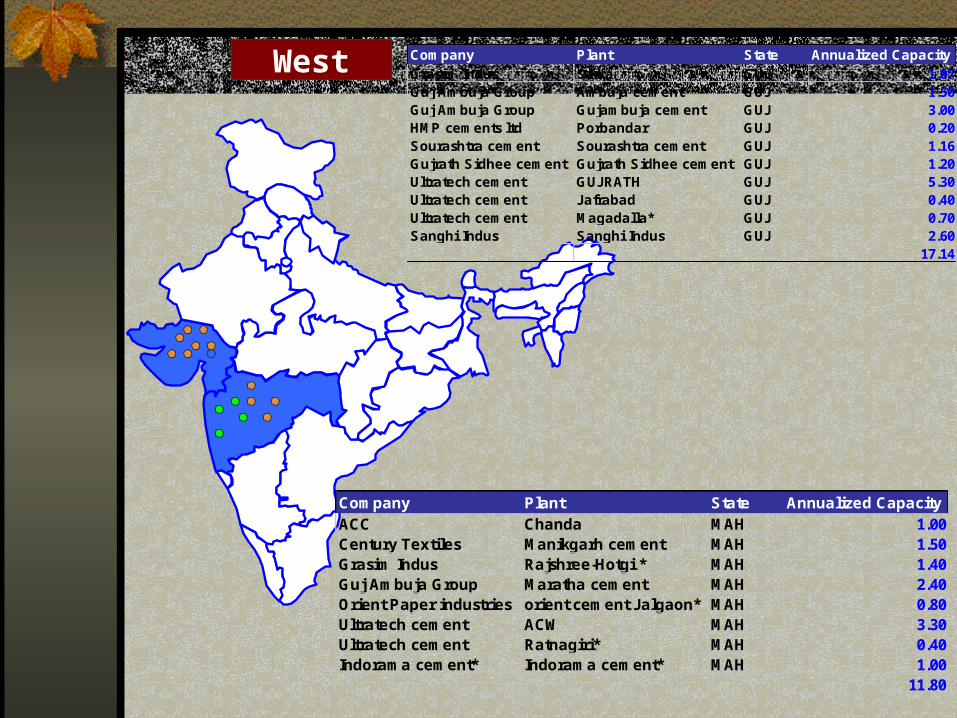
Company Plant State Annualized CapacityGrasim Indus Sikka GUJ 1.07Guj Ambuja Group Ambuja cement GUJ 1.50Guj Ambuja Group Gujambuja cement GUJ 3.00HMP cements ltd Porbandar GUJ 0.20Sourashtra cement Sourashtra cement GUJ 1.16Gujrath Sidhee cement Gujrath Sidhee cement GUJ 1.20Ultratech cement GUJRATH GUJ 5.30Ultratech cement Jafrabad GUJ 0.40Ultratech cement Magadalla* GUJ 0.70Sanghi Indus Sanghi Indus GUJ 2.60
17.14
Company Plant State Annualized CapacityACC Chanda MAH 1.00Century Textiles Manikgarh cement MAH 1.50Grasim Indus Rajshree-Hotgi * MAH 1.40Guj Ambuja Group Maratha cement MAH 2.40Orient Paper industries orient cement Jalgaon* MAH 0.80Ultratech cement ACW MAH 3.30Ultratech cement Ratnagiri* MAH 0.40Indorama cement* Indorama cement* MAH 1.00
11.80
West

Maharashtra
Capacity in MTPA % ot TOTAL Production (MTPA) % of Total Capacity UtilizationUltraTech 3.70 31.4% 3.40 27.7% 92%Ambuja cement 2.40 20.3% 3.16 25.7% 132%Grasim Industries 1.40 11.9% 1.77 14.4% 126%Century Textiles 1.50 12.7% 1.23 10.0% 82%ACC 1.00 8.5% 1.10 8.9% 110%Orient Paper 0.80 6.8% 1.01 8.2% 126%Indo rama 1.00 8.5% 0.61 5.0% 61%Grand Total 11.80 100.0% 12.28 100.0% 104%
Details of companies in MAHARASHTRA
Capacity Production UtilisationUltraTech MAH 3.30 3.0372 92%UltraTech MAH 0.40 0.3636 91%Ambuja cement MAH 2.40 3.15984 132%Grasim Industries MAH 1.40 1.77012 126%Century Textiles MAH 1.50 1.23324 82%
ACC MAH 1.00 1.09788 110%
Analysis of Top Companies in MAHARASHTRA

South
Company Plant Location State Annualised CapacityACC Mancherial Mancherial APAndhra cements Vijaywada AP 0.24Andhra cements Vizag AP 0.50004Andhra cements Nadikude Durga AP 0.99996CCI Adilabad Adilabad AP 0.39996CCI Tandur Tandur AP 0.99996India Cements Chailamkur works Chilamkur AP 1.29996India Cements Visaka cement Tandur AP 1.11996India Cements Yerranguntla Yerranguntla AP 0.51996India Cements Raasi cement Wadapally AP 2.30004Kesoram Industries Keoram cement Ramagundam AP 0.9Madras cements Jayantipuram Jaggayyapeth AP 1.59996Orient Paper industries Orient cement Devapur AP 1.59996Penna cement Penna- Thadipatri I&II Thadipatri AP 1.5Penna cement Penna-Ganeshpada Ganeshpahad AP 0.99996Ultratech cement APCW Tadpatri AP 2.30004Zuari Cement Zuari cement-krishna nagar Krishnanagar AP 2.19996Zuari Cement Sitapuram Sitapuram AP 1.2Kistna Kistna Kistna AP 0.21396KCP ltd KCP ltd Macheria AP 0.57504Panyam cement Panyam cement Bugganipalle AP 0.531Rain Indus Ltd Rain Indus Ltd Ramapuram AP 0.99996My Home Indus My Home Indus Mellacheruvu AP 1.56

Company Plant Location State Annualised CapacityACC Wadi Wadi KAR 2.10996ACC Wadi-New Wadi-New KAR 2.60004CCI Kurkunta Kurkunta KAR 0.20004Grasim Indus Rajashree-Mlkhede Malkhede KAR 2.60004HMP cements ltd Shahabad Shahabad KAR 0.47604Kesoram Industries Vasavadatta cement Sedam KAR 2.00004Mysore cement Mysore cement Ammasandra KAR 0.57Bagalkot Udyog Ltd Bagalkot Udyog Ltd Bagalkot KAR 0.33Company Plant Location State Annualised CapacityACC Madukkarai Madukkarai TN 0.96Chettinad cement Chettinad Karur karur TN 0.6Chettinad cement chettinad karikkali karikkali TN 1.2Grasim Indus Grasim-south Reddipalayam TN 1.02996India Cements Shankarnagar Taliyur TN 1.55004India Cements Sankaridurg SankariDurg TN 0.72India Cements Dalavoi Trichy TN 1.29996Madras cements Ramasamya raj Nagar R. S. Nagar TN 0.75Madras cements Alathiyur works-I Alathiyur TN 1.35996Madras cements Alathiyur works-II Alathiyur TN 1.76004Tamilnadu cement Alangulam Alangulam TN 0.39996Tamilnadu cement Ariyalur Ariyalur TN 0.50004Ultratech cement ARCW* Arakonam TN 1.2Dalmia cement Dalmia cement Dalmiapuram TN 3.50004Company Plant Location State Annualised CapacityMalabar Cement Malabar cements Palghat KERALA 0.42Malabar Cement Malabar cements* Alappuzha KERALA 0.20004

Andhra Pradesh
Capacity in MTPA% ot TOTAL Production (MTPA) % of Total Capacity UtilizationIndia Cements Ltd 5.24 19.9% 5.28 23.1% 101%Zuari Cements Ltd 3.40 12.9% 3.02 13.3% 89%Penna cement 2.50 9.5% 2.77 12.1% 111%Myhomes ltd 2.76 10.5% 2.43 10.7% 88%UltraTech 2.30 8.7% 1.90 8.3% 83%Orient Paper 1.60 6.1% 1.52 6.7% 95%Rain Industries ltd 1.50 5.7% 1.28 5.6% 85%Madras cements lts 1.60 6.1% 1.24 5.4% 77%Andhra Cement 1.74 6.6% 0.98 4.3% 56%Kesoram Industries 0.90 3.4% 0.97 4.3% 108%KCP LTD 0.66 2.5% 0.63 2.8% 95%Panyam Cem 0.53 2.0% 0.42 1.8% 78%CCI Ltd 1.40 5.3% 0.37 1.6% 27%Kistna 0.21 0.8% 0.00 0.0% 0%Grand Total 26.34 100.0% 22.81 100.0% 87%
Details of companies in Andhra Pradesh
Capacity Production UtilisationIndia Cements Ltd AP 1.30 1.33 102%India Cements Ltd AP 1.12 1.10 99%India Cements Ltd AP 0.52 0.44 85%India Cements Ltd AP 2.30 2.40 104%Zuari Cements Ltd AP 2.20 1.85 84%Zuari Cements Ltd AP 1.20 1.17 98%Penna cement AP 1.50 1.67 111%Penna cement AP 1.00 1.10 110%Myhomes ltd AP 2.76 2.43 88%UltraTech AP 2.30 1.90 83%
Analysis of Top Companies in Andhra Pradesh
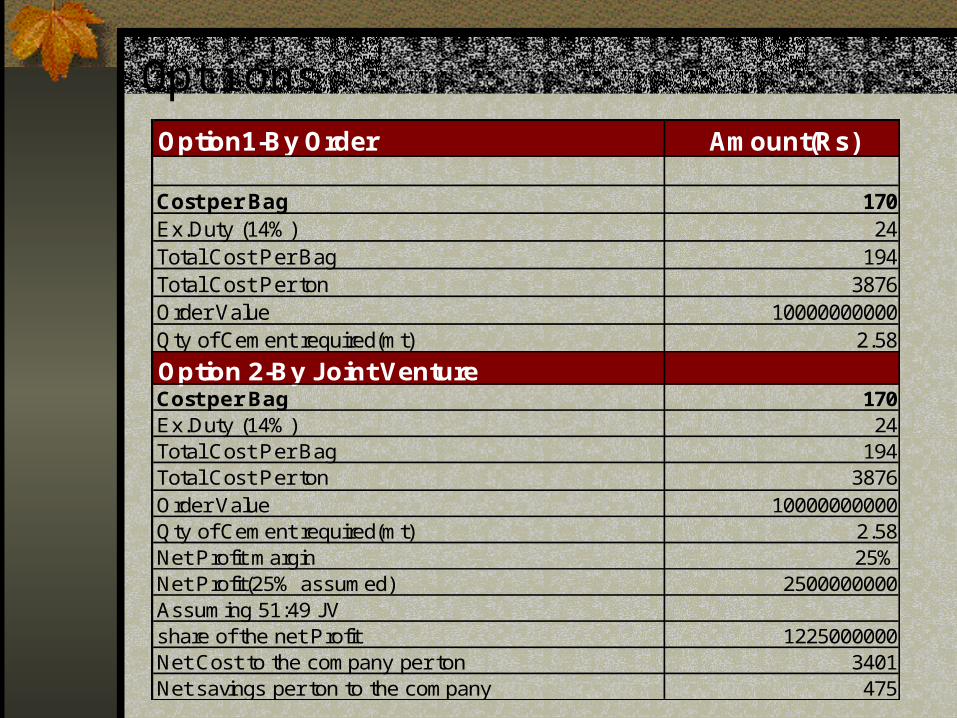
OptionsOption1-By Order Amount(Rs)
Cost per Bag 170Ex.Duty (14%) 24Total Cost Per Bag 194Total Cost Per ton 3876Order Value 10000000000Qty of Cement required(mt) 2.58
Option 2-By Joint VentureCost per Bag 170Ex.Duty (14%) 24Total Cost Per Bag 194Total Cost Per ton 3876Order Value 10000000000Qty of Cement required(mt) 2.58Net Profit margin 25%Net Profit(25% assumed) 2500000000Assuming 51:49 JVshare of the net Profit 1225000000Net Cost to the company per ton 3401Net savings per ton to the company 475

Sensitivity Table
188 190 192 194 196 198 200 202 20413.00% 239 242 244 247 249 252 255 257 26015.00% 276 279 282 285 288 291 294 297 30017.00% 313 316 320 323 326 330 333 336 34019.00% 350 353 357 361 365 368 372 376 37921.00% 386 391 395 399 403 407 411 415 41923.00% 423 428 432 437 441 446 450 455 45925.00% 460 465 470 475 480 485 490 494 499
27.00% 497 502 508 513 518 523 529 534 539
29.00% 534 539 545 551 556 562 568 574 57931.00% 571 577 583 589 595 601 607 613 61933.00% 607 614 620 627 633 640 646 653 65935.00% 644 651 658 665 672 678 685 692 699

Thank you


