58
CEMENTATION FACTOR AND CARBONATE FORMATION PROPERTIES CORRELATION FROM WELL LOGS DATA FOR NASIRIYA FIELD FADHIL SARHAN KADHIM UNIVERSITI TEKNOLOGI MALAYSIA

CEMENTATION FACTOR AND CARBONATE FORMATION PROPERTIES
CORRELATION FROM WELL LOGS DATA FOR NASIRIYA FIELD
FADHIL SARHAN KADHIM
UNIVERSITI TEKNOLOGI MALAYSIA
i
CEMENTATION FACTOR AND CARBONATE FORMATION PROPERTIES
CORRELATION FROM WELL LOGS DATA FOR NASIRIYA FIELD
FADHIL SARHAN KADHIM
A thesis submitted in fulfilment of the
requirements for the award of the degree of
Doctorate of Philosophy (Petroleum Engineering)
Faculty of Chemical and Energy Engineering
Universiti Teknologi Malaysia
APRIL 2016

iii
DEDICATION
To almighty Allah (SWT), for the favours granted me throughout the course of my
studies
And to my parents, for their blessing, and my dearest wife, for her patience and
endurance for supporting me from the beginning to the end of my stud

iv
ACKNOWLEDGEMENT
First of all, I wish to express my sincere gratitude to my supervisor Prof. Dr.
Ariffin Samsuri and co-supervisor Prof. Dr. Ahmad Kamal Idris for their guidance
and assistance without that this research would have been impossible, and all their
intellectual support and constructive advices during of my Ph.D. research, and all
the staff of Department of Petroleum Engineering.
I would like to thank the Ministry of Higher Education and Scientific
Research, Iraq for providing a scholarship to carry out this study. Also I would like
to thank Iraqi south oil company to provide data, and express my deepest
appreciation to my friends Mr. Yousif Kalaf, Mr. Haider Alwan, Mr. Raad Hameed,
Dr. Adel Mustafa, Mr. Esam Abdul Ameer and all friends who helped and
supported me to complete this study.
Special thanks to my parents for their prayers, selfless, undemanding love
and constant motivations support. I have to admit, I couldn't do this work without
the patience, endurance and assistance of my dearest wife and my heartiest thanks to
my lovely children. My appreciation goes to my brother Haider for his co-operation
during my study.
.

v
ABSTRACT
The cementation factor has specific effects on petrophysical and elastic
properties of porous media. A comprehensive investigation of carbonate rock
properties which have an interlock with the cementation factor was done through
core analysis and well log data. Five wells in Nasiriya oilfield, which is one of the
giant fields consists of the carbonate reservoirs in the Middle East were used in this
study. The study was made across the Mishrif and Yamamma carbonate formations
in the Nasiriya oilfield. Neurolog software (V5, 2008) was used to digitize the
scanned copies of available logs while Interactive Petrophysics software (IP V3.5,
2008) was used to determine the properties of studied formations. The average
cementation factor values were calculated from the F-PHI plot and Gomez methods
and compared with Pickett method. Petrophysical and dynamic elastic properties
were determined from well logs. In this study, a new approach was introduced to
obtain correlations of cementation factor to petrophysical and dynamic elastic
properties of Mishrif and Yamamma formations. An artificial neural network
platform was used to determine these correlations depending on the determined
properties of studied formations. The neural network model used two different
training algorithms; Gradient Descent with Momentum and Levenberg–Marquardt.
Results show that the plot of average core data and calculated data from IP software
of porosity and permeability gave a good correlations coefficient of R2
= 0.86034 to
0.94303. Generally, cementation factor values obtained from all methods are found
to be less than two. In addition, cementation factor values also increased with
increasing depth of the studied formations. An efficient performance and excellent
prediction of cementation factor have been obtained with less than 10-4
and 10-8
mean square error from both artificial neural network models. Three saturation
models were used to estimate water saturation of carbonate formations, which are
simple Archie equation, dual water model and Indonesian model. The Indonesian
water saturation model recorded the lowest percentage error in comparison with
water saturation of core samples, and the water saturation in Yamamma formation
was higher than in the Mishrif formation. The accurate determination of a
cementation factor gives reliable saturation results.
vi
ABSTRAK
Faktor penyimenan mempunyai kesan yang spesifik terhadap sifat-sifat
petrofizik dan sifat-sifat keanjalan media berliang. Kajian menyeluruh terhadap
sifat-sifat batuan karbonat yang saling mengunci dengan faktor penyimenan telah
dilaksana menggunakan data analisis teras dan log telaga. Lima buah telaga di
medan minyak Nasiriya, yang merupakan satu daripada medan gergasi yang terdiri
daripada reservoir karbonat di Timur Tengah telah digunakan dalam kajian ini.
Kajian dilakukan merentasi formasi karbonat Mishrif dan formasi karbonat
Yamamma di medan minyak terbabit. Perisian Neurolog (V5, 2008) telah diguna
untuk mendigitkan salinan log. Perisian Petrofizik Interaktif (IP V3.5, 2008) pula
diguna untuk menentukan sifat-sifat formasi yang dikaji. Purata nilai faktor
penyimenan dikira daripada plot F-PHI dan kaedah Gomez, dan seterusnya
dibandingkan dengan kaedah Pickett. Sifat-sifat petrofizik dan sifat-sifat keanjalan
dinamik ditentukan daripada log telaga. Dalam kajian ini, suatu pendekatan baharu
telah diperkenalkan untuk memperoleh korelasi antara faktor penyimenan dengan
sifat-sifat petrofizik dan sifat-sifat keanjalan dinamik formasi Mishrif dan formasi
Yamamma. Suatu platform rangkaian neural tiruan diguna untuk menentukan
korelasi ini yang bergantung kepada sifat-sifat formasi kajian yang dikaji. Model
rangkaian neural terbabit menggunakan dua algoritma latihan yang berbeza; Turun
Cerun dengan Momentum dan Levenberg-Marquardt. Hasil kajian menunjukkan
bahawa plot data purata keliangan dan kebolehtelapan teras dan data keliangan dan
kebolehtelapan yang dikira daripada perisian IP menghasilkan pekali korelasi yang
baik, iaitu R2
= 0.86034-0.94303. Nilai faktor penyimenan yang diperoleh daripada
semua kaedah adalah kurang daripada dua. Nilai ini meningkat dengan
bertambahnya kedalaman formasi yang dikaji. Prestasi yang efisien dengan ramalan
faktor penyimenan yang baik berjaya diperoleh daripada kedua-dua model rangkaian
neural tiruan, dengan masing-masing ralat min kuasa dua adalah kurang daripada
10-4
dan 10-8
. Tiga model ketepuan digunakan untuk menganggar ketepuan air dalam
formasi karbonat, iaitu persamaan ringkas Archie, model air duaan, dan model
Indonesia. Model Indonesia mencatatkan peratusan ralat yang paling rendah
berbanding dengan ketepuan air daripada sampel teras, dengan ketepuan air dalam
formasi Yamamma adalah lebih tinggi daripada formasi Mishrif. Penentuan faktor
penyimenan yang jitu boleh menghasilkan ketepuan yang tepat.

vii
TABLE OF CONTENT
CHAPTER TITLE PAGE
DECLARATION ii
DEDICATION iii
ACKNOWLEDGEMENT iv
ABSTRACT v
ABSTRAK vi
TABLE OF CONTENT vii
LIST OF TABLES xii
LIST OF FIGURES xv
LIST OF SYMBOLS xxiii
LIST OF ABBREVIATIONS xxvii
APPENDICES xxx
1 INTRODUCTION 1
1.1 Problem Statement 4
1.2 Objectives of Study 5
1.3 Scope of Study 5
1.4 Significance and Contributions of the Study 6
1.5 Area of Case Study 7
1.6 Thesis Outlines 11

viii
2 LITERATURE REVIEW AND PREVIOUS STUDIES 12
2.1 Cementation Factor 12
2.1.1 Definition of Cementation Factor 14
2.1.2 Factors EffectingCementation Factor 15
2.1.3 Cementation Factor Magnitudes 16
2.1.4 Cementation Factor Calculation 17
2.1.4.1 F-PHI Plot Method 17
2.1.4.2 Pickett Method 18
2.1.4.3 PHIEEPT Method 19
2.1.4.4 Level by Level Method 22
2.2 Archie Equation Parameters 24
2.2.1 Porosity Exponent 24
2.2.2 Saturation Exponent 26
2.2.3 Tortuosity Exponent 27
2.3 Petrophysical Properties of Carbonate Reservoirs
Rock
27
2.3.1 Carbonate Reservoir Porosity 28
2.3.2 Lithology 31
2.3.3 Resistivity 35
2.3.4 Clay Volume 37
2.3.4.1 Single Clay Indicator 38
2.3.4.2 Double Clay Indicator 40
2.3.5 Water Saturation 42
2.3.5.1 Resistivity Models 43
2.3.5.2 Conductivity Models 44
2.3.6 Permeability 46
2.4 Dynamic Elastic Rock Properties 51
2.4.1 Poisson’s Ratio 53
2.4.2 Bulk Modulus 54
ix
2.4.3 Young’s Modulus 55
2.4.4 Biot’s Constant 56
2.5 Artificial Neural Network 57
2.5.1 Neuron Models 59
2.5.2 Neural Network Architectures 61
2.5.2.1 Single-Layer Feed Forword
Networks
62
2.5.2.2 Multilayer Feed Forward Neural
Networks
63
2.5.3 Learning Processes 65
2.5.4 Back Propagation Error 66
2.5.5 Back Propagation Algorithm 64
2.5.6 Strengths and Limitations of Backpropagation 68
2.6 Previous Studies 69
2.6.1 Cementation Factor Relations With Resistivity
Formation Factor and Porosity
69
2.6.2 Cementation Factor Relations With
Permeability
76
2.6.3 Cementation Factor Relations With Dynamic
Elastic Properties
81
2.7 Summary 82
3 METHODOLOGY 84
3.1 Introduction 84
3.2 Field and Wells Selection 86
3.3 Digitization Logging Data 87
3.4 Depth Matching 88
3.5 Environmental Corrections
90

x
3.6 Determination of Petrophysical Carbonate Rock
Properties
91
3.7 Calculation of Cementation Factor 94
3.8 Determination of Elastic Carbonate Rock Properties 96
3.9 ANN Modelling for Correlation Determination 97
3.10 Calculation of Water Saturation 102
3.11 Summary 103
4 RESULTS AND DISCUSSION 105
4.1 Validation of Digitalized Well Logs Data 105
4.2 Environmental Correction 110
4.3 Petrophysical Properties 113
4.3.1 Lithology 113
4.3.1.1 Sonic and Neutron Logs
Cross-plot
113
4.3.1.2 Density and Neutron Cross-
plot
115
4.3.1.3 Ternary Porosity Mode 117
4.3.2 Porosity 118
4.3.3 Resistivity 123
4.3.4 Clay Volume 125
4.3.5 Permeability 128
4.4 Cementation Factor 131
4.4.1 Pickett Method 131
4.4.2 Gomes and F-PHI Plot Methods 133
4.5 Dynamic Elastic Properties 136
4.6 Artificial Neural Network Model 139
4.6.1 Architecture of Neural Model 140

xi
4.6.2 Training the ANN Model 141
4.6.3 Post Training Analysis 144
4.6.4 Cementation Factor Correlation 146
4.6.4.1 Cementation Factor Correlation Based on
Petrophysical Properties
146
4.6.4.2 Cementation Factor Correlation Based on
Dynamic Elastic Properties
150
4.7 Water Saturation 154
5 CONCLUSIONS AND RECOMMENDATIONS 157
5.1 Conclusions 157
5.2 Recommendations 158
REFERENCES 162
Appendices: A-S 179-240

xii
LIST OF TABLES
TABLE NO. TITLE PAGE
1.1 Lithological column from Kifil to Sulaiy formations in the
NS-3
9
2.1 The cementation factor effects on water saturation 16
2.2 Relative dielectric constant and propagation time for
common minerals and fluid
20
2.3 Values of Archie’s cementation parameter 25
2.4 Common values for Poisson’s ratio 54
2.5 Common correlations between cementation factor and
porosity
75
2.6 Major correlations between cementation factor and
permeability
80
3.1 Top, bottom and thickness of Mishrif and Yamamma
carbonates formation
89
4.1 Correlation coefficient and standard errors of correlations
between digitalized and log reading data
109
4.2 Core-log average porosity comparison results 121
4.3 Rw and Rmf results from Rwa and Rmfa respectively 125
4.4 Clay volume results from different methods 127
4.5 Comparison of average permeability results from Timur
model, and Schlumberger model
130
4.6 Comparison between cementation factor results from
different methods
135
4.7 Dynamic elastic properties results
138
xiii
4.8 Weights and bias between input layer and first hidden layer
for petrophysical model
147
4.9 Weights and bias between the first and the second hidden
layer for petrophysical model
148
4.10 Weights and bias between the second hidden layer and
output layer for petrophysical model
149
4.11 Cementation factor results from core analysis, Pickett, and
Gomes method
150
4.12 Weights and bias between input layer and first hidden layer
for dynamic elastic model
151
4.13 Weights and bias between the first and the second hidden
layer for dynamic elastic model
152
4.14 Weights and bias between the second hidden layer and
output layer for dynamic elastic model
152
4.15 Comparison of cementation factor values from calculated
Pickett method and the ANN model for dynamic elastic
properties
153
4.16 Comparison of cementation factor results from all
calculated methods and ANN models.
154
4.17 Comparison of average water saturation results from core
samples, Dual water, Archie, and Indonesian models
156
4.18 Comparison of coefficient and standard error for average
water saturation results from core samples, Dual water,
Archie, and Indonesian models
158
A-1 Samples of Digitalized Data from Well Logs -Mishrif
Formation (NS-1)
179
A-2 Samples of Digitalized Data from Well Logs - Yamamma
Formation (NS-1)
180
A-3 Samples of Digitalized Data from Well Logs - Mishrif
Formation (NS-2)
181
A-4 Samples of Digitalized Data from Well Logs - Yamamma
Formation (NS-2)
182

xiv
A-5 Samples of Digitalized Data from Well Logs - Mishrif
Formation (NS-3)
183
A-6 Samples of Digitalized Data from Well Logs - Yamamma
Formation (NS-3)
184
A-7 Samples of Digitalized Data from Well Logs - Mishrif
Formation (NS-4)
185
A-8 Samples of Digitalized Data of Well Logs - Yamamma
Formation (NS-4)
186
A-9 Samples of Digitalized Data of Well Log-Mishrif
Formation(NS-5)
187
A-10 Samples of Digitalized Data from Well Logs - Yamamma
Formation (NS-5)
188
B-1 Validation of digitalized input data of sonic and gamma ray
logs
189
B-2 Validation of digitalized input data of resistivity logs 190
B-3 Validation of digitalized input data of bulk density and
neutron logs
190
E-1 Sample of calculations results of PHICPI 201
G-1 Sample of formation water resistivity from SP log 205
G-2 Sample of Rwa and Rmfa results 206
I-1 Sample of VCL-SP, VCL-GR, and VCL-R calculations 212
I-2 Sample of VCL-N, VCL-SD, and VCL-ND calculations 212
K-1 Sample of calculation results of KCPI 215
N-1 Sample of cementation factor calculation using Gomez
method
226
N-2 Sample of cementation factor calculation using PHI-F
method
226
P-1 Sample of calculation results of dynamic elastic properties 232
R-1 Sample of water saturation results using Archie’s equation 237
R-2 Sample of water saturation results using Indonesian Model 238
R-3 Sample of water saturation results using Dual Water Model 239

xv
LIST OF FIGURES
FIGURE NO. TITLE PAGE
1.1 Satellite images of NS oil field location 8
1.2 Location map of the studied wells 8
1.3 Stratigraphy of NS oil field formations 10
2.1 Fundamental composition of sedimentary rocks 14
2.2 Classification of carbonates by texture 28
2.3 Sonic-Neutron lithology determinations 33
2.4 Density-Neutron Lithology determination 34
2.5 M-N plot for several minerals 35
2.6 Tornado chart used to correct deep induction resistivity
to true resistivity
36
2.7 Neutron–density cross-plot 41
2.8 Typical Horner pressure build-up plot 48
2.9 Nonlinear model of a neuron 59
2.10 Activation functions 61
2.11 Single-layer feed forward networks 63
2.12 Multilayer feed forward networks 64
2.13 Effect of overburden pressure on formation factor 75
3.1 The study methodology flow diagram 85
3.2 3-D image of the selected wells 86
3.3 The main page of NL software 88
3.4 Depth matching steps in the IP software 89

xvi
3.5 Example of environmental correction in the IP software 87
3.6 Example for the petrophysical properties output results in
the IP
91
3.7 Rw and Rmf calculation flow chart from SP. 93
3.8 Gomez iteration flow chart 95
3.9 Example for the dynamic elastic properties output in the
IP software
96
3.10 The best structure selection strategy 98
3.11 Steps of neural network model building 100
3.12 GUI topredict cementation factor from input
petrophysical properties
101
3.13 GUI topredict cementation factor from input dynamic
elastic properties
101
3.14 The Page of porosity and water saturation models
analysis
102
3.15 Example for water saturation output results in the IP 103
4.1 Correlation between digitalized and log reading data of
DT log
106
4.2 Correlation between digitalized and log reading data of
GR log
107
4.3 Correlation between digitalized and log reading data of
ILD log
107
4.4 Correlation between digitalized and log reading data of
MSFL log
108
4.5 Correlation between digitalized and log reading data of
RHOB log
108
4.6 Correlation between digitalized and log reading data of
NPHI log
109
4.7 NS-3 well schematic 111
4.8 Environmental corrections results of gamma ray,
porosity and resistivity logs for Mishrif formation (NS-3)
112
xvii
4.9 Environmental correction results of gamma ray, porosity
and resistivity logs for Yamamma formation (NS-3)
112
4.10 DT vs. NPHI lithology cross plot for Mishrif formation 114
4.11 DT vs. NPHI lithology cross plot for Yamamma
formation
115
4.12 RHOB vs. NPHI lithology cross-plot for Mishrif
formation
116
4.13 RHOB vs. NPHI lithology cross-plot for Yammama
formation
116
4.14 M vs. N lithology cross plot for Mishrif formation 117
4.15 M vs. N lithology cross plot for Yammama formation 118
4.16 Results of porosity for Mishrif formation (NS-3) 119
4.17 Results of porosity for Yamamma formation (NS-3) 119
4.18 Average PHIE-CPI and PHI-Core relationship for Mishrif
formation
122
4.19 Average PHIE-CPI and PHI-Core relationship for
Yamamma formation
122
4.20 Rt,Rxo, Rwa, and Rmfa results for Mishrif formation (NS-3) 123
4.21 Rt, Rxo, Rwa, and Rmfa results for Yamamma formation
(NS-3)
124
4.22 Results of clay volume for Mishrif formation (NS-3) 126
4.23 Results of clay volume for Yamamma formation (NS-3) 126
4.24 Permeability results of Schlumberger and Timur models
for Mishrif and Yamamma formations (NS-3)
129
4.25 An average calculated (K-CPI)and average observed
(K-Core) relationship for Mishrif formation
130
4.26 An average calculated (K-CPI)and average observed
(K-Core) relationship for Yamamma formation
131
4.27 a, m values by Pickett method for Mishrif formation
(NS-3)
132
4.28 a, m values by Pickett method for Yamamma formation
(NS-3)
133

xviii
4.29 Cementation factor and resistivity formation factor
results for Mishrif formation (NS-3)
134
4.30 Cementation factor and resistivity formation factor
results for Yamamma formation (NS-3)
134
4.31 Dynamic elastic properties results of Mishrif Formation
(NS-3)
137
4.32 Dynamic elastic properties results of Yamamma
Formation (NS-3)
137
4.33 Relationship between average Vp and average Vsfor
Mishrif formation
138
4.34 Relationship between average Vp and average Vs for
Yamamma formation
139
4.35 The ANN structure for petrophysical model 140
4.36 The ANN structure for dynamic elastic model 141
4.37 Training session for petrophysics model 142
4.38 Training session for dynamic elastic model 143
4.39 Best linear fit of tensile strength in training set for
petrophysical model
143
4.40 Best linear fit of tensile strength in training set for
dynamic elastic properties model
144
4.41 The actual and predicted cementation factor from
petrophysical properties
145
4.42 The actual and predicted cementation factor from
dynamic elastic properties
145
4.43 The structure of the first hidden layer 147
4.44 The structure of the second hidden layer 148
4.45 The structure of the output layer 149
4.46 Water saturation results from Dual water, Archie and
Indonesian models for Mishrif formation (NS-3)
155
4.47 Water saturation results from Dual water, Archie and
Indonesian models for Yamamma formation (NS-3)
156
xix
4.48 Correlation coefficient and standard error between core
saturation and Archie model saturation
157
4.49 Correlation coefficient and standard error between core
saturation and Dual water model saturation
157
4.50 Correlation coefficient and standard error between core
saturation and Indonesian model saturation
158
C-1 Environmental corrections of gamma ray, resistivity and
neutron porosity logs for Mishrif formation (NS-1)
191
C-2
Environmental corrections of gamma ray, resistivity and
neutron porosity logs for Yamamma formation (NS-1)
192
C-3
Environmental corrections of gamma ray, resistivity and
neutron porosity logs for Mishrif formation (NS-2)
192
C-4 Environmental corrections of gamma ray, resistivity and
neutron porosity logs for Yamamma formation (NS-2)
193
C-5 Environmental corrections of gamma ray, resistivity and
neutron porosity logs for Mishrif formation (NS-4)
193
C-6 Environmental corrections of gamma ray, resistivity and
neutron porosity logs for Yamamma formation (NS-4)
194
C-7 Environmental corrections of gamma ray, resistivity and
neutron porosity logs for Mishrif formation (NS-5)
194
C-8 Environmental corrections of gamma ray, resistivity and
neutron porosity logs for Yamamma formation (NS-5)
195
D-1 Porosity results for Mishrif formation (NS-1) 196
D-2 Porosity results for Yamamma formation (NS-1) 197
D-3 Porosity results for Mishrif formation (NS-2) 197
D-4 Porosity results for Yamamma formation (NS-2) 198
D-5 Porosity results for Mishrif formation (NS-4) 198
D-6 Porosity results for Yamamma formation (NS-4) 199
D-7 Porosity results for Mishrif formation (NS-5) 199
D-8 Porosity results for Yamamma formation (NS-5) 200
F-1 Rt, Rxo, Rwa, and Rmfa results for Mishrif formation
(NS-1)
202

xx
F-2 Rt, Rxo, Rwa, and Rmfa results for Yamamma formation
(NS-1)
202
F-3 Rt, Rxo, Rwa, and Rmfa results for Mishrif formation
(NS-2)
203
F-4 Rt, Rxo, Rwa, and Rmfa results for Yamamma formation
(NS-2)
203
F-5 Rt, Rxo, Rwa, and Rmfa results for Mishrif formation
(NS-4)
204
F-6 Rt, Rxo, Rwa, and Rmfa results for Yamamma formation
(NS-4)
204
F-7 Rt, Rxo, Rwa, and Rmfa results for Mishrif formation
(NS-5)
205
F-8 Rt, Rxo, Rwa, and Rmfa results for Yamamma formation
(NS-5)
205
G-1 Results of clay volume for Mishrif formation (NS-1) 206
G-2 Results of clay volume for Yamamma formation (NS-1) 206
G-3 Results of clay volume for Mishrif formation (NS-2) 207
G-4 Results of clay volume for Yamamma formation (NS-2) 207
G-5 Results of clay volume for Mishrif formation (NS-4) 208
G-6 Results of clay volume for Yamamma formation (NS-4) 208
G-7 Results of clay volume for Mishrif formation (NS-5) 209
G-8 Results of clay volume for Yamamma formation (NS-5) 209
H-1 Permeability results of Schlumberger and Timur models
for Mishrif and Yamamma formations (NS-1)
210
H-2 Permeability results of Schlumberger and Timur models
for Mishrif and Yamamma formations (NS-2)
210
H-3 Permeability results of Schlumberger and Timur models
for Mishrif and Yamamma formations (NS-4)
211
H-4 Permeability results of Schlumberger and Timur models
for Mishrif and Yamamma formations (NS-5)
211
J-1 Mishrif Formation (NS-1): a, m values by Pickett method 213

xxi
J-2 Yamamma Formation (NS-1): a, m values by Pickett
method
214
J-3 Mishrif Formation (NS-2): a, m values by Pickett method 214
J-4 Yamamma Formation (NS-2): a, m values by Pickett
method
215
J-5 Mishrif Formation (NS-4): a, m values by Pickett method 215
J-6 Yamamma Formation (NS-4): a, m values by Pickett
method
216
J-7 Mishrif Formation (NS-5): a, m values by Pickett method 216
J-8 Yamamma Formation (NS-5): a, m values by Pickett
method
217
K-1 Cementation factor and resistivity formation factor
results for Mishrif formation (NS-1)
218
K-2 Cementation factor and resistivity formation factor
results for Yamamma formation (NS-1)
219
K-3
Cementation factor and resistivity formation factor
results for Mishrif formation (NS-2)
219
K-4 Cementation factor and resistivity formation factor
results for Yamamma formation (NS-2)
220
K-5 Cementation factor and resistivity formation factor
results for Mishrif formation (NS-4)
220
K-6 Cementation factor and resistivity formation factor
results for Yamamma formation (NS-4)
221
K-7 Cementation factor and resistivity formation factor
results for Mishrif formation (NS-5)
221
K-8 Cementation factor and resistivity formation factor
results for Yamamma formation (NS-5)
222
M-1 Dynamic elastic properties results for Mishrif formation
(NS-1)
226
M-2 Dynamic elastic properties results for Yamamma
formation (NS-1)
227
M-3 Dynamic elastic properties results for Mishrif formation
(NS-2)
227

xxii
M-4 Dynamic elastic properties results for Yamamma
formation (NS-2)
228
M-5 Dynamic elastic properties results for Mishrif formation
(NS-4)
228
M-6 Dynamic elastic properties results for Yamamma
formation (NS-4)
229
M-7 Dynamic elastic properties results for Mishrif formation
(NS-5)
229
M-8 Dynamic elastic properties results for Yamamma
formation (NS-5)
230
O-1 Water saturation results from Dual water, Archie and
Indonesian models for Mishrif formation (NS-1)
233
O-2 Water saturation results from Dual water, Archie and
Indonesian models for Yamamma formation(NS-1)
234
O-3 Water saturation results from Dual water, Archie and
Indonesian models for Mishrif formation (NS-2)
234
O-4 Water saturation results from Dual water, Archie and
Indonesian models for Yamamma formation(NS-2)
235
O-5 Water saturation results from Dual water, Archie and
Indonesian models for Mishrif formation (NS-4)
235
O-6 Water saturation results from Dual water, Archie and
Indonesian models for Yamamma formation(NS-4)
236
O-7 Water saturation results from Dual water, Archie and
Indonesian models for Mishrif formation (NS-5)
236
O-8 Water saturation results from Dual water, Archie and
Indonesian models for Yamamma formation (NS-5)
237

xxiii
LIST OF SYMBOLS
a - Tortuosity factor
Ac - Total cross sectional area
B - Bias value
B.C - Biot’s constant
c - Fitting parameter
Cb - Bulk compressibility
Ce - Clay conductivity
Cơ Conductivity of the fully brines saturated rock
Cr - Rock matrix compressibility
Ct - Conductivity of non – invaded zone
Cw - Conductivity of formation water
Cwb - Conductivity of bound water
Cwe : - Equivalent conductivity of the waters in pore space
CLLD - Conductivity of the deep logs
CLLS - Conductivity of the shallow logs
di - Diameter invasion
DT - Interval transit time
E - Young modulus
F - Formation resistivity factor
FS - Apparent formation resistivity factor from sonic log
Fxo - Apparent formation resistivity factor in flushed zone

xxiv
f - Activation function
g - Gradient of error surface
GRmin - Minimum gamma ray response (API unit)
GRmax - Maximum gamma ray response (API unit)
H1 - Hydrogen index, mineral 1
H2 - Hydrogen index, mineral 2
Hmf - Hydrogen index, mud filtrate
Ish - Shale index
I - Number of neuron of input layer
J - Number of neuron of first hidden layer
K - Permeability
Kn - Number of neuron of second hidden layer
KB - Bulk Modulus
L - Actual length of the core
Le - Length of the conducting channel
m - Cementation factor
n - Saturation exponent in Archie equation
N - Time step
n* - Archie saturation exponent for shaly sands
P - Neural Network input vector
Pc - capillary pressure
Pd - Displacement pressure
PR - Poisson’s ratio
q - Flow rate
Qv - Cation exchange capacity in meq/ml pore volume
Rdeep - Formation resistivity from deep resistivity log device
Rtirr - Formation resistivity at irreducible water saturation
RLLD - Resistivity deep Laterolog tool
xxv
RLLS - Resistivity shallow Laterolog tool
Rmfe - Equivalent resistivity of mud filtrate
Rmsfl - Formation resistivity from micro-spherical log device
RMSFL - Resistivity from micro-spherical tool
RO - Resistivity of the fully brine saturated rock
RP - Effective pore radius
RSFL - Resistivity from spherical focus log
Rsh - Shale resistivity
Rt - True formation resistivity with water saturation Sw
Rw - Formation water resistivity
Rwa - Apparent formation water resistivity
Rwe - Equivalent resistivity of formation water
Rxo - Flushed zone resistivity
RZ - Resistivity water in invaded zone
Sw - Water saturation (fraction of pore volume)
SWE - Effective water saturation
Swb - Bound water saturation
Swi - Irreducible water saturation
SWT - Total water saturation
Sxo - Water saturation in flushed zone
T1,T2 - Temperatures (ºF)
Tf - Formation temperature (ºF)
TO - Surface temperature
Tpl - Measured values of propagation time (dB/m)
Tpm - Matrix propagation time (dB/m)
Tpw - Water propagation time (dB/m)
ts - Pore shape factor
Vcl - Clay volume

xxvi
Vdcl - Dry clay volume
Vp - Compressional velocity
Vs - Shear wave velocity
Vsh - Shale volume
Vw - Bulk volume of formation water.
Vwb - Bulk volume of bound water.
w - Weight value
z - Number of neuron of output layer
GREEK SYMBOLS
ρb - Bulk density log reading
ρD - Bulk density
ρg - Grain density gm/cc
ρm - Mud density (Ib/gal)
ρma - Apparent matrix density
ρmf - Mud filtrate density
γ - Gamma ray index bulk density (ρD)
Δt - Interval Transit Time
Δtf - Fluid transit time μsec/ft
Δtma - Apparent matrix transit time μsec/ft
Δtp - Compressional transit time μsec/ft
ΔtS - Shear wave transit time μsec/ft
- Interfacial Tension
δ - Backpropagation error
η - Learning rate

xxvii
LIST OF ABBREVIATIONS
API - American Petroleum Institute
ANN - Artificial Neural Network
BHT - Bottom Hole Temperature
Bp - Back propagation
BVW - Bulk Volume Water
CEC - Cation Exchange Capacity
CMR - Compensating Magnetic Resonance
CNL Compensated Neutron Log
GrC - Corrected Gamma Ray
CPI - Computer Processed Interpretation
DST - Drill Stem Test
FCL-CL - Ferro Chrome Lignite - Chrome Lignite
F-Foc - Resistivity formation factor from Focke method
FFNN - Feed Forward Neural Network
F-Gom - Resistivity formation factor from Gomez method
EPT - Electromagnetic Propagation Tool
FDC - Formation Density Compensated
GR - Gamma Ray
GUI Graphical User Interfaces
ILD - Deep Induction Laterolog

xxviii
ILDC - Corrected Induction Laterolog
INOC - Iraqi National Oil Company
IP - Interactive Petrophysics
KCORE Permeability from Core Samples
KCPI Permeability from Computer Processed Interpretation
K-SLB - Permeability from Schlumberger model
K-Timur - Permeability from Timur model
LDT - Litho- Density Log
m-DE - Cementation factor from ANN model for dynamic elastic
m-Pet - Cementation factor from ANN model for Petrophysics
m-Foc - Cementation factor from Focke method
m-Gom - Cementation factor from Gomes Iteration
MD - Measured Depth
MSE - Mean square error
MSFL - Micro Spherical Focused Log
MSFLC - Corrected Micro Spherical Focused Log
NGR - Natural Gamma Ray
NMR - Nuclear Magnetic Resonance
PHI Total porosity
NPHI - Neutron Porosity log
NPHIC - Corrected Neutron Porosity log
NPHIclay Neutron log reading in 100% shale
OWC - Oil Water Contact
PHICPI - Porosity from computer processed interpretation
PHICORE - Porosity from core samples
PHID - Porosity from density log
PHIDN Porosity from density – neutron cross plot
PHIDsh Apparent density porosity in 100% shale

xxix
PHIE - Effective porosity
PHIEPT Porosity from EPT – log
PHIS - Porosity from sonic log
PHIX - Porosity from neutron -density log
PSP - Pseudo Spontaneous Potential
RFT - Repeated Formation Tester
RHOB - Bulk Density
RHOBC - Corrected Bulk Density
RTKB - Rotary Table Kelly Bushing
SFL - Spherical Focused Log
SNP - Side-well Neutron Porosity
SP - Spontaneous Potential
SSP - Static Spontaneous Potential
Sw-Arch - Water saturation from Archie model
Sw-Dual - Water saturation from Dual water model
Sw-Ind - Water saturation from Indonesian model
Sw-Sim - Water saturation from Archie model
TVD - True vertical depth
VCL-GR - Clay volume from gamma ray log
VCL-N - Clay volume from neutron log
VCL-ND - Clay volume from neutron-density log
VCL-R - Clay volume from resistivity log
VCL-SD - Clay volume from sonic-density log
VCL-SP - Clay volume from spontaneous log
V.R - Input compressional-shear wave velocity ratio in the ANN
model
Vp/Vs - CPI compressional-shear wave velocity ratio

xxx
LIST OF APPENDICES
APPENDIX TITLE PAGE
A Samples of Digitalized Data from Well Logs 179
B Validation of Digitalized Well Logs Data 189
C Environmental Corrections 191
D Porosity Results 196
E Sample of Calculations Results of PHICPI 201
F Resistivity Results 202
G Sample of Water Resistivity Calculations 204
H Clay Volume Results 207
I Sample of Clay Volume Calculations 211
J Permeability Results 213
K Sample of Calculation Results of KCPI 215
L Cementation factor results of Pickett method 216
M Cementation factor results of Gomez method 220
N Sample of Calculation Results of Gomez and PHI-F plot
method
224
O Dynamic Elastic properties Results 227
P Sample of Calculation Results of Dynamic Elastic Properties 231
Q Water Saturation Results 233

xxxi
R Sample of Water Saturation Calculations 237
S ANN Program Statements 240

CHAPTER 1
INTRODUCTION
Carbonate rocks reservoirs usually consist of various kinds of grains, lime
mud, and carbonate cement. A petroleum carbonate reservoir is a porous medium
that is sufficiently permeable to permit fluid flow through it. In the presence of
interconnected fluid phases of different density and viscosity, such as water and
hydrocarbons, the movement of the fluids is influenced by gravity, viscosity and
capillary forces. The fluids separate, therefore, in order of density when flowing
through a permeable stratum is arrested by a zone of low permeability, and, in time,
a petroleum reservoir is formed in such a trap (Peters, 2011).
In petroleum carbonate reservoirs; there are many forms of heterogeneity in
rock properties. Petrophysical parameters such as; porosity, permeability,
cementation factor, resistivity formation factor and fluid saturation are the most
important parameters for evaluating oil reservoirs in order to estimate the original oil
in place and flow patterns to optimise production of a reservoir. The evaluation of
logging data in most carbonate reservoirs still a challenging task in the present days
which need to specify of efforts and capitals to avoid incorrect interpretation
(Kadhim et al., 2015). The incorrect interpretation leads to lost hydrocarbon zones
or incorrect selection for the perforated intervals, as a result, lost time and money.
Middle East carbonate reservoirs contain giant oil and gas reservoirs, since
their reserve are more than 500MMbbl (Bia and Xu, 2014), such as Mishrif,
Yamamma, Shu’aiba, Asmari, Ilam and Sarvak, which cover around 50% percent of
hydrocarbon reserves in the world (Naomi and Standen, 1997). This ratio will
increase when reservoirs in other regions are depleted, and then the Middle East

2
carbonate formations will become the main resource of oil and gas reserve (Kadhim
et al., 2013). After World War I, carbonate reservoirs became important to the
petroleum industry, when exploration drilling resulted in the discovery of major oil
reserve in carbonate rocks in the Middle East (Chilingarian et al., 1992).
Fluid flow through heterogeneous carbonate reservoirs is a substantially
different process from the flow through the less heterogeneity sandstone reservoir.
This variation is largely cause to the fact that carbonate rocks tend to have a more
complex pore system (i.e the interrelationships among depositional lithologies, the
geometries of depositional facies, and diagenesis) than sandstone (Chilingar et al.,
1979; Mazullo, 1986; Xu et al., 2012). Carbonate reservoirs have highly
heterogeneous layers in nature. Therefore, on the basis of the dominant rock type
carbonate reservoirs are divided into layers in order to define average values and
trends of petrophysical parameters in these reservoirs (Kadhim et al., 2013).
Archie in 1942 is the first researcher, who had discernment for the porosity
exponent (m). Archie introduced an empirical relationship between porosity, and
formation resistivity factor (F), the porosity exponent used in the description of this
correlation that could has a valuable application to quantitative studies of electrical
well logs. Physically, the m factor is a measure of the degree of cementation and
consolidation of the rock. Therefore, it is called cementation factor (Guyod, 1944).
The m factor is the most important parameter for applying the petrophysical
characterization, because its effect on the calculation of water saturation (Sw), F
factor, tortuosity (a) of the pore geometry to current flow, surface area of composite
particles, and porosity (Ransom, 1974; Ransom, 1984; Polido et al., 2007).
Water saturation interpretation from conventional logs are encountered many
difficulties that lead to misleading of information such as; the impact of diagnosis
and rock wettability variations in Archie’s parameters (m, n, and a) is difficult to
quantify throughout the reservoir, and errors in reading of logging tools due to high
environmental impact while drilling and run logging tools in open whole sections
(Cassou et al., 2007; Liu and Ford, 2008).

3
The accurate calculations of petrophysical and dynamic elastic properties in
carbonate formations are the most challenging aspects of well log analysis. Many
empirical correlations and equations have been derived and developed over the years
based on known physical principles, which are used to find carbonate rock
properties (Archie, 1942; Coates and Dumanoir, 1973; Hagiwara, 1984; Watfa and
Youssef, 1987; Salazar et al., 2008; Kadhim et al., 2015). Practically, the formation
water resistivity (Rw) estimates from spontaneous potential (SP) log. Deep induction
log (ILD) or deep lateral log (LLD) usually measured the true resistivity of the
formation (Rt). Density, neutron, and sonic logs are used to calculate the porosity.
Well logs and core data analysis can be used to estimate the saturation exponent (n)
and cementation exponent. There are many correlations were developed to calculate
permeability (K) from porosity logs (Lucia, 2007; Peters, 2011).
Depositional carbonate rocks consist mainly of loose irregular calcite grains,
during deposition of carbonate rocks, there are many physical and chemical
processes will take place over time that will change these rocks. One of the most
important processes that take place during deposition is called cementation.
Cementation will significantly influenced the compressional and shear wave
velocities and other dynamic elastic properties of carbonate rocks. In addition
cementation also impacts the grain surface and the grain contacts will become stiffer
sediment. The compressional and shear wave velocities can be determined by
interval transit time (DT) from the sonic logs. The dynamic elastic properties; Bulk
modulus, Young modulus, and Biot's Constant can be determined when the
compression wave velocity (Vp) and corrected bulk density values are available
(Entyre, 1989; Lucia, 2007; Jackson, et al., 2008; Kadhim et al. 2013).
Due to complexity and highly nonlinearity of carbonate reservoirs properties
as well as there are many input variables related cementation factor with
petrophysical and dynamic elastic properties, no close mathematical model that can
describe the behaviour of this relationship. Artificial neural networks (ANN)
technique has been implemented, because of their cost - effective, easy to
understand and ability to learn from examples, which found in many applications to
estimate variable that usually cannot be measured in linear modelling (Amnah,
2009). The ANN has become increasingly popular in the petroleum industry. Many

4
practical applications of the ANN have been used for quantitative analysis of
reservoir properties from well logs (Huang et al., 1996; Huang and Williamson,
1997; Zhang et al., 2000), where the ANN approach is shown to be a simple and
accurate alternative for converting well logs to common reservoir properties such as
porosity and permeability.
Overall, due to the large variation of petrophysical and dynamic elastic
properties of carbonate reservoirs, petrophysical evaluation of these reservoirs is
important in predicting their behaviour. Well logs are considered one of the main
sources of data for the geological and petrophysical parameters of reservoir
formations. Cementation factor is one of the most important parameters because the
accurate determination of it should be improved the saturation value and
consequently oil in place calculation.
1.1 Problem Statements
The value of m factor has been assumed constant for each type of rocks in
numerous studies of formation evaluation (Kadhim et al., 2013). Previous studies of
the Nasiriya (NS) oil field too, assumed the m factor is constant with depth, that
increases the uncertainty in calculating water saturation value, and as a result there
was a mistake of hydrocarbon reserve calculation, as well as inaccurate detection of
perforation zones.
Since carbonate reservoirs are heterogeneous in nature, therefore the
behaviour of petrophysical and elastic properties of these reservoirs is a high non-
linear. The correlation between cementation factor and petrophysical properties of
carbonate reservoirs such as; K, PHI, and F factor is provided in this study based on
the conventional well logs, analysis of core samples data, and NS oilfield reports.
Moreover, a new interpretation approach for the relation between dynamic elastic
properties for instance; compressional-shear velocity ratio (VP/VS), Poisson’s Ratio
(PR), Bulk modulus (KB), Young’s modules (E), and Biot's Constant (BC) is
introduced using ANN platform.

5
The artificial network model is used as an efficient technique as predictor,
especially in carbonate formations when the nature is complex and highly non-
linearity, that cause no close conventional mathematical model can describe the
behaviour of this process without assumptions. Furthermore, the model can be
considered faster by integrating graphical user interfaces (GUI) and more accurate
by added mean square errors calculations in comparison with traditional ones such
as Gomes and Pickett methods.
1.2 Objectives of Study
1. To determine petrophysical properties of carbonate formations from well
logs data and compare with available core data results.
2. To determine the dynamic elastic properties of carbonates formation
from sonic log data.
3. To calculate cementation factor for various depth of formation by using
Pickett, Gomez and F-PHI plot methods.
4. To determine new correlations between the cementation factor and
petrophysical and dynamic elastic properties for carbonates formation by
using a new approach of ANN model.
5. To determine the water saturation for various depth of carbonate
formation from Archie, dual water and Indonesian models.
1.3 The Scope of Study
1. Mishrif and Yamamma carbonate formation of the NS oilfield are used as
a case study. Available well logs and core data are provided from five
studied wells in this field.

6
2. Convert the available copies of logs to digitals using Neura-log software
(NL, V5, 2008) and validated using Origin Pro8 software based on
correlation coefficient (R2) and standard error (SE).
3. Interactive Petrophysics software (IP V3.5, 2008) was used to determine
the petrophysical and dynamic elastic properties of the carbonate rocks in
the studied area, and validated with properties from core data.
4. Gomez and F-PHI plot methods were used to determine the cementation
factor for the studied carbonate formation, and compared and validated
with Pickett method.
5. An Artificial neural network model was trained using Gradient Descent
with Momentum and Levenberg – Marquardt algorithms.
6. An artificial neural network model was used to develop a new correlation
between cementation factor and petrophysical properties (K, PHI, and F)
and with dynamic elastic properties (VP/VS, PR, KB, E and BC) of the
studied carbonate formation and compared with Pickett method.
7. Mean square error (MSE) and correlation coefficient (R2) were used to
determine the cementation factor prediction performance by ANN model,
and compared with previous studies, such as (Aifa et al., 2014; saljooghi
and hezarkhani, 2014)
8. Three water saturation models (Archie, dual water and Indonesian) were
used to determine water saturation in various depths of the studied
carbonate formation, and validated with saturation data from core
samples.
1.4 Significance of Research and Contributions of the Present Study
Cementation factor is one of the most important parameters, which has the
specific effect to rock properties. Therefore, the accurate determination of this factor
should be improved the accuracy of water saturation values, and consequently oil in
place calculation. Moreover, accurate determination of water saturation profile with
depth leads to avoiding mistakes in the detecting of perforation zones, that means
save money and time. The contribution to be made in this study involves:
7
1. With a new developed correlations between cementation factor and
carbonate rock properties, more accurate formation cementation factor can
be determined by knowing the carbonate reservoirs petrophysical and
dynamic elastic properties.
2. More accurate water saturation for various depths of carbonate formation can
be determined.
3. Establishment of a new and more accurate petrophysical and dynamic elastic
properties data for studied formation.
4. Developed an artificial neural network model can be used to establish the
cementation factor from properties of carbonate formation by using graphical
user interfaces (GUI).
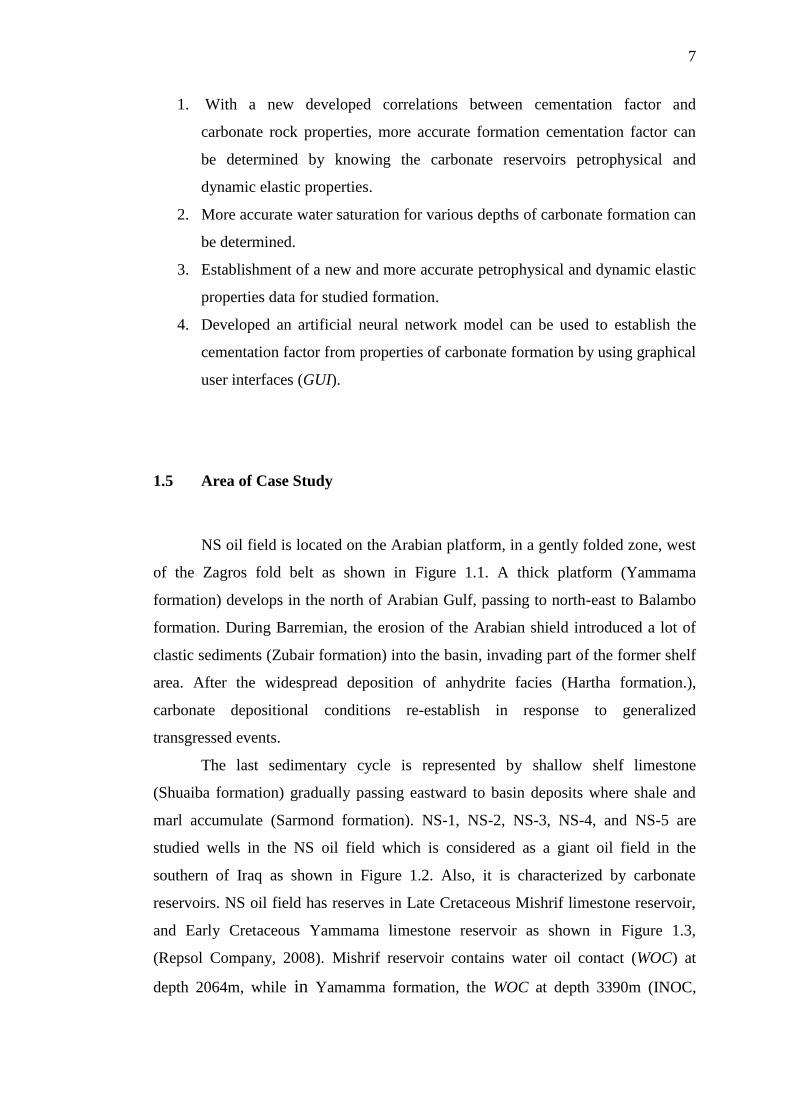
1.5 Area of Case Study
NS oil field is located on the Arabian platform, in a gently folded zone, west
of the Zagros fold belt as shown in Figure 1.1. A thick platform (Yammama
formation) develops in the north of Arabian Gulf, passing to north-east to Balambo
formation. During Barremian, the erosion of the Arabian shield introduced a lot of
clastic sediments (Zubair formation) into the basin, invading part of the former shelf
area. After the widespread deposition of anhydrite facies (Hartha formation.),
carbonate depositional conditions re-establish in response to generalized
transgressed events.
The last sedimentary cycle is represented by shallow shelf limestone
(Shuaiba formation) gradually passing eastward to basin deposits where shale and
marl accumulate (Sarmond formation). NS-1, NS-2, NS-3, NS-4, and NS-5 are
studied wells in the NS oil field which is considered as a giant oil field in the
southern of Iraq as shown in Figure 1.2. Also, it is characterized by carbonate
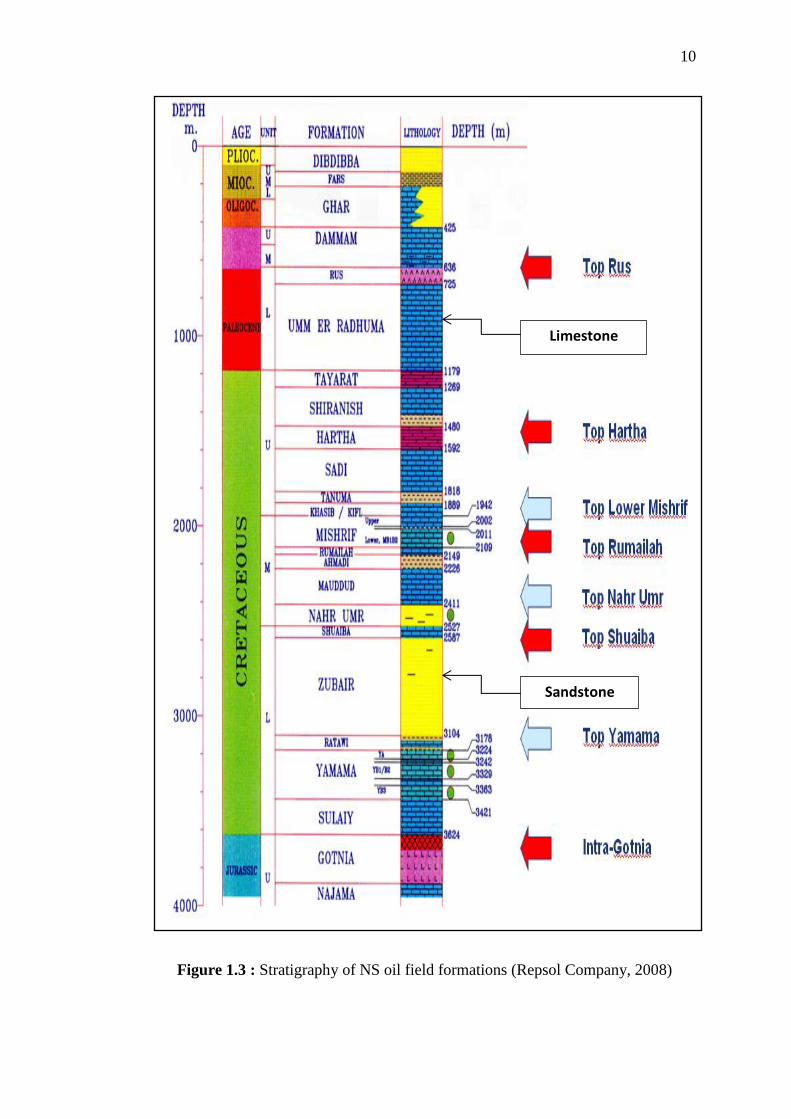
reservoirs. NS oil field has reserves in Late Cretaceous Mishrif limestone reservoir,
and Early Cretaceous Yammama limestone reservoir as shown in Figure 1.3,
(Repsol Company, 2008). Mishrif reservoir contains water oil contact (WOC) at
depth 2064m, while in Yamamma formation, the WOC at depth 3390m (INOC,

8
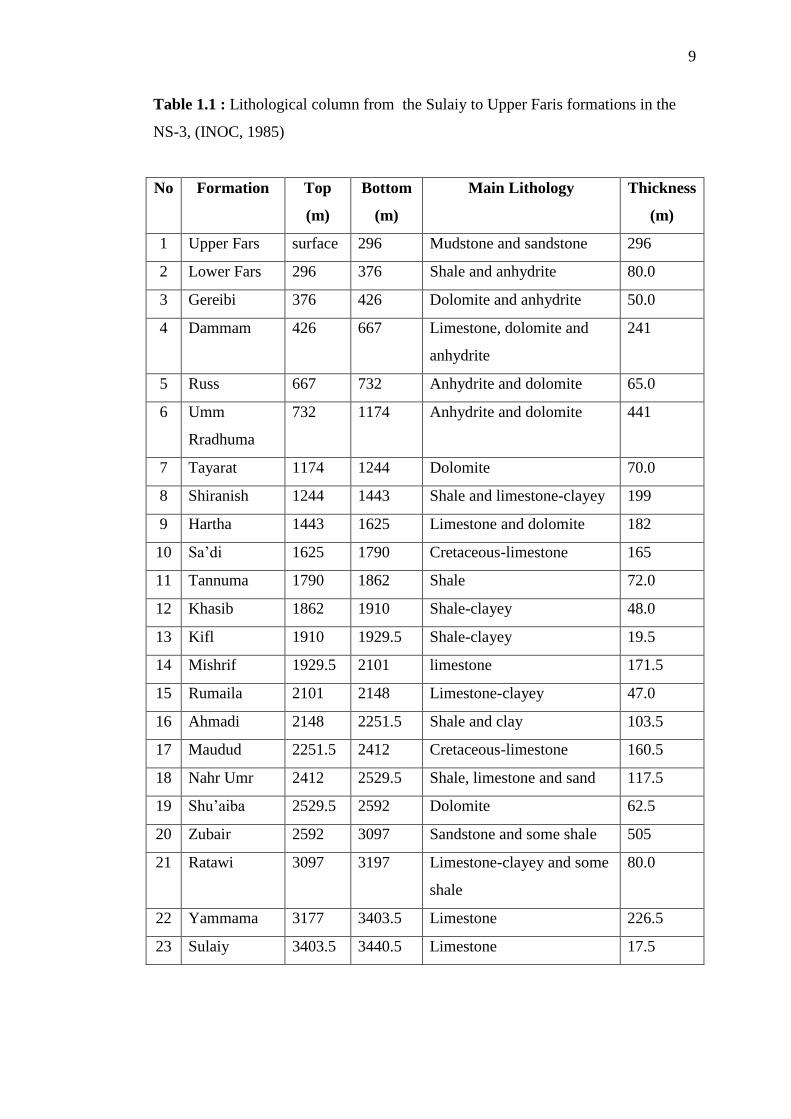
1985). The lithological column of the NS oil field is provided by Iraqi National Oil
Company (INOC) in 1985, in the final drilling report of the NS-3 oil well as shown
in Table 1.1.
Figure 1.1 : Satellite images for NS oil field location
Figure 1.2 : Location maps of the studied wells
9
Table 1.1 : Lithological column from the Sulaiy to Upper Faris formations in the
NS-3, (INOC, 1985)
No Formation Top
(m)
Bottom
(m)
Main Lithology Thickness
(m)
1 Upper Fars surface 296 Mudstone and sandstone 296
2 Lower Fars 296 376 Shale and anhydrite 80.0
3 Gereibi 376 426 Dolomite and anhydrite 50.0
4 Dammam 426 667 Limestone, dolomite and
anhydrite
241
5 Russ 667 732 Anhydrite and dolomite 65.0
6 Umm
Rradhuma
732 1174 Anhydrite and dolomite 441
7 Tayarat 1174 1244 Dolomite 70.0
8 Shiranish 1244 1443 Shale and limestone-clayey 199
9 Hartha 1443 1625 Limestone and dolomite 182
10 Sa’di 1625 1790 Cretaceous-limestone 165
11 Tannuma 1790 1862 Shale 72.0
12 Khasib 1862 1910 Shale-clayey 48.0
13 Kifl 1910 1929.5 Shale-clayey 19.5
14 Mishrif 1929.5 2101 limestone 171.5
15 Rumaila 2101 2148 Limestone-clayey 47.0
16 Ahmadi 2148 2251.5 Shale and clay 103.5
17 Maudud 2251.5 2412 Cretaceous-limestone 160.5
18 Nahr Umr 2412 2529.5 Shale, limestone and sand 117.5
19 Shu’aiba 2529.5 2592 Dolomite 62.5
20 Zubair 2592 3097 Sandstone and some shale 505
21 Ratawi 3097 3197 Limestone-clayey and some
shale
80.0
22 Yammama 3177 3403.5 Limestone 226.5
23 Sulaiy 3403.5 3440.5 Limestone 17.5
10
Figure 1.3 : Stratigraphy of NS oil field formations (Repsol Company, 2008)
Limestone
Sandstone
11
1.6 Thesis Outlines
The present thesis is divided into five chapters. Chapter 1 describes a
background of the study and motivation of the research is being explained to give a
basic overview of the problem statement, research objectives, significant,
contribution and scope of the study. This chapter also explains the area of the case
study. Chapter 2 reviews the cementation factor, petrophysical and dynamic
properties and their calculations. The theory and application of artificial neural are
also proposed in this phase. Previous studies of correlations between cementation
factor and porosity, resistivity formation factor, permeability, and acoustic velocities
are introduced in this chapter.
Chapter 3 shows the research methodology diagrams and the steps of
parameters calculation as well as structure of artificial neural network model.
Chapter 4 illustrates the results and discussion of petrophysical properties,
cementation factor, dynamic elastic properties, and water saturation. The
cementation factor calculation from petrophysical and dynamic elastic models are
introduced by ANN technique, and the verification of results has been done in each
step of the calculation. This is followed by the conclusion and recommendations of
future works in Chapter 5.

REFERENCES
Adeoti, L. Ayolabi, E.A. and James, P.L. (2009). An Integrated Approach to
Volume of Shale Analysis: Niger Delta Example, Orire Field. World Applied
Sciences Journal, 7 (4), 448-452.
Adisoemarta, P.S. Anderson,G.A. Frailey, S.M., and Asquith, G.B. (2000).
Historical Use of m and a in Well Log Interpretation: Is Conventional
Wisdom Backwards? SPE Permian Basin Oil and Gas Recovery Conference,
21-23 March, Midland, Texas, SPE-59699-MS.
Ahr, W.M., Mancini, E.A. and Parcell, W.C., 2011. Pore characteristics in microbial
carbonate reservoirs. AAPG Search and Discovery Article, 30167.
Aïfa, T., Baouche, R., and Baddari, K. (2014). Neuro-fuzzy system to predict
permeability and porosity from well log data: A case study of Hassi R ׳Mel
gas field, Algeria. Journal of Petroleum Science and Engineering, 123, 217-
229.
Akber, M. Alghamdi, A.H. Allin, D. Herron, M. and Logan, D. (2001). A Snapshot
of Carbonate Reservoir Evaluation. Oilfield review, 7 (1), 20-41.
Ali, H.S. A1-Marhoun, M.A.Abu-Khamsin, S.A. and Celik, M.S. (1987). The Effect
of Overburden Pressure on Relative Permeability, Middle East Oil Show, 7-
10 March, Bahrain, SPE-15730-MS.
Al-Tahini, A. M. Sondergeld, C. H and Rai, C. S. (2004). The Effect of Cementation
on Static and Dynamic Properties in Jauf and Unayzah Formations at Saudi
Arabia, SPE Annual Technical Conference and Exhibition, 26-29 September,
Houston, Texas, SPE-90448-MS.
Amin, A.T. Watfa, M., and Awad, M. A. (1987). Accurate Estimation of Water
Saturation in Complex Carbonate Reservoir, Middle East Oil Show, 7-10
March, Bahrain, SPE-15714-MS.
Amnah, M. H. (2009). Prediction of Reservoir Permeability from Well Logs Data
Using Artificial Neural Networks, Iraqi Journal of Science, 50 (1), 67 – 74.
163
Antwan, M. A. (1988). Well Log Analysis. (PP.178-235), Printed by Al-Mousel
University. Iraq.
Arash, R. (2011). An Analytical Estimation of Formation Permeability by Using
Well Logs Data, the2nd
International Geosciences, Student Conference, 9-12
July, Krakow, Poland.
Archie, G. E. (1942).The Theoretical Resistivity Log as an Aid in Determining Some
Reservoir Characteristics, Transactions of the AIME, Vol. 146, Issue 01,
SPE-942054-G.
Arpat, G. B., Gümrah, F., and Yeten, B. (1998). The neighborhood approach to
prediction of permeability from wireline logs and limited core plug analysis
data using backpropagation artificial neural networks. Journal of Petroleum
Science and Engineering, 20(1), 1-8.
Asadollahi, M., Bagheri, A., Haghighi, M., and Namani, M. (2008). Investigation of
cementation Factor in Iranian Carbonate Reservoirs, The 14th
Formation
Evaluation Symposium, September 29-30, Japan.
Asquith, G. and Krygowski, D. (2006). Basic Well Log Analysis. AAPG Methods in
Exploration, Series No.16, June 30.
Atashbari,V. and Tingay, M. (2012). Pore Pressure Prediction in Carbonate
Reservoir. SPE Latin America and Caribbean Petroleum Engineering
Conference, 16-18 April, Mexico City, Mexico, SPE-150835-MS.
Attia, M. A. (2005). Effects of Petrophysical Rock Properties on Tortuosity Factor,
Journal of Petroleum Science and Engineering, 48(3-4), 185-198.
Bai, G., and Xu, Y,(2014). Giant Fields Retain Dominance in Reserve Growth, Oil
and Gas Journal, March, 2014
Balan, B.M.and Ameri,S. (1995). State-Of-The-Art in Permeability Determination
from Well Log Data: Part 1- A Comparative Study, Model Development, SPE
Eastern Regional Meeting, 18-20 September, Morgantown, West Virginia
SPE-30978-MS.
Bateman, R. M.and Konen, C. E. ( 1977). The Log Analyst And The Programmable
Pocket Calculator,the Log Analyst, 18 (05), SPWLA-1977-VXV.
Bernands, Z., and Francois, M.P. (2007), A Geoscientist Gide to Petrophysics,
(pp. 221-259), Paris, IFP Publications.
164
Bessiouni, Z. (1994). Theory, Measurement and Interpretation of Well Logs,
(pp. 1-13), Texas, SPE text book series, Vol.4.
Borai, A.M. (1987). A New Correlation for the Cementation Factor in Low-Porosity
Carbonates, SPE Formation Evaluation, 2 (04), SPE-14401-PA.
Brocher, T.M .(2007). Key Elements of Regional Seismic Velocity Models for Long
Period Ground Motion Simulations, J. Seismology, 12(2), 217–221.
Burger, H. (1992). Exploration Geophysics of the Shallow Subsurface, Englewood
Cliffs, N.J., Prentice-Hall.
Burke, J. A. Campbell, R. L. and Schmidt, A. W. (1969). The Litho-Porosity Cross
plot, .SPWLA 10th Annual Logging Symposium, 25-28 May, Houston,
Texas.SPWLA-1969-Y.
Carroll, R.D. (1969). The Determination of Acoustic Parameters of Volcanic Rocks
from Compressional Velocity Measurements, Int. Jl. Rock Mech. Min. Sci., 6
(6), 557- 579.
Cassou, G., Poirier-Coutansais, X., and Ramamoorthy, R. (2007). Movable Oil
Saturation Evaluation in an Ultra-Mature Carbonate Environment, SPWLA
Middle East Regional Symposium, 15-19 April, Abu Dhabi, UAE, SPAWLA-
2007-U.
Castagna, J.P. Batzle, M.L and Eastwood, R.L. (1985). Relationships between
compressional wave and shear-wave velocities in elastic silicate rocks,
Geophysics, 50 (04), 571-581.
Cheng, C. H. and Johnson, D H. (1981). Dynamic and Static Moduli, Geophysical
Research Letters, 8 (1), 39-42.
Chicheng, X. Zoya, H.and Carlos, T. (2012). Rock Classification in Carbonate
Reservoirs Based on Static and Dynamic Petrophysical Properties Estimated
from Conventional Well Logs. SPE Annual Technical Conference and
Exhibition, 8-10 October, San Antonio, Texas, USA, SPE-159991MS.
Chilingrian, G.V. Mazzullo, S.J. and Rieki, H.H. (1992). Carbonate Reservoir
Characterization: a Geologic-Engineering Analysis,partI, New York,
Elsevier.
Chilingar, G.V. Bissell, H.G., and Wolf, K.H. (1979). Diagenesis of Carbonate
Sediments and Epigenesists (or cat-agenesis)of Limestone,(pp. 247-422),
Amsterdam, Elsevier.

165
Clavier, C. Coates, G. and Dumanior, J. (1984). Theoretical and Experimental Bases
for the Dual-Water Model for Interpretation of Shaly Sands, Society of
Petroleum Engineers Journal, 2(02), SPE 6859-PA.
Coates,G. and Dumanoir, J. (1973). A New Approach to Improve Log-Derived
Permeability, the14th
Annual Logging Symposium, 6-9 May, Lafayette,
Louisiana, SPWLA-1973-R.
Coates, G., Boutemy, Y., and Clavier, C. (1983). A Study of the Dual-Water Model
Based on Log Data, Journal of Petroleum Technology, 35 (1), SPE 10104-
PA.
Demuth, H. Beale, M. and Hagan, M. (2006). Neural Network Toolbox User’s Guide
Ver5, USA, Themathworks, Inc., Natick, MA.
Demirmen, F. (2007). Reserves Estimation: The Challenge for the Industry, Journal
of Petroleum Technology, 59 (5), 80-89.
Dimla, D. E. and Lister, P.M. (1998). Automatic Tool State Identification in a Metal
Turning Uperation Using MLP Neural Network Sand Multivariable Process
Parameter, International Journal of Machine Tool and Manufacturing, 38
(4), 343-352.
Dvorkin, J., A. Nur, H.Yin, (1994). Effective Properties of Cemented Granular
Materials, Mechanics of Materials, 18 (4), 351-366.
Dullien, F.A.L. (1991). One and Two-Phase Flow in Porous Media and Pore
Structure, (pp. 173-214), New York, Science Publishers Inc.
Dunham, R.J., 1962. Classification of carbonate rocks according to depositional
textures.
Elias, V. L. G., and Steagall, D. E. (1996). The Impact of the Values of Cementation
Factor and Saturation Exponent in the Calculation of Water Saturation for
Macae Formation, International Symposium of the Society of Core Analysts
(SCA), September 8-10, Montpellier, France, 1-9, SCA-9611.
Ellis, D. V., and Singer, J. M. (2007). Well Logging for Earth Scientists,
(pp. 629-634), the Netherland, 2nd
Edition, Springer.
Enikanselu, P. A.and Ojo, A. O. (2014). Statistical Analysis and Evaluation of
Lithofacies from Wireline Logs Over Beleema Field, Niger Delta, Nigeria,
Global Journal of Petroleum and Chemical Engineering, 12(02), 11-19.

166
Entyre, L.M. (1989). Finding Oil and Gas from Well Logs, (pp.91-145), New York,
Van Nostrand Reinhold.
Entyre, L. M. (1993). Comparative Performance of a Dual Water Model Equation in
Laminar Shaly Sands, the 34th
Annual Logging Symposium, June 13-16,
Calgary, Alberta, SPWLA-1993-1.
Fjaer, E. Holt, R. M. Horsrud, P. Raaen, A. M. and Risnes, R. (1992). Petroleum
Related Rock Mechanics, 2nd
edition, Vol.53, Amsterdam, Elsevier.
Focke, J. W. and Munn, M. (1987). Cementation Exponents in Middle East
Carbonate Reservoir, SPE Formation Evaluation, 2(01), SPE-13735-PA.
Frost, E. Fertl, W.H. and Whichmann P..A. (1981). Prolog- A Computerized Well
Site Analysis System. SPE Middle East Technical Conference and
Exhibition, 9-12 March, Bahrain, SPE-9619-MS.
Gatens, J.M. Harrison, C.W. Lancaster, D.E. and Guidr, F.K. (1990). In-Situ Stress
Tests and Acoustic Logs Determine Mechanical Properties and Stress
Profiles in the Devonian Shales. SPE Formation Evaluation, 5 (03), SPE-
18523-PA.
Gercek, H. (2007). Poisson's Ratio Values for Rocks, International Journal of Rock
Mechanics and Mining Sciences, 44 (1), 1–13.
Gilchrist, W. A. (2008). Compensated Neutron Log Response Issues – A Tutorial,
the 49th
Annual Logging Symposium, May 25-28, Austin, Texas, SPAWLA-
2008-S, 1-11.
Glanville, C. R. (1963). Principles of log Interpretation by Use of Multiple Curves,
SPWLA 4th
Annual Logging Symposium, 23-24 May, Oklahoma City,
Oklahoma, SPWLA-1963-E.
Gomez, R. O. (1976). A Practical Method for Determining Cementation Exponents
and Some Other Parameters as an Aid in Well Log Analysis. The Log
Analyst, 17 (05), SPWLA-1976
Gomez, R. O. (1977). Some Considerations about the Possible Use of the Parameters
(a) and (m) As A Formation Evaluation Tool through Well Logs, SPWLA
18th Annual Logging Symposium, 5-8 June, Houston, Texas, SPWLA-1977-J.
Gommesen, L. and Fabricius, I. L. (2001). Dynamic and static elastic moduli of
North Sea and deep sea chalk, Physics and Chemistry of the Earth, (A), 26
(2), 63-68.

167
Guo, D., Zhu, K., Wang, L., Li, J., and Xu, J. (2014). A new methodology for
identification of potential pay zones from well logs: Intelligent system
establishment and application in the Eastern Junggar Basin, China. Petroleum
Science, 11(2), 258-264.
Guyod, H. (1944). Fundamental Data for the Interpretation of Electric Logs, Oil
Weekly, 115 (38), 21-27.
Hagan, M.T. Demuth, H.B. and Beale, M. (1996). Neural Network Design, Texas,
Orlando De Jesus-Frisco.
Hagiwara, T. (1984). Archie’s m for Permeability, SPE Annual Technical
Conference and Exhibition, 16-19 September, Houston, Texas, SPE-13100-
MS.
Hamada, G.M. (1999). An Integrated Approach to Determine Shale Volume and
Hydrocarbon Potential in Shaly Sand in the Gulf of Suez., The Log Analyst,
40(03), SPWLA-1999.
Hambalek, N., and González, R. (2003). Fuzzy Logic Applied to Lithofacies and
Permeability Forecasting, SPE Latin American and Caribbean Petroleum
Engineering Conference, 27-30 April, Port-of-Spain, Trinidad and Tobago,
SPE-81078-MS.
Haung,P. T. and Chen, J. C. (2000). Neural Network Based Tool Breakage
Monitoring System for End Milling. Journal of Industrial Technology, 16 (2),
1-7.
Hasan, A. N. and Enamul, M. H. (2011). Modified Kozeny–Carmen Correlation for
Enhanced Hydraulic Flow Unit Characterization, Journal of Petroleum
Science and Engineering, 80 (2011), 107–115.
Hassani-giv, M. and Rahimi, M. (2008). New Correlations for Porosity Exponent in
Carbonate Reservoirs of Iranian Oil Fields in Zagros Basin, JUST, 34 (2), 1-
7.
Henriksen, A. D., Fabricius, I. L. Borre, M. K. Korsbech, U. Theilgaard, A. T.
Zandbergen, J. B. (1999), Core Density scanning, Degree of Induration and
Dynamic Elastic Moduli of Palaeogene Limestone in the Copenhagen Area,
Quarterly Journal of Engineering Geology, Vol. 32, Pp 107-117.

168
Haung, P. T. and Chen, J. C. (2000). Neural Network Based Tool Breakage
Monitoring System for End Milling, Journal of Industrial Technology, 16 (2),
1-7.
Hilchie, D. W. (1982). Applied open-hole log interpretation (for geologists and
engineers), USA. DW Hilchie.
Huang, Z., Shimeld, J. Williamson, M. and Katsube, J. (1996). Permeability
Prediction with Artificial Neural Network Modelling in the Venture Gas
Field, Offshore Eastern Canada, Geophysics, 61 (2), 422-436.
Huang, Z. and Williamson, M.A. (1997). Determination of porosity and permeability
in reservoir intervals by artificial neural network modelling, offshore eastern
Canada, Petroleum Geoscience, 3 (3), 245-258.
Iraqi National oil Company, INOC (1985). Well Final Report of NS-3, Unpublished
Report.
Iraqi National oil Company, INOC (2007). Nasiriya Oil Field- Integrated Reservoir
Study Updating, Unpublished report.
Jackson, P. Williams, J.F. Lovell, M.A. Camps, A., Rochelle,C. and Milodowski,
A.E. (2008). An Investigation of The Exponent in Archie’s Equation:
Comparing Numerical Modelling with Laboratory Data: Towards
Characterizing Disturbed Samples from the Cascadia Margin.49th Annual
Logging Symposium, 25-28 May, Austin, Texas, SPWLA-2008-HHH.
Jakosky J.J. and Hopper R.H., (1937). The Effect of Moisture on the Direct Current
Resistivity of Oil Sands and Rocks,Geophysics,2 (1), 33-55.
Jizba, D., G. Mavko, and Nur, A. (1990). Static and dynamic moduli of tight gas
sandstones, SPWLA 31st Annual Logging Symposium, 24-27 June, Lafayette,
Louisiana,SPWLA-1990-BB.
Johnston, J., and Christensen, N. (1993). Compressional to shear velocity ratios in
sedimentary rocks, International Journal of Rock Mechanics and Mining
Sciences, 30 (7), 751–754.
Kadhim, F.S., Samsuri, A., and Kamal, A., (2013). A review in correlation between
cementation factor and carbonate rock properties, Life Sci. J, 10(4), 2451-
2458.

169
Kadhim, F.S., Samsuri, A., and Kamal, A., (2014). Carbonate Rock Properties
Relationships to Cementation Factor in the Mishrif Formation, The
Proceedings of 8th
SEATUC Symposium, 4–5 March, Johor, Malaysia.
Kadhim, F.S., Samsuri, A., and Kamal, A., (2014). Calculation of petrophysical
properties for Mishrif carbonate reservoir, AIP Conference Proceedings, Vol.
1621, pp. 756-762).
Kadhim, F.S, Samsuri, A., Kamal, A., Alwan, H. and Hashim, M. (2015).
Investigation of petrophysical properties for Yamamma carbonate formation,
Modern Applied Science, 9 (6), 36-47.
Kadhim, F.S., Samsuri, A., and Al-Dunainawi, Y. (2015), ANN-Based Prediction of
Cementation Factor in Carbonate Reservoirs, SAI Intelligent Systems
Conference, November 10-11, 2015 , London, UK, IEEE publishing.
Karakan, C.O. (2009). Elastic and shear moduli of coal measure rocks derived from
basic well logs using fractal statistics and radial basis functions, Int J Rock
Mech Min Sci, 46(8), 1281-1295.
Klimentos, T. Harouaka, A., Mtawaa, B., and Saner, S. (1998). Experimental
Determination of the Blot Elastic Constant: Applications in Formation
Evaluation (Sonic Porosity, Rock Strength, Earth Stresses, and Sanding
Predictions).SPE Annual Technical Conference and Exhibition , Dallas, 22-
25 October, SPE 30593.
Knackstedt, M.A., Arns, C. H. Sheppard, A.P. Senden,T. J. and Sok, R. M. (2007).
Archie’s Exponents in Complex Lithology Derived From 3D Digital Core
Analysis, the48th
Annual Logging Symposium, Austin, Texas, United States,
June 3-6, SPWLA-2007.
Krief, M., Garat, J., Stellingwerf, J. (1990). A Petrophysical Interpretation Using the
Velocities of P and S Waves (full-waveform Sonic).The Log Analyst, 31 (6),
SPWLA-1990.
Lashin, A. (2005). Reservoir Parameter Estimation Using Well Logging Data and
Production History of the Kaldarholt Geothermal Field, S-Iceland,
Geothermal Training Program, United Nations University, Reykjavik,
Iceland.

170
Liu, S., and Ford, J. (2008). Cost/Benefit Analysis of Petrophysical Data
Acquisition, the 49th
Annual Logging Symposium, 25-28 May, Austin, Texas,
SPWLA-2008-HH.
Lucia, F.J. (2007). Carbonate Reservoir Characterization, An Integrated Approach,
2nd
Edition, Springer, Berlin.
Mai, A. and Kantzas, A. (2002). Porosity Distribution of Carbonate Reservoirs
Using Low Field NMR, Canadian International Petroleum Conference, 11-
13 June, Calgary, Alberta, Petroleum Society of Canada, PETSOC-2002-193.
Mai, A. and Kantzas, A. (2003). Advances in Carbonate Characterization Using Low
Field NMR, The Petroleum Society’s Canadian International Petroleum
Conference, 10-12 June, Calgary, Alberta, Canada, PETSOC-2003-106.
Martin, M. Murray G.H. and Gillingham W.J. (1938). Determination of the Potential
Productivity of Oil –Bearing Formation by Resistivity Measurement,
Geophysics, 3 (3), 258-272.
Masoud, A. Ali Mohammad, B., Manouchehr, H. and Mehran, N. (2008). The Effect
of Cementation Factor on OOIP in Iranian Carbonate Reservoirs,A Monte
Carlo Approach, the 14th
Formation Evaluation Symposium, September 29-3,
Japan.
Maute, R.E. (1992). Improved Data-Analysis Method Determines Archie Parameters
from Core Data. Journal of Petroleum Technology, 44(1), SPE-19399-PA.
Mazzullo,S.J. (1986). Stratigraphic Approach of Hydrocarbon Exploration and
Exploitation, Geological Journal, 21(3), Pp 265-28.
McCulloch,W. and Pitts, W. (1943). A logical Calculus of the Ideas Immanent in
Nervous Activity, Bulletin of mathematical biophysics, 5 (4), 115-133.
Miller, S. L., and Stewart, R. R. (1990). Effects of lithology, porosity and shaliness
on P-and S-wave velocities from sonic logs, Canadian Journal of
Exploration Geophysics, 26(1-2), 94-103.
Miller, S. L. (1992). Well log analysis of Vp and Vs in carbonates. In CREWES
Research Report, (Vol. 4).
Mitchell-Tapping, H. J. (1981). Acoustic Velocity Relationship to the Cementation
factor (m) in the Sligo Oolite. The Log Analyst, 22 (03), SPWLA-1981-VXX.

171
Mohaghegh, S.; Arefi, R.; Ameri, S. and Hefner, M. H. (1994). A Methodology
Approach for Reservoir Heterogeneity Characterization Using Artificial
Neural Networks, SPE Annual Technical Conference and Exhibition, 25-28
September, New Orleans, Louisiana,SPE-28394-MS.
Mohaghagh, S., Balan, B., and Amer, S. (1997). Permeability Determination from
Well Log Data, SPE Formation Evaluation, 12(03), 170-174, SPE-30978-PA
Mohaghegh, S. (2000). Virtual-Intelligence Applications in Petroleum Engineering:
Part 3—Fuzzy Logic, Journal of Petroleum Technology, 52(11), 82-87, SPE-
62415-JPT.
Montaron, B., (2009). Connectivity Theory – a New Approach to Modelling Non-
Archie Rocks, Society of Petrophysicists and Well-Log Analyst, Petrophysics,
50 (2), 102-115.
Montmayeur,H. and Graves, R. M. (1986). Prediction of static elastic/mechanical
properties of consolidated and unconsolidated sands from acoustic
measurements, SPE Annual Technical Conference and Exhibition, 22-26
September, Las Vegas, Nevada, SPE 14159-MS.
Morries, R.L and Biggs,W. P. (1967). Using Log-Derived Values of Water
Saturation and Porosity, SPWLA 8th
Annual Logging Symposium, 12-14 June,
Denver, Colorado, 1-26, SPWLA-1967-X.
Myeres, M. (1991). Pore Combination Modelling: a Technique for Modelling the
Permeability and Resistivity Properties of the Complex Pore System, SPE
Annual Technical Conference and Exhibition, 6-9 October, Dallas, Texas
SPE-22662-MS.
Naomi, R.and Standen, E. (1997). Carbonates the inside story, Middle East Well
Evaluation Review, 18, 28-41.
Nooruddin, H. A., and Hossain, M. E. (2011). Modified Kozeny–Carmen correlation
for enhanced hydraulic flow unit characterization. Journal of Petroleum
Science and Engineering, 80(1), 107-115.
Parra, J. O., Hackert C. L., Collier H. A., and Bennett M .(2001). NMR and Acoustic
Signatures in Vuggy Carbonate Aquifers, SPAWLA 42nd
Annual Logging
Symposium, 17-20 June, Houston, Texas,SPWLA-2001-II.

172
Patnode, H.W. and Wyllie M.R.J. (1950).The Presence of Conductive Solids in
Reservoir Rocks as a Factor in Electric Log Interpretation, Journal of
Petroleum Technology, 2(02) SPE-950047-G.
Patterson, D. W. (1996). Artificial Neural Networks, Theory and application. New
York, Prentice Hall.
Peeters, M. (1986). Triple – Fluid Evaluations Using Density – Neutron and EPT
Logs. SPE Formation Evaluation, 1(02), SPE –13301-PA.
Peters, E., J. (2011). Petrophysics, the University of Texas, Austin, Published by
Hadi Al-Sinan.
Pickett, G. R. (1963). Acoustic Character Logs and Their Applications in Formation
Evaluation, Journal of Petroleum Technology, 15 (6), 659-676, SPE-452-PA.
Pickett, G. R. (1966). A Review of Current Techniques for Determination of Water
Saturation from Logs, Journal of Petroleum Technology, 18(11), SPE-1446
PA.
Pulido, H., Samaniego, F., Galicia-Muñoz, G., Rivera, J., and Vélez, C. (2007).
Petrophysical Characterization of Carbonate Naturally fractured Reservoir for
Use in Dual Porosity Simulator, Proceeding, Thirty-Second Workshop on
Geothermal Reservoir Engineering, Stanford University, Stanford,
California, January 22-24. SGP-TR-183.
Quintero, L.F Ramirez, M.O., and Intenvep, S.A. (1992). Determination of True
Resistivity (Rt) in Thin Beds Using Micro Resistivity Logs, SPE Latin
America Petroleum Engineering Conference, 8-11 March, Caracas,
Venezuela, SPE - 23669-MS.
Raiga-Clemenceau, J. (1977). The Cementation Exponent in the Formation factor-
Porosity Relation: The Effect of Permeability. SPWLA 18th Annual Logging
Symposium, 5-8 June, Houston, Texas, SPWLA-1977-R.
Ransom, R.C. (1974). A Theory Based on a New Reservoir Rock Resistivity Model:
The Bulk Volume Water Concept of Resistivity Well Log Interpretation, The
Log Analysis, 15 (01), SPWLA-1974.
Ransom, R.C. (1984). A Contribution toward a Better Understanding of the
Modified Archie Formation Resistivity Factor Relationship, the Log Analysis,
25 (02), SPWLA-1984.

173
Rasmus, J.C. (1986). A Summary of the Effects of Various Pore Geometries and
Their Wettability on Measured and In-Situ values of Cementation and
Saturation Exponents, SPWLA 27th
Annual Logging Symposium, 9-13 June,
Houston, Texas, SPWLA-1986-PP.
Repsol Company, (2008). Integrated Reservoir Study of the NS Oilfield,
Unpublished study
Rezaee, R. M.., Kadkhaodaie-Ilkhchi A., and Alizadeh M. P. (2007). Intelligent
Approaches for the Synthesis of Petrophysical logs, Journal of Geophysics
and Engineering, 5 (1), 12-26.
Rodriguez, A. R.and Pirson, S. J. (1965). The Continuous Dip-meter as a Tool for
Studies in Directional Sedimentation and Directional Tectonics, SPWLA 9th
Annual Logging Symposium, 23-26 June, New Orleans, Louisiana, SPWLA-
1968-G.
Rojas, R. (2005). Neural Networks: A Systematic Introduction, Berlin, Springer-
Verlag.
Rose, W. and Bruce, W.A. (1949). A Note on the Theoretical Description of Wetting
Liquid Relative Permeability Data, Journal of Petroleum Technology, 1 (09),
SPE-949929-G
Ruhovets, N. andFertl, W. H. (1982).Volumes, Types and Distribution of Clay
Minerals in Reservoir Rocks Based on Well Logs, SPE Unconventional Gas
Recovery Symposium, 16-18 May, Pittsburgh, Pennsylvania, SPE-10796-MS.
Saemi, M. and Ahmadi, M. (2008). Integration of Genetic and a Coactive Neuro-
Fuzzy Inference System for Permeability Prediction from Well Logs Data,
Transport in Porous Media, 71(3), 273-288.
Saggaf, M. M. and Nebrija, E. L. (2003). A fuzzy Logic Approach for the Estimation
of Lithologies and Depositional Facies from Wire-line Logs, AAPG Bulletin,
87(7), 1223-1240.
Salazar, J. M., Wang, G. L., Torres-Verdín, C., and Lee, H. J. (2008). Combined
Simulation and Inversion of SP and Resistivity Logs for The Estimation of
Connate Water Resistivity and Archie’s Cementation Exponent. Geophysics,
73 (3), 107-114.
174
Salem, H. S. (1993). Derivation of the Cementation Factor (Archi's Exponent) and
the Kozeny-Carman Constant From Well Log Data, and Their Dependence
on Lithology and Other Physical Parameters. Society of petroleum
Engineering Journal, SPE-26309-MS, 1-26.
Saljooghi, B. S., and Hezarkhani, A. (2014). Comparison of WAVENET and ANN
for predicting the porosity obtained from well log data. Journal of Petroleum
Science and Engineering, 123, 172-182.
Saner, S., Kissami, M., and Al-Nufaili, S. (1997). Estimation of Permeability from
Well Logs Using Resistivity and Saturation Data, SPE formation Evaluation,
12 (1) SPE-26277-PA.
Schlumberger, (1989). Log Interpretation-Principles/Applications, Eight Printing,
Sugar Land, Texas.
Schlumberger, (2005). Log Interpretation Charts, 2005, Edition: Schlumberger,
Sugar Land, Texas.
Schlumberger, (2008). IP- Interactive Petrophysics V-3.5, Manual.
Serra, O. (1986), Advanced Interpretation of Wire-line Logs, (pp.125-130), Texas,
Schlumberger.
Shokir, E. M.; El-MAlsughayer, A. A., and Al-Ateeq, A. (2006). Permeability
Estimation from Well Logging Responses, Canadian International
Petroleum Conference, 7-9 June, Calgary, Alberta,PETSOC-2005-012.
Simmons, G., and Brace, W. F. (1965). Comparison of Static and Dynamic
Measurements of Compressibility of Rocks, Journal of Geophysical
Research, 70(22), 5649-5656.
Simon, H. (1999). Neural Network – a Comprehensive Foundation, India, Pearson
Prentice Hall.
Stein, N. (1975). Mechanical Properties of Friable Sands from Conventional Log
Data, Journal of Petroleum Technology, 28 (7), SPE-5500-PA.
Sutton, E. W. (1961). An Evaluation of Electric and Sonic Logs in the Delaware
Sand in the Ford and Geraldine Flied, Reeves and Culberson Countries,
SPWLA 2nd
Annual Logging Symposium, 18-19 May, Dallas, Texas, SPWLA-
1961-H.

175
Tabbibi, M., and Emadi, M.A. (2003). Variable Cementation Factor Determination
(Empirical Methods), Middle East Oil Show, 9-12 June, Bahrain, SPE-81485-
MS.
Taib, J. and Donaldson, E.C. (2004). Petrophysics; Theory and Practice of
measuring Reservoir Rock and Transport Properties, 2nd Edition, UK,
Elsevier.
Tania, B. (2003). Evolving Neural Network Architecture and Weights Using an
Evolutionary Algorithm, M.Sc. Thesis, Department of Computer Science,
RMIT University, Australia.
Tatham, R. (1982). Vp/Vs and lithology, Geophysics, 47 (3), 336–344
Thomas, E.C. and Stieber, S.J. (1975). The Distribution of Shale in Sandstones and
Its Effect upon Porosity, SPWLA 16th
Annual Logging Symposium, 4-7 June,
New Orleans, Louisiana,SPWLA-1975-T.
Thornton, O.F. (1949). A Note on the Evaluation of relative Permeability,
Transactions of the AIME, 186 (1), 328-328, SPE-949328-G.
Timur, A. (1968). An Investigation Permeability and Porosity, and Residual Water
Saturation Relationships, SPWLA 9th
Annual Logging Symposium, 23-26
June, New Orleans, Louisiana, SPWLA-1968-J.
Tixire,M.P, Etonn, F.M. Tanguy, D.R. and Biggs, W.P. (1965). Automatic Log
Computation at Well site Formation Analysis Logs, SPWLA 6th Annual
Logging Symposium, Vol. I, 4-7 May, Dallas, SPWLA-1965-B.
Tixier, M.P., Alger, R.P., and Doh, C.A. (1980). Sonic Logging, Petroleum
Transactions, AIME, 216 (1959), 106-114,SPE-1115-G.
Toby, D. (2005). Well Logging and Formation Evaluation,(pp.37-40), USA,
Elsevier.
Tutuncu, A. N., and Sharma, M. M. (1992). Relating Static and Ultrasonic
Laboratory Measurements to Acoustic log Measurements in Tight Gas Sands,
SPE Annual Technical Conference and Exhibition, 4-7 October, Washington,
D.C, SPE-24689-MS.
Tutuncu, A. N., Podio, A. L., and Sharma, M. M. (1998). Non-linear Viscoelastic
Behaviour of Sedimentary Rocks, Part I: Effect of Frequency and Strain
Amplitude, Geophysics, 63 (1), 184-194.

176
Van Golf-Rachet T.D. (1982). Fundamentals of Fractured Reservoir Engineering,
Amsterdam, the Netherlands, Elsevier Scientific Publishing Company.
Vera Lucia, G.E. and Daniel, E.S. (1996). The Impact of the Values of Cementation
Factor and Saturation Exponent in the Calculation of Water Saturation for
Macae Formation, International Symposium of the Society of Core Analysts
(SCA), September 8-10, Montpellier, France, SCA-9611.
Wadhwa, R.S., Ghosh, N., and Subba, C.R. (2010). Empirical Relation for
Estimating Shear Wave Velocity from Compressional Wave Velocity of
Rocks, J. Ind. Geophysics. Union, 14 (1), 21-30.
Wafa, A.,and Jasim, A. (2012). Estimation of the Rock Mechanical Properties Using
Conventional Log Data in North Rumaila Field, IJCPE, 13 (4), 27-33.
Walls, J.D., and Jack, D.R. (1994). Measured and Calculated Horizontal Stresses in
the Travis Peak Formation. SPE Formation Evaluation, 9(04), SPE-21843
Wang, P. M. and Nikravesh, M. (2001). Field Application of Intelligent Computing
Techniques, J. of Petroleum Geology, 24(4), 381-387.
Wardlaw, N.C. (1980). The Effects of Pore Structure on Displacement Efficiency in
Reservoir Rocks and in Glass Micro-models, SPE/DOE Enhanced Oil
Recovery Symposium, 20-23 April, Tulsa, Oklahoma, SPE-8843-MS.
Watfa, M.and Youseef F.Z. (1987). An Improved Technique for Estimating
Permeability in Carbonates, the Middle East Oil Show, 7-10 March, Bahrain,
SPE-15732-MS.
Waxman, M.H., and Smith, L.M. (1968). Electrical Conductivity in Oil-Bearing
Shely- Sand, SPE 42nd
Annual Fall Meeting, Houston, Texas, Oct. 1-4, 1967,
SPE-1863-A.
White, H. (1992). Artificial Neural Networks: Approximation and learning theory
.Oxford, Basil Blackwell.
Winsauer,W.O.,Shearin, H.M., Masson, P.H. and Williams, M. (1952). Resistivity of
Brine Saturated Sands in Relation to pore Geometry, AAPG Bulletin, 36,(2),
253-277.
Wong, P.M., Henderson, D.J., Brooks, L.J., (1997). Reservoir Permeability
Determination from Well Log Data Using Artificial Neural Networks: an
Example from the Ravva Field, Offshore India, SPE Asia Pacific Oil and Gas
Conference, Kuala Lumpur, Malaysia,14–16 April, 149-155, SPE 38034.

177
Wong, P., Amnizadeh F. and Nikravesh, M. (2002). Soft Computing for Reservoir
Characterization and Modelling Soft Computing and Earth Science, Berlin:
Springer-Verlag.
Wyllie, M.R.J., and Rose, W.D. (1950). Some Theoretical Considerations Related to
the Quantitative Evaluation of the Physical Characteristics of Reservoir
Rocks from Electrical Log Data, Journal of Petroleum Technology, 2 (04),
105-118, SPE-950105-G.
Xu, C., Heidari, Z., and Torres-Verdin, C (2012). Rock Classification in Carbonate
Reservoirs Based on Static and Dynamic Petrophysical Properties Estimated
from Conventional Well Logs. SPE Annual Technical Conference and
Exhibition, 8-10 October, San Antonio, Texas, USA, SPE-159991MS.
Yale, D. P., and. Jamieson, W. H (1994). Static and Dynamic Rock Mechanical
Properties in the Hugoton and Panoma Fields, Kansas, SPE Mid-Continent
Gas Symposium, 22-24 May, Amarillo, Texas, SPE-27939-MS, 209-219.
Yu, J.H.Y. and Smith, M. (2011). Carbonate Reservoir Characterization with Rock
Property Invasion for Edwards Reef Complex, the 73rd
EAGE Conference and
Exhibition incorporating SPE Europe, 23 -26 May, Vienna, Austria, 346-
350.
Zeldin B.A. and Meada A. J. (1998). Ensure Successful Feedforward Artificial
Neural Network Modelling of Mechanical Systems, Math. Comp. Modelling,
27 (5), 61-74.
Zeng Q., Zu J., Zhang L., and Dai G. (2002). Designing Expert System with
Artificial Neural Networks for in Situ Toughened Si3 N4, Materials and
design Journal, 23 (3), 287-290.
Zhang Y., Salisch H.A. and Arns C. (2000). Permeability evaluation in a glauconite-
rich formation in the Carnarvon Basin Western Australia, Geophysics, 65 (1),
46-53.
Zinszner, B., and Pellerin, F. M. (2007). A geoscientist's guide to Petrophysics,
Editions Ophrys. (pp. 221-249), Paris, IFP Publications.


