Center for Adaptive Design Update Michael Thieme, Ben Reist Center for Adaptive Design Research and Methodology Directorate U.S. Census Bureau Presented to the Census Scientific Advisory Committee March 30, 2017
Transcript
Center for Adaptive Design Update
Michael Thieme, Ben Reist
Center for Adaptive Design
Research and Methodology Directorate
U.S. Census Bureau
Presented to the Census Scientific Advisory CommitteeMarch 30, 2017
Overview Improved survey representativeness without affecting
response rates when compared to experimental control groups
Enabled case prioritization that helps survey directors make informed cost/quality trade-off decisions during data collection operations
Strengthened the Census Bureau Research and Methodology Directorate as an essential innovation partner with internal program areas and with our external partners
2
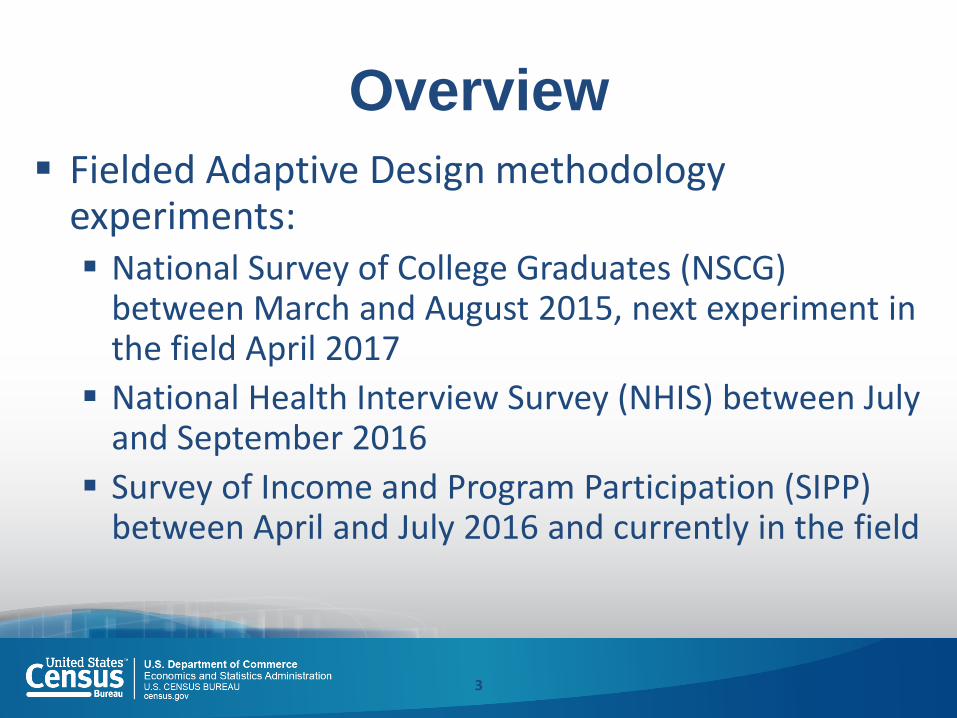
Overview
Fielded Adaptive Design methodology experiments: National Survey of College Graduates (NSCG)
between March and August 2015, next experiment in the field April 2017
National Health Interview Survey (NHIS) between July and September 2016
Survey of Income and Program Participation (SIPP) between April and July 2016 and currently in the field
3
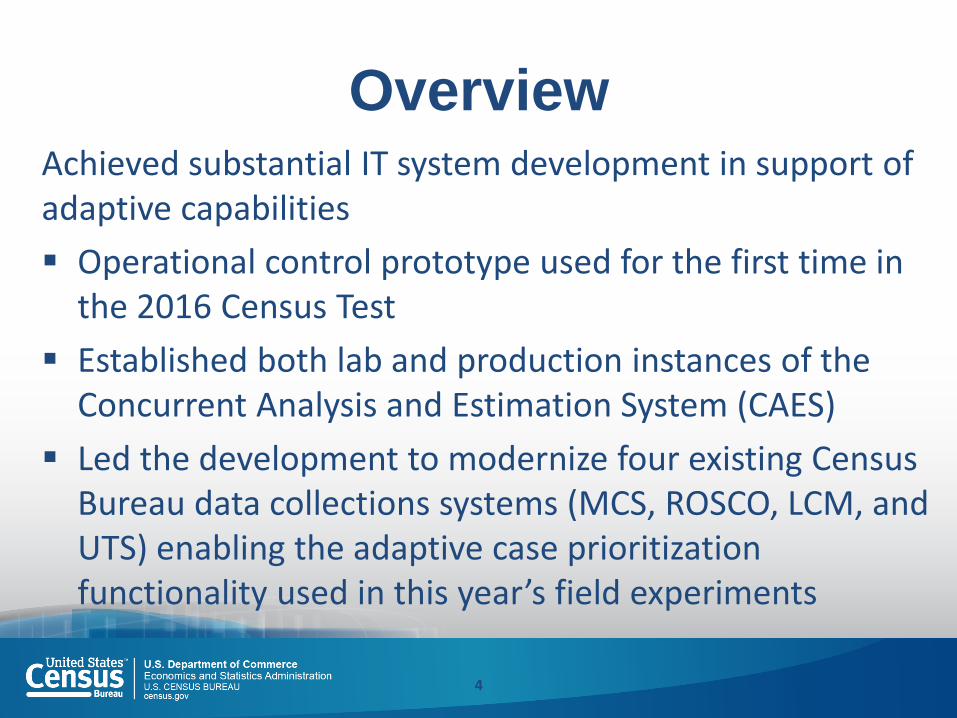
OverviewAchieved substantial IT system development in support of adaptive capabilities
Operational control prototype used for the first time in the 2016 Census Test
Established both lab and production instances of the Concurrent Analysis and Estimation System (CAES)
Led the development to modernize four existing Census Bureau data collections systems (MCS, ROSCO, LCM, and UTS) enabling the adaptive case prioritization functionality used in this year’s field experiments
4
National Survey of College
Graduates (NSCG)
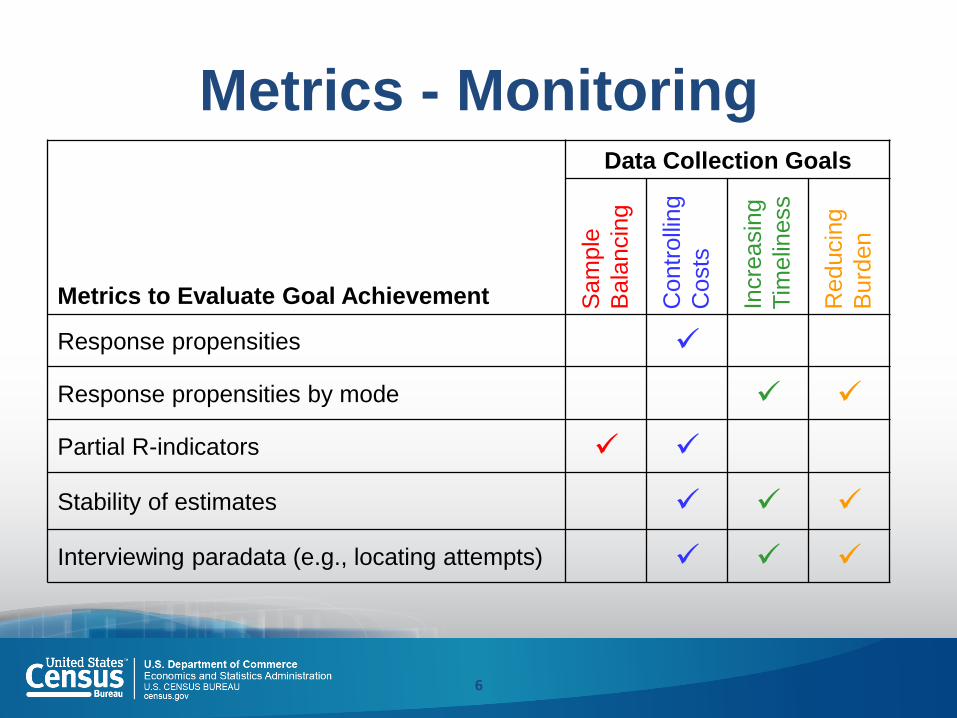
Metrics - Monitoring
6
Metrics to Evaluate Goal Achievement
Data Collection Goals
Sam
ple
Bala
ncin
g
Contr
olli
ng
Costs
Incre
asin
g
Tim
elin
ess
Reducin
g
Burd
en
Response propensities
Response propensities by mode
Partial R-indicators
Stability of estimates
Interviewing paradata (e.g., locating attempts)
R-Indicators
Sample R-Indicators
Evaluate representativeness of respondent population as
compared to the sample population, given a set of
balancing variables
Unconditional Partial R-Indicators
Variable-Level
Evaluate which variables are driving the variation in propensities
Category-Level
Evaluate which subgroups of a variable or a cross of variables are
over- or under-represented
N
i
i
i
is
NR
1
2)ˆˆ(1
121)ˆ(
K
k
xkxk
uN
NR
1
2
, )ˆˆ()ˆ(var,
)(),(var, , xkxk
uN
NkR
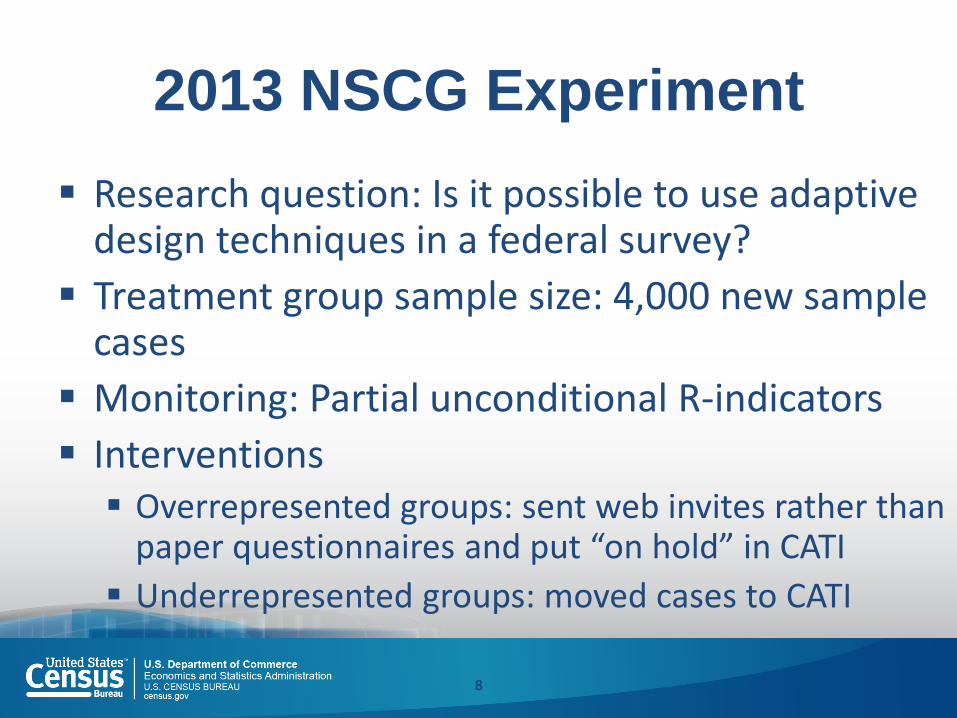
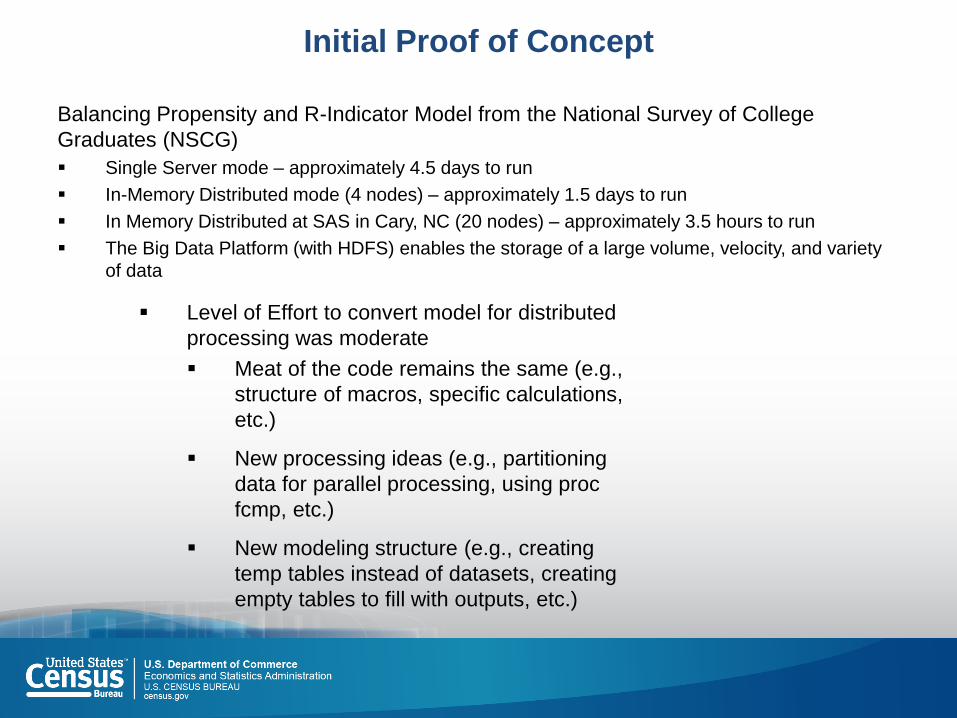
2013 NSCG Experiment
Research question: Is it possible to use adaptive design techniques in a federal survey?
Treatment group sample size: 4,000 new sample cases
Monitoring: Partial unconditional R-indicators
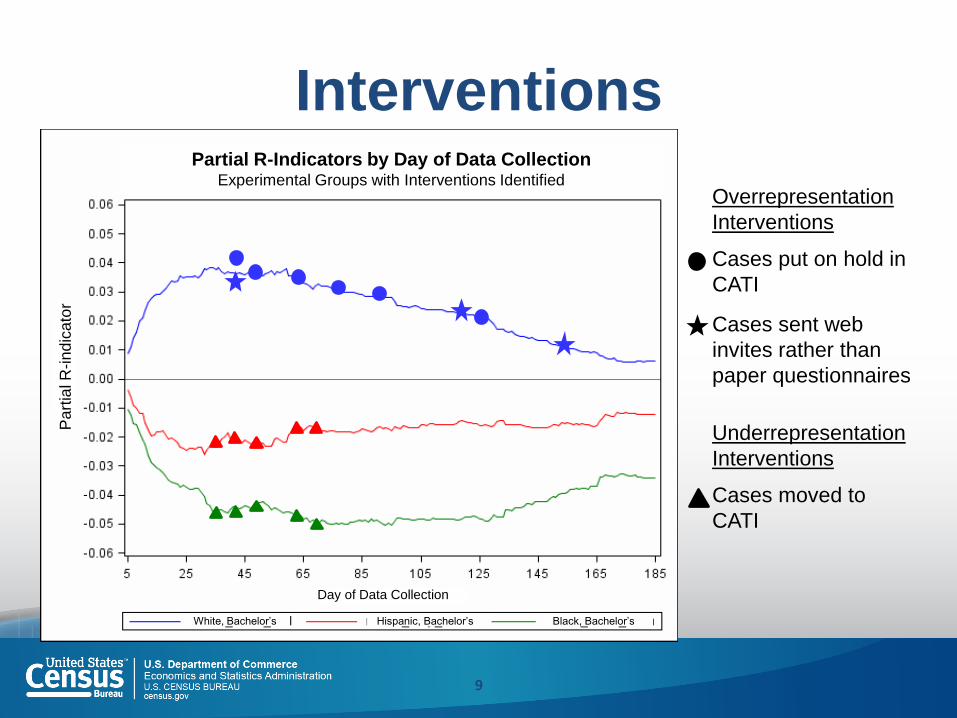
Interventions Overrepresented groups: sent web invites rather than
Targeted incentive in production for all cases Will incentive remove need for mode switching?
OMB involvement
13
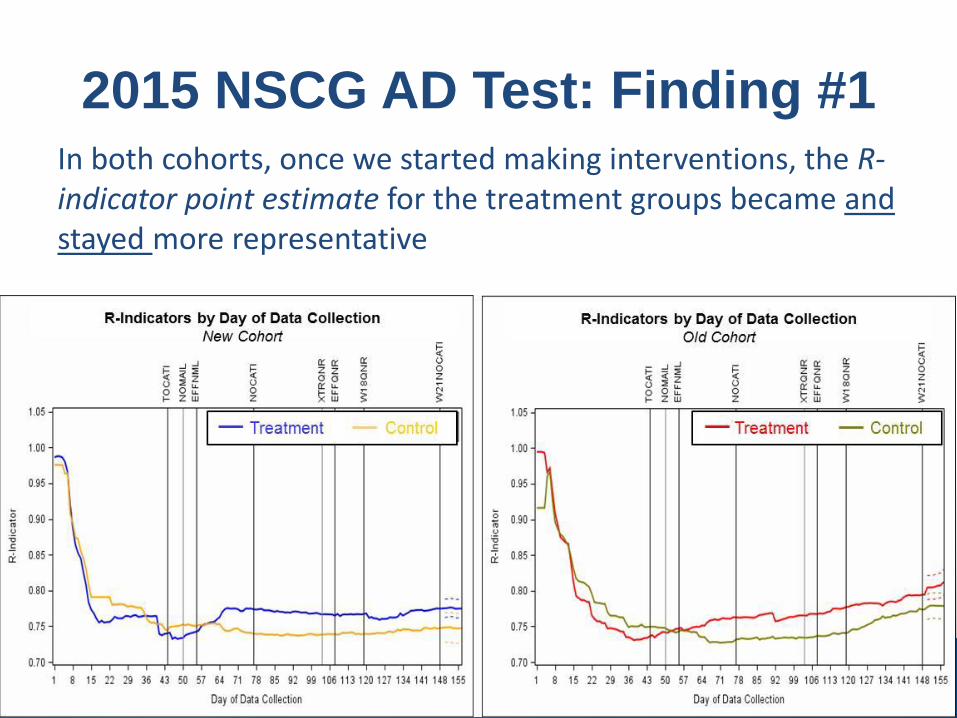
2015 NSCG AD Test: Finding #1In both cohorts, once we started making interventions, the R-indicator point estimate for the treatment groups became and stayed more representative
14
2015 NSCG AD Test: Finding #2In both cohorts, we were able to reallocate resources through interventions without any adverse impact on response rate.
15
2015 NSCG AD Test: Finding #3For the treatment groups in both cohorts, the improvement in variable-level representation is statistically significant for the variables on which we intervened (age x income, age).
16
Conclusions & Successes 2015
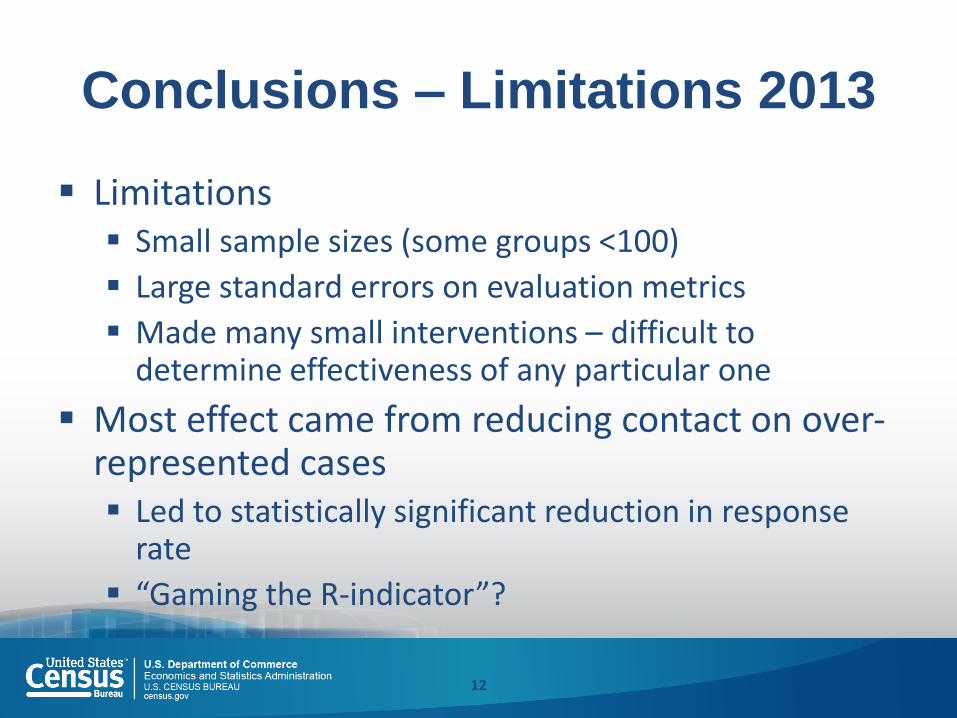
Dynamic adaptive design requires a lot of planning, effort, and oversight
All of the interventions were designed to improve sample balance concerns
Interventions improved representation (sample balance) without any significant reduction in response Likely due to the combination of the targeted
incentive and adaptive design
17
Case Prioritization in the NHIS:
Q3 2016
Motivation
Case prioritization Help reach data collection goals subject to constraints
Increase representativeness for a given cost
Maintain response rate for a lower cost
Idea is to alter the effort an interviewer spends on a case Need to define data collection goals
Assign relative values to cases
Can be applied adaptively Take advantage of information acquired during data collection
Contact History Instrument
Neighborhood Observations (uncommon at Census)
Cross-sectional survey – cannot leverage past responses
19
Conceptual Overview
Existing structure: Four-week data collection First visit attempt: Neighborhood Observation Instrument (NOI)
Some items correlated with NHIS outcomes of interest
All contact attempts: Contact History Instrument (CHI) Some items correlated with response propensity / effort
Additional information Sample information: weights, geocodes/location Planning Database (PDB): block-group level aggregate data
Some items correlated with NHIS outcomes or effort
Have this information before data collection starts
Leverage all of this information: Assign values and prioritize
20
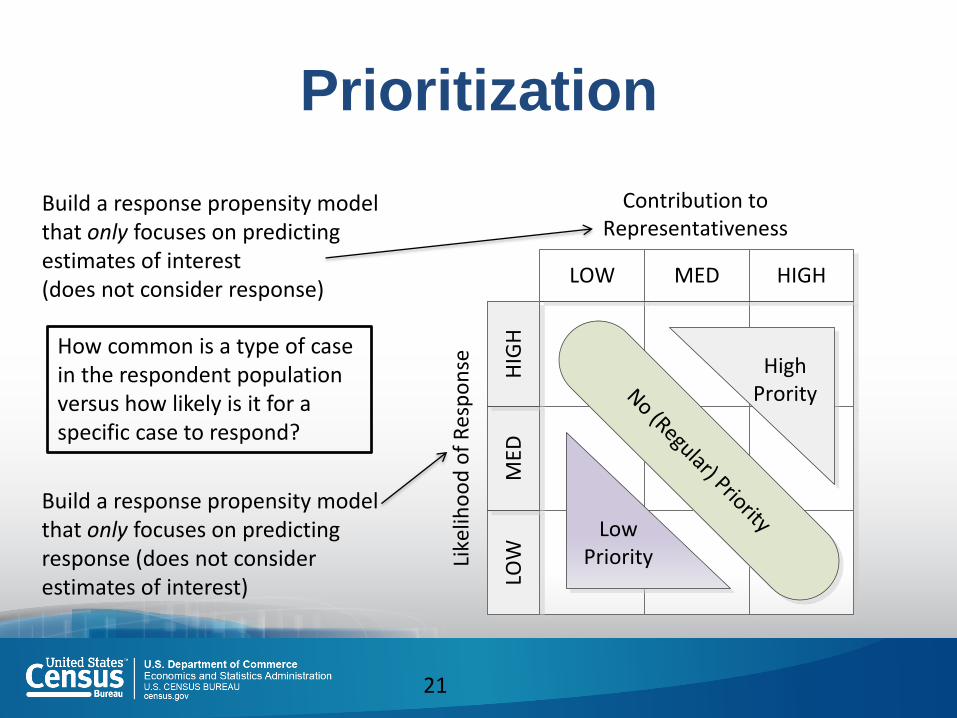
Prioritization
21
LOW MED HIGH
Contribution to Representativeness
LOW
MED
HIG
H
Like
liho
od
of
Res
po
nse High
Prority
Low Priority
No (Regular) PriorityBuild a response propensity model that only focuses on predicting response (does not consider estimates of interest)
Build a response propensity model that only focuses on predicting estimates of interest (does not consider response)
How common is a type of case in the respondent population versus how likely is it for a specific case to respond?
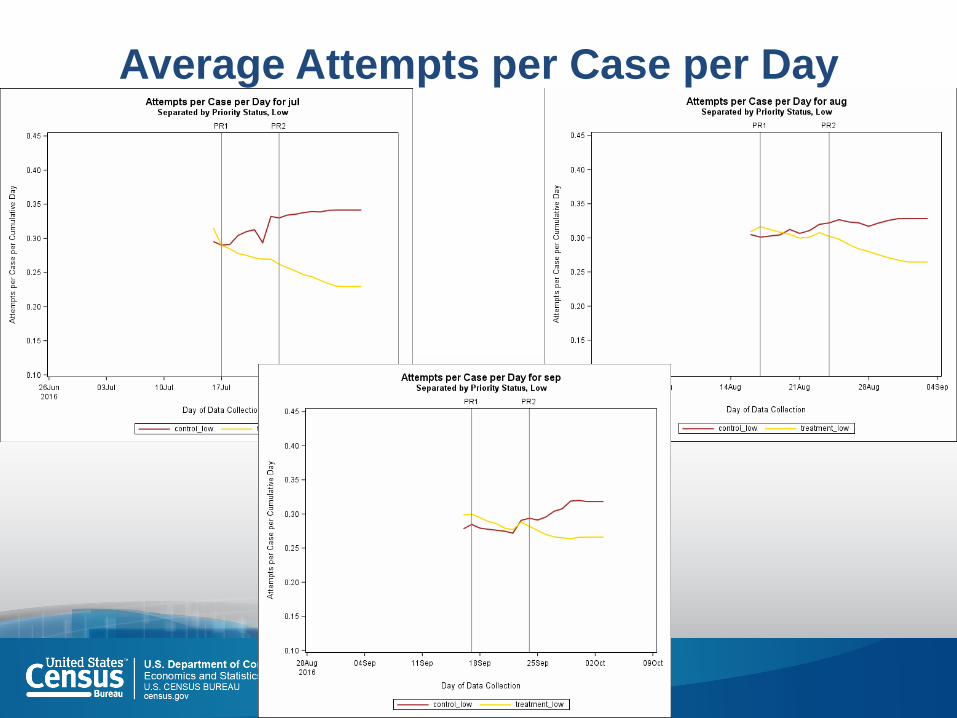
Average Attempts per Case per Day
22
Does Prioritization Improve Outcomes?
In July: Higher attempt rates in High Priority cases
Did this result in: Higher Contact Rates (Contact per Attempt Rate)?
Higher Completion Rate (Completions per Contact)?
Interviewers shifted effort in an effective way
Did not translate to top-line outcomes: Small amount of prioritization (20% of open T cases)
Translates to about 7% of total workload
23
Does Prioritization Improve Outcomes?
24
Does Prioritization Improve Outcomes?
25
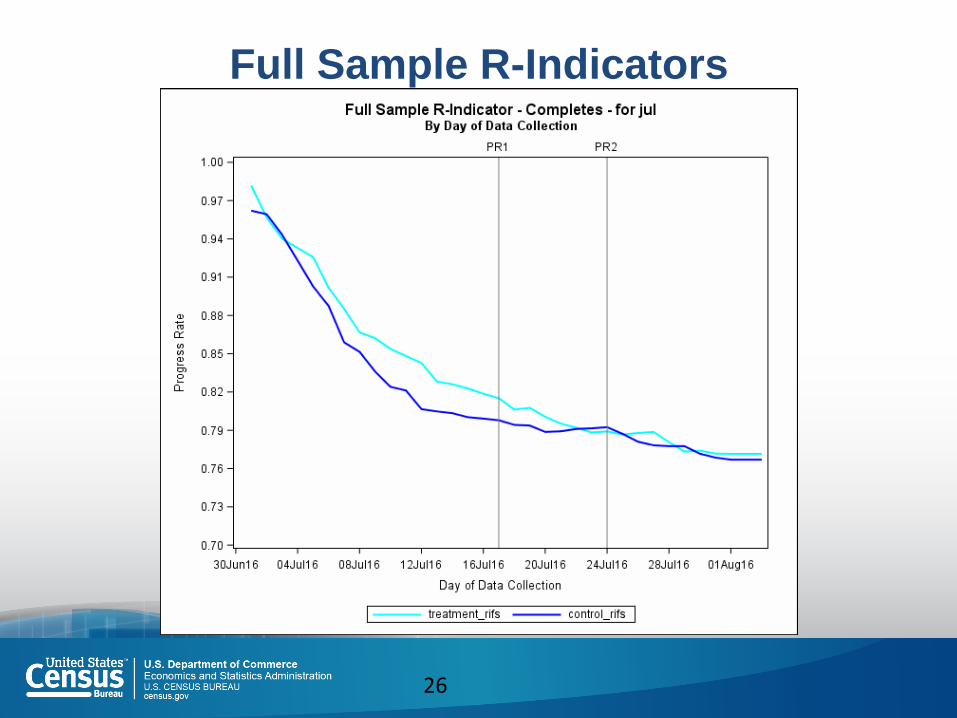
Full Sample R-Indicators
26
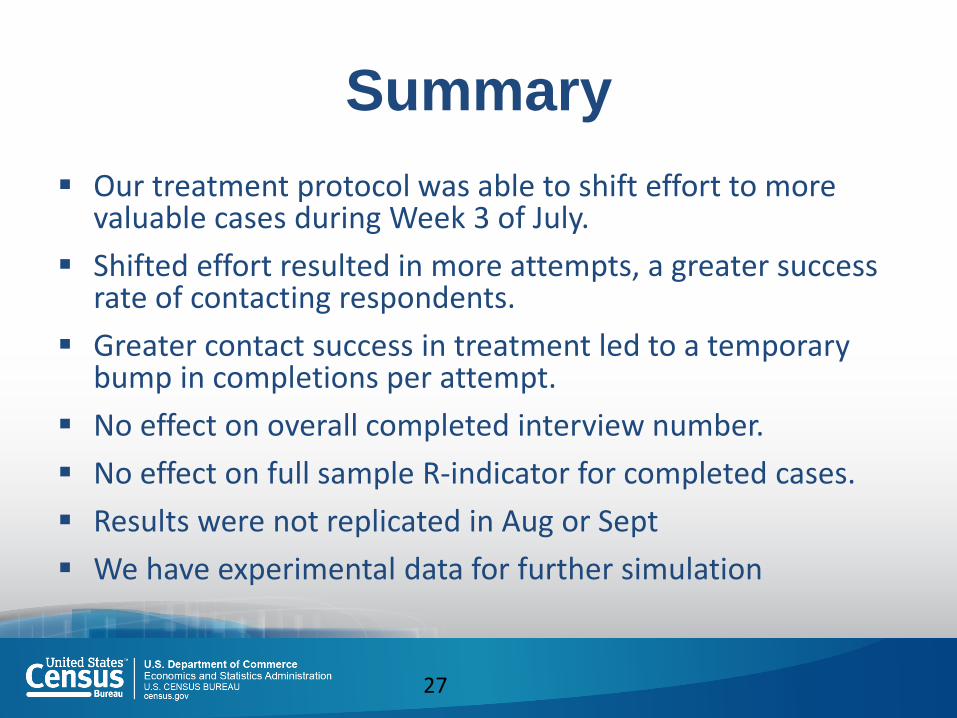
Summary
Our treatment protocol was able to shift effort to more valuable cases during Week 3 of July.
Shifted effort resulted in more attempts, a greater success rate of contacting respondents.
Greater contact success in treatment led to a temporary bump in completions per attempt.
No effect on overall completed interview number.
No effect on full sample R-indicator for completed cases.
Results were not replicated in Aug or Sept
We have experimental data for further simulation
27
Field Implementation Issues
Design: Case Sharing Cases sometimes assigned to multiple FRs or both
T/C FRs
Causes difficulty in implementation and evaluation
Experiment: No Metrics Tied to Protocol Interviewers followed protocol in July
Seemed to fall into past behavior for Aug, Sept
Need to provide clear metrics for continued compliance
28
Average Attempts per Case per Day
29
Concurrent Analysis and
Estimation System (CAES)
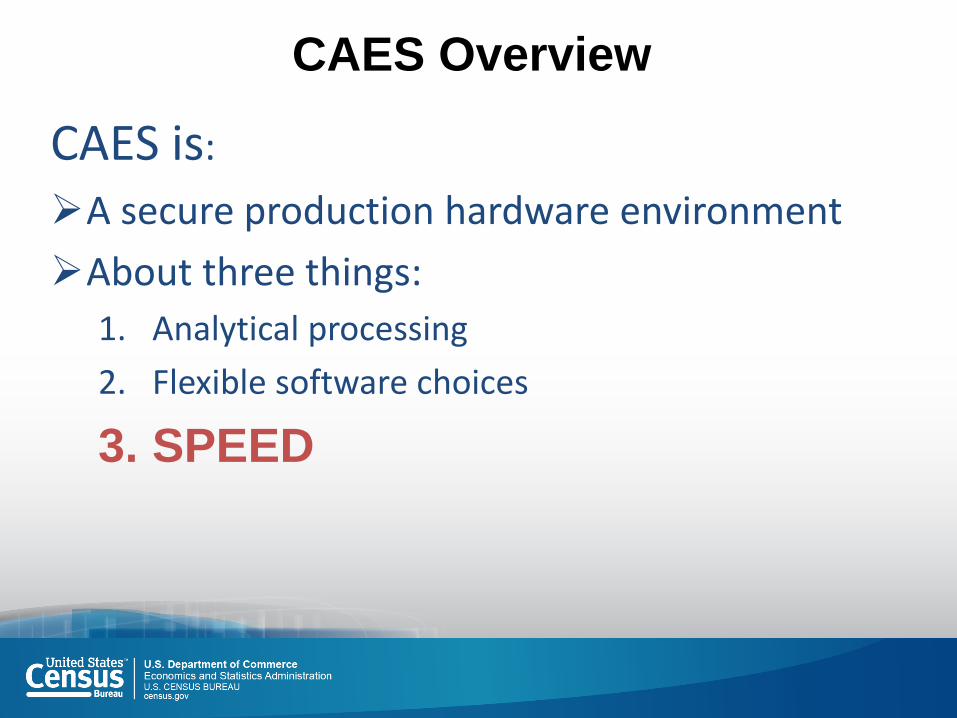
CAES is:
A secure production hardware environment
About three things:
1. Analytical processing
2. Flexible software choices
3. SPEED
CAES Overview
CAES Information Architecture
Load Survey-Specific Data (Pre-Data Collection)
• Historical Paradata
• Historical Response Data
• Administrative Data
• Sample Delivery File (SDF)
• FR Information Data
• Sample Design Data
• Auxiliary Data
• Frame Data
CAES
ESB
UTSCaRDS ECaSE – FDCECaSE – OCSAdRecs
CDAL
Execute ModelsDeliver Model
Outputs
Load Production Data (During Data Collection)
• Response Data
• Case Status Data
• Frame Updates
• Production Paradata
• FR Assignment Data
CAES User ViewCAES
Develop models using a variety of programming languages and
request the data you need
Explore your results and create interactive visualizations
Tools………..………..………..………..……….. proc logistic;
… …… …. ..… …… … ..… …run;
Log………..………..………..
Monitor and manage the entire platform with one unified UI
Developers
Admins
Survey Statisticians
Math Statisticians
Researchers
Get direct access to data you need to test and execute statistical models
FR Data
Frame Data
Historical Responses
Admin. Records
Model Results
Shared Models
Production Snapshots
User Workspaces
Paradata
Case Status Data
Response Data
Request when and how frequently you want models to run