+ All Categories
Home > Documents > Central Bank

Central Bank

Date post: 02-Dec-2015
Category:
Upload: deepti-sharma
View: 16 times
Download: 0 times
Share this document with a friend
Description:
financial analysis of cbi
Popular Tags:
83
PROJECT REPORT ON FINANCIAL ANALYSIS OF CENTRAL BANK OF INDIA SUBMITTED TO: GURU GOBIND SINGH INDRAPASTH UNIVERSITY In partial fulfilment of the requirement For the award of the degree of BACHELORS OF BUSINESS ADMINISTRATION 2012-2015 SUBMITTED TO SUBMITTED BY MS DEEPTI GAUR ABHISHEK CHAWLA Enrolment No: 1
Transcript

PROJECT REPORT

ON

FINANCIAL ANALYSIS OF CENTRAL BANK OF INDIA

SUBMITTED TO:

GURU GOBIND SINGH INDRAPASTH UNIVERSITY

In partial fulfilment of the requirement

For the award of the degree of

BACHELORS OF BUSINESS ADMINISTRATION

2012-2015

SUBMITTED TO SUBMITTED BY MS DEEPTI GAUR ABHISHEK CHAWLA

Enrolment No:

NEW DELHI INSTITUTE OF MANAGEMENT

TUGHLAKABAD INDUSTRIAL AREA

NEW DELHI-110062

61, Tughalkabad, New Delhi-110062

1

ACKNOWLEDGEMENT

The present work is an effort throws some light on “Financial Analysis of CENTRAL

BANK OF INDIA”. The work would not have been possible to come to the present shape

without the able guidance, supervision and help to me by number of people.

With deep sense of gratitude I acknowledge the encouragement and guidance receive by

DEEPTI GAUR (Faculty Guide)

I convey my affection to all those people who helped and supported me during the course,

for completion of my Project Report.

ABHISHEK CHAWLA

BBA (3TH sem)

2

CERTIFICATE

This is to certify that ABHISHEK CHAWLA has successfully completed the research

Project titled “Financial Analysis of CENTRAL BANK OF INDIA” as the partial

fulfilment of the requirement for the award degree of Bachelor of Business Administration

(BBA) by Guru Gobind Singh Indraprastha University, during batch 2014-2017.

To best of my knowledge the report is original and has not been copied or submitted

anywhere else. It is an independent work done by him.

DEEPTI GAUR

(Faculty Guide)

3

TABLE OF CONTENTS

S.No. CONTENTS PAGE NO.

COVER PAGE 1

  ACKNOWLEDGEMENT 2

  CERTIFICATE 3

1 INTRODUCTION TO THE STUDY 6

1.1 BRIEF OVERVIEW OF STUDY 7

1.2 OBJECTIVES OF THE STUDY 7

1.3 SCOPE OF THE STUDY  7

1.4 LIMITATIONS OF THE STUDY 8

2 RESEARCH METHODOLOGY 9

2.1 STATEMENT RESEARCH 10

2.2 DATA COLLECTION 10

2.3

2.4

PRESENTATION TOOLS USED 

RESEARCH TOOLS USED

11

11

3 INDUSTRY OVERVIEW 12

3.1 PAST, PRESENT AND FUTURE TRENDS 13-14

3.2 MAJOR PLAYERS AND THEIR RESPECTIVE MARKET SHARE 15–17

4 COMPANY PROFILE 18

4.1 HISTORY 19

4.2 VISION, MISSION AND OBJECTIVES OF THE COMPANY 19

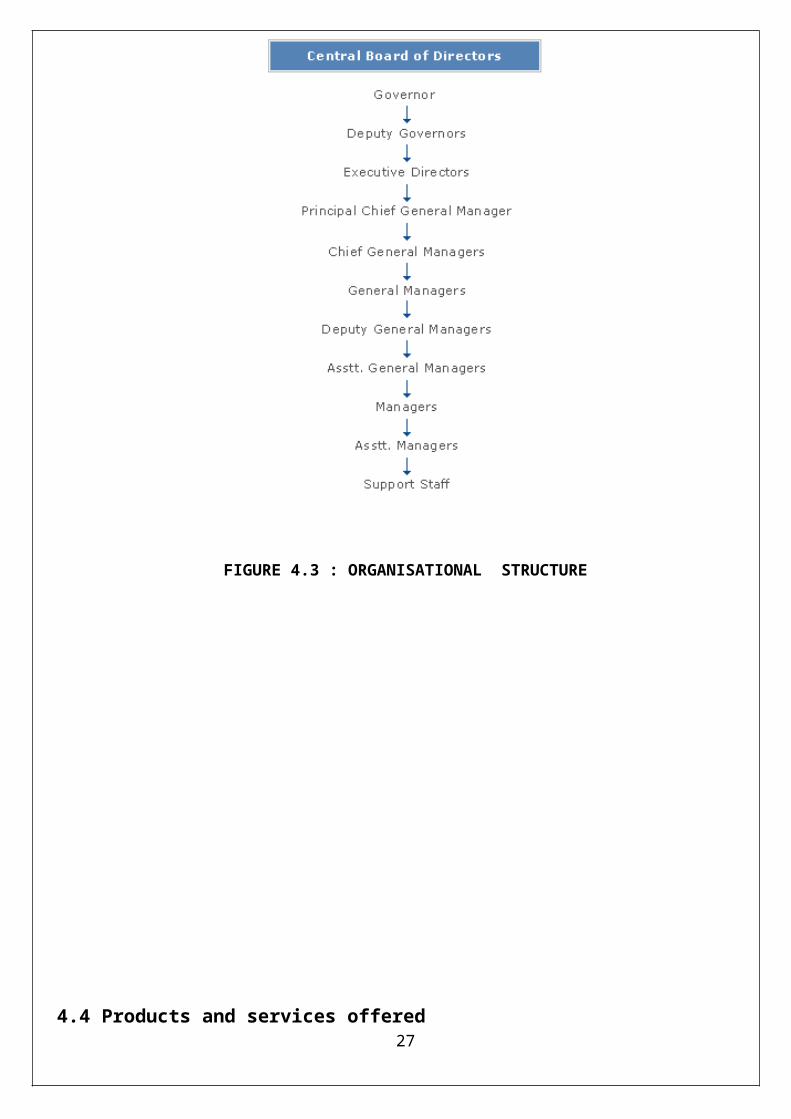
4.3 ORGANIZATIONAL STRUCTURE 20

4.4  PRODUCTS AND SERVICES OFFERED 21-22

4.5 MARKETING STRATEGY FOR CUSTOMERS 23-24

4

5 THEORETICAL PERSPECTIVE                 25-28

6 FINDINGS AND ANALYSIS 29

6.1 GENERAL FINDINGS 30-60

7 CONCLUSION AND RECOMMENDATIONS 61

7.1 SUGGETIONS 62

7.2 CONCLUTION 63


BIBLOGRAPHY

COMPARITIVE BALANCE SHEETS

64

65-72

5

CHAPTER-1

INTRODUCTION TO THE STUDY

6

1.1 BRIEF OVERVIEW OF THE STUDY

A financial ratio is a relative magnitude of two selected numerical values taken from an

enterprise's financial statements. Often used in accounting, there are many standard ratios used to try to

evaluate the overall financial condition of a corporation or other organization. Financial ratios may be used

by managers within a firm, by current and potential shareholders (owners) of a firm, and by a

firm's creditors. Financial analysts use financial ratios to compare the strengths and weaknesses in

various banks.

1.2 OBJECTIVES OF THE STUDY

This study is mainly focused to examine the overall financial viability of CENTRAL BANK OF INDIA as

stated below:

To study the financial position of CENTRAL BANK OF INDIA.

To study the periodic changes in the financial performance of CENTRAL BANK OF INDIA by

preparing Comparative balance sheet

To find out the financial strengths and weaknesses of the company.

To study the overall operating efficiency and performance of the company.

The study is conducted to evaluate the returns to the company.

1.3 SCOPE OF THE STUDY

The study has great significance and provides benefits to various parties who directly or indirectly interact

with the banks.

It is beneficial to the top management of the banks by providing crystal-clear picture regarding to the

important financial aspects of CENTRAL BANK OF INDIA.

The study is beneficial to Employees and offer motivation by showing how actively they are

contributing for the banks growth.

The investors who are interested in investing in the banks share’s will also get benefit by

going through the study and can easily take a decision whether to invest in the bank’s shares.

7

1.4 LIMITATIONS OF THE STUDY

The information used is primarily from historical reports available to the public and the same doesn’t

indicate the current situation of the firm.

Detailed analysis could not be carried for the project work because of limited time span.

Since financial matters are sensitive in nature the same could not be acquired easily.

If there is anything wrong in the balance sheet (data provided), then the ratios calculated can also be

wrong.

8

CHAPTER-2

RESEARCH METHODOLOGY

9

2.1 STATEMENT RESEARCH

This project “Financial Analysis“is based on the information collected from the annual reports and balance

sheets of the company.

“According to Kennedy and Muller”

The analysis and interpretation of financial statements reveal each and every aspect

regarding the well being financial soundness, operational efficiency and credit worthiness of the company.

2.2 DATA COLLECTION

PRIMARY DATA:

Primary data are those, which are collected are fresh and for the first time, and thus happen to be original in

character. Primary Data has been collected by conducting surveys through Questionnaire, which include

both open ended and close-ended Questions.

SECONDARY DATA: 

Secondary data have been the sources of data. The major source of secondary data was annual report of

central bank of India for years 2012-13, 2013-14 and 2014-2015 from of the comparative balance sheet of

the company.

These are sources containing data which have been collected and compiled of or another purpose. The

secondary sources consists of readily available compendia and already compiled statistical statements and

reports whose data may be used by researches for their studies, e.g., census reports, annual

reports and financial statements of companies, statistical statements, reports of government departments,

annual reports on currency and finance published by the reserve bank of India.

10

2.3 PRESENTATION TOOLS USED:

The following are some tools to analyses the financial Performance of the company:

1. Bar graphs

2.4 RESEARCH TOOLS USED:

1. Ratio Analysis

2. Comparative balance sheet

11

CHAPTER -3

INDUSTRY OVERVIEW

12

3.1 Past, Present, Future Trends

The Indian banking industry is a key driving force of the Indian economy and the most dominant segment

of the financial sector. Banks in India are classified into commercial banks comprising: 1) scheduled

commercial banks (SCBs) and non-scheduled commercial banks; and 2) co-operative credit institutions that

include various co-operative banks. SCBs are further classified into public sector banks (PSBs), private

banks, foreign banks and regional rural banks (RRBs).

Financial sector reforms since the early 1990s have resulted in a competitive, healthy and resilient banking

system. Looking back over the past 20 years, there have been massive changes in the banking sector, which

have completely changed the nature of intermediation, the range of products and services available and the

intensity of competition. This has been in sync with the overall development of the economy.

India has grown significantly from a ` 5.15 trillion economy in 1991 to ` 73.1 trillion in FY11 (a CAGR of

14.2%). Aggregate deposits of SCBs have grown at a CAGR of 17.9% during 1991-2011 to ` 52.1 trillion

in FY11. Bank lending is a significant driver of the economy and has grown at a CAGR of 19.3% during

1991- 2011 to ` 39.4 trillion. Deposits/GDP rose from 37.4% in 1991 to 71.3% in 2011. Similarly, bank

credit/GDP has grown from 22.6% in 1991 to 53.9% in FY11. Bank credit to commercial sector increased

from 30.3% of GDP in 1990 to 57.6% in 2011. Bank offices in India have grown at a CAGR of 2% during

1991-2010 to 87,768 bank offices in 2010 from 60,220 offices in 1991.

The average population coverage by a commercial bank branch in urban areas improved from 12,300 as on

Jun 30, 2005 to 9,400 as on Jun 30, 2010 and in rural and semi urbanareas from 17,200 as on Jun 30, 2005

to 15,900 as on Jun 30, 2010. The all India weighted average improved from 15,500 to 13,400.

13

Though, the Indian banking system has made impressive strides in resource mobilization, geographical and

functional reach, financial viability, profitability and competitiveness; vast segments of the population,

especially the underprivileged sections of the society, have still no access to formal banking services.

With regard to financial access and penetration, India ranks low when compared with the OECD countries.

India offered 6.33 branches per 100,000 persons whereas OECD countries provided for 23-45 branches per

100,000 people in 2009. For India, the number of branches and ATMs per 100,000 persons has increased to

7.13 and 5.07 in 2010.

14

3.2 Major players and their respective market share

Nationalized Banks

There are 14 nationalized banks in India, but some major are:

- State Bank of India

- Central Bank of India

- Vijaya Bank

- P.N.B

- Dena bank

- Union Bank of India

- Allahabad Bank

- P & S Bank

Co-operative Banks

Private Ltd. Banks

- HDFC Bank

- ICICI Bank

The banking system, largely, comprises of scheduled banks (banks that are listed under the Second Schedule

of the RBI Act, 1934). Unscheduled banks form a very small component (function in the form of Local Area

Bank). Scheduled banks are further classified into commercial and cooperative banks, with the basic

difference in their holding pattern. Cooperative banks are cooperative credit institutions that are registered

under the Cooperative Societies Act and work according to the cooperative principles of mutual assistance.

15

FIGURE 3.2 : MAJOR SHAREHOLDERS AND PLAYERS

The share of nationalised banks in aggregate deposits mobilised by the commercial banks dipped marginally

to 52.3% as of end June'12, down from 52.7%, in the year ago period, data from Reserve Bank of India

showed. State Bank and its associates improved their share marginally to 22.2% from 22.1% .

As for credit, both nationalised banks and the State Bank group lost market share marginally to 51.3%

( 51.7%) and 22.2% ( 22.5%) respectively, RBI said in its Quarterly Statistics on Deposits and Credit of

Scheduled Commercial Banks: June 2012.

RBI data said that the share of private sector banks in deposits and credit stood at 18.2% and 18.9%

respectively as of end June'12.

The data in the quarterly statistics also indicates that the top hundred centres, arranged according to the size

of deposits accounted for 68.7 per cent of the total deposits and the top hundred centres arranged according

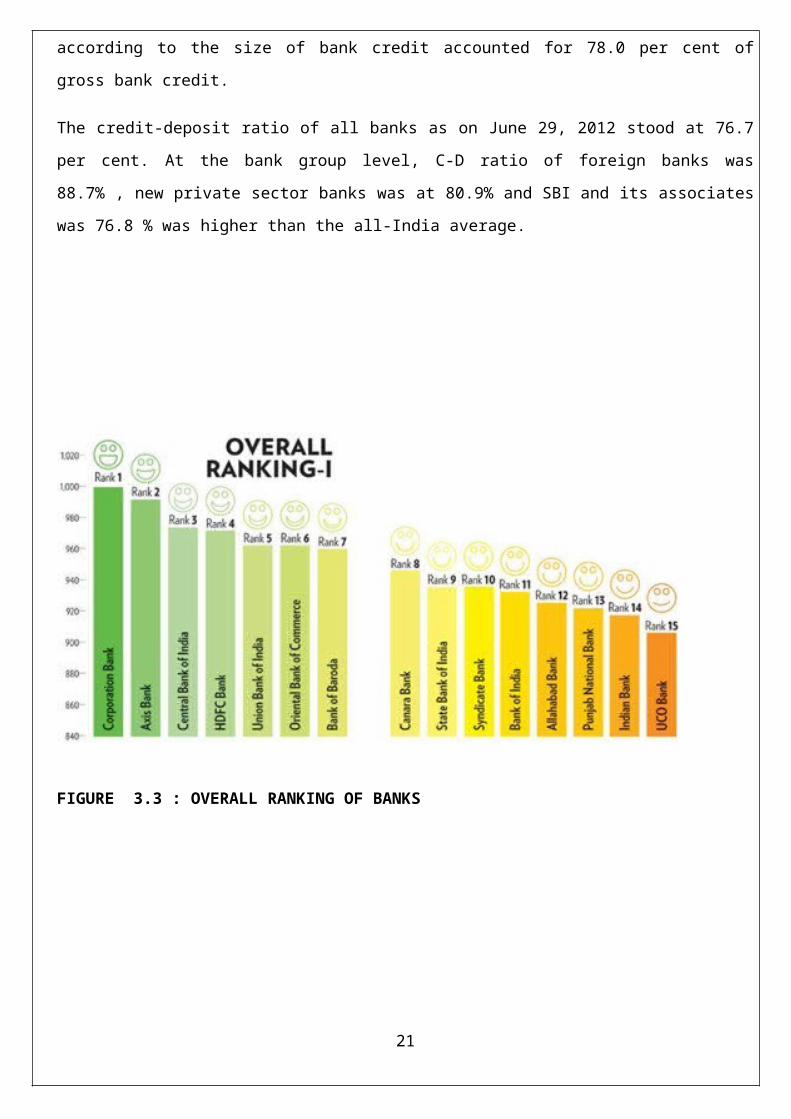
to the size of bank credit accounted for 78.0 per cent of gross bank credit.

The credit-deposit ratio of all banks as on June 29, 2012 stood at 76.7 per cent. At the bank group level, C-D

ratio of foreign banks was 88.7% , new private sector banks was at 80.9% and SBI and its associates was

76.8 % was higher than the all-India average.

16

FIGURE 3.3 : OVERALL RANKING OF BANKS

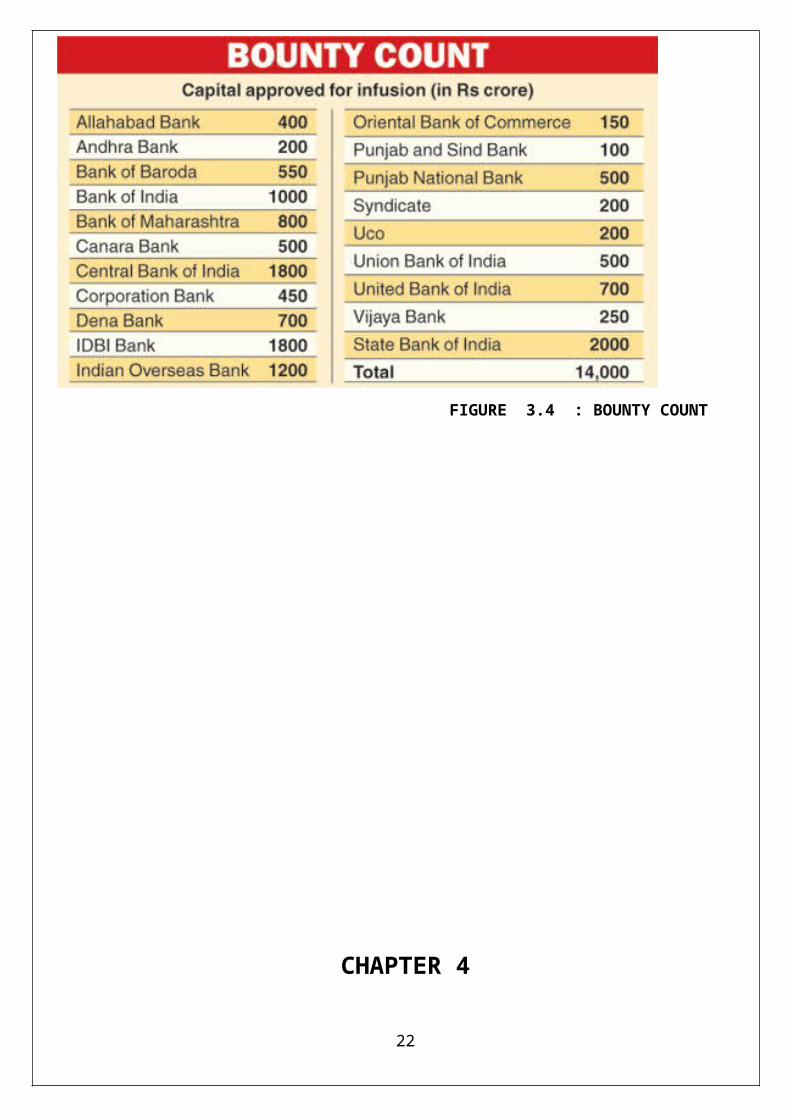
FIGURE 3.4 : BOUNTY COUNT

17

CHAPTER 4

COMPANY PROFILE

18

4.1 History

Established in 1911, Central Bank of India was the first Indian commercial bankWhich was wholly owned

and managed by Indians? The establishment of the Bankwas the ultimate realization of the dream of Sir

Sorabji Pochkhanawala, founder ofThe Bank. Sir Pherozesha Mehta was the first Chairman of a truly '

Swadeshi Bank'.In fact, such was the extent of pride felt by Sir Sorabji Pochkhanawala that he proclaimed

Central Bank of India asthe'property of the nation and the country'sAsset'. He also added that 'Central Bank

of India lives on people's faith and regards Itself as the people's own bank'.Using the past 99 years of history

the Bank has weathered many storms and faced many challenges. The Bank could successfully transform

every threat into business opportunity and excelled over its peers in the Banking industry. Central Bank of

India has approached the Reserve Bank of India (RBI) for permission to open representative offices in five

locations - Singapore, Dubai, Doha, London and Hong Kong. This is the first time the bank is venturing an

independent overseas foray after the Sethia scam in the 1970s forced the bank to close down its London

office. RBI had then asked the other two banks, who had operations in London, to close down. As on 31

March 2011, the bank's reserves and surplus stood at 6,868.85 crore. Its total business at the end of the last

fiscal amounted to 2, 09, 757.33 crore. The bank had a staff strength of 37,241 as on Nov 2006.

4.2 Vision, Mission and objectives of the company

During the past 102 years of history the Bank has weathered many storms and faced many challenges.

The Bank could successfully transform every threat into business opportunity and excelled over its

Peers in the Banking industry.

19

4.2.1 Corporate Vision

To emerge as a strong, vibrant and pro-active Bank/Financial Super Market and to positively contribute to

the emerging needs of the economy through consistent harmonization of human, financial and technological

resources and effective risk control systems.

4.2.2 CORPORATE MISSION

♦ To transform the customer banking experience into a fruitful and enjoyable one.

♦ To leverage technology for efficient and effective delivery of all banking services.

♦ To have bouquet of product and services tailor-made to meet customer’s aspirations.

♦ The pan-India spread of branches across all the state of the country will be utilized to further the socio

economic objective of the Government of India with emphasis on Financial Inclusion.

4.2.3 OBJECTIVES OF THE COMPANY

To know the factors which influence a customer t select a particular institution for home loan.

To know the satisfaction level of customer regarding home loan policy of bank.

To know the problems faced by respondents while getting housing finance.

20

4.4 Products and services offered

A number of innovative and unique banking activities have been launched by Central Bank of India and a

brief mention of some of its pioneering services are as under:


1921 Introduction to the Home Savings Safe Deposit Scheme to build

saving/thrift habits in all sections of the society.

1924 An Exclusive Ladies Department to cater to the Bank's women clientele.

1926 Safe Deposit Locker facility and Rupee Travellers' Cheques.

1929 Setting up of the Executor and Trustee Department.

1932 Deposit Insurance Benefit Scheme.

1962 Recurring Deposit Scheme.

Subsequently, even after the nationalization of the Bank in the year 1969, Central Bank continued to

introduce a number of innovative banking services as under:


1976 The Merchant Banking Cell was established.

1980 Central card, the credit card of the Bank was introduced.

1986 'Platinum Jubilee Money Back Deposit Scheme' was launched.

1989 The housing subsidiary Cent Bank Home Finance Ltd. was started with

its headquarters at Bhopal in Madhya Pradesh.

1994 Quick Cheque Collection Service (QCC) & Express Service was set up to

enable speedy collection of outstation cheques.


22

4.5 Marketing strategies for customer satisfaction

Among the Public Sector Banks, Central Bank of India can be truly described as an All India Bank, due to

distribution of its large network in 27 out of 29 States as also in 3 out of 7 Union Territories in India. Central

Bank of India holds a very prominent place among the Public Sector Banks on account of its network

of 4336 Branches, Asset Recovery Branches (ARB) 9, Retail Asset Branches (RAB) 15 and 26

extension  counters along with satellite branches at various centers throughout the length and breadth of the

country.

Customer satisfaction is one of the formidable challenges in marketing of services in banking industry in our

country. The thrust on customer service has increased after liberalization of Indian economy. Customer

satisfaction is an urgent need of the hour. This can be achieved by efficient customer service and immediate

tactful handling of customer’s grievances. Better customer-management relationship leads to customer

Satisfaction and a good public image is to win over the customers. Hence, public relations should be one of

the strategies to achieve customer satisfaction. Banking system has a significant role to play in the rapid

growth of the economy. Effectiveness of Banking system depends upon the customers satisfaction and in

fact customer is the kingpin of the banking industry. No industry can afford to ignore its customers and

banks are required to give top priority in providing satisfactory and efficient service to their customers. The

purpose of this paper was to study the actual level of customer satisfaction in four commercial Banks in

Jammu and to make a comparative analysis of the level of customer satisfaction through five point linker

scale. Study has revealed that customers are highly satisfied with the employees and the management of the

banks. Comparative analysis of level of customer satisfaction in four banks shows that employees in the

Central Bank of India are the most satisfied lot. The paper provides an opportunity to the employees of the

all the four banks to understand the requirement of providing prompt and quality service to their customers.

Effort should be made to raise the level of customer’s satisfaction amongst all the Banks.

Central Bank is a small bank, still its customers are most satisfied i.e. 3.30.

23

Customers Satisfaction In Central Bank of India

No.of customers

Catg.-IAttitude towards Bank

Catg.IIAttitude towards Employees

Catg.IIIAttitude towards Management

Agerage Mean Score

B=8 3.18 3.01 2.92 3.04S=6 3.51 3.55 3.96 3.67P=6 3.25 3.28 3.04 3.19Avg,Mean Score

3.31 3.28 3.31 3.30

*B- Businessmen. S- Service Class. P- Practitioners.

This when compared to actual averages shown by different categories of customers, it becomes clear from

the table under reference that it is higher than those of businessmen responses (3.04) and practitioners (3.9)

but lower than that of service class (3.67).

Above Table further shows that comparing the variable wise position of the bank regarding First variable i.e.

attitude towards Bank, overall average (3.31) is higher than that of businessmen and practitioners (3.25)

while lower than service class.. It clarifies the fact that businessmen and practitioners are more satisfied with

the bank. Same is the position regarding variable attitude towards management i.e. (3.31).

As regards third category i.e. attitude towards management overall mean is lower than that of service class

customers (3.96) and higher than in case of practitioners (3.04) very poor response has been shown by

businessmen as clear from the below average mean score of 2.92 second variable i.e. attitude towards

employees shows lowest mean score of 3.28 which is lower than that of service class customers (3.55) but

higher than that of businessmen (3.01). It is equal to that of practitioners (3.28).

24

CHAPTER 5

THEORETICAL PERSPECTIVE

25

1. RATIO ANALYSIS 

Ratio analysis is a powerful tool of financial analysis.

The relationship between two accounting figures, expressed mathematically, is known as a financial ratio (or

simply as a ratio). Ratios help to summaries large quantities of financial and to make Qualitative

judgment about the firm’s financial performance.

It refers to the systematic use of ratios to interpret the financial statements in terms of the operating

performance and financial position of a firm. It involves comparison for a meaningful interpretation of the

financial statements.

Types of Ratios:

Several  ratios,  calculated  from the  accounting  data, can  be  grouped  into  various classes according to

financial activity or function to be evaluated. In view of the requirements of the various users of ratios, we

may classify them into the following four important categories:

Proprietary ratios

Liquidity Ratios

Profitability ratios

Activity Ratios

Ratio Analysis is a form of Financial Statement Analysis that is used to obtain a quick indication of a firm's

financial performance in several key areas. The ratios are categorized as Short-term Solvency Ratios, Debt

Management Ratios, Asset Management Ratios, Profitability Ratios, and Market Value Ratios.

Ratio Analysis as a tool possesses several important features. The data, which are provided by financial

statements, are readily available. The computation of ratios facilitates the comparison of firms which differ

in size. Ratios can be used to compare a firm's financial performance with industry averages. In addition,

ratios can be used in a form of trend analysis to identify areas where performance has improved or

deteriorated over time. Because Ratio Analysis is based upon accounting information, its effectiveness is

limited by the distortions which arise in financial statements due to such things as Historical Cost

Accounting and inflation. Therefore, Ratio Analysis should only be used as a first step in financial analysis,

to obtain a quick indication of a firm's performance and to identify areas which need to be investigated

further.

26

1. Proprietary Ratios:

A strong short-as well as long-term financial position. To judge the long-term financial position of the

firm, proprietary ratios or capital structure ratios are calculated. These ratios indicate mix of

funds provided by owners and lenders. As a general rule, there should be an appropriate mix of debt and

owners` equity in financing the firm’s assets. The process of magnifying the shareholders` return through

the use of debt is called “financial leverage “or “financial gearing “or “trading on equity”.

The following are some of the proprietary ratios:

1. Debt-Equity Ratio

2. Proprietary Ratio

3. Debt-Equity Ratio (Long-Term)

2. Liquidity Ratios

It is extremely for a firm to be able to meet its obligations as they become due.Liquidity  ratios

measure the ability of the firm to meet its current obligations (liabilities). The failure of a company to meet

its obligations due to lack of sufficient liquidity, will result in poor credit worthiness, loss of creditors`

confidence, or even in legal tangles resulting in the closure of the company. A very high degree of liquidity

is also bad; idle assets earn nothing. The firm’s funds will be unnecessarily tied up in current

assets. Therefore, it is necessary to strike a proper balance between high liquidity and lack of liquidity. The

most common ratios, which indicate the extent of liquidity or lack of it, are:

1. Current Ratio

2. Quick Ratio

27

3. Profitability Ratios:

A company should earn profits to survive and grow over a long period of time. Profits are essential, but it

would be wrong to assume that every action initiated by management of a company should be aimed at

maximizing profits, irrespective of concerns for customers, employees, suppliers or social consequences.

Profit is the difference between revenues and expenses over a period of time (usually one year). Profit is the

ultimate ‘output’ of a company, and it will have no future if it fails to make sufficient profits. Therefore, the

financial manager should continuously evaluate the efficiency of the company in term of profits. 

The profitability ratios recalculated as follows:

1. Gross profit ratio

2. Operating profit ratio

3. Net Profit Ratio

4. Activity Ratios:

Funds of creditors and owners are invested in various assets to generate sales and profits. The better the

management of assets, the larger the amount of sales.

Activity ratios are employed to evaluate the efficiency with which the firm manages and utilizes its

assets. These ratios are also called turnover ratios. They are:

1. Fixed Assets Turn Over Ratio

2. Total Assets Turn Over Ratio

3. Net Working Capital Turnover Ratio

4. Debtors Turn Over Ratio

5. Inventory Turnover Ratio

28

COMPARATIVE STATEMENT:

Comparative statements are financial statements that cover a different time frame, but are formatted in a

manner that makes comparing line items from one period to those of a different period an easy process.

Many companies make use of standardized formats in accounting functions that make the generation of a

comparative statement quick and easy.

Importance and Uses

The benefits of a comparative statement are varied for a corporation. Because of the uniform format of the

statement, it is a simple process to compare the gross sales of a given product or all products of the company

with the gross sales generated in a previous month, quarter, or year.

Comparing generated revenue from one period to a different period can add another dimension to

analysing the effectiveness of the sales effort, as the process makes it possible to identify trends such

as a drop in revenue in spite of an increase in units sold.

Along with being an excellent way to broaden the understanding of the success of the sales effort, a

comparative statement can also help address changes in production costs

Features of Comparative Statements:

1) A comparative statement adds meaning to the financial data.

2) It is used to effectively measure the conduct of the business activities.

3) Comparative statement analysis is used for intra firm analysis and inters firm analysis.

4) A comparative statement analysis indicates change in amount as well as change in percentage.

5) A positive change in amount and percentage indicates an increase and a negative change in amount and

percentage indicates a decrease

29

ADVANTAGE OF COMPARATIVE STATEMENT

Accountants prepare financial statements at the end of each period. These include the balance sheet, the

income statement and the statement of cash flows. Financial analysts and managers use these financial

statements to analyse the company’s activities over the period. Financial statement users incorporate a

variety of tools to analyse the financial results. These include calculating ratios or using comparative

statements. Comparative statements provide several advantages not included in the standard financial

statements.

DISADVANTAGE OF COMPARATIVE STATEMENT:

Accountants prepare financial statements at the end of each period. These include the balance sheet, the

income statement and the statement of cash flows. Financial analysts and managers use these financial

statements to analyse the company’s activities over the period. Financial statement users incorporate a

variety of tools to analyse the financial results. These include calculating ratios or using comparative

statements. Comparative statements provide several advantages not included in the standard financial

statement

30

31

CHAPTER 6

FINDINGS AND ANALYSIS

32

6.1 GENERAL FINDINGS:

DATA ANALYSIS AND INTERPRETATION:

Liquidity Ratios

It is extremely for a firm to be able to meet its obligations as they become due .Liquidity ratios

measure the ability of the firm to meet its current obligations (liabilities). The failure of a company to meet

its obligations due to lack of sufficient liquidity, will result in poor credit worthiness, loss of creditors`

confidence, or even in legal tangles resulting in the closure of the company. A very high degree of liquidity

is also bad; idle assets earn nothing. The firm’s funds will be unnecessarily tied up in current

assets. Therefore, it is necessary to strike a proper balance between high liquidity and lack of liquidity. The

most common ratios, which indicate the extent of liquidity or lack of it, are:

1. Current Ratio

2. Quick Ratio

33

1. CURRENT RATIO:

Current Ratio = Current Asset

Current Liabilities

YEAR CURRENT ASSETS

CURRENT LIABILITIES

RATIO

2012-13 1772.19 1558.23 1.14

2013-14 1838.02 1641.45 1.12

2014-15 2028.13 1739.24 1.17

2012-2013 2013-2014 2014-20151.09

1.1

1.11

1.12

1.13

1.14

1.15

1.16

1.17

1.18

Current Ratio

Current Ratio

Interpretation of current ratio:

An increase in the current ratio represents improvement in the liquidity position of the firm, while a decrease

in the current ratio indicates that there has been deterioration in the liquidity position of the firm.

The current ratio 1.14 in the year ending 2012-13 and its 1.12 in the year ending 2014. This is because there

has been appropriately decrease in current assets and increase in current liabilities. Current ratio is

ending 2014-15 is 1.17 which even higher than both previous year. Though current assets have increase

proportionately increase in current liabilities has been more. However this is considered quite cruel as it

doesn’t take into account liquidity of each component of current asset, which may be used to meet its current

obligations. It may be observed that the concern has a current ratio much lesser than the standard ratio 1.33:1

34

2. QUICK ASSET RATIO (ACID TEST RATIO)

An indicator of a company’s short-term liquidity. The quick ratio measures a company’s ability to

meet its short-term obligations with its most liquid assets

QUICK RATIO = CURRENT ASSETS−INVESTORS

CURRENT LIABILITES            OR     QUICK ASSETS

CURRENT LIABILITES


YEAR QUICK ASSETS CURRENT LIABILITIES RATIO

2012-13 983.05 1558.2 3 0.63

2013-14 1026.27 1641.45 0.62

2014-15 1288.89 173 9.24 0. 74

2012-2013 2013-2014 2014-20150.560.580.6

0.620.640.660.680.7

0.720.740.76

Quick Ratio

Quick Ratio

Interpretation of the Quick asset

The higher the Quick ratio indicates the ability of a firm is liquid and has the ability to meet its current

liabilities in time. The company’s quick ratio is almost equal to standard ratio 1:1 in the year 2014-15 i.e

0.74, but in 2012-13 i.e. 0.63 and 2013-14 i.e. 0.62 it is not equal to ideal ratio.

35

3. DEBT EQUITY RATIO:

The Debt-Equity measures the long term financial solvency of a business concern. This ratio is viewed as

indicating the relative proportion of debt amends equity in financing the assets of the business unit. Debt-

equity (DE) ratio is directly computed by dividing total debt by net worth:

Debt Equity Ratio = Total Debt

equity shareholders


2012-2013 2013-2014 2014-20150

1

2

3

4

5

Debt Equity Ratio

Debt Equity Ratio

Interpretation of Debt Equity Ratio

If debt equity ratio is high, the owners are putting up relatively less money of their own. It is a danger signal

for the creditors. If the project should fail financially, the creditors would lose heavily. The greater the ratio,

the greater the risk to the creditors.The above graph shows a mixed trend during last three years. Though the

proportionate variation during last two previous years was very high it is due to high amount of debt taken.

The result is favourable for the company.

36

YEAR DEBT EQUITY RATIO

2012-13 214.4 615.83 0.35

2013-14 226.97 620.54 0.37

2014-15 182.61 694.06 0.26

4. PROPRIETARY RATIO:

This is a variant of the debt-to-equity ratio. It is also known as equity ratio or net worth to total assets ratio.

This ratio relates the shareholder's funds to total assets. Proprietary / Equity ratio indicates the long-term or

future solvency position of the business.

Proprietary Ratio = Shareholders funds / Total Assets

or

Proprietary Ratio = Shareholders' equity / Total tangible assets

2012-2013 2013-2014 2014-20150.244

0.248

0.252

0.256

0.26

Proprietary Ratio

Proprietary Ratio

Interpretation of Proprietary ratio:

Higher the ratio better is the position. From the analysis proprietary ratio was changes in every year,  2012-

2013, 2013-2014 & 2014-2015 were 0.26, 0, 25 & 0.26. Though proprietary ratio decreased in

proportionately increase in total assets has been more. This in dictates the firm quite satisfactory.

37

YEAR SHAREHOLDER’S FUND TOTLA ASSETS

RATIO

2012-13 615.83 2388.46 0.26

2013-14 620.54 2488.96 0.25

2014-15 694.54 2615.91 0.26

5. FIXED ASSETS RATIO:

The firm may wish to know its efficiency of utilizing fixed assets and current assets separately.

Fixed Asset Ratio = Net Sales¿ Assets

Interpretation of Fixed Asset Ratio:

The ideal norm of the ratio is 1:1, which means that the long-term funds raised are utilized for the

acquisition of long-term assets of the company .The asset turn ratio is increased over a period of time from

1.29 & 1.30 in 2012 to 2014 and 1.51 in the year 2014-15 respectively. This proves the company is making

utilization of fixed assets.

38

2012-2013 2013-2014 2014-20151.151.2

1.251.3

1.351.4

1.451.5

1.55

Fixed Asset Ratio

Fixed Asset Ratio

YEAR SALES FIXED ASSETS RATIO

2012-13 642.36 813.23 1.29

2013-14 650.29 847.51 1.3

2014-15 580.22 876.67 1.51

III. Profitability Ratios:

A company should earn profits to survive and grow over a long period of time. Profits are essential, but it

would be wrong to assume that every action initiated by management of a company should be aimed at

maximizing profits, irrespective of concerns for customers, employees, suppliers or social consequences.

Profit is the difference between revenues and expenses over a period of time (usually one year). Profit is the

ultimate ‘output’ of a company, and it will have no future if it fails to make sufficient profits. Therefore, the

financial manager should continuously evaluate the efficiency of the company in term of profits. 

The profitability ratios recalculated as follows:

5. Gross profit ratio

6. Operating profit ratio

7. Net Profit Ratio

39

6. GROSS PROFIT RATIO:

Gross profit ratio (GP ratio) is a profitability ratio that shows the relationship between gross profit and

total net sales revenue. It is a popular tool to evaluate the operational performance of the business. The ratio

is computed by dividing the gross profit figure by net sales.

Gross Profit Ratio = Gross Profit

Net Sales

OR

Gross Profit Margin = Gross Profit

Net SalesX 100

2012-2013 2013-2014 2014-20150

5

10

15

20

25

Gross Profit Ratio

Gross Profit Ratio

Interpretation of Gross profit Ratio:

Higher the ratio, the better the position of the firm is which means that the firm earns grater profits out of the

sales and vice versa. The above graph shows that there is a decreasing trend in the gross profit ratio which

was 23.14% in the year 2012-13 and further decrease 18.40% in the year 2013-14 and increase in 2014-

15 i.e. 21.07% respectively. Higher the ratio is better it is a low ratio indicates unfavourable trends, therefore

the above graph shows the efficiently of the company.

40

YEAR GROSS PROFIT SALES RATIO

2012-13 695.58 3438.12 23.14%

2013-14 670.25 3643.03 18.40%

2014-15 899.54 4268.21 21.07%

7. NET PROFIT RATIO:

Net profit is obtained when operating expenses, interest and taxes are subtracted from the gross profit. The

ratio establishes a relationship between net profit and sales and indicates management’s efficiency in

manufacturing, administrating and selling the products. This ratio is the overall measure of the firm’s ability

to turn each rupee sales into net profit. If the net margin is inadequate, the firm will fail to achieve

satisfactory return on owner’s equity.

Net profit ratio = Net Profit after Tax

Net Sales

2012-2013 2013-2014 2014-20150

1

2

3

4

5

Net Profit Ratio

Net Profit Ratio

Inter predation of Net Profit Ratio: 

A high net profit ratio indicates that the profitability of the concern is good. On the other hand, a low net

profit ratio indicates that the profitability of the enterprise is poor. But while interpreting the ratio it should

be kept in mind that performance of profits must also be seen in relation to investments or capital of the firm

and not only in relation to sales.

In this case of performance of the Net Profit margin ratio is satisfactory in the year 2012-13 it was 4.4%.

Further decreased compare In the year 2013-14 & 2014-15 that is 2.48% & 3.87% respectively.

41

YEAR NET PROFIT SALES RATIO

2012-13 154.08 3438.12 4.40%

2013-14 90.21 3643.03 2.48%

2014-15 165.11 4268.21 3.87%

8. OPERATING RATIO:

Operating profit is the profit which is earned by the company’s core activities. This ratio expresses the

relationship between operating profit and sales. It is worked out by

dividing operating profit by net sales. With the help of this ratio, one can judge the managerial efficiency

which may not be reflected in the net profit ratio.

Operating ratio = Operating Expenses

Net Sales

YEAR OPERATING PORFIT

SALES RATIO

2012-13 2642.54 3438.12 76.86%

2013-14 2972.78 3643.03 81.60%

2014-15 3368.67 4268.21 78.92%

2012-2013 2013-2014 2014-201574

76

78

80

82

Operating Ratio

Operating Ratio

Interpretation of operating Ratio:

Lower the ratio, the more favourable and better the firm’s position is, which highlights the percentage of

absorption, cost of goods sold and operating expenses out of sales and vice versa. The above graph shows

that there is a variation trend in the operating ratio which was 76.86%, 81.60% & 78.92% in the year 2012 to

2015. Here it clearly shows that lower Ratio, the more favourable i.e. cost of operating expenses was

decreased compare to 2015 and better position of the firm.

42

9. RETURN ON ASSETS:

The return on assets (ROA) percentage shows how profitable a company's assets are in generating revenue.

2012-2013 2013-2014 2014-20150

2

4

6

8

10

Return On Assets

Return On Assets

Interpretation of Return on Assets

If the actual ratio is 10% or more, it is an indication of higher productivity of the total resources. On the

other hand, a return of less than 10% is an indication of lower productivity of the resources. The above

calculation indicates a downward trend of return on total resources, which indicates the less proportionate

increasing productivity. This higher percentage helps in optimizing the total assets of the company and the

company has been able to maintain efficient realizable assets in comparison to the production capacity.

Though there is a decreasing trend, but still the ratio compared to others in the same industry is very high

therefore it indicates the higher efficiency of the firm.

43

YEARPROFIT AFTER TAX AVERAGE ASSTES

RETURN ON ASSETS

2012-13 154.08 2388.46 6.45%

2013-14 90.21 1825.1 4.95%

2014-15 165.11 1951.58 8.46%

4. Activity Ratios:

Funds of creditors and owners are invested in various assets to generate sales and profits. The better the

management of assets, the larger the amount of sales.

Activity ratios are employed to evaluate the efficiency with which the firm manages and utilizes its

assets. These ratios are also called turnover ratios. They are:

1. Total Capital Turnover Ratio

2. Fixed Assets Turnover Ratio

3. Net Working Capital Turnover Ratio

4. Debtors Turnover Ratio

5. Inventory Turnover Ratio

44

10. TOTAL CAPITAL TURNOVER R ATIO:

Calculated by dividing annual sales by average stockholder equity (net worth). The ratio indicates how much

a company could grow its current capital investment level. Low capital turnover generally corresponds to

high profit margins.

Total capital turnover ratio = Total Sales

Capital Employed

2012-2013 2013-2014 2014-20153.63.84

4.24.44.64.85

Total Capital Turn-over Ratio

Total Capital Turn-over Ratio

Analysis and interpretation:

The total capita l turnover ratio is 4.14, 4.30 & 4.87 time for the year 2013

2014 & 2015 respectively. The proportionate ratio is increases to 4.14% to 4.87

In these year % this shows the efficiency of capital turn over to generate sales

capital turnover is low, in efficiency utilization of capital turnover

The Management of ABC Co utilizes the fixed assets effectively in generating more years.

45

YEAR SALES CAPITAL EMPLOYED RATIO

2012-13 3438.12 830.23 4.14%

2013-14 3643.03 847 .51 4.30%

2014-15 4268. 21 876.6 7 4.87%

11. FIXED ASSETS TURN OVER RATIO:

The firm may wish to know its efficiency of utilizing fixed assets and current assets Separately.

Fixed Asset Ratio = Net Sales¿ Assets

INTERPRETATION:

 This ratio measures the efficiency of the assets use. The efficient use of assets will generate greater sales per

rupee invested in all the assets of a concern. In the year of 2012 to 2015 fixed assets turnover ratio were

5.35, 5.60 & 7.26% respectively. To conclude that the fixed assets measures efficiency of the assets

used properly.

46

2012-2013 2013-2014 2014-20150

2

4

6

8

Fixed Asset Turn Over Ratio

Fixed Asset Turn Over Ratio

YEAR SALES FIXED ASSETS RATIO

2012-13 3438.12 642.26 5.35%

2013-14 3643.03 650.29 5.60%

2014-15 4268.21 587.22 7.26%

12. WORKING CAPITAL TURNOVER RATIO:

A firm may also like to relate net current assets (or net working capital gap) to sales. It may thus compute

net working capital turnover by dividing sales by net working capital is:

Net working capital turnover ratio = Total Sales

WorkingCapital

2012-13 2013-14 2014-1514

14.5

15

15.5

16

16.5

Working Capital Turn Over Ratio

Working Capital Turn Over Ra-tio

Analysis and interpretation:

The higher the ratio, the lower is the investment in working capital and the great are the profits. However, a

very high turnover of working capital is a sign of overtrading and may put the concern into financial

difficulties. On the other hand, a low working capital turnover ratio indicates that working capital is not

efficiently utilized.

47

YEAR SALES NET WORKING CAPITAL

RATIO

2012-13 3438.12 213.96 16.06%

2013-14 3643.03 236.96 15.38%

2014-15 4268.21 288.89 14.7 7%

13. STOCK/INVENTORY TURN OVER RATIO

Stock turnover ratio / Inventory turnover ratio indicates the number of time the stock has been turned

over during the period and evaluates the efficiency with which a firm is able to manage its inventory.

Inventory Turnover Ratio = Cost of Goods Sold

Average Stocks

2012-13 2013-14 2014-150

1

2

3

4

5

Stock/Inventory Turn Over Ratio

Stock/Inventory Turn Over Ra-tio

Interpretation of stock turnover ratio:

Every year it has a very high stock turnover ratio. It is considered better as it indicates that more sales are

being produced by each rupee of investment in stock but it may not always

Be an indicator of favourably results. It may be the result of a very low level of stock which results in

frequent out of stock position. Such a situation prevents the company form meeting customer’ demands and

the company cannot earn maximum profits. so it clearly shows that the stock turnover ratio is increasing

trend every year 2012 to 2015 it was 3.38, 3.73 & 4.35 times respectively. The stock turnover is better

position in the company

48

YEAR COST OF GOODS SOLD

AVERAGE STOCK RATIO

2012-13 2642.54 782.47 3.38%

2013-14 2972.78 797.11 3.73%

2014-15 3368.67 775.115 4.35%

14. DEBTOR TURNOVER RATIO:

Debtor’s turnover ratio or accounts receivable turnover ratio indicates the velocity of debt collection of a

firm. In simple words it indicates the number of times average debtors (receivable) are turned over during a

year.

Debtor Turnover Ratio =Net Credit Sales

Average Debtors+ Average Bills Receivable

2012-13 2013-14 2014-15680700720740760780800

Debtor Turn Over Ratio

Debtor Turn Over Ratio

Interpretation of debtor turnover ratio:

 Higher the ratio, better the position of the firm is in collecting the overdue means the effectiveness of the

collection department and vice versa.

This ratio measure of the collectibles of accounts receivables and tells about how credit policy of the

company is being enforced. The ratios in the years 2012 to 2015 are very high i.e. 77days, 73days & 67 days

respectively. This indicates that debts being collected

More promptly from the debtors. It is very much satisfactory because the ratio should be increasing rather

than decreasing.

49

YEAR NET CREDIT SALES

AVERAGE DEBTORS

DEBTORS VELOCITY

2012-13 3438.12 730.58 77 days

2013-14 3643.03 725.49 73 days

2014-15 4268.21 792.5 67 days

COMPARATIVE BALANCE SHEET AS ON 31-03-2013 TO 31-03-2015

PARTICULARS(Rs in lacs)

LIABILITIES 31-3-2013 31-3-2014 31-3-2015

Share holders’ Funds1) Capital 189.28 189.28 189.28

s2) Reserves –Gen 123.76 148.76 198.763) Reserves & others 185.37 150.01 116.674) Revaluation Reserves 189.355) P&L a/c 117.42 132.49 189.35

sub total 615.83 620.54 694.06

Term liabilitiesterm loans-Banks

Term loans-FI 116.13 97.54 61.27Deposits payable after -one year 71.17 96.47 96.47

Deferred payment credits 27.1 32.96 24.87Term deposits

DebentureOther term liabilities

sub Total 214.4 226.97 182.61

current LiabilitiesBank borrowings 548.79 536.4 596.02

borrowings-associatesDirectorsOthers

Deposits from dealersAdv payment from Dealers 40.52 34.26 59.72

Provision for tax 44.06 63.16dividend 43.16 44.29 66.43Others 63.21 24.96 45.38

Interest payable/Dep/Deb 54.72 55.25 39.87

Others C-Liabilities 285.7 319.13 359.29Sub Total 1558.23 1641.45 1739.24

Grand Total 2388.46 2488.96 2615.91

50

ASSETS 31-3-2013 31-3-2014 31-3-2015

Fixed Assets

Gross block 1470.15 1575.21 1599.21

less: Depreciation 828.39 924.92 1012.05

Net Block 642.26 650.29 587.22

Capital WIP

Advances for capital –goods

Sub Total 642.26 650.29 587.22

Investment in other COS

Deferred receivables

Goodwill/Miscel Exp Not written off

P&L a/c 0.58 0.65 0.65

Sub total 0.58 0.65 0.65

Current Assets

Raw-Materials- Imp 245.53 108.28 78.03

Indag 98.6 159.19 222.9

Work in progress 33.28 57.21 64.89

Finished goods 321.79 401.59 273.79

Stores & Spares 82.94 85.48 99.62

Debtors(<6months)

51

Export 130.85 69.22 62.19

Local 573.15 651.18 802.42

Debtors(>6months)

Export

local 26.58

Loans and advances

Loans to supplies

Deposits 31

Cash & Bank Balances 99.31 305.87 424.1

Other Current assets 129.36

other C-Assets 129.36

Sub total 1772.19 1838.02 2028.13

Grand Total 2388.46 2488.96 2615.91

Analysis of the Profit & Loss a/c as on 31-3-2013 to 31-3-2015

(Rs In lacs)

Gross Sales 31-3-2013 31-3-2014 31-3-2015

domestic Sales 2803.11 3127.69 3879.55

Export sales 934.22 875.3 874.71

52

total 3737.33 4002.49 4754.26

less: excise duty 299.21 359.96 486.05

Net sales 3438.12 3643.03 4268.21

cost of sales

raw materials 1547.23

Imported 661.83 754.27

Indigenous 1353.82 1426.46

other spares 136.99

Power & fuel 284.16 292.28 334.82

Direct labour 506.74 642.24 642.93

Repairs and maintenance 86.22

other mgt expenses 75.22 10.18 1.77

Depreciation 58.53 62.58 67.12

sub total 2695.09 3022.93 3277.37

add opening WIP 32.58 29.34 57.21

Less closing 29.34 57.21 64.84

cost of production 2698.33 2995.06 3269.69

add opting stock of FG 269.74 308.51 330.79

less Closing stock FG 325.53 330.79 231.81

Cost of Sales 2642.54 2972.78 3368.67

Gross Profit 795.58 670.25 899.54

53

selling gen-adm-expences 490.29 454.69 557.86

interest 94.74 114.42 113.27sub total 585.03 569.11 171.13

operating Profit 210.55 101.14 228.41add: other income 38.83 53.3 60.03profit before tax 249.34 154.44 288.44

provision for taxes 95.26 64.23 123.23

Net P & L 154.08 90.21 165.11

INTERPRETATIONS:

For the year of (2013 & 2014)

COMPARATIVE BALANCE SHEET:

There are no changes in share capital.

The Reserves and surplus is185.37 compare to previous year.

The cash & bank balance is 99.31 & on the year 2012-2013

Current liabilities is 1558.23 on the year 2012-2013

Current assets is 1772.19

The working capital is 213.96

INCOME STATEMENT:

The net sales were 3438.12 2012-2013.

Profit before tax is 249.34 year.

Net profit & loss is 154.08 is 2013-2014

54

For the year of (2013-2014)

COMPARATIVE BALANCE SHEET:

There are no changes in share capital.

The Reserves and surplus has decreased 150.01 compare to previous year.

The cash & bank balance is 185.37& on the year 2013-2014

Current liabilities is 1641.45 on the year 2013-2014

Current assets is 1838.02

The working capital is 196.57

INCOME STATEMENT:

The net sales were 3643.03 in 2013-2014.

Profit before tax is 154.44 this year.

Net profit & loss is 90.21is 2013-2014.

55

INTERPRETATION:

(From 2013-2015)

Debt-Equity ratio is fluctuated in each year; it decreases from 0.35 to 0.26 in the periods in between

2013-15.

Proprietary Ratio have not fluctuated in each year is 0.26-0.26

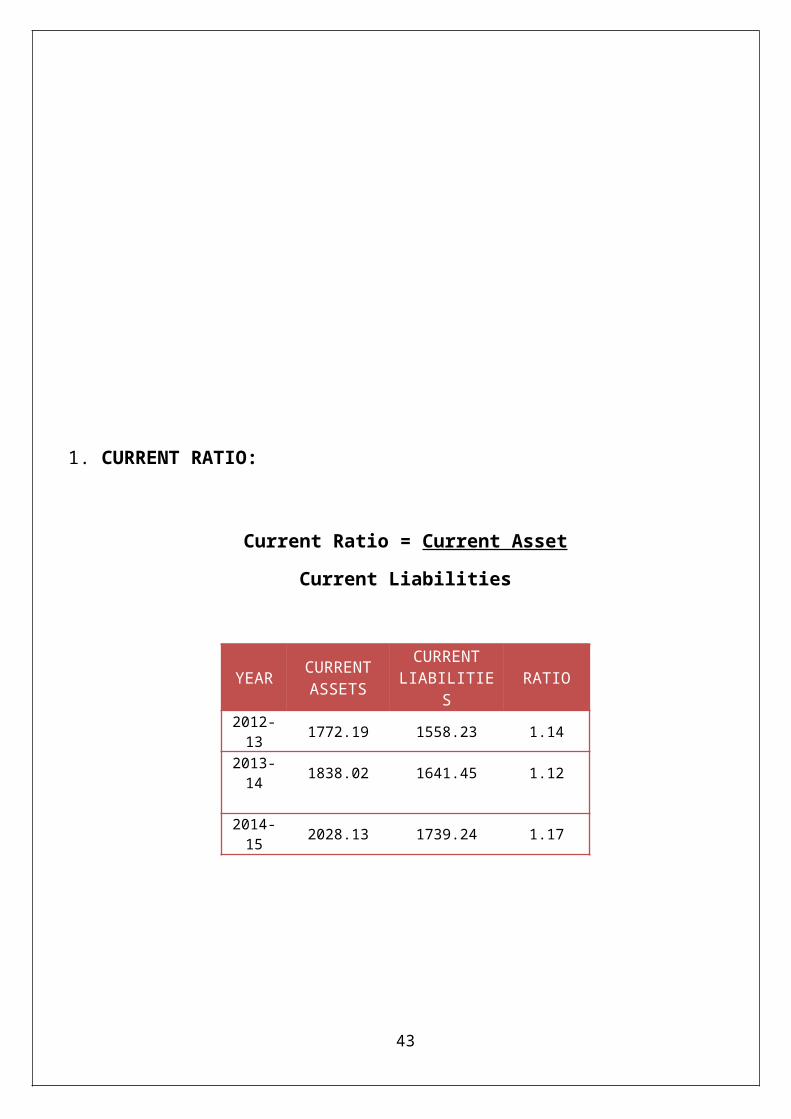
The bank’s current ratio has increased to 1.14 to 1.17

The Company’s quick ratio is in the years, 2013-15 is 0.63 to 0.74

In the study period the working capital turnover ratio was continuously -fluctuated. And decreased

To 16.06 to 14.77

Gross profit of the company is fluctuating throughout the study period, and decreased in the year

2013-15 23.14% to 21.07%

The net profit ratio decreases in between 2013 - 2015 from 4.4% to 3.87%

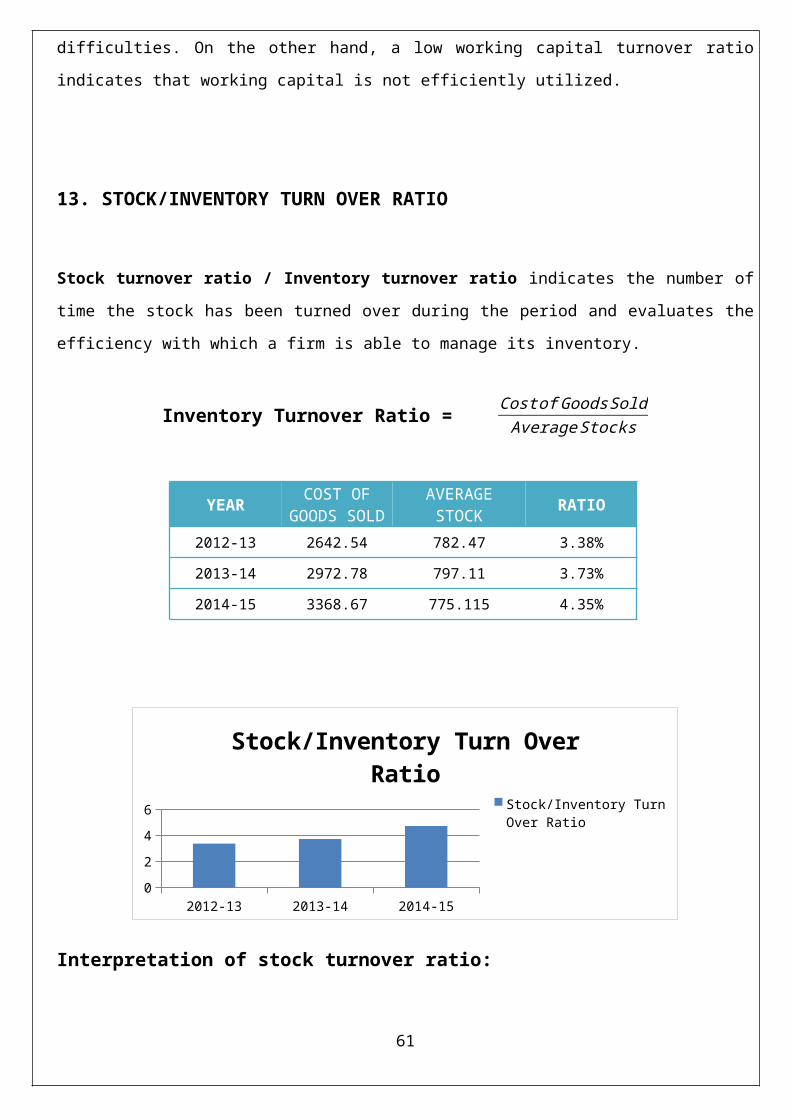
The Inventory Turnover ratio is increasing every year; has increased in 2013-15 it is 3.38 to 4.35

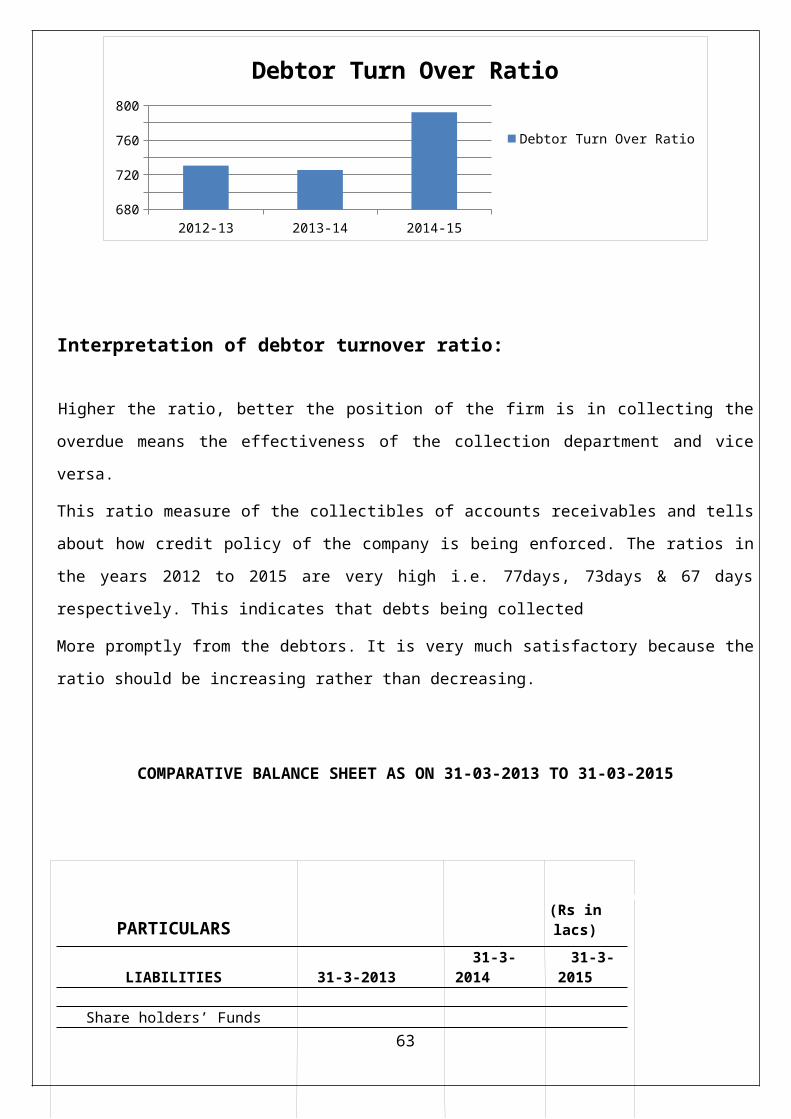
Debtors’ turnover ratio shows a higher value has increased in 2013 -2015 from 730.58 to 792.50

56

ESTIMATION:

(FOR THE YEAR 2014)

The estimated Total asset for 2013-14 is 2615.91

The estimated net sales for 2013-14 are 4268.21 that mean in future net sales has been increasing.

The estimated Debt-Equity Ratio for 2013-14 is 0.26

The estimated Current Ratio for 2013-14 is 1.17

The estimated Quick Ratio for 2013-14 is 0.74

The estimated Net Profit Ratio for 2013-14 is 3.87%

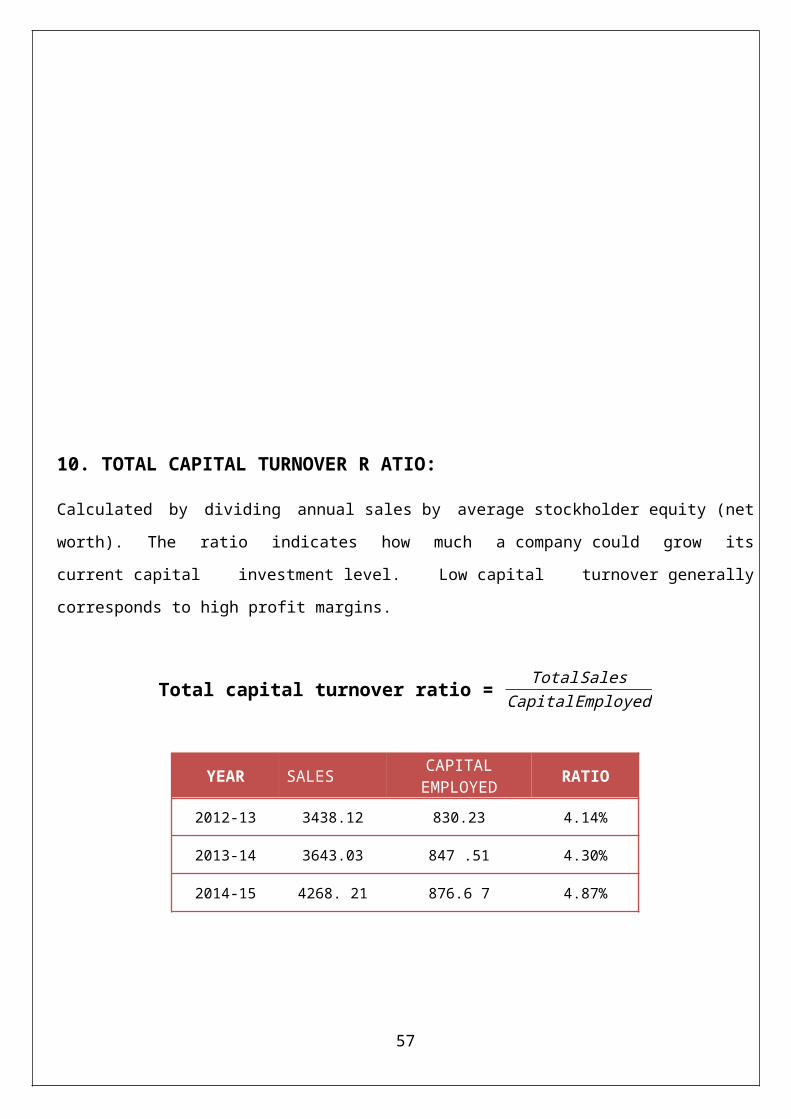
. Total Capital Turnover Ratio has been increasing. Is 4.87 %

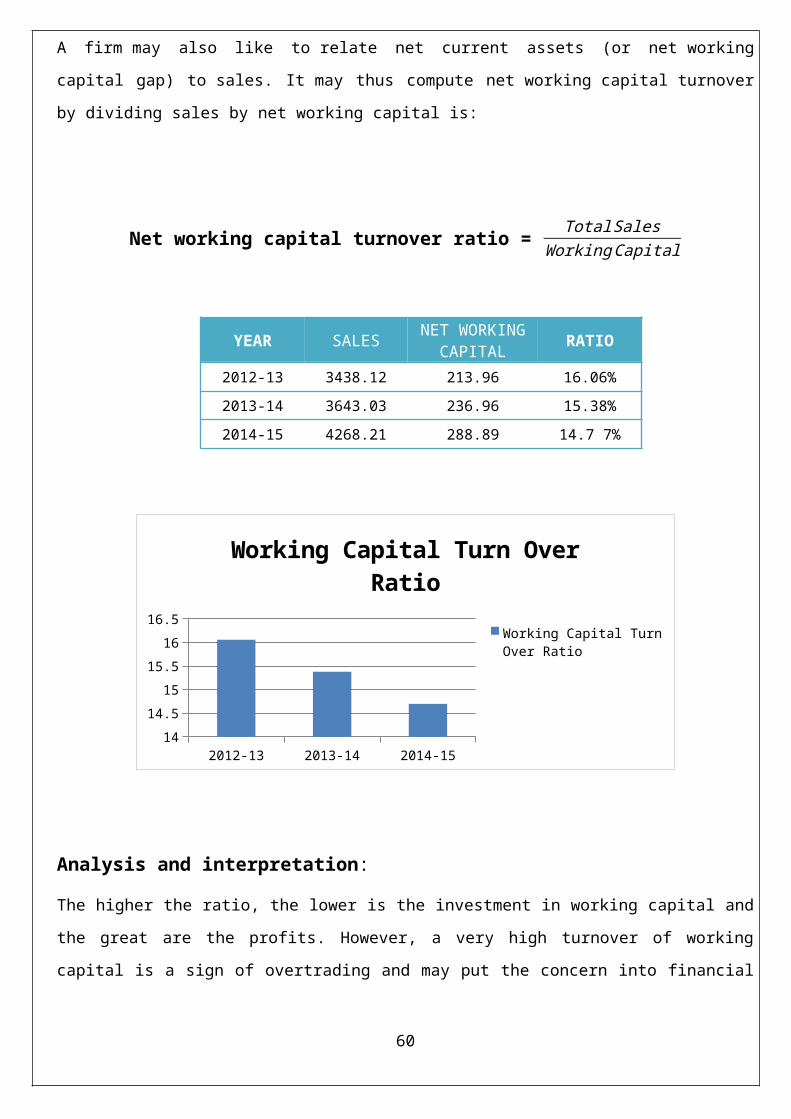
The estimated Net Working Capital Turnover Ratio for 2013-14 is 14.77 that means in future Net

Working Capital Turnover Ratio has been decreasing.

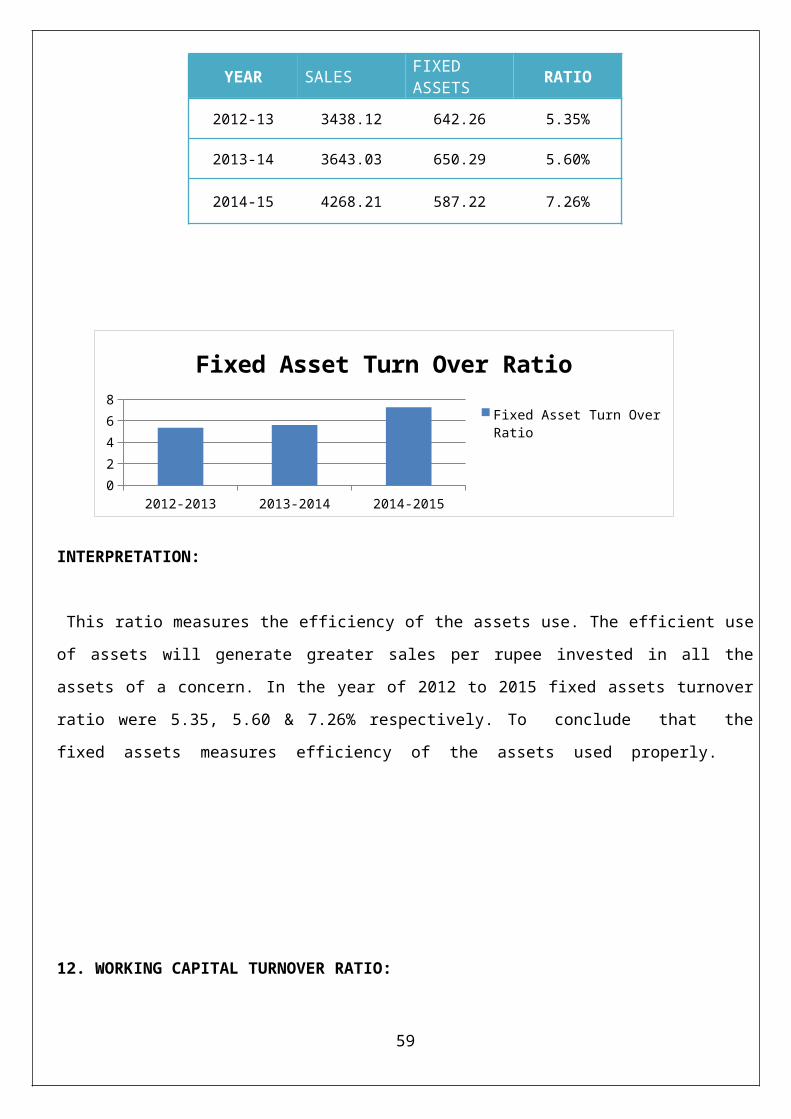
The estimated Fixed Assets Turnover Ratio for 2013-14  7.26%.

57

CHAPTER 7

CONCLUSION AND RECOMMENDATIONS

58

Suggestion and Conclusion

7.1 SUGGESTION:

“A study on financial performance with reference to ratio analysis” – in Central Bank of India, the project is

completed in Circle office. This chapter has been designed to recapitulate the key findings of the study as

well as to make suitable suggestions if any to improve the financial performance of the banks using some

important key ratio:

1. Ratio Analysis

2. Comparative balance sheet

Current assets were increasing in the year of 2013-14 & 2014-15, so the company has to take the

decision to manage the current Ratio more appropriately for the next consecutive year. Higher the

ratio reflects an excess investment in current assets Otherwise its effects working capital.

Gross profit and Net profit have decreased in the year 2013-14 & so do 2014-15. So management has

to take the decision to improve the profitability of the concern as it needs to be maintained

throughout.

Debt equity ratio and shareholder’s funds are not properly leveraged because outside liabilities are

increasing gradually. This may in future affect liquidity position of the bank. So management should

control with a limited investment.

The Company is suggested to improve the net profit by increasing the volume of sales as it is found

that sales percentage is fluctuating over the years.

59

The Company has to go for integrated marketing, so that it can increase its sales, with this the profit

will be increased.

The Working Capital turnover ratio shows a Fluctuating balances. The company must try to assess

working capital needs perfectly.

Company maintains Current Assets equal to Fixed Assets, it is better to invest the ideal funds in other

sources to get other income.

In 2010-2011 the company’s performance is decreased due to various reasons, it is better to forecast

the future trends, and make changes in the company’s policies to get good returns.

7.2 CONCLUSION

During the course of the project at Central Bank of India I had the opportunity to view five case studies,

wherein the business firms had submitted application for various credit facilities. The financial statements of

the said five firms were taken up for studies to analyses and understand how banks conduct performance

analysis of their clients for the purpose of taking credit decisions.

From the above analysis it is understood that the clients of the bank submit financial statements for at least a

period of last 3 years along with application form requesting various credit facilities like working capital

limits, term loan, etc.

o The current ratio of Central bank of india was maximum in the year in the 2014-15 which was 1.17

followed by 2013-14 which was 1.12 and 1.14 in 2012-2013 and the quick ratio was 0.63 in the year

2012-13 and in the following year it reduced to 0.62 in 2013-14 it was 0.74 in 2014-2015 This

mainly because of  high realization of sundry debtors on increase in C-liabilities and comparative

decreases in cash and bank balance. Hence the concern is a position to pay its short term liabilities.

o The debt-equity ratio of Central Bank Of India during the year 2012-2013, 2013-2014, 2014-2015

was 0.35, 0.37, 0.26. Proprietary ratio in the 3 years was 0.26, 0.25, and 0.25. So it is concluded that

the solvency position is not very good. If debt equity ratio is high, the owners are putting up

relatively less money of their own. It is a danger signal for the creditors. If the project should fail

financially, the creditors would lose heavily. The greater the ratio, the greater the risk to the creditors.

The above graph shows a mixed trend during last three years. Though the proportionate variation

during last two previous years was very high it is due to high amount of debt taken. The result is

favourable for the bank.

60

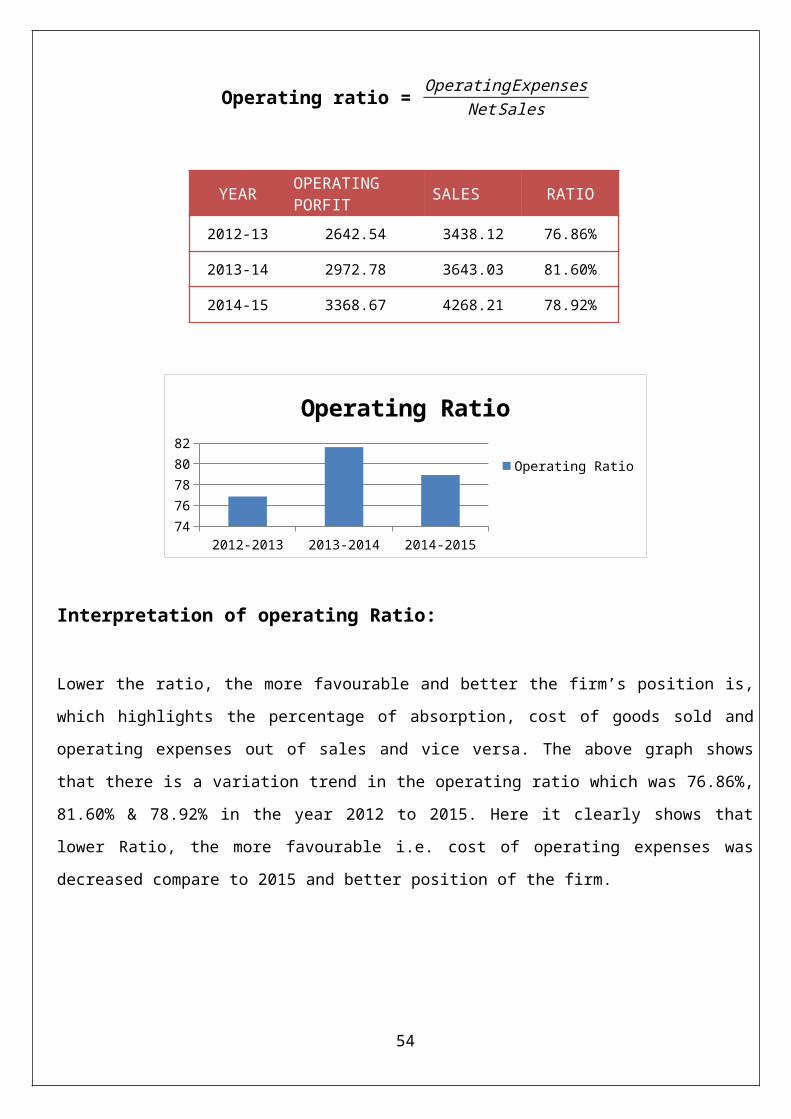
o Profitability ratios i.e. operating ratio , gross profit ratio and net profit ratio for the years 2012-13,

2013-14 , 2014-15 are : gross profit ratio : 23.14% , 18.40% , 21.07% & net profit ratio : 4.4%

2.48% 3.87% , operating ratio : 76.86% 81.60% 78.92%

o Stock turnover ratio: It indicates that more sales are being produced by each rupee of investment in

stock but it may not always, be an indicator of favourably results. It may be the result of a very low

level of stock which results in frequent out of stock position. Such a situation prevents the bank form

meeting customer’ demands and the bank cannot earn maximum profits. so it clearly shows that the

stock turnover ratio is increasing trend every year 2012 to 2015 it was 3.38, 3.73 & 4.35 times

respectively. The stock turnover is better position in the bank.

o

BIBLIOGRAPHY

BOOKS AND WEBSITES REFERED

M. PANDEY (2005), “Financial Management”, ninth edition Vikas Publishing House Pvt. Ltd. S. N. MAHESWARI (2006), “Financial and Management Accounting”, fifth edition, Sultan

Chand & Sons, New Delhi. C. R. KOTHARI, “Research Methodology and Techniques”. Second edition, New Agency

International Pvt. Ltd. BAKER. R .P & HOW WELL. A.C, “The Preparation of Reports”, New York Ronald Press. S.P. GUPTA (1995), “Statistical Methods", Sultan Chand & Co. New Delhi.

www.parleagro.com

www.parleproducts.com

www.google.com (For definitions and Images)

www.dare.co.in

www.hrera.com

Www.wikipedia.com  

61

COMPARATIVE BALANCE SHEET AS ON 31-03-2013 TO 31-03-2015

PARTICULARS(Rs in lacs)

LIABILITIES 31-3-2013 31-3-2014 31-3-2015

Share holders’ Funds1) Capital 189.28 189.28 189.28

s2) Reserves –Gen 123.76 148.76 198.763) Reserves & others 185.37 150.01 116.674) Revaluation Reserves 189.355) P&L a/c 117.42 132.49 189.35

sub total 615.83 620.54 694.06

Term liabilitiesterm loans-Banks

Term loans-FI 116.13 97.54 61.27Deposits payable after -one year 71.17 96.47 96.47

Deferred payment credits 27.1 32.96 24.87Term deposits

DebentureOther term liabilities

sub Total 214.4 226.97 182.61

current LiabilitiesBank borrowings 548.79 536.4 596.02

borrowings-associatesDirectorsOthers

62

Deposits from dealersAdv payment from Dealers 40.52 34.26 59.72

Provision for tax 44.06 63.16dividend 43.16 44.29 66.43Others 63.21 24.96 45.38

Interest payable/Dep/Deb 54.72 55.25 39.87

Others C-Liabilities 285.7 319.13 359.29Sub Total 1558.23 1641.45 1739.24

Grand Total 2388.46 2488.96 2615.91

ASSETS 31-3-2013 31-3-2014 31-3-2015

Fixed Assets

Gross block 1470.15 1575.21 1599.21

less: Depreciation 828.39 924.92 1012.05

Net Block 642.26 650.29 587.22

Capital WIP

Advances for capital –goods

Sub Total 642.26 650.29 587.22

Investment in other COS

Deferred receivables

Goodwill/Miscel Exp Not written off

P&L a/c 0.58 0.65 0.65

63

Sub total 0.58 0.65 0.65

Current Assets

Raw-Materials- Imp 245.53 108.28 78.03

Indag 98.6 159.19 222.9

Work in progress 33.28 57.21 64.89

Finished goods 321.79 401.59 273.79

Stores & Spares 82.94 85.48 99.62

Debtors(<6months)

Export 130.85 69.22 62.19

Local 573.15 651.18 802.42

Debtors(>6months)

Export

local 26.58

Loans and advances

Loans to supplies

Deposits 31

Cash & Bank Balances 99.31 305.87 424.1

Other Current assets 129.36

other C-Assets 129.36

Sub total 1772.19 1838.02 2028.13

Grand Total 2388.46 2488.96 2615.91

64

Analysis of the Profit & Loss a/c as on 31-3-2013 to 31-3-2015

(Rs In lacs)

Gross Sales 31-3-2013 31-3-2014 31-3-2015

domestic Sales 2803.11 3127.69 3879.55

Export sales 934.22 875.3 874.71

total 3737.33 4002.49 4754.26

less: excise duty 299.21 359.96 486.05

Net sales 3438.12 3643.03 4268.21

cost of sales

raw materials 1547.23

Imported 661.83 754.27

Indigenous 1353.82 1426.46

other spares 136.99

Power & fuel 284.16 292.28 334.82

Direct labour 506.74 642.24 642.93

Repairs and maintenance 86.22

other mgt expenses 75.22 10.18 1.77

Depreciation 58.53 62.58 67.12

sub total 2695.09 3022.93 3277.37

add opening WIP 32.58 29.34 57.21

65

Less closing 29.34 57.21 64.84

cost of production 2698.33 2995.06 3269.69

add opting stock of FG 269.74 308.51 330.79

less Closing stock FG 325.53 330.79 231.81

Cost of Sales 2642.54 2972.78 3368.67

Gross Profit 795.58 670.25 899.54

selling gen-adm-expences 490.29 454.69 557.86

interest 94.74 114.42 113.27sub total 585.03 569.11 171.13

operating Profit 210.55 101.14 228.41add: other income 38.83 53.3 60.03profit before tax 249.34 154.44 288.44

provision for taxes 95.26 64.23 123.23

Net P & L 154.08 90.21 165.11

66


Recommended