208
CENTRAL BANK OF EGYPT ECONOMIC REVIEW Vol. 50 No. 2 2009/2010 Research, Development and Publishing Sector
CENTRAL BANK OF EGYPT
ECONOMIC REVIEW
Vol. 50 No. 2
2009/2010
Research, Development and Publishing Sector

The Economic Review is issued by the Research, Development and Publishing Sector at the Central Bank of Egypt (CBE) on a quarterly basis. It aims to make available to a broad readership of specialists and non-specialists a wide range of information on the performance of the Egyptian economy during the reporting period. The CBE posts the Review on its website: www.cbe.org.eg.
Contents
Page Main Monetary and Financial Indicators The Leading Article: Egypt's Yield Curve: Application and Policy Implications
1
1 - Macroeconomic Performance
1/1 - Gross Domestic Product (GDP) 47 1/2 - Employment and Unemployment 54 1/3 - Inflation 56 1/4 - Tourism 63
2 - Monetary and Banking Developments
2/1 - Monetary Policy and Monetary Aggregates 68 2/1/1- Monetary Policy 68 2/1/2- Reserve Money 70 2/1/3- Banknote Issue 72 2/1/4- Domestic Liquidity (M2) and Counterpart Assets 73 2/1/5- Payment Systems and Information Technology (IT) 77 2/1/6- RRTGS and SWIFT Local Services 79 2/2 - Banking and Credit Developments 81 2/2/1- Banking Reform 81 2/2/2- Banking Supervision Sector 84 2/2/3- Banks' Aggregate Financial Position 88 2/2/4- Interbank Money Market in Egypt 90 2/2/5- Deposits 91 2/2/6- Lending Activity 93
3 - Stock Exchange
3/1 - Shares Market 97 3/1/1- Primary (Issue) Market 97 3/1/2- Secondary (Trading) Market 99 3/2 - Bonds Market 100 3/2/1- Primary (Issue) Market 100 3/2/2- Secondary (Trading) Market 101 3/3 - Mutual Funds 101
4 - Public Finance and Domestic Public Debt
4/1- Consolidated Fiscal Operations of the General Government 102 4/2 - Domestic Public Debt 108 4/2/1- Debt of the Government (Net) 108 4/2/2- Debt of Public Economic Authorities 111 4/2/3- Resources and Uses of the National Investment Bank (NIB) 111
5 - External Transactions
5/1 - Foreign Exchange Market 113 5/2 - Balance of Payments 115 5/2/1- Trade Balance 115 5/2/1/1- Merchandise Export Proceeds by Degree of Processing 117 5/2/1/2- Merchandise Import Payments by Degree of Use 117 5/2/1/3- Sectoral Distribution of Commodity Transactions 118 5/2/1/4- Geographical Distribution of Commodity Transactions 120 5/2/2 - Services Balance and Transfers 122 5/2/3 - Capital and Financial Account 125 5/3 - International Finance 127 5/3/1 - FDI in Egypt 129 5/3/2 - External Official Grants 132 5/3/3 - External Debt 135
Annex Statistical Section 141
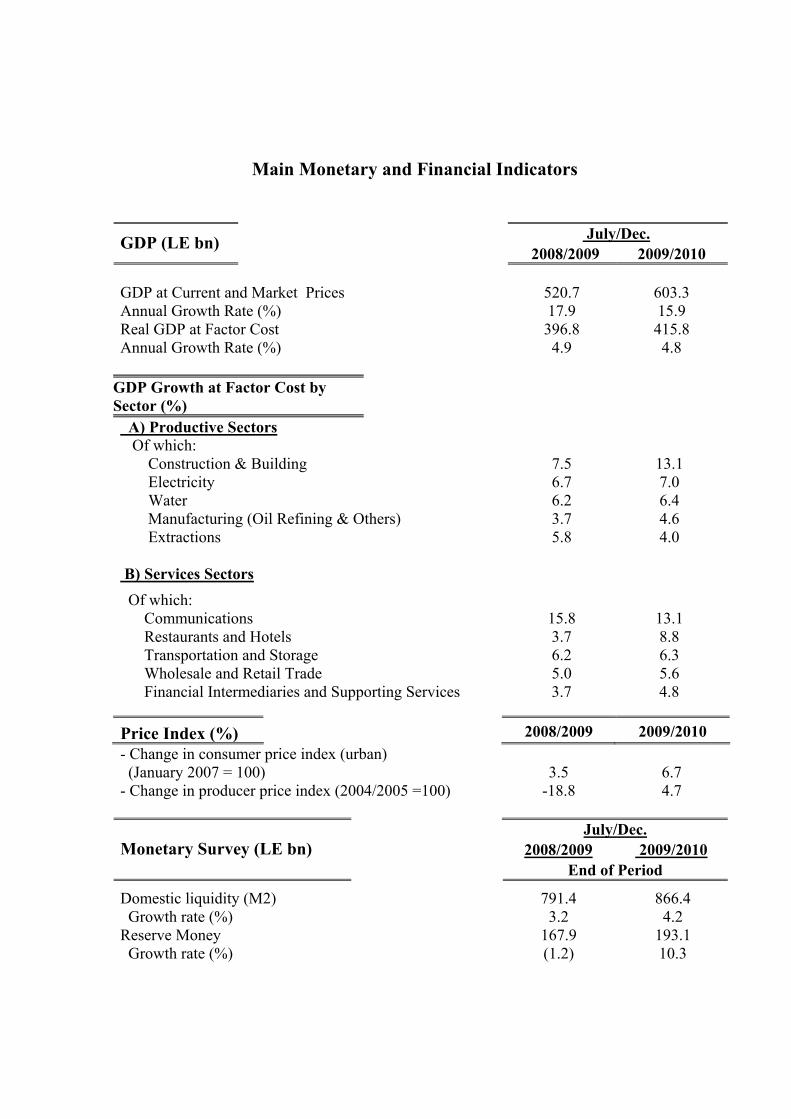
Main Monetary and Financial Indicators
July/Dec. GDP (LE bn) 2008/2009 2009/2010
GDP at Current and Market Prices 520.7 603.3 Annual Growth Rate (%) 17.9 15.9 Real GDP at Factor Cost 396.8 415.8 Annual Growth Rate (%) 4.9 4.8
GDP Growth at Factor Cost by Sector (%)
A) Productive Sectors Of which: Construction & Building 7.5 13.1 Electricity 6.7 7.0 Water 6.2 6.4 Manufacturing (Oil Refining & Others) 3.7 4.6 Extractions 5.8 4.0
B) Services Sectors Of which: Communications 15.8 13.1 Restaurants and Hotels 3.7 8.8 Transportation and Storage 6.2 6.3 Wholesale and Retail Trade 5.0 5.6 Financial Intermediaries and Supporting Services 3.7 4.8
Price Index (%) 2008/2009 2009/2010 - Change in consumer price index (urban) (January 2007 = 100) 3.5 6.7 - Change in producer price index (2004/2005 =100) -18.8 4.7
July/Dec. 2008/2009 2009/2010 Monetary Survey (LE bn)
End of Period
Domestic liquidity (M2) 791.4 866.4 Growth rate (%) 3.2 4.2 Reserve Money 167.9 193.1 Growth rate (%) (1.2) 10.3
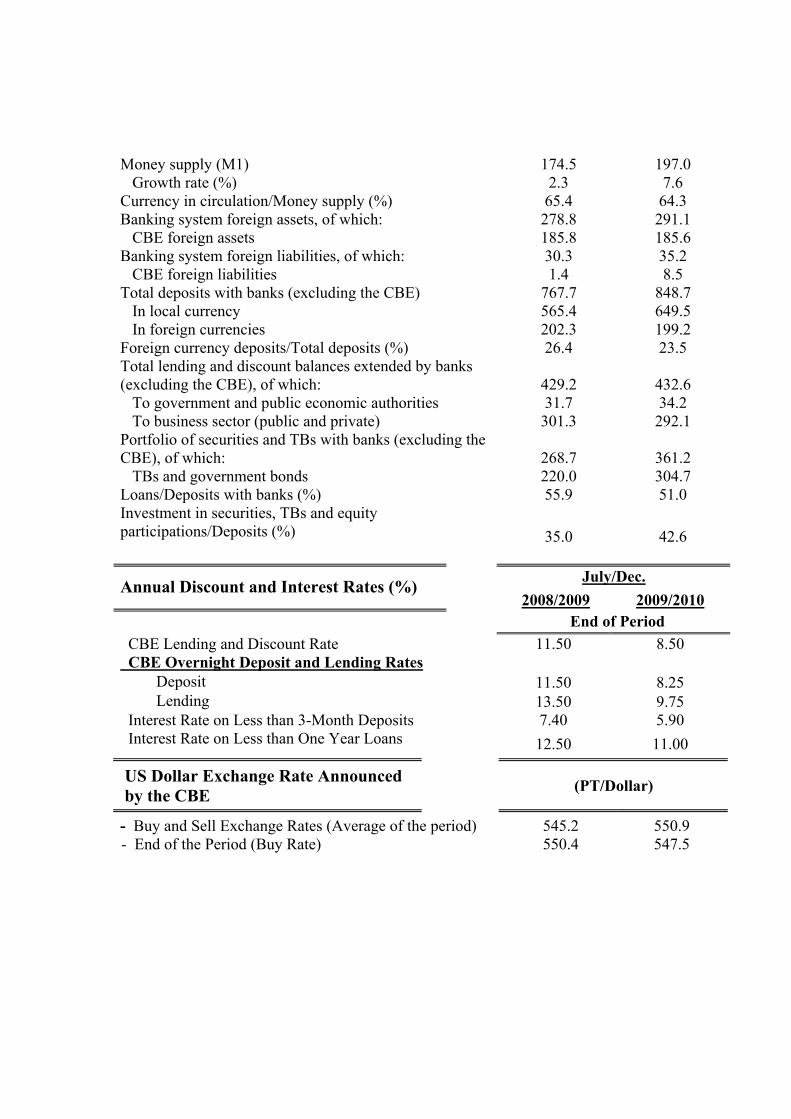
Money supply (M1) 174.5 197.0
Growth rate (%) 2.3 7.6 Currency in circulation/Money supply (%) 65.4 64.3 Banking system foreign assets, of which: 278.8 291.1
CBE foreign assets 185.8 185.6 Banking system foreign liabilities, of which: 30.3 35.2
CBE foreign liabilities 1.4 8.5 Total deposits with banks (excluding the CBE) 767.7 848.7
In local currency 565.4 649.5 In foreign currencies 202.3 199.2
Foreign currency deposits/Total deposits (%) 26.4 23.5 Total lending and discount balances extended by banks (excluding the CBE), of which: 429.2 432.6
To government and public economic authorities 31.7 34.2 To business sector (public and private) 301.3 292.1
Portfolio of securities and TBs with banks (excluding the CBE), of which: 268.7 361.2
TBs and government bonds 220.0 304.7 Loans/Deposits with banks (%) 55.9 51.0 Investment in securities, TBs and equity participations/Deposits (%) 35.0 42.6
US Dollar Exchange Rate Announced by the CBE (PT/Dollar) - Buy and Sell Exchange Rates (Average of the period) 545.2 550.9
- End of the Period (Buy Rate) 550.4 547.5
July/Dec. Annual Discount and Interest Rates (%) 2008/2009 2009/2010
End of Period CBE Lending and Discount Rate 11.50 8.50 CBE Overnight Deposit and Lending Rates Deposit 11.50 8.25 Lending 13.50 9.75 Interest Rate on Less than 3-Month Deposits 7.40 5.90 Interest Rate on Less than One Year Loans 12.50 11.00
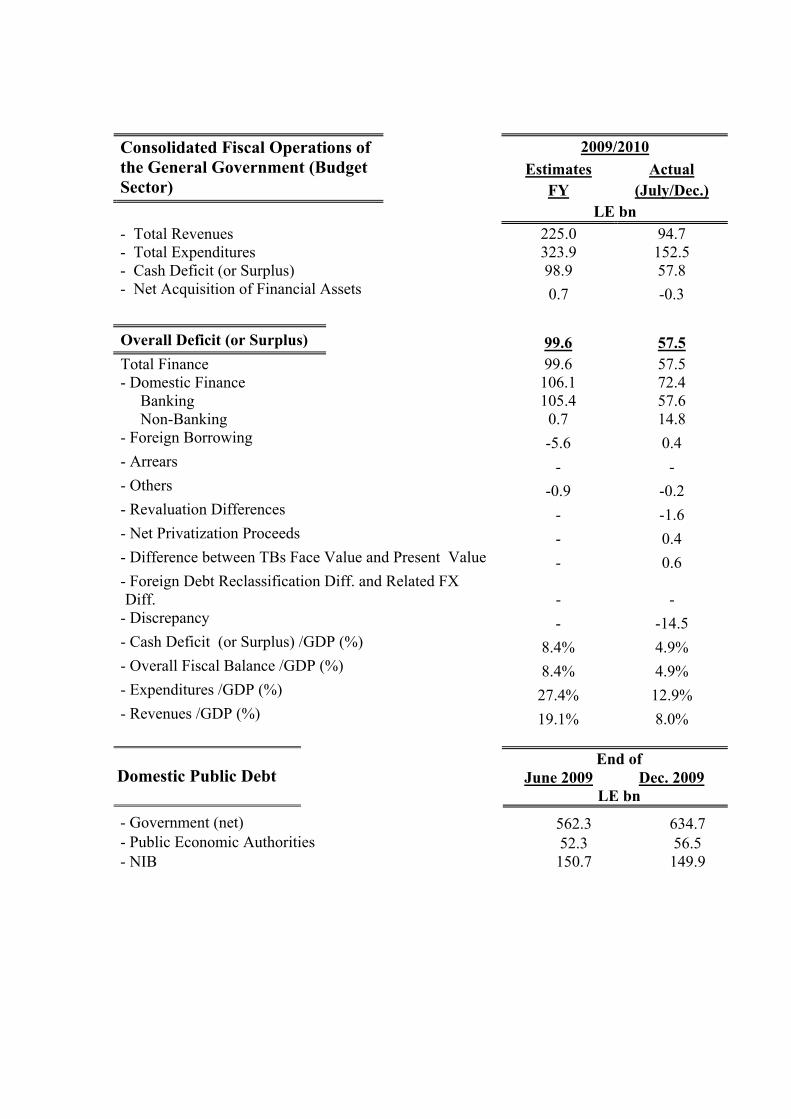
2009/2010 Estimates Actual
Consolidated Fiscal Operations of the General Government (Budget Sector) FY (July/Dec.)
LE bn - Total Revenues 225.0 94.7 - Total Expenditures 323.9 152.5 - Cash Deficit (or Surplus) 98.9 57.8 - Net Acquisition of Financial Assets 0.7 -0.3
Overall Deficit (or Surplus) 99.6 57.5 Total Finance 99.6 57.5 - Domestic Finance 106.1 72.4 Banking 105.4 57.6 Non-Banking 0.7 14.8 - Foreign Borrowing -5.6 0.4 - Arrears - - - Others -0.9 -0.2 - Revaluation Differences - -1.6 - Net Privatization Proceeds - 0.4 - Difference between TBs Face Value and Present Value - 0.6 - Foreign Debt Reclassification Diff. and Related FX Diff. - -
- Discrepancy - -14.5 - Cash Deficit (or Surplus) /GDP (%) 8.4% 4.9% - Overall Fiscal Balance /GDP (%) 8.4% 4.9% - Expenditures /GDP (%) 27.4% 12.9% - Revenues /GDP (%) 19.1% 8.0%
End of
June 2009 Dec. 2009 Domestic Public Debt LE bn
- Government (net) 562.3 634.7 - Public Economic Authorities 52.3 56.5 - NIB 150.7 149.9

US$ bn July/Dec. Balance of Payments 2008/2009 2009/2010
Current Account & Transfers (2.5) (1.3) Trade Balance (14.6) (11.9) Merchandise Exports 13.6 11.5
Oil and its Products % 44.0 43.3 Others % 56.0 56.7 Merchandise Imports 28.2 23.4 Intermediate Goods % 35.2 32.5 Investment Goods % 21.1 21.2
Consumer Goods % 16.9 25.2 Fuel, Raw Materials and Others % 26.8 21.1
Services Balance 7.5 6.3 Receipts, of which: 13.6 12.3
Transportation % 31.4 28.3 Travel % 42.3 49.0
Investment Income % 10.7 4.1 Payments, of which: 6.1 6.0
Transportation % 15.2 10.1 Travel % 24.9 22.0 Investment Income % 11.8 31.0
Transfers 4.6 4.3 Official % 10.9 20.7 Private % 89.1 79.3 Capital and Financial Account 2.0 3.3 Overall Surplus/(Deficit) (0.5) 2.6 Outstanding External Debt (at End of Dec.) 32.1 33.3

The Leading Article
- 1 -
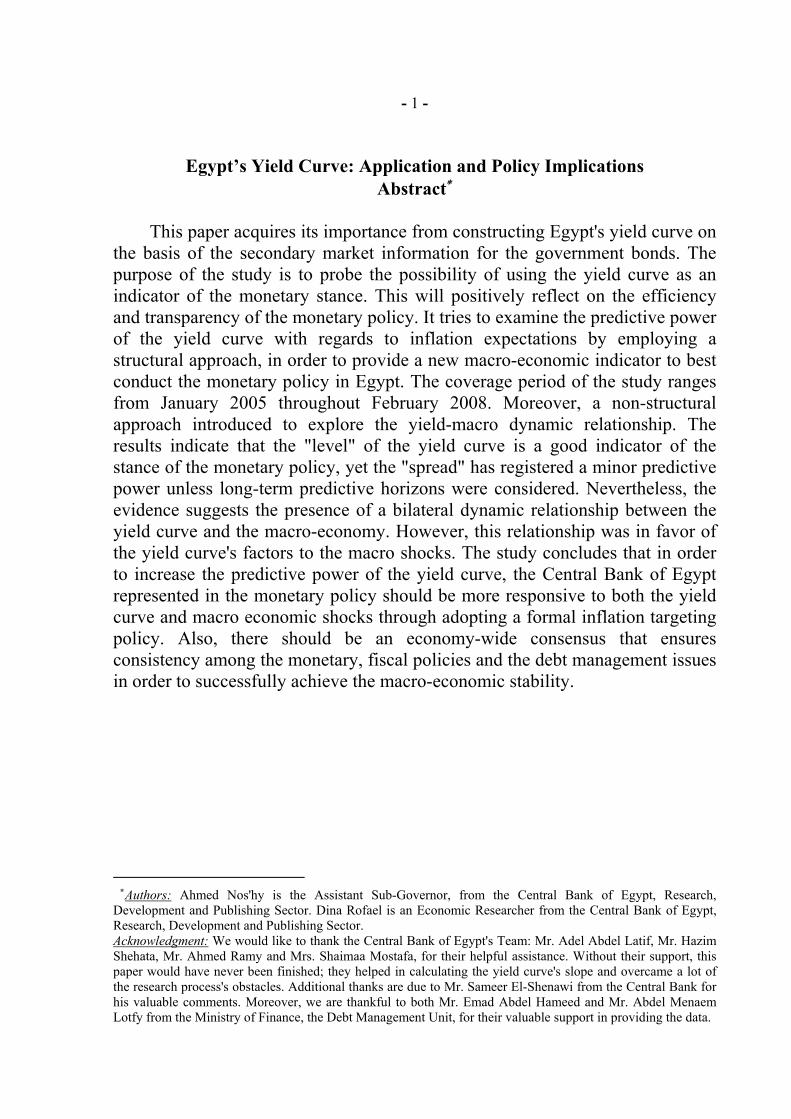
Egypt’s Yield Curve: Application and Policy Implications Abstract∗
This paper acquires its importance from constructing Egypt's yield curve on
the basis of the secondary market information for the government bonds. The purpose of the study is to probe the possibility of using the yield curve as an indicator of the monetary stance. This will positively reflect on the efficiency and transparency of the monetary policy. It tries to examine the predictive power of the yield curve with regards to inflation expectations by employing a structural approach, in order to provide a new macro-economic indicator to best conduct the monetary policy in Egypt. The coverage period of the study ranges from January 2005 throughout February 2008. Moreover, a non-structural approach introduced to explore the yield-macro dynamic relationship. The results indicate that the "level" of the yield curve is a good indicator of the stance of the monetary policy, yet the "spread" has registered a minor predictive power unless long-term predictive horizons were considered. Nevertheless, the evidence suggests the presence of a bilateral dynamic relationship between the yield curve and the macro-economy. However, this relationship was in favor of the yield curve's factors to the macro shocks. The study concludes that in order to increase the predictive power of the yield curve, the Central Bank of Egypt represented in the monetary policy should be more responsive to both the yield curve and macro economic shocks through adopting a formal inflation targeting policy. Also, there should be an economy-wide consensus that ensures consistency among the monetary, fiscal policies and the debt management issues in order to successfully achieve the macro-economic stability.
∗ Authors: Ahmed Nos'hy is the Assistant Sub-Governor, from the Central Bank of Egypt, Research,
Development and Publishing Sector. Dina Rofael is an Economic Researcher from the Central Bank of Egypt, Research, Development and Publishing Sector. Acknowledgment: We would like to thank the Central Bank of Egypt's Team: Mr. Adel Abdel Latif, Mr. Hazim Shehata, Mr. Ahmed Ramy and Mrs. Shaimaa Mostafa, for their helpful assistance. Without their support, this paper would have never been finished; they helped in calculating the yield curve's slope and overcame a lot of the research process's obstacles. Additional thanks are due to Mr. Sameer El-Shenawi from the Central Bank for his valuable comments. Moreover, we are thankful to both Mr. Emad Abdel Hameed and Mr. Abdel Menaem Lotfy from the Ministry of Finance, the Debt Management Unit, for their valuable support in providing the data.

- 2 -
Table of Contents
Introduction:
Section One: Literature Review of the Yield Curve and Its Application
1.1 Yield Curve in Theory:
1.1.1 The Normal Yield Curve:
1.1.2 The Flat or the Humped Yield Curve:
1.1.3 The Inverted Yield Curve:
1.2 Yield Curve in Application:
Section Two: The Evolution of the Yield Curve and Monetary Policy in Egypt (2005 – 2008)
2.1 Evolution of the Yield Curve in Egypt over the Period (2005-2008):
2.2 Evolution of the Monetary Policy in Egypt over the Period (2005-2008):
Section Three: Egypt's Yield Curve and the Macro-economy
3.1 Testing Egypt's Yield Curve's Predictive Power:
3.2 Testing the Dynamic Interaction between Egypt's Yield Curve and the Macro-economy:
3.2.1 Macro Responses to Yield Curve Shocks:
3.2.2 Yield Curve Responses to Macro Shocks:
Conclusion
Policy Recommendations
References
Appendix
- 3 -
List of Tables
1 Johansen Co-integration test
2 Estimation Results of the Inflation Expectation based on the Yield Curve Information - [3months Lag]
3 Estimation Results of the Inflation Expectation based on the Yield Curve Information - [6months Lag]
4 Estimation Results of the Inflation Expectation based on the Yield Curve Information - [9months Lag]
5 Estimation Results of the Inflation Expectation based on the Yield Curve Information - [12months Lag]
6 Choice of VAR Lag Length (Carried out for the Basic Model of Inflation, Deposit, Real T-Bills and Spread)
7 Pair-wise Granger Causality Test
8 The Variance Decomposition of the Spread and the Inflation Rate
9 Estimation Results for Yields-Macro Transition Equation based on the Lag Specification (1 1)
10 The Calculated Share of the Government Bonds held by the Banking Sector
List of Figures
1 Common Yield Curves
2 Government Bonds held by the Banking Sector as a Percentage of the Total Listed Government Bonds
3 Egypt's Yield Curve in Selected Time Points
4 Comparison between the Raw Spread Rate and the Calculated Spread Rate
5 Dynamism of the Yield-Macro Relationship
6 Impulse Response Functions for the Yield-Macro Equation based on the Lag specification (11)
7 7Residuals obtained from the Unrestricted VAR (1) Model

- 4 -
Introduction
It has been argued in a wide range of working papers, whether the yield curve has got a predictive power or not -based on its level and slope information- concerning the economic growth, inflation and the interest rate, so it can be considered as a macroeconomic indicator.
Kotlán (2002) confirms that the predictive power of the yield slope (spread)
is dependent upon the monetary policy. He concludes that, when the monetary authority pays more attention to inflation, i.e. when inflation targeting exists, the predictive power of the yield spread increases (through the monetary authority’s reaction function).
For Egypt, starting from the year 2005, the Ministry of Finance began to
activate Law no.480 and Law no.723 issued in the year 2002, which organize the trading of Primary Dealers in the Treasury securities secondary market. This was to better reflect the true value of the assets and to free their rate of return.
Correspondingly, in June 2005, the Central Bank of Egypt (CBE) has
announced, that it would adopt a formal inflation targeting framework, upon the fulfillment of certain prerequisites. Over the transition period, the CBE is going to rely on "Overnight Interest Rates" on both the deposits and lending as the operational targets and the outer bounds of the corridor system, in order to curb inflationary pressures.
In this context, the study sheds light on Egypt's Yield Curve as a macro-
economic indicator that helps implement the monetary policy in Egypt, especially when inflation targeting framework exists. The methodology used in this paper relies, primarily, on the "Spread" as being the difference between the rate of return on the long term security and that of the short term one. The spread will reflect the shape of the yield curve at each time point. It also incorporates the level of the yield curve as being a potential source of information about the stance of the monetary policy.
To explore the yield curve's predictive ability regarding inflation
expectations, we have employed the approach offered by Kozicki (1997), the European Central Bank (2006) following Stock and Watson (2003), and others; who use the h-step ahead forecasting regression. In addition, the Unrestricted Vector Auto-Regression (VAR) model and Impulse Response Functions were employed to characterize the dynamism and the direction of interactions between macroeconomic factors (inflation rate and the stance of monetary policy) and yield curve factors (level and slope).
- 5 -
It is quite obvious that the strength of the dynamic relationship between the
yield curve and macro-economy relies intensively on the magnitude of the monetary policy reaction to macro-economic deviations from targets. This was due to the fact that macro-economic factors (e.g.: inflation rate) are affected by the yield curve factors only through the monetary policy tools.
Worth mentioning, the slope of the yield curve has got a predictive power
over the long term horizons as shown from the VAR analysis. However, it proves to have weak evidence at shorter horizons as illustrated by the structural model of the inflation expectation. On the contrary, the short end of the yield curve represented in the Treasury Bill rate, has proved to be a good indicator of the monetary policy stance; as it moves very close to the proxy of the monetary policy instrument (3 month deposit rate)1 either in the short or the long predictive horizons.
Evidence proves that Egypt's monetary policy has a negligible magnitude
of its reaction to macroeconomic deviations, which may weaken the predictive ability of Egypt's yield curve that has been argued to rely intensively on the monetary policy reaction to macroeconomic deviations from targets. This may partly be explained by the fact that the time series covered short period on the one hand, and the main concern of the monetary policy during that period was to face the second round of the supply shock on the other hand.
The paper is organized as follows: section one reviews the theories that
explain the shapes of the yield curve in addition to featuring a group of working papers that deal with the applications of the yield curve. Section two deals with the evolution of both the yield curve and monetary policy framework in Egypt over the study period ranging from January 2005 to February 2008. Section three addresses the econometric approaches to examine the predictive power of Egypt's yield curve, in addition to determining the dynamic interaction between the yield curve and macro-economy. Finally, the study ends up with the conclusion and policy recommendations.
1 The calculations are employed on both overnight rate on deposits and the 3 months deposit rate, although the
results are very close, the paper sticks to the 3 months deposit rate being a proxy of the monetary policy instrument in order to reflect the transmission mechanism.
- 6 -
Section One
Literature Review of the Yield Curve and Its Applications
Much effort has been made to pick out the information embedded in the
yield curve and the term structure in particular. It has been argued in a wide range of working papers, whether the yield curve has got a predictive power or not concerning economic growth, inflation and the interest rate; so it can be considered as a macroeconomic indicator.
1.1 Yield Curve in Theory:
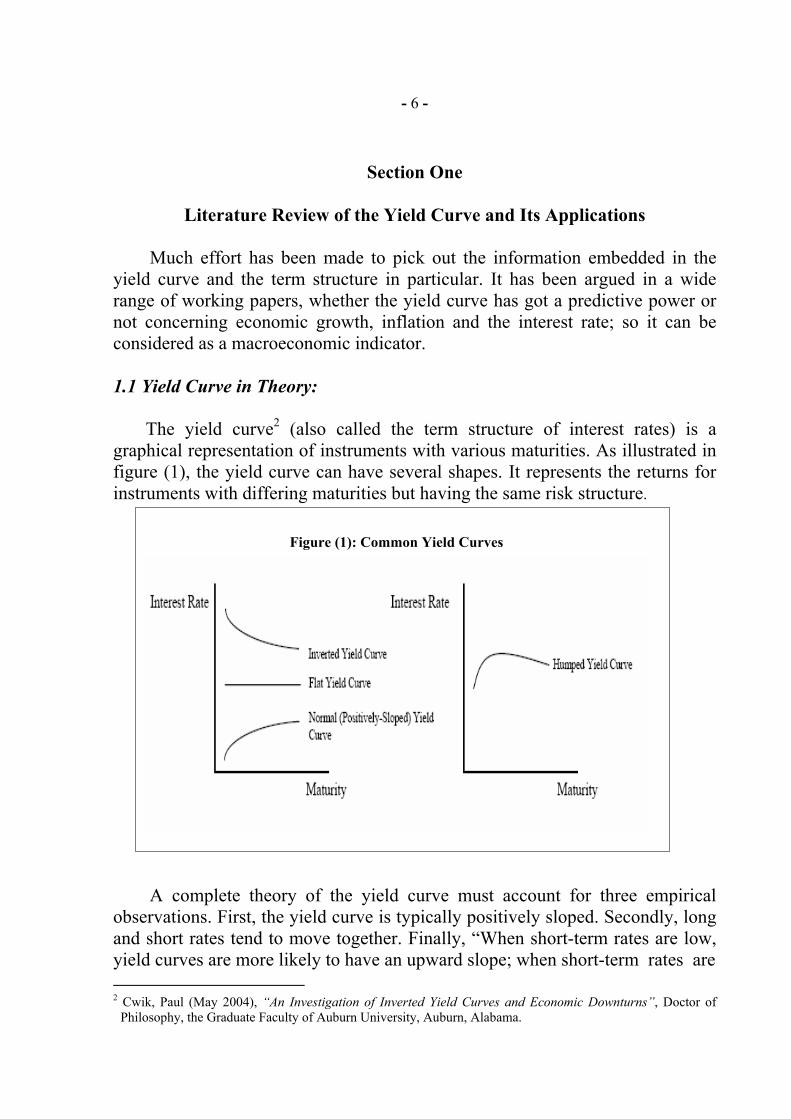
The yield curve2 (also called the term structure of interest rates) is a graphical representation of instruments with various maturities. As illustrated in figure (1), the yield curve can have several shapes. It represents the returns for instruments with differing maturities but having the same risk structure.
A complete theory of the yield curve must account for three empirical observations. First, the yield curve is typically positively sloped. Secondly, long and short rates tend to move together. Finally, “When short-term rates are low, yield curves are more likely to have an upward slope; when short-term rates are 2 Cwik, Paul (May 2004), “An Investigation of Inverted Yield Curves and Economic Downturns”, Doctor of
Philosophy, the Graduate Faculty of Auburn University, Auburn, Alabama.
Figure (1): Common Yield Curves
- 7 -
high, yield curves are more likely to slope downward and be inverted”. The third factor restated is that long rates tend to remain stable relative to short rates.
1.1.1 The Normal (Regular) Yield Curve:
The yield curve has usually been "normal", meaning that yields rise as maturity lengthens (i.e., the slope of the yield curve is positive). This positive slope reflects the "Liquidity Preference Hypothesis" and stems from Keynes's line of reasoning on the demand for money. According to this model, money, the most liquid asset has no interest rate and less liquid asset will yield higher return as long as the maturity of the asset increases.
Moreover, the steepness of the yield curve stems from the investors'
expectations that the economy would grow in the future and, importantly, for this growth to be associated with a greater expectation that inflation will rise in the future rather than fall. This expectation of higher inflation leads to expectations that the central bank will tighten monetary policy by raising short term interest rates in the future to slow economic growth and dampen inflationary pressure. It also creates a need for a risk premium associated with uncertainty about the future rate of inflation and the risk this poses upon the future value of cash flows. Investors price these risks into the yield curve by demanding higher yields for maturities further into the future.
Worth mentioning, the degree of steepness of the curve will reflect the
confidence level in the implemented monetary policy, i.e. the more steepness of a positive yield curve, the greater the degree of uncertainty and less confidence in the implemented monetary policy and vice versa.
1.1.2 The Flat or the Humped Yield Curve:
A flat yield curve is observed when all maturities have similar yields,
whereas a humped curve results when short-term and long-term yields are equal and medium-term yields are higher than those of the short-term and long-term. A flat curve sends signals of uncertainty in the economy. This mixed signal can revert back to a normal curve or could later result into an inverted curve. The flat yield curve will send mixed signals of uncertainty for the following two reasons:
- 8 -
i. It is not clear to the market participants during these episodes, whether
the yield curve will invert into upwards or downwards shape, i.e.: the market is not certain whether the economy will experience expansionary or tight conditions in the future.
ii. The market environment is sending mixed signals to investors, who are
interpreting interest rate movements in various ways. It is difficult for the market to determine whether interest rates will move significantly in either direction farther into the future.
1.1.3 The Inverted Yield Curve3:
An inverted yield curve occurs when long-term yields fall below short-term
yields. Under this abnormal and contradictory situation, long-term investors will settle for lower yields in this case, if they think the economy will slow or even decline in the future. An inverted curve may indicate a worsening economic situation in the future. In addition to potentially signaling an economic decline, inverted yield curves also imply that the market believes inflation will remain low. This is because, even if there is a recession, a low bond yield will still be offset by low inflation.
In the framework of the interest rate and yield curve theories, six major
theories have evolved; the Expectations Hypothesis Theory, the Liquidity Preference Hypothesis, the Segmented Markets Theory, the Preferred-Habitat Theory, a Stochastic-Process No-Arbitrage Approach, and a theory unique to Rothbard. Our concern is summarized in the Expectations Hypothesis Theory, where the framework of analyzing key economic factors determines how the yield curve responds to monetary policy.
The paper is going to rely on the Expectations Hypothesis Theory for the
reason that it has a vast range of applications especially in testing the predictive ability of the yield curve in the prediction of inflation and output in both the developed and the emerging economies. According to the Expectations Hypothesis Theory, the interest rate on the security contains 2 elements: information about financial market expectations of monetary policy over the life of the security and a term premium to compensate for risk. Moreover, The Expectations Hypothesis provides a simple way to link monetary policy actions to fluctuations of bond yields and forward rates, since for example, the 10-year rate will change whenever these rates change. 3 http://www.answers.com/yield+curve?nr=1&lsc=true&cat=biz-fin
- 9 -
The Expectations Hypothesis Theory assumes that all financial instruments along the yield curve are perfectly substitutable. The shape of the yield curve is dependent upon two factors: present short interest rates and expected future short interest rates. As described by Fisher’s model, short interest rates are determined by both time-preference and the marginal productivity of capital. The n-period model is demonstrated by the following equation:
Where in,t is the yield for an n-year bond for time period t, and ie1,t+1 is the
expected interest rate for a one-year bond at time period t+1. The long rates are determined based on the expected movements of future short rates. The theory assumes that investors are endowed with rational expectations, face low information costs and operate in a market where all assets’ prices are reflected in their fundamental value. In equilibrium, the price of a bond equals its discounted present value.
A positively sloped yield curve will emerge only if economic actors believe
that future interest rates will rise. With the expectation of higher future rates, the future returns are discounted by a larger interest rate. As a result, the present value of bonds falls. Investors enter into forward contracts to hedge against interest rate risk. The forward rates act as an unbiased estimate of future spot rates, causing the yield curve to have a positive slope. A limitation of this theory is that it can only explain the rotations of the yield curve but cannot explain the shifts.
A second key factor influencing both near-term and longer-term rates is a
term premium. The latter represents the extra compensation for risk that an investor may require for extending the maturity of his investment. In addition, there is considerable evidence suggesting that the term premia are time varying and so may contribute to changes in the yield curve over time. Term Premia may change for several reasons; institutional features such as variation in the relative supply and demand for treasury securities may be reflected in term premia, in addition to the investors' inflation perceptions4.
4 Kozicki, Sharon and Gordon Sellon (2005), "Longer-Term Perspectives on the Yield Curve and Monetary
Policy", Economic Review, Fourth Quarter 2005, Federal Reserve Bank of Kansas City.
i1,t + ie1,t+1 + ie
1,t+2 + … + ie1,t+ n -1
n i n , t = i
- 10 -
Recent advances in yield curve theory focus on the relationship between
the yield and macroeconomic variables such as growth, inflation, and future interest rates. The yield curve is often used as an indicator of the type of monetary policy being pursued, i.e. the stance of the monetary policy.
1.2 Yield Curve in Application:
The Expectations Hypothesis Theory leads to the idea of the yield curve as
a predictor of future inflation, positing that long-term rates are based upon the investors’ expectations of future interest rates (and therefore inflation). An increase in current long rates indicates that investors expect future short rates to increase. Several authors have found considerable evidence of a relationship between the yield curve and inflation.
Despite these positive results in this literature, there are those who have
found that the relationship does not hold. In addition to those who have found results that support and deny the relationship between the yield curve and inflation, there are those who find mixed results. They all find some predictive power of the yield curve to forecast inflation, but the results are relatively weak. A recent study by Blake, Henry and Robertson (2002), finds some informational content at the longer rate segments, but it admits that these results are not robust. Instead of using the Expectations Hypothesis Theory, Ferderer and Shadbegian (1993) add a term premium to the theory. They find that market participants gradually learned about changes in monetary policies. In other words, authors claim that market forecasts will accurately reflect market beliefs, but only after a period of time when investors “figure out” the latest Central Bank policy5.
Current monetary policy has a significant influence on the yield curve
spread and hence on real activity over the upcoming several quarters. A rise in the short rate tends to flatten the yield curve as well as slow real growth in the near term. This relationship, however, is only one part of the explanation for the yield curve’s usefulness as a forecasting tool. Expectations of future inflation and real interest rates contained in the yield curve spread also seem to play an important role in the prediction of economic activity. The yield curve spread variable examined here corresponds to a forward interest rate applicable from three months to ten years into the future. As explained in Mishkin (1990a, 1990b), this rate can be decomposed into expected real interest rate and
5 The paper will show that the evidence in Egypt has proved this argument, since the yield curve is able to expect
inflation after 16 months of the CBE reaction to inflation shocks; this will be illustrated in detail in part three of the study.
- 11 -
expected inflation components, each of which may be helpful in forecasting. The expected real rate may be associated with expectations of future monetary policy and hence of future real growth6. Moreover, because inflation tends to be positively related to activity, the expected inflation component may also be informative about future growth7.
Evans and Marshall (1998) find evidence that contraction monetary policy
increases term premia for shorter maturities, raising real interest rates. A money supply shock raises the level of the yield curve but reduces its slope and curvature. The effects of the monetary shock on the slope and curvature dissipate in 4-6 months and the yield curve returns to its original level within 6 months. The authors’ results for long-term rates fit the Expectations Hypothesis.
Estrella (1998) had conducted a rational expectation model based on the
following economic components: the Expectations Hypothesis, a short-run Phillips curve, the IS curve, a monetary authority reaction function, and the Fisher Equation. The model suggests that the empirical regularities are not structural but are significantly affected by national monetary policy. When the monetary authority reacts to levels of national income below full employment, the yield curve is an optimal predictor, for recession prediction purposes.
Kotlán (2002) confirms that the predictive ability of the yield spread is
dependent on the monetary policy. However, his results oppose Estrella (1998). Kotlán (2002) concludes that, when the monetary authority pays more attention to inflation, i.e. when inflation targeting exists, the predictive ability of the yield spread increases (through the monetary authority’s reaction function).
Kim (2000) based his analysis on the Expectations Hypothesis; he
decomposes the yield curve into an expectations effect and a term premium effect. While both variables are significant, Kim (2000) performs a Wald test to determine that the expectations effect is slightly stronger8.
6 This conclusion can be applied to developed countries but perhaps not upon Egypt's case, since Egypt's
economy historically suffered from "Inflationary Recession", that's why each case of recession and inflation prediction should be separately examined.
7 Estrella, Arturo and Frederic S. Mishkin (June 1996), “The Yield Curve as a Predictor of U.S. Recessions”, Federal Reserve Bank of New York, Current Issues in Economics and Finance,VOL.2, Number 7. New York, U.S.A.
8 Cwik, Paul (May 2004), “An Investigation of Inverted Yield Curves and Economic Downturns”, Doctor of Philosophy, the Graduate Faculty of Auburn University, Auburn, Alabama.
- 12 -
It was argued by (Estrella, 2005) that the slope of the yield curve has
empirically shown to be a significant predictor of inflation and real economic activity, but there is no standard theory as to why the relationship exists. Estrella constructed an analytical rational expectations model to investigate reasons behind the empirical results; the model suggests that relationships are not structural but are rather influenced by the monetary policy regime. However, the yield curve should have predictive power in all circumstances.
A conclusion frequently cited, is that the yield curve tends to flatten when
there is tightening of monetary policy. This is likely to happen due to the fact that when the monetary authority decides to adopt a tightening policy, this implies that short term interest rate will increase followed by an increase in the short end of the yield curve (a good indicator of the stance of the monetary policy). This action will induce the market participants to have a higher degree of confidence in the implemented policy, therefore, they will expect that the monetary authority is capable to curb the inflationary pressures in the future; consequently, they will not demand an extra risk premium for the longer maturities, that will keep the interest rate on these maturities at the same level, and at the meantime, short term interest rates are increasing, that's why a tightening monetary policy is likely to flatten the shape of the yield curve.
Importantly, if the monetary policy is essentially reactive to deviations of
inflation from target and output from potential, the predictive relationships for output and inflation depend primarily on the magnitudes of the reaction parameters. If the monetary authority systematically optimizes to achieve certain goals with regard to inflation and output variability, the predictive power of the yield curve is more directly dependent on the structure of the macro-economy9, i.e. the more responsiveness of the monetary policy in terms of higher magnitudes to inflation and output deviations from targets, the more the predictive power of the yield curve.
As mentioned above the evidence of the predictive role of the yield curve
has been justified for the industrial and developed countries, the standard economic rationale for these findings is that the slope of the yield curve is a monetary policy indicator. Again the monetary tightening results in short-term interest rates are high relative to long-term interest rates. According to Fisher equation, the nominal interest rate reflects market expectations of both future 9 Estrella, Arturo (February 2005), "Why Does the Yield Curve Predict Output and Inflation?", Federal Reserve
Bank of New York, New York, U.S.A.
- 13 -
inflation and the real rate for a given maturity. The slope of the yield curve should therefore reflect expected inflation, in line with this, Mishkin (1990) finds predictive content of the US yield curve for domestic inflation.
However, the absence of evidence for emerging economies reflects the very
reason that the bond markets have started to deepen significantly only since the turn of the millennium. That's why Stock and Watson have concluded that "Universality of the predictive power of the yield curve in predicting recession and inflation is unresolved". The development of domestic debt security markets in these economies in the very recent years reflects their efforts to self-insure against "sudden stops" in international capital flows. Many economies -including Egypt's - have managed to extend debt duration and to give emphasis on longer maturities as an aspect of government securities diversification10, parallel to the availability of the short term instruments for liquidity purposes.
The following part of the study will be dealing with the evolution of the
monetary policy and the formation of Egypt's Yield Curve over the study period starting from the beginning of primary dealers' system activation in 2005 which coincides with the formal inflation targeting framework announced by the Central Bank of Egypt since June 2005.
10 Mehl, Arnoud (2006), "The Yield Curve as a Predictor and Emerging Economies", Bank of Finland, Institute
for Economies in Transition, BOFIT Discussion Papers.
- 14 -
Section Two
The Evolution of the Yield Curve and Monetary Policy in Egypt
(2005 – 2008)
Revisiting the Treasury bonds market in Egypt is very important to have a clue about the degree of activeness of these bonds and consequently to have a preliminary overview about Egypt's yield curve and its predictive ability. In other words, do the information incorporated in the yield curve reflect the market anticipations and perceptions or not? If not, what should be done to increase the predictability of this indicator to better conduct the monetary policy in Egypt?
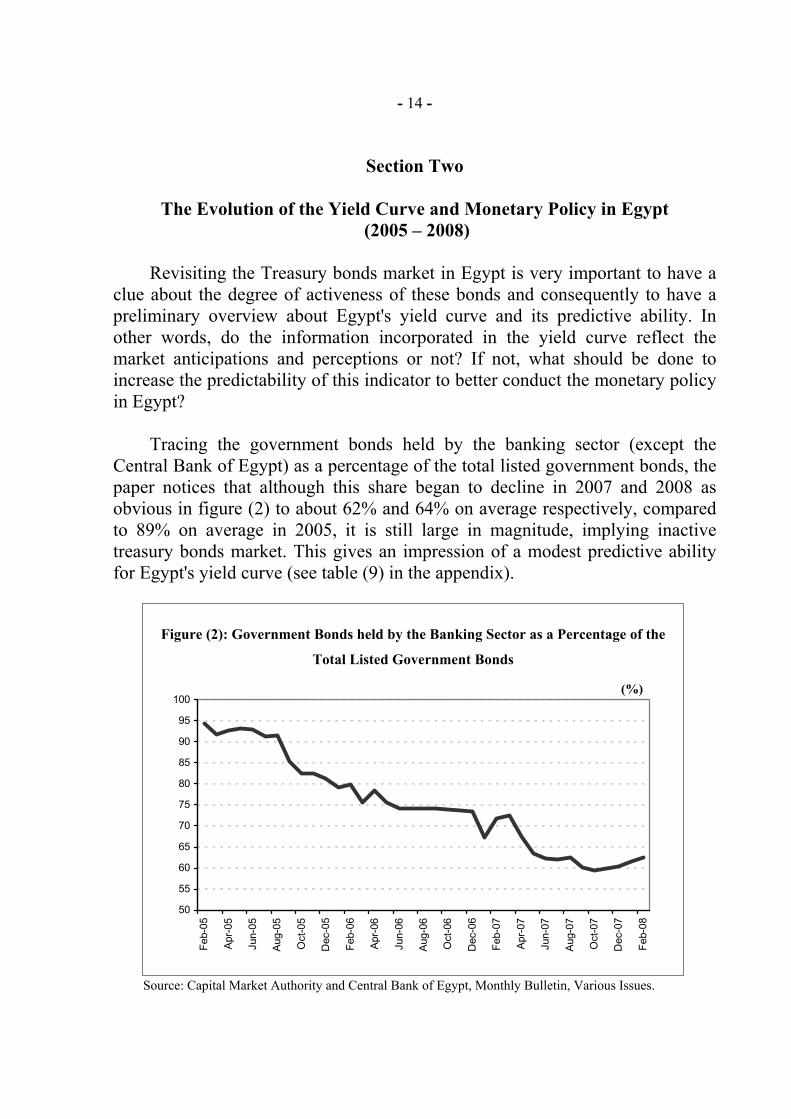
Tracing the government bonds held by the banking sector (except the
Central Bank of Egypt) as a percentage of the total listed government bonds, the paper notices that although this share began to decline in 2007 and 2008 as obvious in figure (2) to about 62% and 64% on average respectively, compared to 89% on average in 2005, it is still large in magnitude, implying inactive treasury bonds market. This gives an impression of a modest predictive ability for Egypt's yield curve (see table (9) in the appendix).
Source: Capital Market Authority and Central Bank of Egypt, Monthly Bulletin, Various Issues.
Figure (2): Government Bonds held by the Banking Sector as a Percentage of the
Total Listed Government Bonds
50
55
60
65
70
75
80
85
90
95
100
Feb-
05
Apr
-05
Jun-
05
Aug
-05
Oct
-05
Dec
-05
Feb-
06
Apr
-06
Jun-
06
Aug
-06
Oct
-06
Dec
-06
Feb-
07
Apr
-07
Jun-
07
Aug
-07
Oct
-07
Dec
-07
Feb-
08
(%)
- 15 -
Less active treasury bonds implies they have a modest ability to reflect the market anticipations about future inflation or recession, therefore less ability to reflect the investors preferences towards long or short term securities. Unfortunately, this situation will lessen the predictive ability of the yield curve, unless more active treasury bonds market will exist in the future.
Introducing the yield curve and the construction of this important indicator
is a very recent issue in developing countries in general and in Egypt in particular. Although Egypt's yield curve could have been constructed since the activation of primary dealers system in November 2004, the paper's coverage period starts from January 2005, given that no significant amount of government securities have been traded in the last two months of 2004.
2.1 Evolution of the Yield Curve in Egypt over the Period (2005-2008):
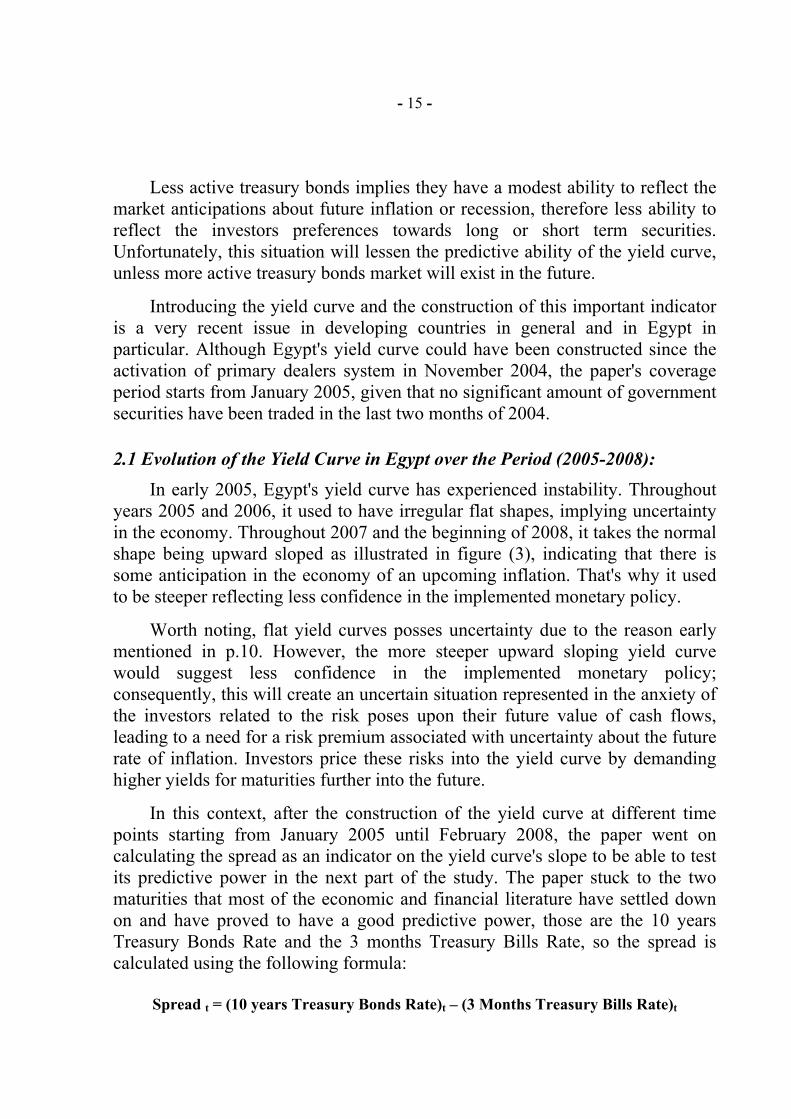
In early 2005, Egypt's yield curve has experienced instability. Throughout years 2005 and 2006, it used to have irregular flat shapes, implying uncertainty in the economy. Throughout 2007 and the beginning of 2008, it takes the normal shape being upward sloped as illustrated in figure (3), indicating that there is some anticipation in the economy of an upcoming inflation. That's why it used to be steeper reflecting less confidence in the implemented monetary policy.
Worth noting, flat yield curves posses uncertainty due to the reason early
mentioned in p.10. However, the more steeper upward sloping yield curve would suggest less confidence in the implemented monetary policy; consequently, this will create an uncertain situation represented in the anxiety of the investors related to the risk poses upon their future value of cash flows, leading to a need for a risk premium associated with uncertainty about the future rate of inflation. Investors price these risks into the yield curve by demanding higher yields for maturities further into the future.
In this context, after the construction of the yield curve at different time
points starting from January 2005 until February 2008, the paper went on calculating the spread as an indicator on the yield curve's slope to be able to test its predictive power in the next part of the study. The paper stuck to the two maturities that most of the economic and financial literature have settled down on and have proved to have a good predictive power, those are the 10 years Treasury Bonds Rate and the 3 months Treasury Bills Rate, so the spread is calculated using the following formula:
Spread t = (10 years Treasury Bonds Rate)t – (3 Months Treasury Bills Rate)t
- 16 -
In this regard, the paper faced some obstacles, since it found differentiated time points in our sample where the Treasury bonds with 10 years maturity were not traded; instead, two alternative solutions have been conducted:
1. The rate of return of the nearest maturity to 10 years bonds has been used,
based on the raw data.
2. The paper calculated a hypothetical rate for the 10 years based on the Yield-to-Maturity formula (Kolb and Rodriguez,1996), which states that:
Figure (3): Egyptian Yield Curves at Selected Time Points (%)
Source: Capital Market Authority and Central Bank of Egypt, Monthly Bulletin, Various Issues.
Egyptian Yield Curve in December 2005
5
6
7
8
9
10
11
12
91 d
ays
T-bi
lls
182
days
T-B
ills
364
days
T-b
ills
2.8
3.7
4.6
4.7
5.8
6.8
8.9
9.9
Egyptian Yield Curve in June 2006
56789
101112
91 D
ays
T-B
ills
182
Day
s T-
Bills
364D
ays
T-B
ills 1.7
1.8
2.3
2.5
3.2
3.6
5.3
6.3
8.4
9.4
Egyptian Yield Curve in May 2007
5
6
7
8
9
10
11
12
91 d
ays
T-bi
lls18
2 da
ys T
-Bills
364
days
T-b
ills 1.3
1.6
2.3
2.7
3.2
3.4
4.4
5.3
5.7
7.0
7.5
17.7
Egyptian Yield Curve in January 2008
5
6
7
8
9
10
11
12
91 d
ays
T-bi
lls18
2 da
ys T
-Bills
364
days
T-b
ills 0.9
1.6
2.3
2.6
2.8
3.1
5.8
6.7
6.8
7.8
7.8
8.0
17.0
- 17 -
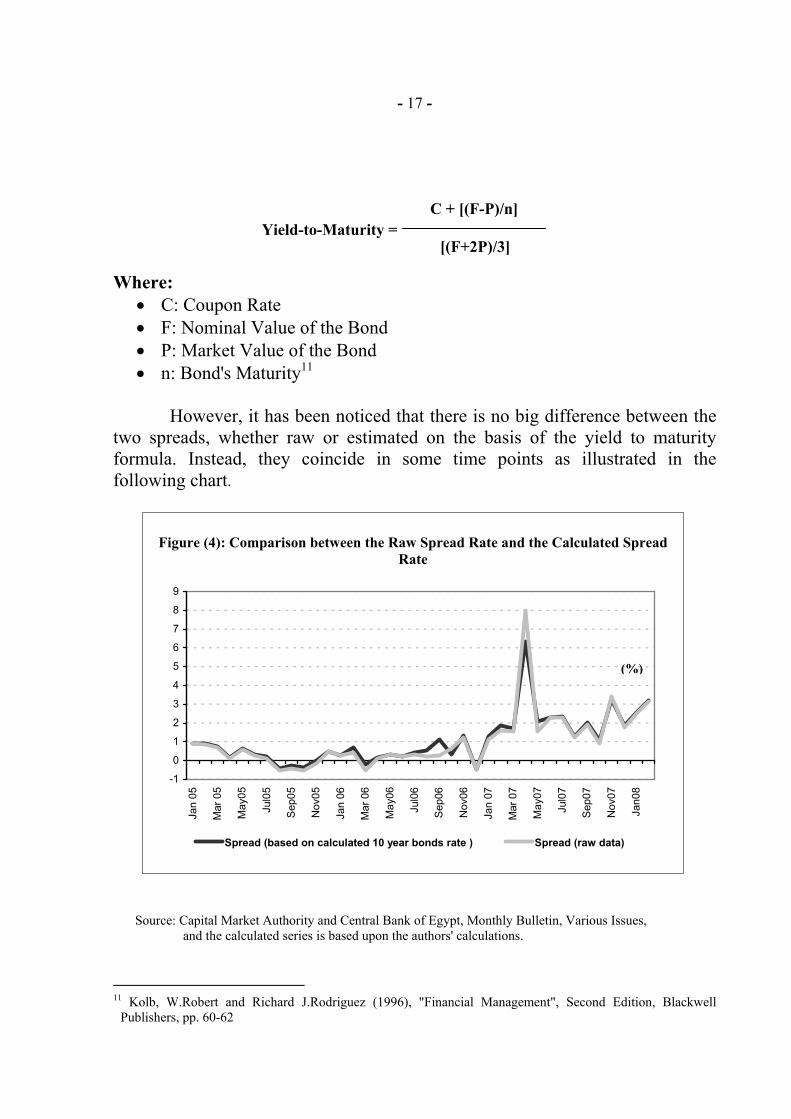
Where: • C: Coupon Rate • F: Nominal Value of the Bond • P: Market Value of the Bond • n: Bond's Maturity11
However, it has been noticed that there is no big difference between the
two spreads, whether raw or estimated on the basis of the yield to maturity formula. Instead, they coincide in some time points as illustrated in the following chart.
Source: Capital Market Authority and Central Bank of Egypt, Monthly Bulletin, Various Issues, and the calculated series is based upon the authors' calculations.
11 Kolb, W.Robert and Richard J.Rodriguez (1996), "Financial Management", Second Edition, Blackwell
Publishers, pp. 60-62
Figure (4): Comparison between the Raw Spread Rate and the Calculated Spread Rate
-1
0
1
2
3
4
5
6
7
8
9
Jan
05
Mar
05
May
05
Jul0
5
Sep
05
Nov
05
Jan
06
Mar
06
May
06
Jul0
6
Sep
06
Nov
06
Jan
07
Mar
07
May
07
Jul0
7
Sep
07
Nov
07
Jan0
8
Spread (based on calculated 10 year bonds rate ) Spread (raw data)
(%)
Yield-to-Maturity = C + [(F-P)/n]
[(F+2P)/3]
- 18 -
2.2 Evolution of the Monetary Policy in Egypt over the Period (2005-2008):
The following part presents a summary on monetary policy implemented during the FY 2004/2005 till the FY 2006/2007.
In FY 2004/2005, the CBE intended to set and implement a formal inflation targeting framework upon the fulfillment of certain prerequisites, in order to anchor the inflation expectations a matter that will enhance the transparency of the monetary policy in Egypt. It planned to steer short term interest rates to meet inflation targets in the transition period. In this context, the CBE has developed a new framework for implementing the monetary policy that relies on the "Overnight Interbank Interest Rate" as being the operational target, which provides the outer bounds of the corridor. The ceiling of this corridor is the overnight rate on lending from the CBE and the floor is the overnight interest rate on deposits at the CBE. This system has been put into action since 5 June 2005, as the Monetary Policy Committee (MPC) determined deposit and lending rates to be 9.5% and 12.5% respectively, in its first meeting.
In FY 2005/2006, the CBE continued on realizing price stability as the overriding objective of its monetary policy. The overnight deposit and lending rates have been reduced a number of times to reach 8% and 10% respectively in June 2006, narrowing the corridor to 2% compared to 3% since these rates have been set for the first time in June 2005. Then in the MPC's meeting, held on 2 November 2006, the overnight deposit and lending rates increased to reach 8.5% and 10.5% respectively. In addition, the CBE continued to absorb the excess liquidity in the banking sector through Open Market Operations (OMO). It began to issue a new instrument namely; Certificates of Deposits (CDs) with maturities extending across one year and the CBE notes of maturities one to two years, the CBE sells these two instruments to banks through outright sales. In FY 2006/2007, the MPC decided to raise the CBE's key policy rates (the overnight deposit and lending rates). This was to curb the inflationary pressures resulted from the accelerated economic growth and more importantly, to firmly face the second round effects of the supply shocks stemming from the avian flu crisis and oil subsidy cuts.
According to CBE's annual report of 2006/2007, the monetary policy transmission mechanism showed an improvement as the interest rates on clients' deposits and loans became more responsive to changes in the CBE's overnight interest rates. The interest rates on three-month deposits reached about 6.6% by the end of July 2006, and 6.8% in October 2006; then ranging from 6.7% to 6.8% from November 2006 till June 2007. Meanwhile, interest rates on loans of one year and less were relatively less flexible12. 12 Central Bank of Egypt, "Annual Report", Various Issues.
- 19 -
As noticed, it appears that the short-term interest rates have used to move
close to the key rates of the monetary policy (i.e. overnight deposit rate). In addition the CBE's overnight deposit rate and short term deposit rate in banks which have been econometrically examined to guarantee that they are co-integrated using the "Johansen Co-integration Test". This test has been employed over the time period December 2001 till February 2008, to reflect the relationship between the monetary policy instrument (overnight interbank interest rate) and the short term 3-months deposit rate in banks. Moreover, the test covered a longer time period to overcome the limited dataset that the study has relied upon due to institutional considerations. The test's statistics: max Eigen-value and the trace statistics have indicated one co-integrating equation at both 5% and 1% levels [Refer to table (A)]. This result is likely to reflect the presence of a long-run equilibrium relationship between the two interest rates, i.e. they can replace each other, reflecting the existence of the transmission mechanism.
The implemented monetary policy over the study period that ranges from
January 2005 to February 2008 was characterized by facing the second round of the supply shocks that Egypt's economy has faced. That's why the monetary policy appears to have a negligible reaction to the macroeconomic deviations, and consequently less predictive ability for Egypt's yield curve.

- 20 -
Table (A): Johansen Co-integration Test
Sample(adjusted): 2002:02 2008:02 Included observations: 73 after adjusting endpoints Trend assumption: Linear deterministic trend Series: Overnight Rate, 3-months Deposit Rate Lags interval (in first differences): 1 to 1 Unrestricted Co-integration Rank Test Hypothesized Critical Value No. of CE(s) Eigen-value Trace Statistic 5 Percent 1 Percent None ** 0.296 28.448 15.410 20.040 At most 1 0.038 2.797 3.760 6.650 *(**) denotes rejection of the hypothesis at the 5%(1%) level Trace test indicates 1 co-integrating equation(s) at both 5% and 1% levels Hypothesized Critical Value No. of CE(s) Eigen-value Trace Statistic 5 Percent 1 Percent None ** 0.296 25.651 14.070 18.630 At most 1 0.038 2.797 3.760 6.650 *(**) denotes rejection of the hypothesis at the 5%(1%) level Max-Eigen-value test indicates 1 co-integrating equation(s) at both 5% and 1% levels
Note: Lag interval has been determined according to the Schwartz criterion.
- 21 -
Section Three
Egypt's Yield Curve and the Macro-economy For the purpose of testing empirically whether Egypt's yield curve is a
monetary policy indicator, in addition to having a predictive power or not regarding the inflation expectation based on the information embedded in the yield curve (the level and slope), two approaches have been employed:
i. First, regressing the monthly inflation rate (annualized) on the yield
curve information (lagged) to determine the time horizon at which the yield curve has a relevant predictive power based on the approach carried out by Kozicki (1997), the European Central Bank (2006) following Stock and Watson (2003) and others; who use the h-step ahead forecasting regression which uses the kth lag of the slope of the yield curve.
ii. Second, employing Unrestricted Vector Auto-Regression (VAR)
models and Impulse Response Functions to characterize the dynamism and the direction of interactions between the macroeconomic factors (inflation rate and the stance of monetary policy) and the yield curve factors (level and slope) simulating the popular concept of the latent factor model of Nelson and Siegel (1987).
3.1 Testing Egypt's Yield Curve's Predictive Power:
Testing the predictive power of the yield curve in expecting both the real
activity and inflation is not a recent issue. However, a group of developed countries and recently the emerging economies have employed statistical and econometrical approaches to meet this regard13.
The main concern of this paper is to examine how far the yield curve is able
to clearly reflect the inflation expectations relying on the information embedded in the yield curve.
The approach simply utilizes the most popular financial market variable:
the "Yield Spread" between yields on long-term and short-term government instruments, representing the shape of the yield curve at the same time14.
13 Mehl, Arnaud (November 2006), "The Yield Curve as a predictor and Emerging Economies", The European Central Bank, Working Paper Series, Number 691, Frankfurt, Germany. 14 Kozicki, Sharon (1997), "Predicting Real Growth and Inflation with the Yield Spread", Economic Review,
Fourth Quarter, Federal Reserve Bank of Kansas City.
- 22 -
The paper uses monthly data for both the Treasury Bill Rate and the
Treasury Bonds Rate traded in the secondary market based on the Yield-To-Maturity (YTM) rate, where the time series ranges from January 2005 till February 2008. The paper uses a short time series on the backdrop of the following:
• To employ this approach, the paper sticks to those securities which are
traded in the secondary market to make sure that the rate of return reflects the bonds market mechanism and free interest rates.
• Moreover, Law No. 480 and Law No.723 issued in the year 2002 by the Ministry of Finance, which organizes the Primary Dealers trading in the bonds secondary market, were only activated in November 200415.
For the aforementioned reasons, the obtained results are to be considered with caution. The implemented methodology incorporates both the yield curve level and slope as being both potential sources for information about future economic conditions. Several hypotheses argue that the information in the yield curve is forward-looking and therefore should have predictive power, among these arguments are the following:
• The yield spread reflects the stance of the monetary policy. • The yield spread reflects the direction of future inflation changes.
The level of the yield curve as measured by its short end might help expect
inflation, because short term interest rate may provide information on the stance of the monetary policy as they move closely to the monetary policy instrument. Moreover, fluctuations in the yield curve may either reflect shifts in policy or shifts in the risk premium. That's why there is an argument that the yield curve level can provide a better measure of the stance of monetary policy than the one offered by the yield spread16.
This section of the study examines whether Egypt's yield curve helps reflect
inflation expectations. The Ordinary Least Squares (OLS) method is employed, whereas the inflation rate is treated as the endogenous variable, which is a function of the spread lagged, a proxy for real Treasury Bill Rate17 (lagged) the interaction between the lagged spread with the real bill rate, and 15 Ministry of Finance (MOF): www.mof.org.eg 16 Ibid, Sharon Kozicki, 1997. 17 Real rate is calculated as the difference between the nominal bill rate (3-month maturity) at time (t) and the
annualized inflation rate at time (t).
- 23 -
the inflation rate (lagged). [Refer to Tables (1-4) in the appendix]. Worth noting, the paper controls for the heteroskedasticity and autocorrelation (HAC) by applying Newey-West Correction following Stock and Watson (2003).
The implemented approach utilizes the h-step ahead forecasting regression which uses the kth lag of the slope of the yield curve carried out by Kozicki (1997), the European Central Bank (2006) following Stock and Watson (2003).
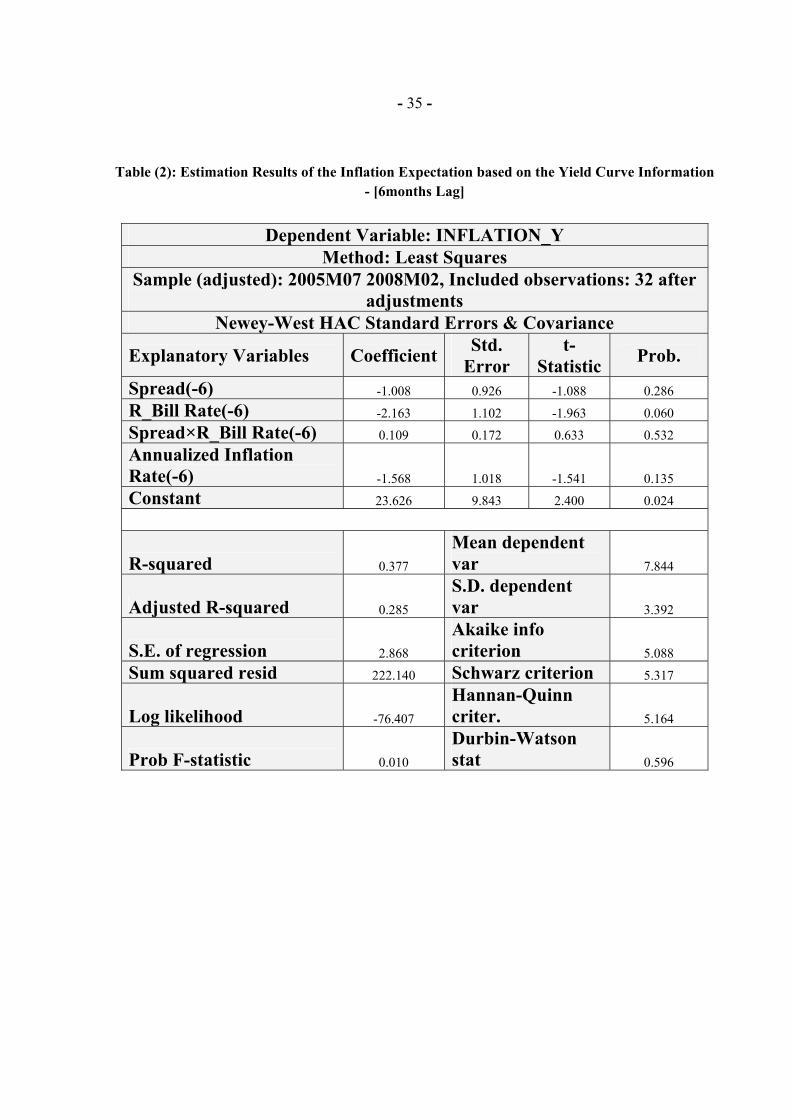
Evidence suggests that the Treasury Bill Rate embedded in Egypt's yield
curve proves to have a predictive power, or more precisely, it is a good indicator of the monetary policy stance over the 6, 9 and 12 prediction horizons that have been examined, since estimated results indicate significant estimates and the signs are correct and coinciding with both the economic and the financial theories. It has got a negative sign with the expected inflation; implying that if it increases at any horizon, the inflation is expected to decline significantly.
On the contrary, the slope factor of the yield curve is unable to reflect the
inflation expectations over the tested horizons, since its estimated coefficients appear to be insignificant, in all regressions, except in the 9 lag regression. If things are going on the right track, the slope should have a positive sign, implying that if it increases over a past period of time, this will be a signal of market players' anticipation of an upcoming inflation, which will induce the monetary authority to have some protective actions.
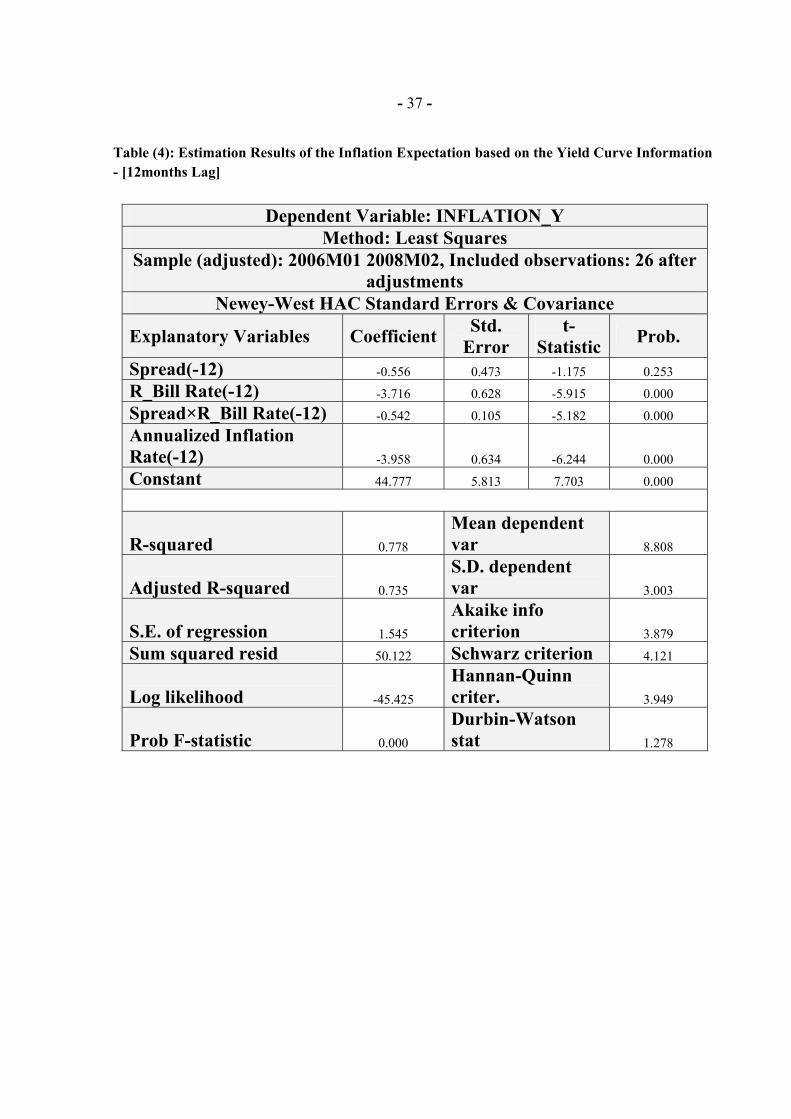
Regarding the interaction term between the spread and the Treasury bill
rate that reflects the indirect prediction of these two components of the yield curve. It appears to be significant only in the 12 lag regression; it reflects the indirect prediction only for the T-bill rate as the spread used to be insignificant in all regressions except for the 9 lag regression. Worth noting, in the latter regression, although the spread shows some significance, the interaction term reflects no effect.
The above mentioned results do conform to the theory because it has been
argued that the short end of the yield curve will reflect the stance of the implemented monetary policy, while the slope of the yield curve predictive power in inflation expectations has registered weak evidence unless long term horizons are considered starting from 2 to 3 years.
- 24 -
Unfortunately, our sample is so limited, so our structural analysis was restricted to 1 year prediction horizon only. However, the rest of the analysis will deal with the dynamic interaction between the yield curve factors and the macro-economic indicators in a nonstructural framework to get a clue about the ability of the yield curve expectations at longer horizons. 3.2 Testing the Dynamic Interaction between Egypt's Yield Curve and the Macro-economy:
Theoretically, the framework to analyze the dynamic interaction is far from
being a settled issue. On one hand, there is no consensus on the way to estimate the term structure of the interest rates. On the other hand, the incorporated macroeconomic variables create fundamental differences in the conclusions obtained from empirical analysis.
One approach is to provide a structural representation of macro-economy,
usually by means of a small (linear) model or consistently modeling long run expectations about future inflation as what we have carried out in the previous section. The other possibility is to use a non-structural representation of the macro-economy, considering observed macro variables or latent macro factors (level, curvature and the slope of the yield curve)18.
The paper examines the dynamics of the yield curve factors (level and
slope) along with the macro-indicators (stance of the monetary policy and inflation rate) via the impulse response functions as recommended by a group of studies19.
We consider two groups of impulse response in order to get a clue about
the direction of the dynamic interactions between the macro-economy and the yield curve in Egypt; those are:
1. Macro response to yield curve shocks. 2. Yield curve responses to macro shocks.
18 Morales, Marco (March 2007), "The Yield Curve and Macroeconomic Factors in the Chilean Economy", Center of Economics and Finance, Diego Portales University, Chile. 19 We estimate the VAR model incorporating the inflation rate, deposit rate, real t-bill rate and the spread in the
level form in spite of being I(1) according to Augmented Dickey Fuller results. This approach simulates many studies that concentrated on the dynamic interaction between the yield curve and the macro-economy which employ the VAR analysis with level non-stationary variables, due to the fact that there is a trade-off between the statistical efficiency and the potential loss of information that takes place when economic time series are differenced.
- 25 -
An unrestricted VAR model has been employed to trace these dynamics
[Refer to the appendix Table (5) for lag specification criteria], the model has specified a lag interval (1 1) based on the information criterion provided by Schwarz (SIC), Final Prediction Error (FPE) and Hannan-Quinn (HQ) criteria. The Generalized impulse-response functions for unrestricted VAR were carried out to avoid the ordering problem: changing the order produces different impulse response functions for each variable as proposed by Pesaran and Shin (1998).
3.2.1 Macro Responses to Yield Curve Shocks:
Generally speaking, the monetary policy instrument represented in the 3-
months deposit rate, registers very negligible responses in terms of magnitude to shocks either from the yield curve factors (level and slope) or from the inflation rate as illustrated in Table (8). It reacts positively and insignificantly to inflation shocks over a period that ranges from the upcoming 1 to 10 months, with peak effect in the fifth month. i.e. the monetary policy reaction function is less sensitive to the YC shocks. This evidence might not be in favor of the Central Bank of Egypt's reaction function, implying that the latter lacks the link between the anticipations of bond market players and the implemented monetary policy.
For the inflation rate responses, the paper easily observes that both
Treasury Bill Rate (level of YC) and the spread (slope of YC) shocks have a far lasting effect on inflation rate, since inflation responses extend over the upcoming 10 months. In addition, for the spread shock, the reaction pattern reversed to be positive starting from the fourteenth months to reach its peak after approximately 2 years and half of the shock. [See Impulse-Response Estimates Figure (6) in the appendix]
Meanwhile the inflation rate responds negatively to the deposit rate shocks,
the reason for that stems from the following: For the deposit rate, when the Central Bank of Egypt (CBE) decides to increase the short run rates, the inflation will respond directly to this action and the inflation decline accelerates to reach its trough in the eighth month, it continues until its effect disappears completely within 2 years and half.
3.2.2 Yield Curve Responses to Macro Shocks:
Now consider the response of the yield curve factors to the macro variables
shocks. While the slope factor shows minor reactions to the inflation and the deposit rate, the level factor reacts directly to these shocks.

- 26 -
Regarding the Treasury bill reaction to the monetary policy instrument, one
should expect one of two alternative effects: either a large degree of credibility and transparency in the central bank to suppress inflation and likely lower the level factor, or a tightening monetary policy reflecting the anxiety of the central bank authority which will increase inflation expectations and consequently increase the level factor of the yield curve20.
Evidently, in the sample, the second effect has dominated and the real
Treasury bill rate didn't react to the inflation hikes directly. However, it affects inflation through its positive and significant reaction to the deposit rate shocks to reflect the stance of the monetary policy as illustrated in the estimated results of both the transition equation and the impulse-response function [Refer to the appendix], that can be attributed to the following:
• First, a surprising tightening policy will indicate that the central bank is
worried about overheating and inflationary pressures in the economy that boost future inflation expectations and induced the investors to demand higher rate of return on short run securities.
• Second, as a matter of fact, 3-month deposit is considered a strong rival
(perfect substitute) for short run securities. That's why any increase in the deposit rate would encourage the investors to shift from the Treasury securities -supported by the high degree of liquidity- to the bank deposits to enjoy the additional return.
20 Diebold, X. Fancis, Glenn D. Rudebusch and S. Boragan Aruoba (October 2003), "The Macro-economy and
the Yield Curve: A Nonstructural Analysis", Federal Reserve Bank of San Francisco.
- 27 -
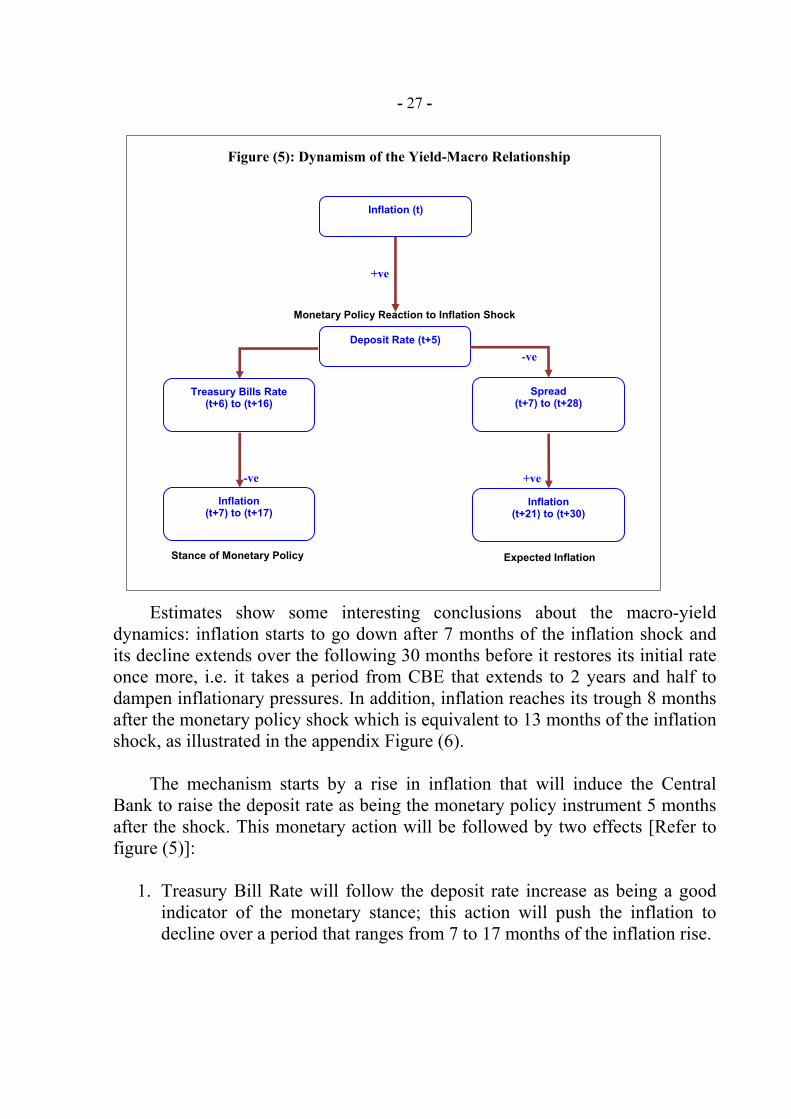
Estimates show some interesting conclusions about the macro-yield
dynamics: inflation starts to go down after 7 months of the inflation shock and its decline extends over the following 30 months before it restores its initial rate once more, i.e. it takes a period from CBE that extends to 2 years and half to dampen inflationary pressures. In addition, inflation reaches its trough 8 months after the monetary policy shock which is equivalent to 13 months of the inflation shock, as illustrated in the appendix Figure (6).
The mechanism starts by a rise in inflation that will induce the Central
Bank to raise the deposit rate as being the monetary policy instrument 5 months after the shock. This monetary action will be followed by two effects [Refer to figure (5)]:
1. Treasury Bill Rate will follow the deposit rate increase as being a good
indicator of the monetary stance; this action will push the inflation to decline over a period that ranges from 7 to 17 months of the inflation rise.
-ve
Stance of Monetary Policy
+ve -ve
+ve
Monetary Policy Reaction to Inflation Shock
Inflation (t)
Deposit Rate (t+5)
Treasury Bills Rate (t+6) to (t+16)
Inflation (t+7) to (t+17)
Spread (t+7) to (t+28)
Inflation (t+21) to (t+30)
Expected Inflation
Figure (5): Dynamism of the Yield-Macro Relationship
- 28 -
2. Spread will react negatively to the T-bill rate increase, cause the yield
curve to flatten, implying the market anticipations of a future decline in the inflation rate; these expectations will cause an inflation decline over a period ranging from 21 to 30 months of the inflation shock.
It is obvious that the strength of the dynamic relationship between the yield curve and macro-economy intensively relies upon the magnitude of the monetary policy reaction to macro-economic deviations from targets, since macro-economic factors (e.g. inflation rate) are affected by the yield curve factors only through monetary policy tools.
The slope of the yield curve has got a predictive power over long term
horizons as shown in the VAR analysis. However, it proves to have weak evidence at shorter horizons as illustrated by the structural model of the inflation expectation. On the contrary, the short end of the yield curve represented in the Treasury bill rate, has proved to be a good indicator of the monetary policy stance; as it moves very closely to the monetary policy tool in short or long predictive horizons.
Moreover, to cross check the robustness of the previously estimated results,
the paper introduced the Pair-wise Granger Causality test and the Variance Decomposition estimates for both the spread and the inflation rate [Refer to tables (6) and (7) in the appendix]. The former shows almost the same conclusions that have been early mentioned. In the framework of this approach, the inflation appears to granger cause the spread but the reverse doesn't apply. In addition, the Treasury bill rate granger causes the spread, however, the spread doesn't granger cause the Treasury bill. This test also suggests that there is no granger causality relationship between the Treasury bill and the inflation rate.
Regarding the variance decomposition analysis, it has been conducted
twice: once for the spread and the other for the inflation rate. For the spread, the Treasury bill rate appears to have the major and an everlasting effect on the spread; this can be explained from the fact that T-bill rate is a good indicator for the monetary stance, so if it experiences any change, this will affect the spread, i.e. the shape of the yield curve. Meanwhile, both the inflation rate and the deposit rate have a peak effect in the 9th and the 23rd month respectively, on the spread. On the other hand, the spread and the Treasury bill appear to have a very minor effect on the inflation rate variation. At the meantime, both the inflation and the deposit rate are responsible for about 90% of the variation experienced by the inflation rate over the upcoming two years. These conclusions suggest that the yield-macro bi-directional dynamic relationship moves from the macro-economy to the yield curve.
- 29 -
Conclusion
The incorporated time series were in level form because differenced time
series in VARs will really generate efficient estimates but it will ignore potential long-run relationships that are of great importance21. Moreover, estimation results based on our sample that ranges from January 2005 till February 2008 support the dynamic interaction between yield curve factors (level and slope) and macroeconomic variables (inflation and the stance of monetary policy). The evidence suggests the following conclusions:
• Despite that the yield curve represented in both its level and slope is able
to expect the upcoming inflation at higher prediction horizons as shown in the transition unrestricted VAR equation and the impulse-response functions, the results are not so robust and should be taken with great caution due to data limitations.
• Moreover, the estimated results indicate that the magnitude of the YC slope's effect on the deposit rate is lesser than its effect on the inflation rate, i.e. the monetary policy reaction function is less sensitive to the YC shocks; apparently, this evidence might not be in favor of the Central Bank of Egypt's reaction function, implying that the latter lacks the link between the bond market players anticipations and the implemented monetary policy. However, this situation resulted from the inactive bonds market where 89%, 75.5% and 64% of the listed bonds are held by the banking sector in 2005, 2006 and 2007 respectively.
• Evidence has proved that Egypt's monetary policy has a negligible
magnitude concerning its reaction to macroeconomic deviations where the CBE doesn't react to inflation rises immediately; the reason for that stems from the fact that the implemented monetary policy over the study period was characterized by facing the second round of the supply shocks. That's why the monetary policy appears to have a negligible reaction to the macroeconomic deviations, and consequently less predictive ability for Egypt's yield curve.
21 Ramaswamy, Ramana and Torsten Sloek (December 1997), "The Real Effects of Monetary Policy in the Euro Area: What are the Differences?", International Monetary Fund, Research Department, IMF Working Papers Number 97/160.
- 30 -
• Macro variables have strong effect on the level factor of the yield curve but not on its future movements (i.e. term-structure or spread). However, much weaker evidence upon the reverse influence of the YC factors on the macro variables exist, unless higher lag lengths are considered. This indicates that the monetary policy reaction function does not take into account the bonds market expectations about the macro-economy in the near prediction horizons. This result is consistent with most empirical results in both developed and emerging economies.
• The incidence of a structural positive relationship between the monetary policy and the level factor of the yield curve implies that the short end of the yield curve is determined by and follows the monetary policy ،which assures the argument that the YC level can reflect the stance of the monetary policy than the YC slope does. This can be easily observed from the positive and significant reaction of the real Treasury Bill Rate to the deposit rate shock.
- 31 -
Policy Recommendations
To increase the predictive power of Egypt's yield curve, the paper
recommends that there should be an economy-wide consensus, integrated, complementary fiscal and monetary frameworks. In this context, there are some prerequisites that are recommended to be fulfilled to enhance the yield curve predictive ability, in order to be used as a fiscal and monetary indicator to realize macro-economic stability in Egypt.
First, for the fiscal policy and the debt management strategy, three aspects
should prevail: • Working on the minimization of the fiscal deficit as one of the major
prerequisites of adopting the formal inflation targeting framework. • Having an active Treasury bonds market that relies on the market
mechanism through diversifying debt securities in terms of maturities. • Increasing the holding base of T-bonds to eliminate risk stems from the
concentration of government debt with certain entities.
Second, for the monetary policy, the central bank should implement two types of responses:
• Responsive Monetary Policy: The CBE should instantly and firmly
respond to macro-economic deviations from targets through a formal inflation targeting framework.
• Protective Monetary Policy: The CBE should increase its reaction
magnitude to yield curve shocks; to construct a direct link between the bonds market players’ anticipation about the future inflation and real activity and the implemented monetary policy to increase its transparency and credibility in the future.
- 32 -
References
• Capital Market Authority, "Monthly Report", Various Issues. • Central Bank of Egypt, "Annual Report", Various Issues for Fiscal Years 2004/2005,
2005/2006, and 2006/2007, Cairo, Egypt. • Cwik, Paul (May 2004), “An Investigation of Inverted Yield Curves and Economic
Downturns”, Doctor of Philosophy, the Graduate Faculty of Auburn University, Auburn, Alabama.
• Diebold, X. Fancis, Glenn D. Rudebusch and S. Boragan Aruoba (October 2003), "The Macro-economy and the Yield Curve: A Nonstructural Analysis", Federal Reserve Bank of San Francisco, San Francisco, U.S.A.
• Estrella, Arturo and Frederic S. Mishkin (June 1996), “The Yield Curve as a Predictor of U.S. Recessions”, Federal Reserve Bank of New York, Current Issues in Economics and Finance,Volume.2, Number 7, New York, U.S.A.
• Estrella, Arturo (February 2005), "Why Does the Yield Curve Predict Output and Inflation?", Federal Reserve Bank of New York, New York, U.S.A.
• Estrella, Arturo and Mary R. Trubin (2006), " The Yield Curve as a Leading Indicator: Some Practical Issues", Federal Reserve Bank of New York, Current Issues in Economics and Finance, Volume 12, Number 5, New York, U.S.A.
• International Monetary Fund, "International Financial Statistics", CD-ROM, April 2008.
• Kolb, W.Robert and Richard J.Rodriguez (1996), "Financial Management", Second Edition, Blackwell Publishers, pp. 60-62.
• Kozicki, Sharon (1997), "Predicting Real Growth and Inflation with the Yield Spread", Economic Review, Fourth Quarter, Federal Reserve Bank of Kansas City, Kansas City, U.S.A.
• Kozicki, Sharon and Gordon Sellon (2005), "Longer-Term Perspectives on the Yield Curve and Monetary Policy", Economic Review, Fourth Quarter 2005, Federal Reserve Bank of Kansas City, Kansas City, U.S.A.
• Mehl, Arnaud (November 2006), "The Yield Curve as a predictor and Emerging Economies", The European Central Bank, Working Paper Series, Number 691, Frankfurt, Germany.
• Ministry of Finance (MOF), Decree Number 480 for the year 2002, “Establishing the Primary Dealers System”, Cairo, Egypt.
• Ministry of Finance (MOF), Decree Number 723 for the year 2002, (Executive Regulations for Decree Number 480 for 2002), “Primary Dealers System”, Cairo, Egypt.
• Morales, Marco (March 2007), "The Yield Curve and Macroeconomic Factors in the Chilean Economy", Center of Economics and Finance, Diego Portales University, Chile.
• Nelson, R. Charles & Siegel, Andrew F (October 1987), "Parsimonious Modeling of Yield Curves" Journal of Business, University of Chicago Press, vol. 60(4), pages 473-89.
- 33 -
• Ramaswamy, Ramana and Torsten Sloek (December 1997), "The Real Effects of
Monetary Policy in the Euro Area: What are the Differences?", International Monetary Fund, Research Department, IMF Working Papers Number 97/160.
• Shelile, Teboho (December 2006), "The Term Structure of Interest Rates and Economic Activity in South Africa", Thesis to obtain the Master Degree in Commerce and Financial Markets, Department of Economics and Economic History, Rhodes University, Grahamstown, South Africa.
• Stock, H. James & Mark W. Watson (September 2003), "Forecasting Output and Inflation: the Role of Asset Prices" Journal of Economic Literature, American Economic Association, vol. 41(3), pages 788-829.
• Wright, H. Jonathan (2006-07), "Yield Curve and Predicting Recessions", Finance and Economics Discussion Series, Divisions of Research & Statistics and Monetary Affairs, Federal Reserve Board, Washington, D.C.
Websites:
• Answers Encyclopedia: www.answers.com/yield+curve?nr=1&lsc=true&cat=biz-fin
• Central Bank of Egypt (CBE): www.cbe.org.eg
• Ministry of Finance (MOF): www.mof.org.eg
• Wikipedia Encyclopedia: www.wikipedia.com
- 34 -
Appendix
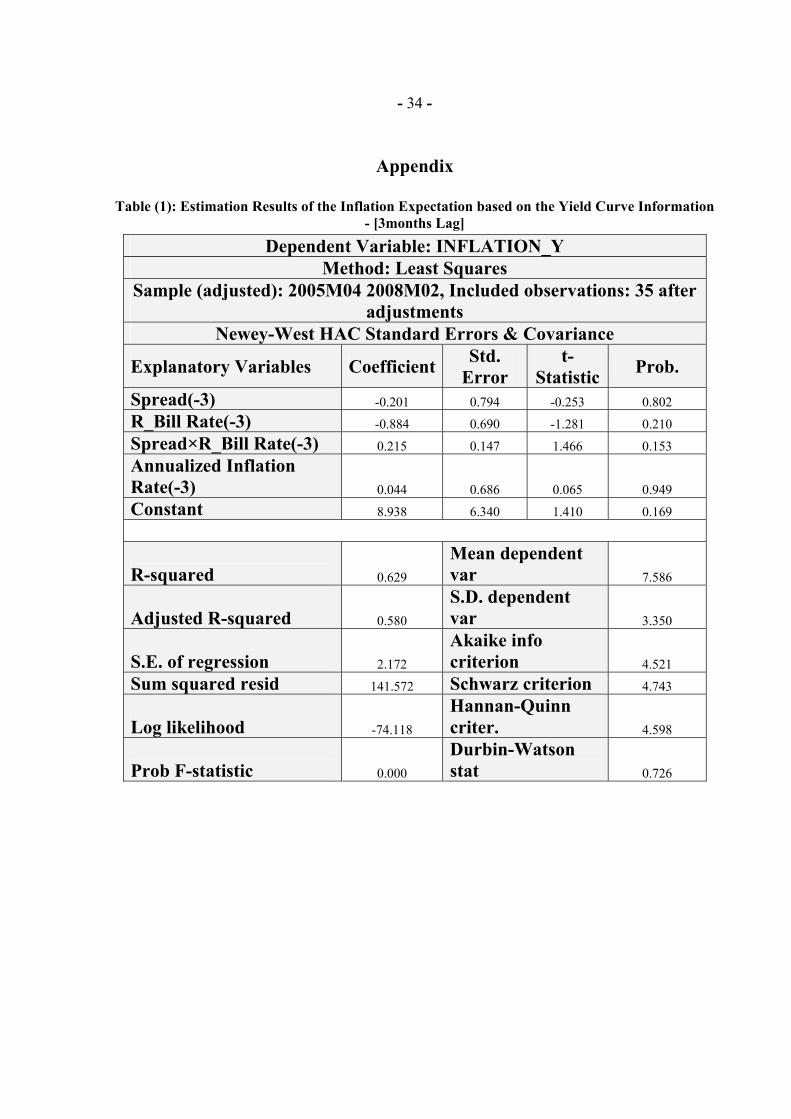
Table (1): Estimation Results of the Inflation Expectation based on the Yield Curve Information
- [3months Lag]
Dependent Variable: INFLATION_Y Method: Least Squares
Sample (adjusted): 2005M04 2008M02, Included observations: 35 after adjustments
Newey-West HAC Standard Errors & Covariance
Explanatory Variables Coefficient Std. Error
t-Statistic Prob.
Spread(-3) -0.201 0.794 -0.253 0.802 R_Bill Rate(-3) -0.884 0.690 -1.281 0.210 Spread×R_Bill Rate(-3) 0.215 0.147 1.466 0.153 Annualized Inflation Rate(-3) 0.044 0.686 0.065 0.949 Constant 8.938 6.340 1.410 0.169
R-squared 0.629
Mean dependent var 7.586
Adjusted R-squared 0.580
S.D. dependent var 3.350
S.E. of regression 2.172
Akaike info criterion 4.521
Sum squared resid 141.572 Schwarz criterion 4.743
Log likelihood -74.118
Hannan-Quinn criter. 4.598
Prob F-statistic 0.000
Durbin-Watson stat 0.726
- 35 -
Table (2): Estimation Results of the Inflation Expectation based on the Yield Curve Information - [6months Lag]
Dependent Variable: INFLATION_Y
Method: Least Squares Sample (adjusted): 2005M07 2008M02, Included observations: 32 after
adjustments Newey-West HAC Standard Errors & Covariance
Explanatory Variables Coefficient Std. Error
t-Statistic Prob.
Spread(-6) -1.008 0.926 -1.088 0.286 R_Bill Rate(-6) -2.163 1.102 -1.963 0.060 Spread×R_Bill Rate(-6) 0.109 0.172 0.633 0.532 Annualized Inflation Rate(-6) -1.568 1.018 -1.541 0.135 Constant 23.626 9.843 2.400 0.024
R-squared 0.377
Mean dependent var 7.844
Adjusted R-squared 0.285
S.D. dependent var 3.392
S.E. of regression 2.868
Akaike info criterion 5.088
Sum squared resid 222.140 Schwarz criterion 5.317
Log likelihood -76.407
Hannan-Quinn criter. 5.164
Prob F-statistic 0.010
Durbin-Watson stat 0.596

- 36 -
Table (3): Estimation Results of the Inflation Expectation based on the Yield Curve Information - [9months Lag]
Dependent Variable: INFLATION_Y
Method: Least Squares Sample (adjusted): 2005M10 2008M02, Included observations: 29 after
adjustments Newey-West HAC Standard Errors & Covariance
Explanatory Variables Coefficient Std. Error
t-Statistic Prob.
Spread(-9) -1.297 0.652 -1.990 0.058 R_Bill Rate(-9) -4.054 1.017 -3.988 0.001 Spread×R_Bill Rate(-9) -0.037 0.115 -0.318 0.753 Annualized Inflation Rate(-9) -3.925 0.917 -4.280 0.000 Constant 44.737 9.041 4.948 0.000
R-squared 0.573
Mean dependent var 8.217
Adjusted R-squared 0.502
S.D. dependent var 3.344
S.E. of regression 2.359
Akaike info criterion 4.710
Sum squared resid 133.582 Schwarz criterion 4.946
Log likelihood -63.297
Hannan-Quinn criter. 4.784
Prob F-statistic 0.000
Durbin-Watson stat 0.936
- 37 -
Table (4): Estimation Results of the Inflation Expectation based on the Yield Curve Information - [12months Lag]
Dependent Variable: INFLATION_Y
Method: Least Squares Sample (adjusted): 2006M01 2008M02, Included observations: 26 after
adjustments Newey-West HAC Standard Errors & Covariance
Explanatory Variables Coefficient Std. Error
t-Statistic Prob.
Spread(-12) -0.556 0.473 -1.175 0.253 R_Bill Rate(-12) -3.716 0.628 -5.915 0.000 Spread×R_Bill Rate(-12) -0.542 0.105 -5.182 0.000 Annualized Inflation Rate(-12) -3.958 0.634 -6.244 0.000 Constant 44.777 5.813 7.703 0.000
R-squared 0.778
Mean dependent var 8.808
Adjusted R-squared 0.735
S.D. dependent var 3.003
S.E. of regression 1.545
Akaike info criterion 3.879
Sum squared resid 50.122 Schwarz criterion 4.121
Log likelihood -45.425
Hannan-Quinn criter. 3.949
Prob F-statistic 0.000
Durbin-Watson stat 1.278
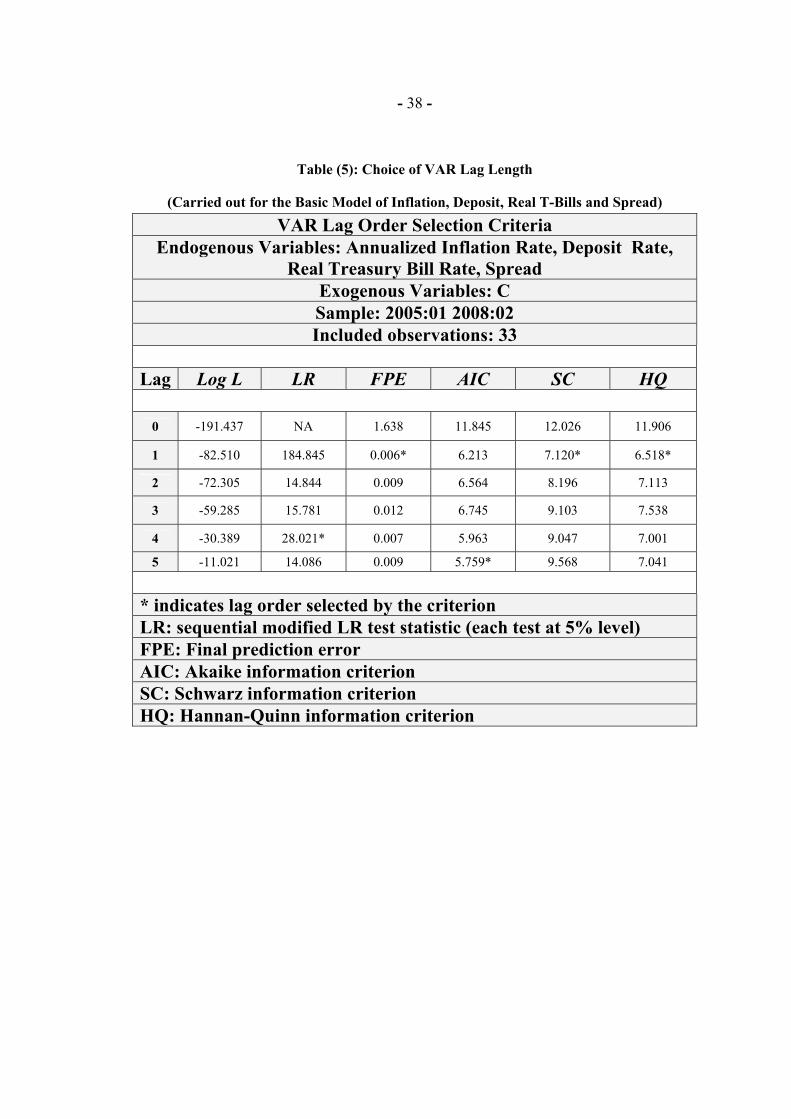
- 38 -
Table (5): Choice of VAR Lag Length
(Carried out for the Basic Model of Inflation, Deposit, Real T-Bills and Spread)
VAR Lag Order Selection Criteria Endogenous Variables: Annualized Inflation Rate, Deposit Rate,
Real Treasury Bill Rate, Spread Exogenous Variables: C Sample: 2005:01 2008:02 Included observations: 33
Lag Log L LR FPE AIC SC HQ
0 -191.437 NA 1.638 11.845 12.026 11.906
1 -82.510 184.845 0.006* 6.213 7.120* 6.518*
2 -72.305 14.844 0.009 6.564 8.196 7.113
3 -59.285 15.781 0.012 6.745 9.103 7.538
4 -30.389 28.021* 0.007 5.963 9.047 7.001
5 -11.021 14.086 0.009 5.759* 9.568 7.041
* indicates lag order selected by the criterion LR: sequential modified LR test statistic (each test at 5% level) FPE: Final prediction error AIC: Akaike information criterion SC: Schwarz information criterion HQ: Hannan-Quinn information criterion
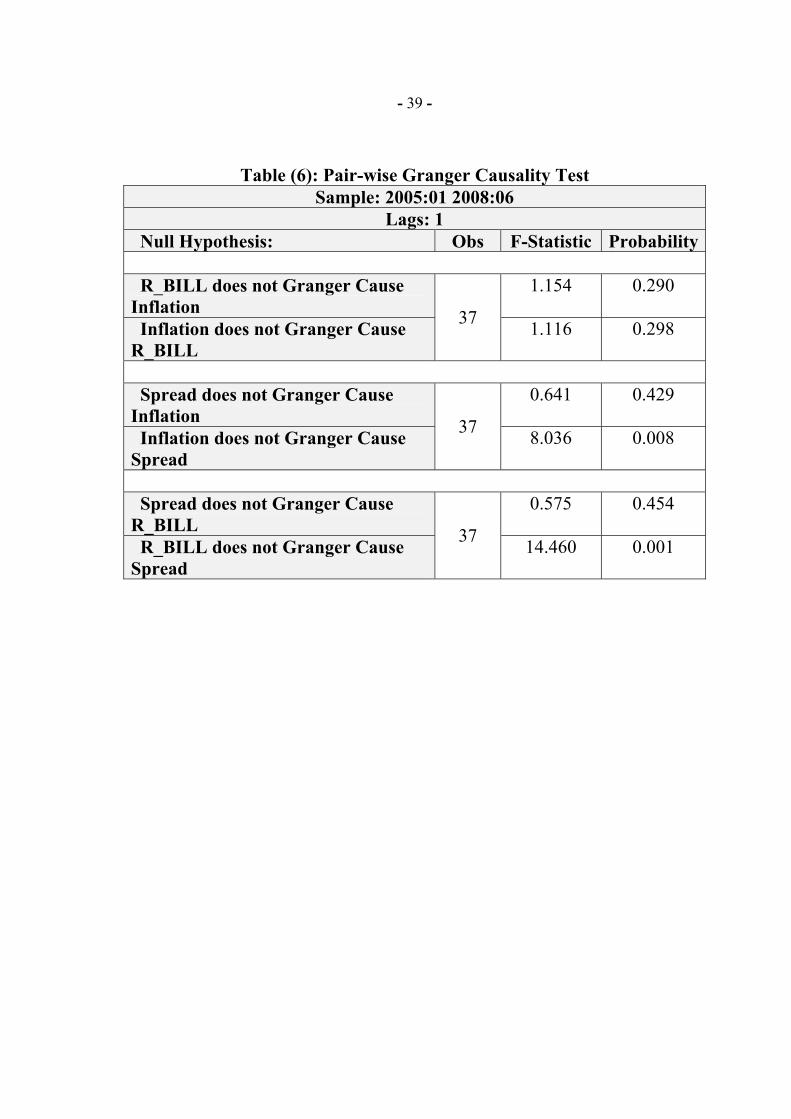
- 39 -
Table (6): Pair-wise Granger Causality Test Sample: 2005:01 2008:06
Lags: 1 Null Hypothesis: Obs F-Statistic Probability R_BILL does not Granger Cause Inflation
1.154 0.290
Inflation does not Granger Cause R_BILL
37 1.116 0.298
Spread does not Granger Cause Inflation
0.641 0.429
Inflation does not Granger Cause Spread
37 8.036 0.008
Spread does not Granger Cause R_BILL
0.575 0.454
R_BILL does not Granger Cause Spread
37 14.460 0.001

- 40 -
Table (7): The Variance Decomposition of the Spread and the Inflation Rate
Variance Decomposition of the Spread Variance Decomposition of the Inflation Rate Period S.E.
Inflation Deposit R_Bill Spread Inflation Deposit R_Bill Spread 1 1.058 0.319 1.302 33.947 64.431 100.000 0.000 0.000 0.000
2 1.453 12.587 1.061 33.743 52.608 96.671 1.720 0.477 1.133
3 1.691 17.513 0.924 36.268 45.295 92.450 5.180 0.930 1.440
4 1.866 21.354 0.962 37.771 39.913 86.958 9.970 1.390 1.682
5 2.004 23.964 1.222 39.001 35.814 80.873 15.521 1.768 1.838
6 2.120 25.726 1.700 40.029 32.545 74.785 21.269 2.019 1.928
7 2.220 26.834 2.364 40.951 29.850 69.151 26.753 2.133 1.963
8 2.307 27.445 3.167 41.820 27.567 64.248 31.662 2.131 1.959
9 2.384 27.679 4.058 42.673 25.590 60.187 35.833 2.053 1.927
10 2.451 27.632 4.985 43.536 23.847 56.956 39.217 1.949 1.879
11 2.509 27.381 5.906 44.423 22.290 54.462 41.846 1.867 1.824
12 2.558 26.985 6.784 45.347 20.884 52.577 43.798 1.856 1.770
13 2.600 26.494 7.593 46.310 19.602 51.162 45.166 1.953 1.719
14 2.635 25.945 8.316 47.314 18.426 50.083 46.052 2.191 1.675
15 2.664 25.364 8.942 48.353 17.340 49.225 46.548 2.589 1.638
16 2.690 24.775 9.470 49.422 16.333 48.497 46.735 3.160 1.608
17 2.713 24.194 9.902 50.510 15.395 47.831 46.681 3.904 1.584
18 2.734 23.632 10.242 51.607 14.519 47.179 46.443 4.813 1.565
19 2.754 23.098 10.500 52.703 13.699 46.519 46.062 5.869 1.550
20 2.775 22.599 10.684 53.787 12.930 45.840 45.571 7.052 1.536
21 2.796 22.139 10.806 54.848 12.207 45.147 44.995 8.335 1.523
22 2.818 21.720 10.875 55.878 11.528 44.450 44.351 9.690 1.509
23 2.842 21.342 10.900 56.869 10.889 43.763 43.654 11.090 1.494
24 2.868 21.006 10.892 57.815 10.287 43.099 42.914 12.510 1.477
25 2.894 20.710 10.857 58.712 9.721 42.470 42.142 13.931 1.458
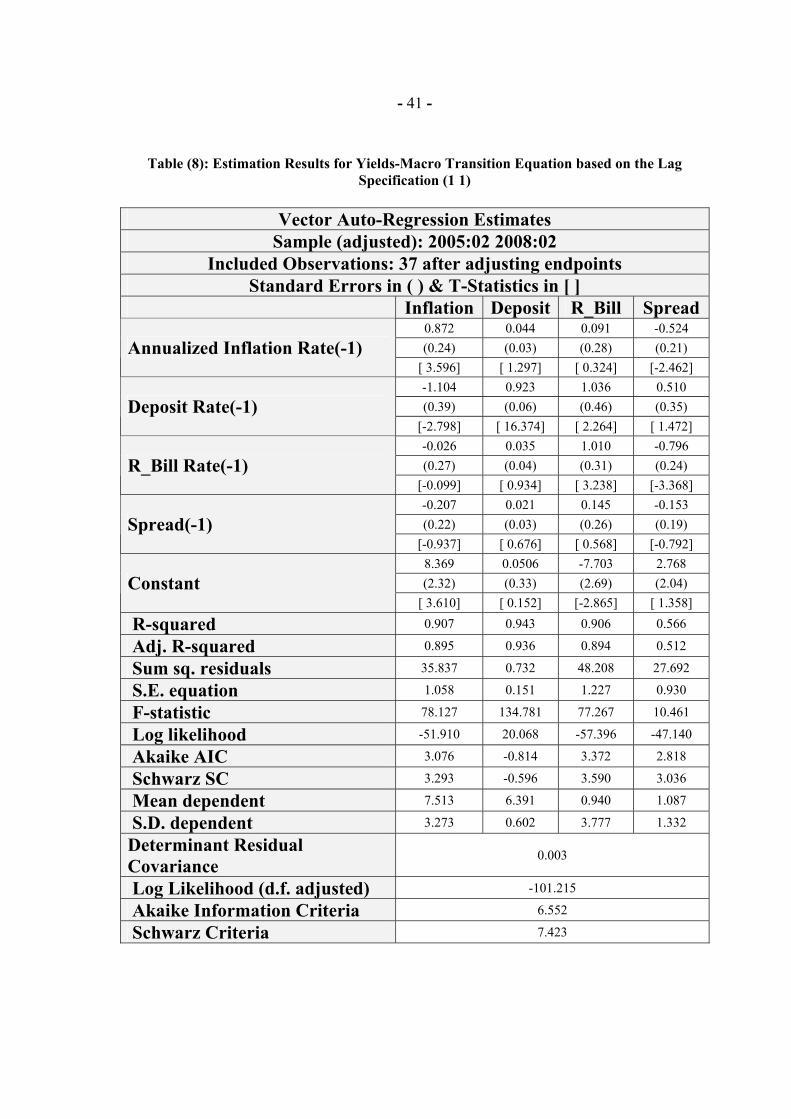
- 41 -
Table (8): Estimation Results for Yields-Macro Transition Equation based on the Lag
Specification (1 1)
Vector Auto-Regression Estimates Sample (adjusted): 2005:02 2008:02
Included Observations: 37 after adjusting endpoints Standard Errors in ( ) & T-Statistics in [ ]
Inflation Deposit R_Bill Spread0.872 0.044 0.091 -0.524 (0.24) (0.03) (0.28) (0.21) Annualized Inflation Rate(-1)
[ 3.596] [ 1.297] [ 0.324] [-2.462] -1.104 0.923 1.036 0.510 (0.39) (0.06) (0.46) (0.35) Deposit Rate(-1)
[-2.798] [ 16.374] [ 2.264] [ 1.472] -0.026 0.035 1.010 -0.796 (0.27) (0.04) (0.31) (0.24) R_Bill Rate(-1)
[-0.099] [ 0.934] [ 3.238] [-3.368] -0.207 0.021 0.145 -0.153 (0.22) (0.03) (0.26) (0.19) Spread(-1)
[-0.937] [ 0.676] [ 0.568] [-0.792] 8.369 0.0506 -7.703 2.768 (2.32) (0.33) (2.69) (2.04) Constant
[ 3.610] [ 0.152] [-2.865] [ 1.358]
R-squared 0.907 0.943 0.906 0.566
Adj. R-squared 0.895 0.936 0.894 0.512
Sum sq. residuals 35.837 0.732 48.208 27.692
S.E. equation 1.058 0.151 1.227 0.930
F-statistic 78.127 134.781 77.267 10.461
Log likelihood -51.910 20.068 -57.396 -47.140
Akaike AIC 3.076 -0.814 3.372 2.818
Schwarz SC 3.293 -0.596 3.590 3.036
Mean dependent 7.513 6.391 0.940 1.087
S.D. dependent 3.273 0.602 3.777 1.332
Determinant Residual Covariance
0.003
Log Likelihood (d.f. adjusted) -101.215
Akaike Information Criteria 6.552
Schwarz Criteria 7.423
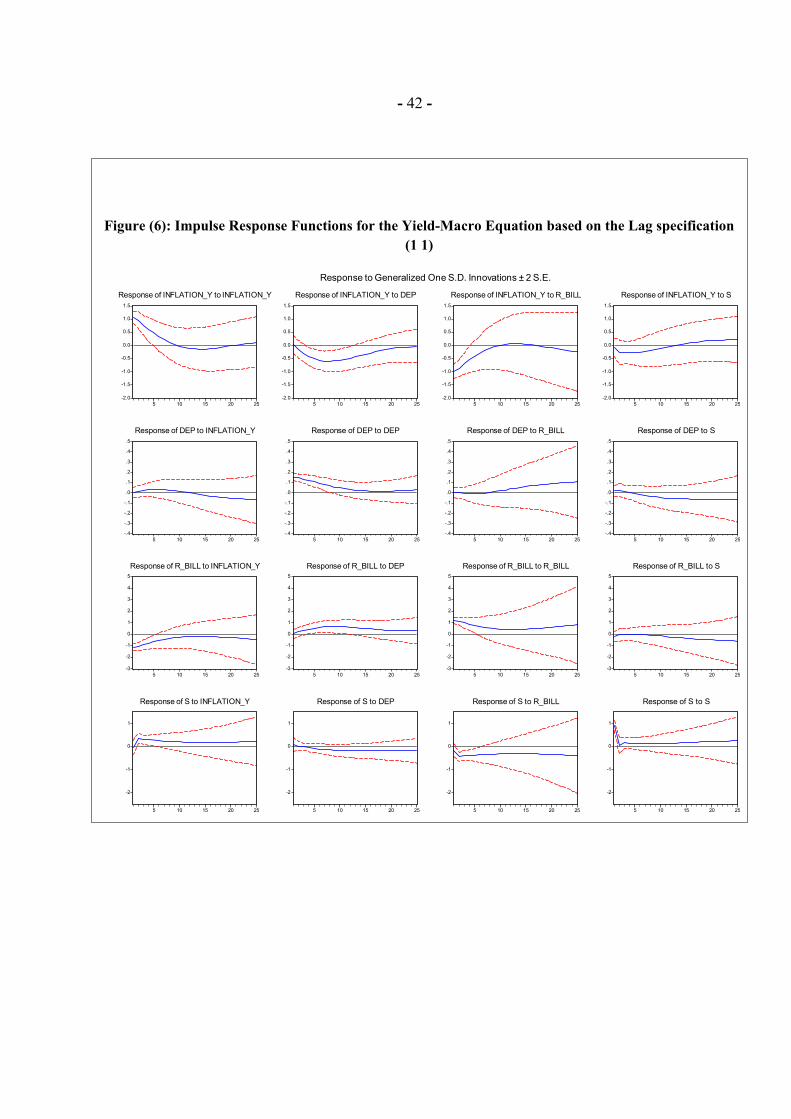
- 42 -
Figure (6): Impulse Response Functions for the Yield-Macro Equation based on the Lag specification (1 1)
-2.0
-1.5
-1.0
-0.5
0.0
0.5
1.0
1.5
5 10 15 20 25
Response of INFLATION_Y to INFLATION_Y
-2.0
-1.5
-1.0
-0.5
0.0
0.5
1.0
1.5
5 10 15 20 25
Response of INFLATION_Y to DEP
-2.0
-1.5
-1.0
-0.5
0.0
0.5
1.0
1.5
5 10 15 20 25
Response of INFLATION_Y to R_BILL
-2.0
-1.5
-1.0
-0.5
0.0
0.5
1.0
1.5
5 10 15 20 25
Response of INFLATION_Y to S
-.4
-.3
-.2
-.1
.0
.1
.2
.3
.4
.5
5 10 15 20 25
Response of DEP to INFLATION_Y
-.4
-.3
-.2
-.1
.0
.1
.2
.3
.4
.5
5 10 15 20 25
Response of DEP to DEP
-.4
-.3
-.2
-.1
.0
.1
.2
.3
.4
.5
5 10 15 20 25
Response of DEP to R_BILL
-.4
-.3
-.2
-.1
.0
.1
.2
.3
.4
.5
5 10 15 20 25
Response of DEP to S
-3
-2
-1
0
1
2
3
4
5
5 10 15 20 25
Response of R_BILL to INFLATION_Y
-3
-2
-1
0
1
2
3
4
5
5 10 15 20 25
Response of R_BILL to DEP
-3
-2
-1
0
1
2
3
4
5
5 10 15 20 25
Response of R_BILL to R_BILL
-3
-2
-1
0
1
2
3
4
5
5 10 15 20 25
Response of R_BILL to S
-2
-1
0
1
5 10 15 20 25
Response of S to INFLATION_Y
-2
-1
0
1
5 10 15 20 25
Response of S to DEP
-2
-1
0
1
5 10 15 20 25
Response of S to R_BILL
-2
-1
0
1
5 10 15 20 25
Response of S to S
Response to Generalized One S.D. Innovations ± 2 S.E.
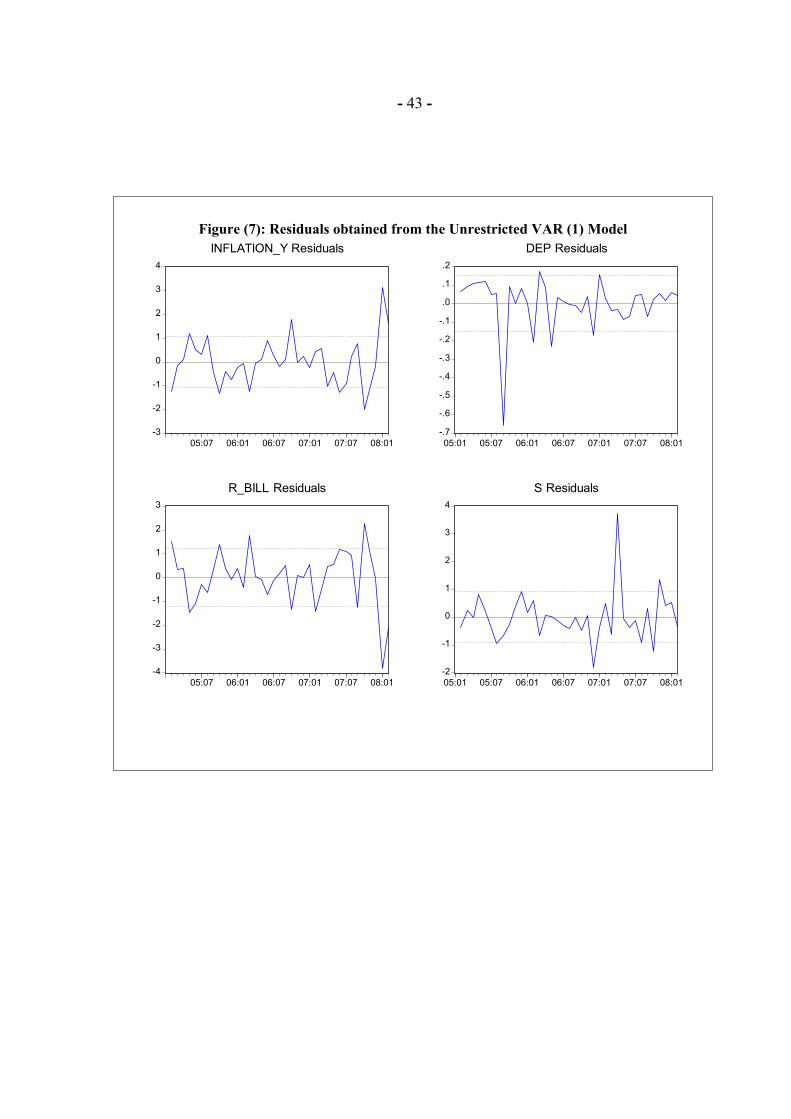
- 43 -
-3
-2
-1
0
1
2
3
4
05:07 06:01 06:07 07:01 07:07 08:01
INFLATION_Y Residuals
-.7
-.6
-.5
-.4
-.3
-.2
-.1
.0
.1
.2
05:01 05:07 06:01 06:07 07:01 07:07 08:01
DEP Residuals
-4
-3
-2
-1
0
1
2
3
05:07 06:01 06:07 07:01 07:07 08:01
R_BILL Residuals
-2
-1
0
1
2
3
4
05:01 05:07 06:01 06:07 07:01 07:07 08:01
S Residuals
Figure (7): Residuals obtained from the Unrestricted VAR (1) Model
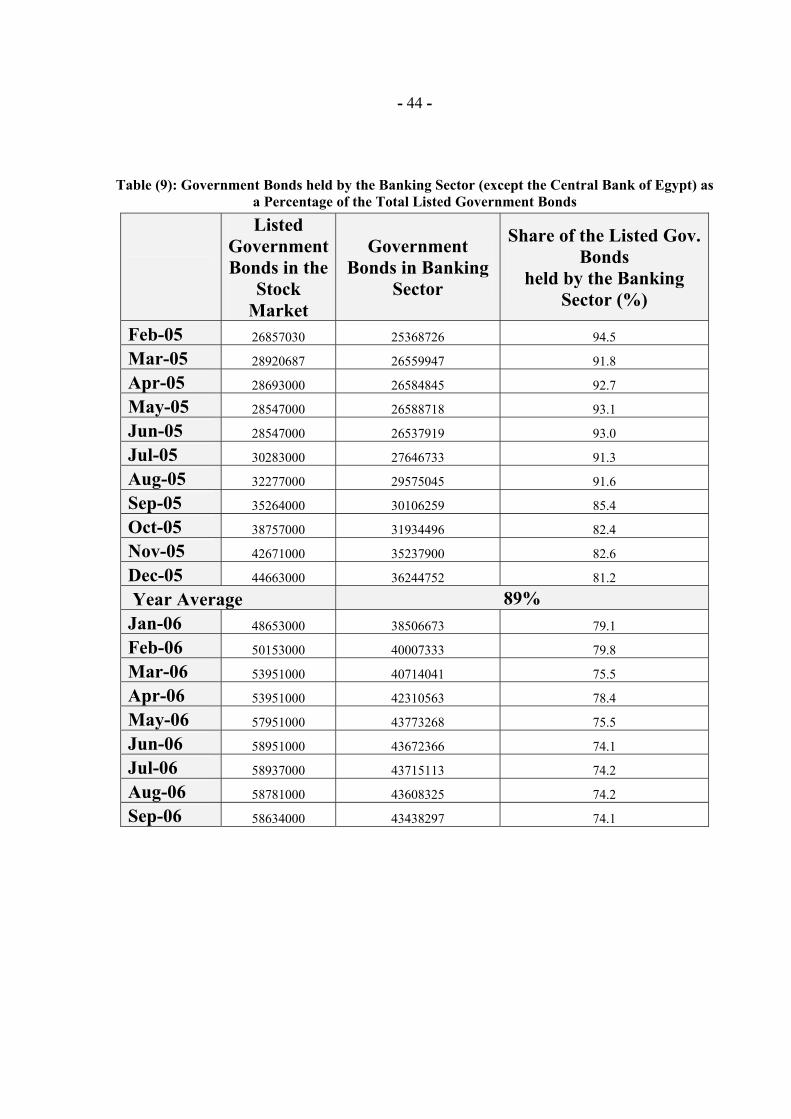
- 44 -
Table (9): Government Bonds held by the Banking Sector (except the Central Bank of Egypt) as a Percentage of the Total Listed Government Bonds
Listed Government Bonds in the
Stock Market
Government Bonds in Banking
Sector
Share of the Listed Gov. Bonds
held by the Banking Sector (%)
Feb-05 26857030 25368726 94.5
Mar-05 28920687 26559947 91.8
Apr-05 28693000 26584845 92.7
May-05 28547000 26588718 93.1
Jun-05 28547000 26537919 93.0
Jul-05 30283000 27646733 91.3
Aug-05 32277000 29575045 91.6
Sep-05 35264000 30106259 85.4
Oct-05 38757000 31934496 82.4
Nov-05 42671000 35237900 82.6
Dec-05 44663000 36244752 81.2
Year Average 89% Jan-06 48653000 38506673 79.1
Feb-06 50153000 40007333 79.8
Mar-06 53951000 40714041 75.5
Apr-06 53951000 42310563 78.4
May-06 57951000 43773268 75.5
Jun-06 58951000 43672366 74.1
Jul-06 58937000 43715113 74.2
Aug-06 58781000 43608325 74.2
Sep-06 58634000 43438297 74.1
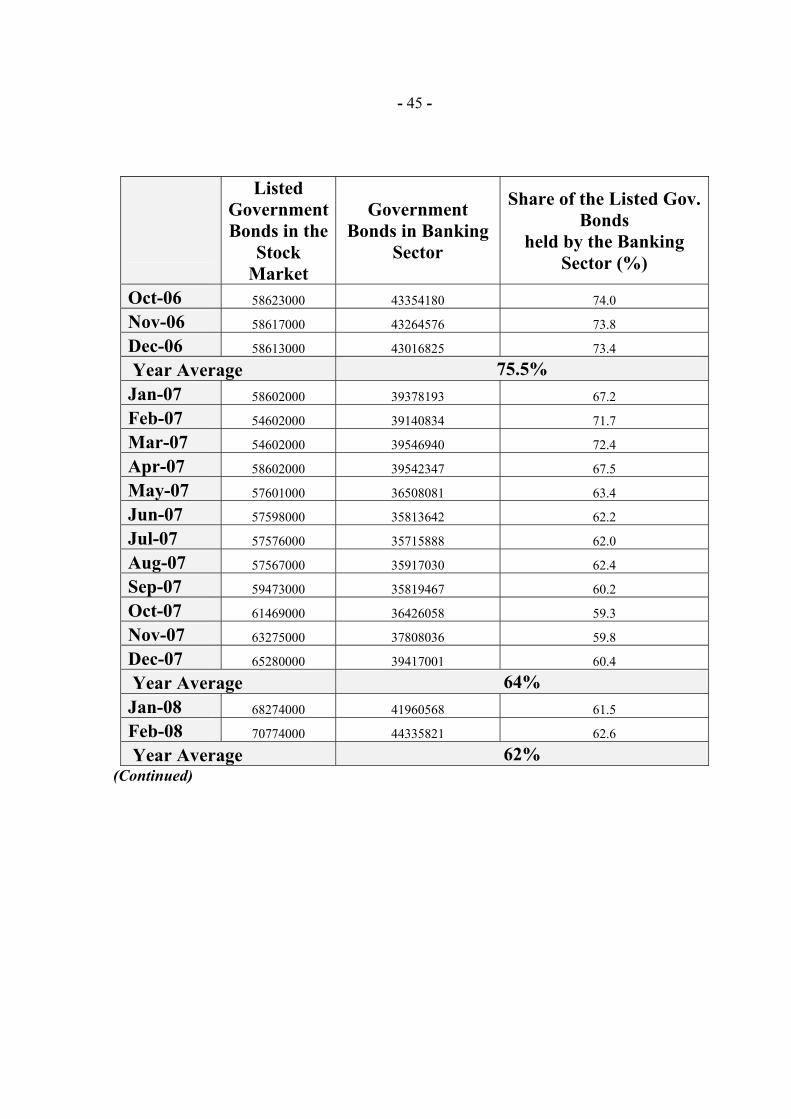
- 45 -
Listed Government Bonds in the
Stock Market
Government Bonds in Banking
Sector
Share of the Listed Gov. Bonds
held by the Banking Sector (%)
Oct-06 58623000 43354180 74.0
Nov-06 58617000 43264576 73.8
Dec-06 58613000 43016825 73.4
Year Average 75.5% Jan-07 58602000 39378193 67.2
Feb-07 54602000 39140834 71.7
Mar-07 54602000 39546940 72.4
Apr-07 58602000 39542347 67.5
May-07 57601000 36508081 63.4
Jun-07 57598000 35813642 62.2
Jul-07 57576000 35715888 62.0
Aug-07 57567000 35917030 62.4
Sep-07 59473000 35819467 60.2
Oct-07 61469000 36426058 59.3
Nov-07 63275000 37808036 59.8
Dec-07 65280000 39417001 60.4
Year Average 64% Jan-08 68274000 41960568 61.5
Feb-08 70774000 44335821 62.6
Year Average 62% (Continued)

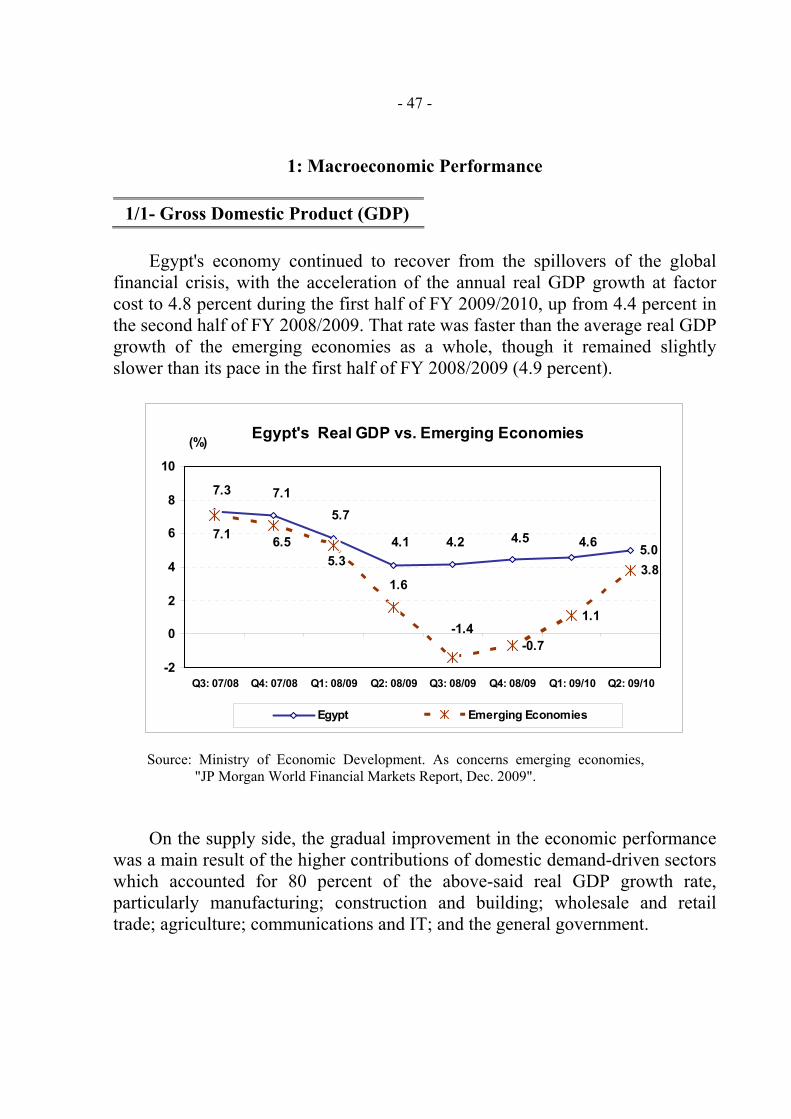
- 47 -
1: Macroeconomic Performance
1/1- Gross Domestic Product (GDP)
Egypt's economy continued to recover from the spillovers of the global financial crisis, with the acceleration of the annual real GDP growth at factor cost to 4.8 percent during the first half of FY 2009/2010, up from 4.4 percent in the second half of FY 2008/2009. That rate was faster than the average real GDP growth of the emerging economies as a whole, though it remained slightly slower than its pace in the first half of FY 2008/2009 (4.9 percent).
Source: Ministry of Economic Development. As concerns emerging economies, "JP Morgan World Financial Markets Report, Dec. 2009".
On the supply side, the gradual improvement in the economic performance was a main result of the higher contributions of domestic demand-driven sectors which accounted for 80 percent of the above-said real GDP growth rate, particularly manufacturing; construction and building; wholesale and retail trade; agriculture; communications and IT; and the general government.
Egypt's Real GDP vs. Emerging Economies
5.0
-0.7
1.1
3.8
4.54.24.1
5.77.17.3
4.6
-1.4
1.6
5.36.57.1
-2
0
2
4
6
8
10
Q3: 07/08 Q4: 07/08 Q1: 08/09 Q2: 08/09 Q3: 08/09 Q4: 08/09 Q1: 09/10 Q2: 09/10
Egypt Emerging Economies
(%)
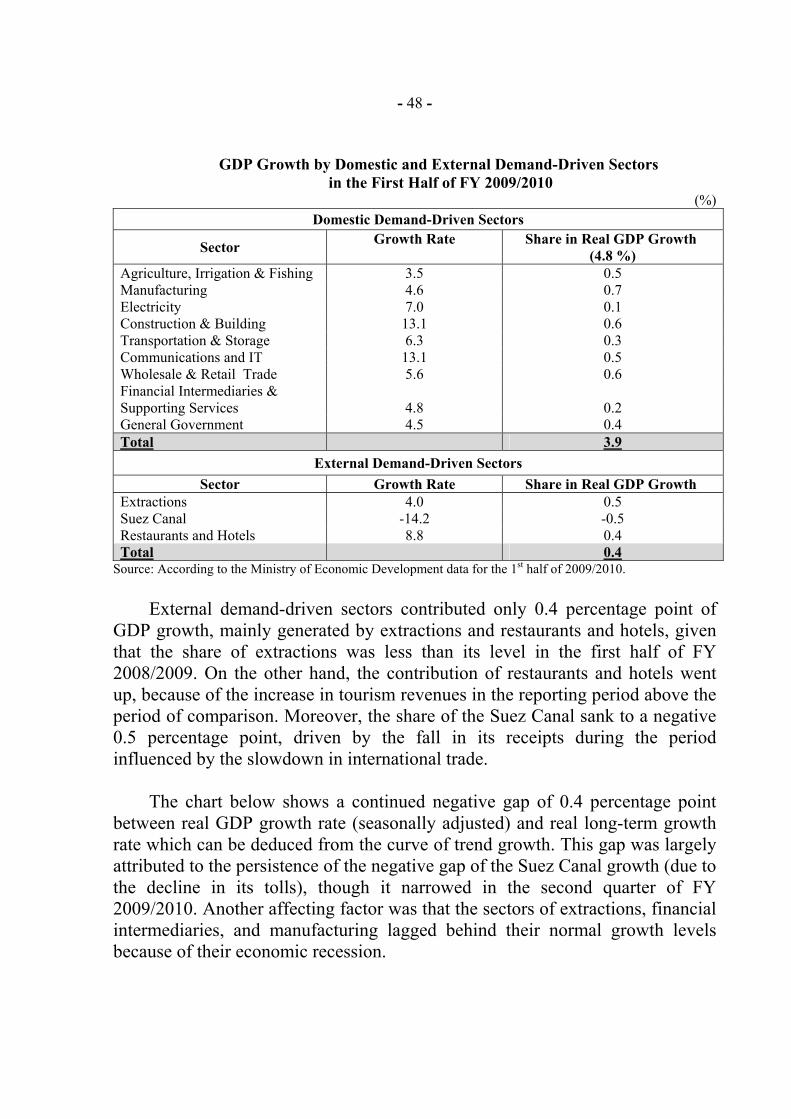
- 48 -
GDP Growth by Domestic and External Demand-Driven Sectors
in the First Half of FY 2009/2010 (%)
Domestic Demand-Driven Sectors
Sector Growth Rate
Share in Real GDP Growth (4.8 %)
Agriculture, Irrigation & Fishing 3.5 0.5 Manufacturing 4.6 0.7 Electricity 7.0 0.1 Construction & Building 13.1 0.6 Transportation & Storage 6.3 0.3 Communications and IT 13.1 0.5 Wholesale & Retail Trade 5.6 0.6 Financial Intermediaries & Supporting Services 4.8 0.2 General Government 4.5 0.4 Total 3.9
External Demand-Driven Sectors Sector Growth Rate Share in Real GDP Growth
Extractions 4.0 0.5 Suez Canal -14.2 -0.5 Restaurants and Hotels 8.8 0.4 Total 0.4
Source: According to the Ministry of Economic Development data for the 1st half of 2009/2010.
External demand-driven sectors contributed only 0.4 percentage point of GDP growth, mainly generated by extractions and restaurants and hotels, given that the share of extractions was less than its level in the first half of FY 2008/2009. On the other hand, the contribution of restaurants and hotels went up, because of the increase in tourism revenues in the reporting period above the period of comparison. Moreover, the share of the Suez Canal sank to a negative 0.5 percentage point, driven by the fall in its receipts during the period influenced by the slowdown in international trade.
The chart below shows a continued negative gap of 0.4 percentage point
between real GDP growth rate (seasonally adjusted) and real long-term growth rate which can be deduced from the curve of trend growth. This gap was largely attributed to the persistence of the negative gap of the Suez Canal growth (due to the decline in its tolls), though it narrowed in the second quarter of FY 2009/2010. Another affecting factor was that the sectors of extractions, financial intermediaries, and manufacturing lagged behind their normal growth levels because of their economic recession.
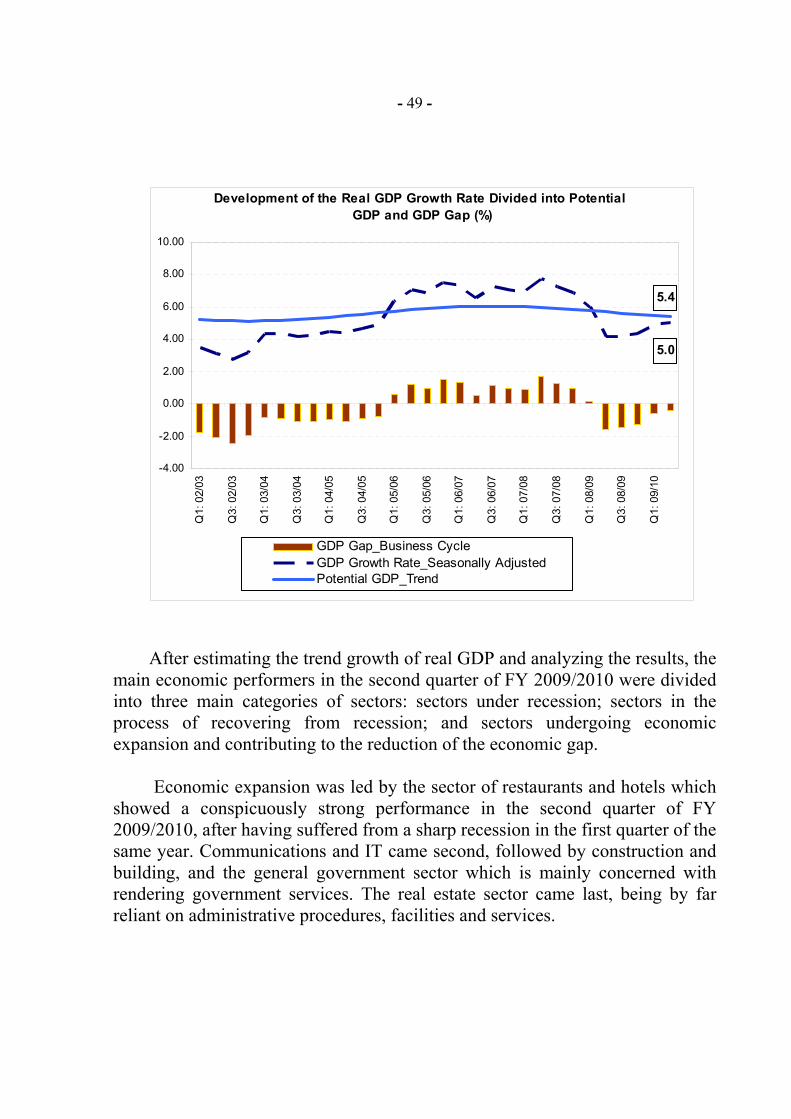
- 49 -
After estimating the trend growth of real GDP and analyzing the results, the main economic performers in the second quarter of FY 2009/2010 were divided into three main categories of sectors: sectors under recession; sectors in the process of recovering from recession; and sectors undergoing economic expansion and contributing to the reduction of the economic gap.
Economic expansion was led by the sector of restaurants and hotels which
showed a conspicuously strong performance in the second quarter of FY 2009/2010, after having suffered from a sharp recession in the first quarter of the same year. Communications and IT came second, followed by construction and building, and the general government sector which is mainly concerned with rendering government services. The real estate sector came last, being by far reliant on administrative procedures, facilities and services.
Development of the Real GDP Growth Rate Divided into Potential GDP and GDP Gap (%)
5.0
5.4
-4.00
-2.00
0.00
2.00
4.00
6.00
8.00
10.00
Q1:
02/
03
Q3:
02/
03
Q1:
03/
04
Q3:
03/
04
Q1:
04/
05
Q3:
04/
05
Q1:
05/
06
Q3:
05/
06
Q1:
06/
07
Q3:
06/
07
Q1:
07/
08
Q3:
07/
08
Q1:
08/
09
Q3:
08/
09
Q1:
09/
10
GDP Gap_Business CycleGDP Growth Rate_Seasonally AdjustedPotential GDP_Trend
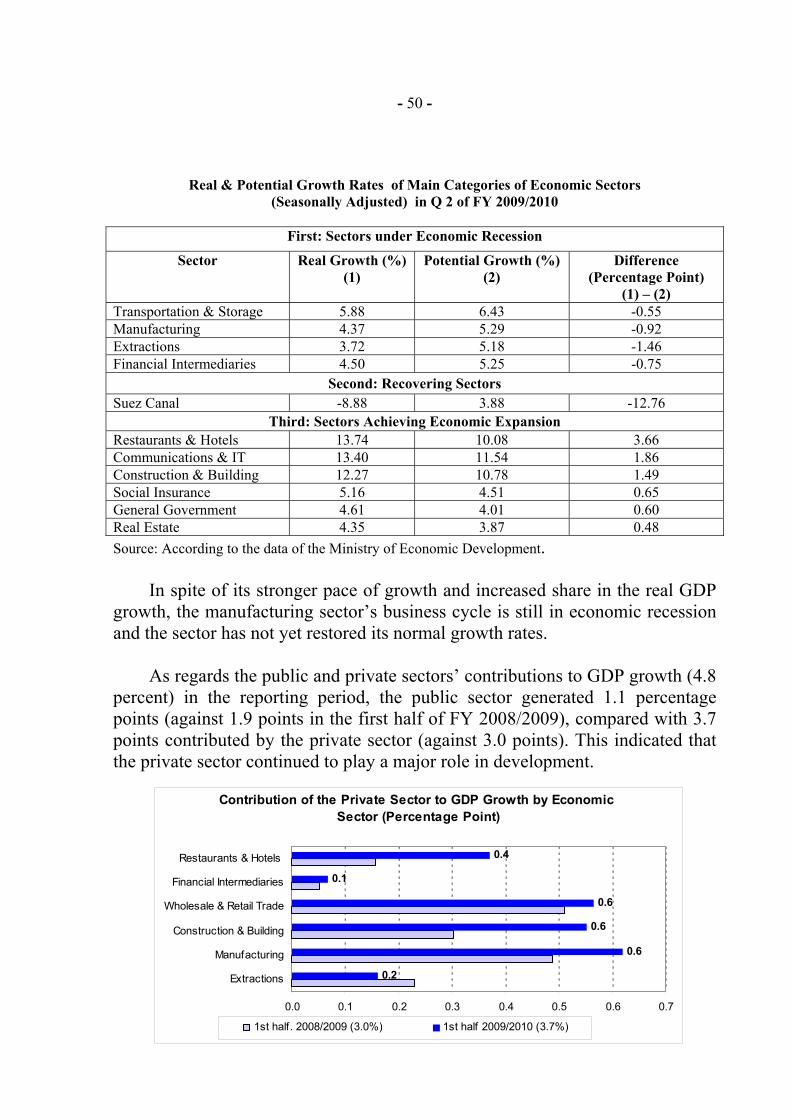
- 50 -
Real & Potential Growth Rates of Main Categories of Economic Sectors (Seasonally Adjusted) in Q 2 of FY 2009/2010
First: Sectors under Economic Recession
Sector Real Growth (%) (1)
Potential Growth (%) (2)
Difference (Percentage Point)
(1) – (2) Transportation & Storage 5.88 6.43 -0.55 Manufacturing 4.37 5.29 -0.92 Extractions 3.72 5.18 -1.46 Financial Intermediaries 4.50 5.25 -0.75
Second: Recovering Sectors Suez Canal -8.88 3.88 -12.76
Third: Sectors Achieving Economic Expansion Restaurants & Hotels 13.74 10.08 3.66 Communications & IT 13.40 11.54 1.86 Construction & Building 12.27 10.78 1.49 Social Insurance 5.16 4.51 0.65 General Government 4.61 4.01 0.60 Real Estate 4.35 3.87 0.48 Source: According to the data of the Ministry of Economic Development.
In spite of its stronger pace of growth and increased share in the real GDP growth, the manufacturing sector’s business cycle is still in economic recession and the sector has not yet restored its normal growth rates.
As regards the public and private sectors’ contributions to GDP growth (4.8
percent) in the reporting period, the public sector generated 1.1 percentage points (against 1.9 points in the first half of FY 2008/2009), compared with 3.7 points contributed by the private sector (against 3.0 points). This indicated that the private sector continued to play a major role in development.
Contribution of the Private Sector to GDP Growth by Economic Sector (Percentage Point)
0.2
0.6
0.6
0.6
0.1
0.4
0.0 0.1 0.2 0.3 0.4 0.5 0.6 0.7
Extractions
Manufacturing
Construction & Building
Wholesale & Retail Trade
Financial Intermediaries
Restaurants & Hotels
1st half. 2008/2009 (3.0%) 1st half 2009/2010 (3.7%)
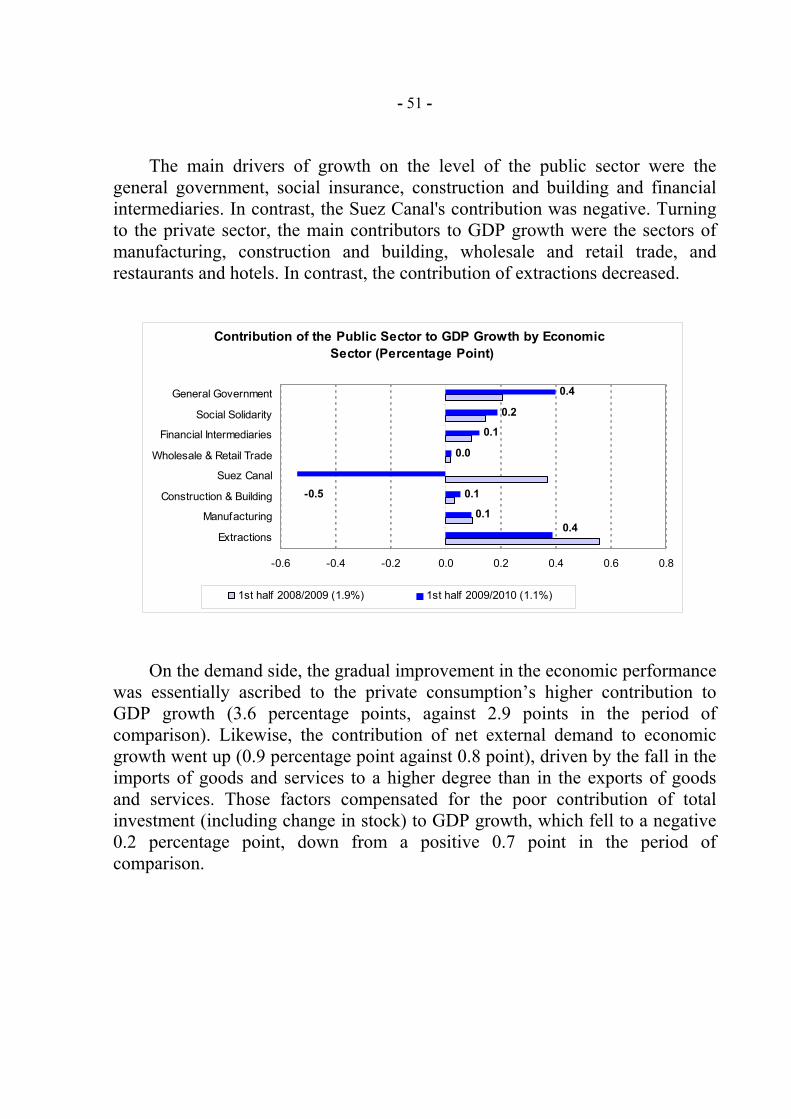
- 51 -
The main drivers of growth on the level of the public sector were the
general government, social insurance, construction and building and financial intermediaries. In contrast, the Suez Canal's contribution was negative. Turning to the private sector, the main contributors to GDP growth were the sectors of manufacturing, construction and building, wholesale and retail trade, and restaurants and hotels. In contrast, the contribution of extractions decreased.
On the demand side, the gradual improvement in the economic performance was essentially ascribed to the private consumption’s higher contribution to GDP growth (3.6 percentage points, against 2.9 points in the period of comparison). Likewise, the contribution of net external demand to economic growth went up (0.9 percentage point against 0.8 point), driven by the fall in the imports of goods and services to a higher degree than in the exports of goods and services. Those factors compensated for the poor contribution of total investment (including change in stock) to GDP growth, which fell to a negative 0.2 percentage point, down from a positive 0.7 point in the period of comparison.
Contribution of the Public Sector to GDP Growth by Economic Sector (Percentage Point)
0.1
0.1
0.0
0.1
0.2
0.4
0.4
-0.5
-0.6 -0.4 -0.2 0.0 0.2 0.4 0.6 0.8
Extractions
Manufacturing
Construction & Building
Suez Canal
Wholesale & Retail Trade
Financial Intermediaries
Social Solidarity
General Government
1st half 2008/2009 (1.9%) 1st half 2009/2010 (1.1%)
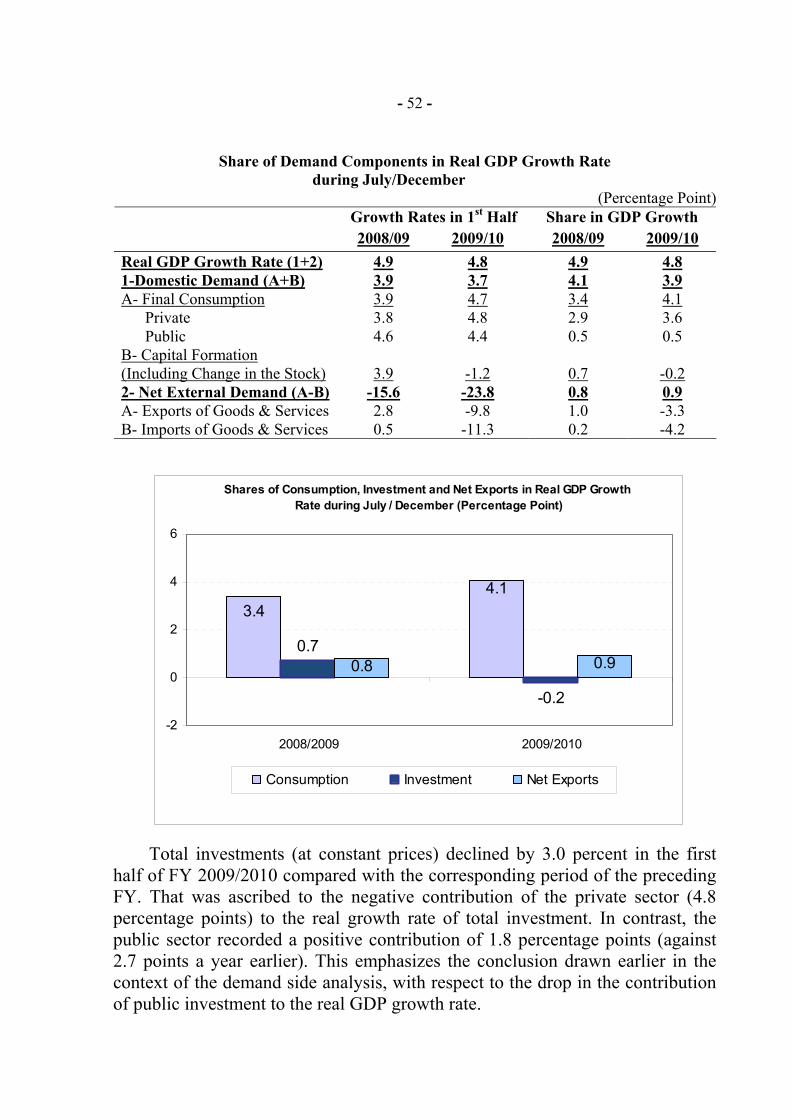
- 52 -
Share of Demand Components in Real GDP Growth Rate
during July/December (Percentage Point)
Share in GDP Growth Growth Rates in 1st Half 2009/10 2008/09 2009/10 2008/09
4.8 4.9 4.8 4.9 Real GDP Growth Rate (1+2) 3.9 4.1 3.7 3.9 1-Domestic Demand (A+B) 4.1 3.4 4.7 3.9 A- Final Consumption 3.6 2.9 4.8 3.8 Private 0.5 0.5 4.4 4.6 Public
-0.2 0.7 -1.2 3.9 B- Capital Formation (Including Change in the Stock)
0.9 0.8 -23.8 -15.6 2- Net External Demand (A-B) -3.3 1.0 -9.8 2.8 A- Exports of Goods & Services -4.2 0.2 -11.3 0.5 B- Imports of Goods & Services
Total investments (at constant prices) declined by 3.0 percent in the first half of FY 2009/2010 compared with the corresponding period of the preceding FY. That was ascribed to the negative contribution of the private sector (4.8 percentage points) to the real growth rate of total investment. In contrast, the public sector recorded a positive contribution of 1.8 percentage points (against 2.7 points a year earlier). This emphasizes the conclusion drawn earlier in the context of the demand side analysis, with respect to the drop in the contribution of public investment to the real GDP growth rate.
Shares of Consumption, Investment and Net Exports in Real GDP Growth Rate during July / December (Percentage Point)
0.7
-0.2
3.44.1
0.8 0.9
-2
0
2
4
6
2008/2009 2009/2010
Consumption Investment Net Exports
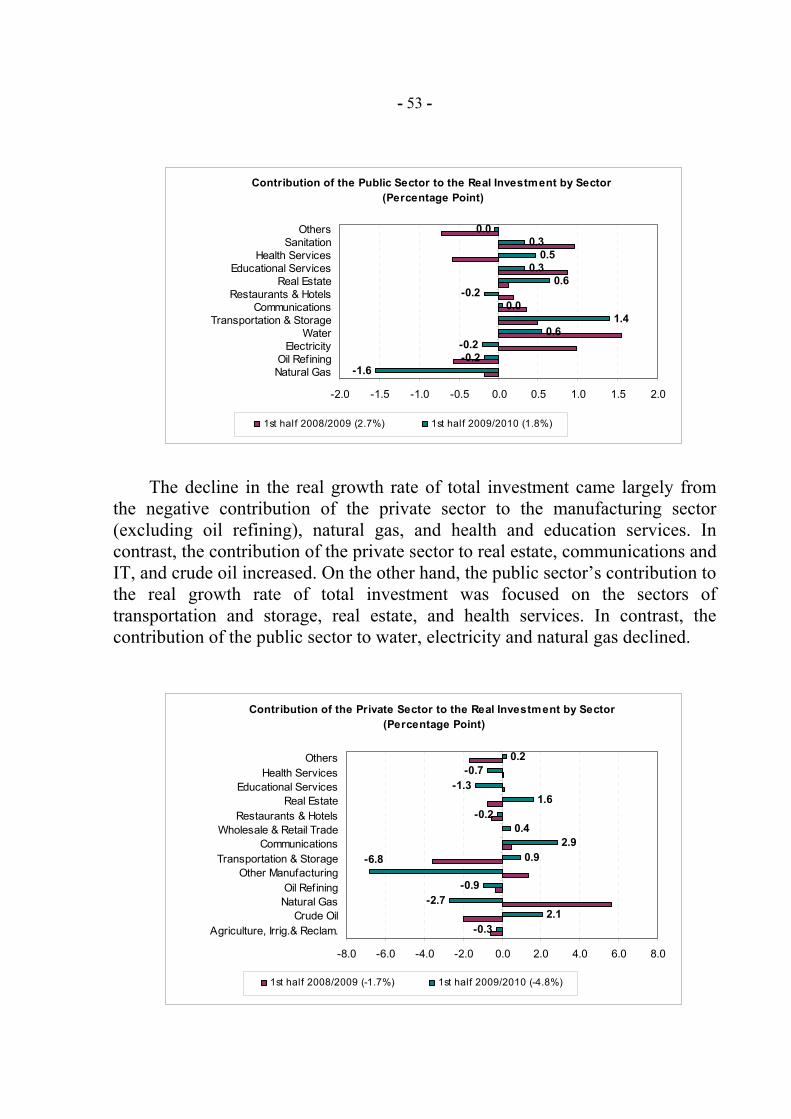
- 53 -
The decline in the real growth rate of total investment came largely from
the negative contribution of the private sector to the manufacturing sector (excluding oil refining), natural gas, and health and education services. In contrast, the contribution of the private sector to real estate, communications and IT, and crude oil increased. On the other hand, the public sector’s contribution to the real growth rate of total investment was focused on the sectors of transportation and storage, real estate, and health services. In contrast, the contribution of the public sector to water, electricity and natural gas declined.
Contribution of the Public Sector to the Real Investment by Sector (Percentage Point)
-1.6-0.2-0.2
0.61.4
0.0-0.2
0.60.3
0.50.3
0.0
-2.0 -1.5 -1.0 -0.5 0.0 0.5 1.0 1.5 2.0
Natural GasOil Refining
ElectricityWater
Transportation & StorageCommunications
Restaurants & HotelsReal Estate
Educational ServicesHealth Services
SanitationOthers
1st half 2008/2009 (2.7%) 1st half 2009/2010 (1.8%)
Contribution of the Private Sector to the Real Investment by Sector (Percentage Point)
-0.32.1
-2.7-0.9
0.92.9
0.4-0.2
1.6-1.3
-0.70.2
-6.8
-8.0 -6.0 -4.0 -2.0 0.0 2.0 4.0 6.0 8.0
Agriculture, Irrig.& Reclam.Crude Oil
Natural GasOil Refining
Other ManufacturingTransportation & Storage
CommunicationsWholesale & Retail Trade
Restaurants & HotelsReal Estate
Educational ServicesHealth Services
Others
1st half 2008/2009 (-1.7%) 1st half 2009/2010 (-4.8%)
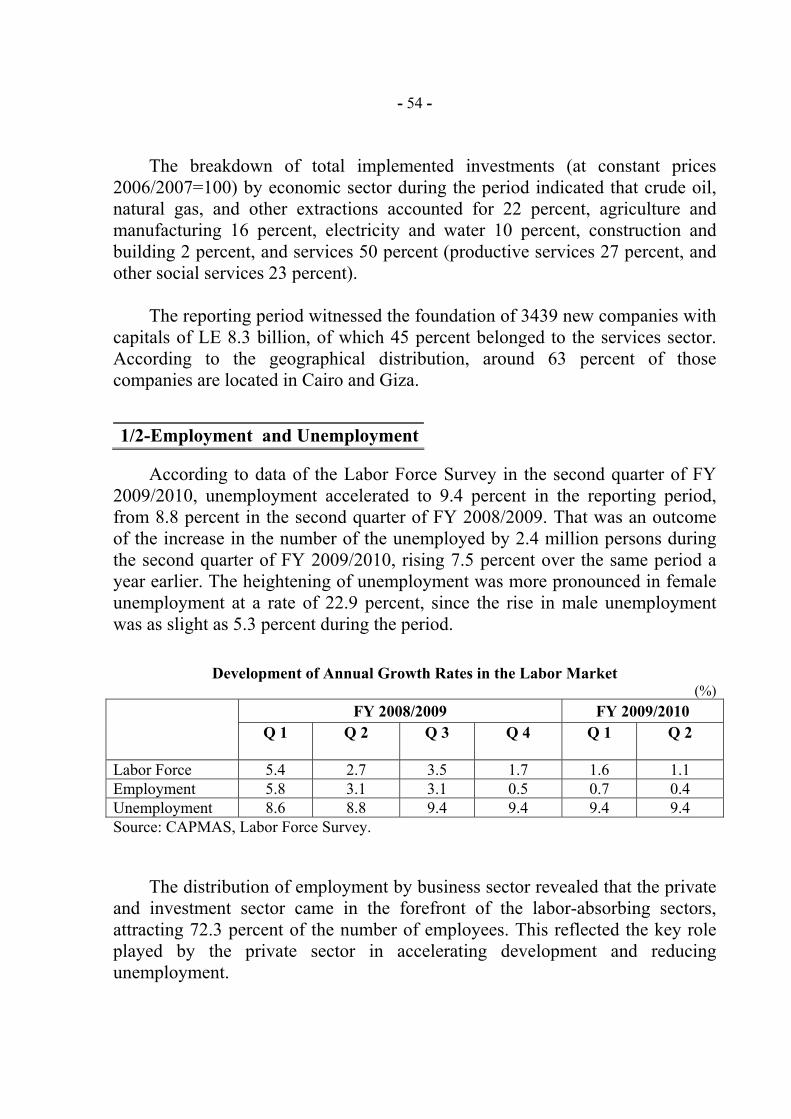
- 54 -
The breakdown of total implemented investments (at constant prices
2006/2007=100) by economic sector during the period indicated that crude oil, natural gas, and other extractions accounted for 22 percent, agriculture and manufacturing 16 percent, electricity and water 10 percent, construction and building 2 percent, and services 50 percent (productive services 27 percent, and other social services 23 percent).
The reporting period witnessed the foundation of 3439 new companies with
capitals of LE 8.3 billion, of which 45 percent belonged to the services sector. According to the geographical distribution, around 63 percent of those companies are located in Cairo and Giza. 1/2-Employment and Unemployment
According to data of the Labor Force Survey in the second quarter of FY
2009/2010, unemployment accelerated to 9.4 percent in the reporting period, from 8.8 percent in the second quarter of FY 2008/2009. That was an outcome of the increase in the number of the unemployed by 2.4 million persons during the second quarter of FY 2009/2010, rising 7.5 percent over the same period a year earlier. The heightening of unemployment was more pronounced in female unemployment at a rate of 22.9 percent, since the rise in male unemployment was as slight as 5.3 percent during the period.
Development of Annual Growth Rates in the Labor Market
(%) FY 2008/2009 FY 2009/2010 Q 1 Q 2
Q 3
Q 4
Q 1
Q 2
Labor Force 5.4 2.7 3.5 1.7 1.6 1.1 Employment 5.8 3.1 3.1 0.5 0.7 0.4 Unemployment 8.6 8.8 9.4 9.4 9.4 9.4 Source: CAPMAS, Labor Force Survey.
The distribution of employment by business sector revealed that the private
and investment sector came in the forefront of the labor-absorbing sectors, attracting 72.3 percent of the number of employees. This reflected the key role played by the private sector in accelerating development and reducing unemployment.
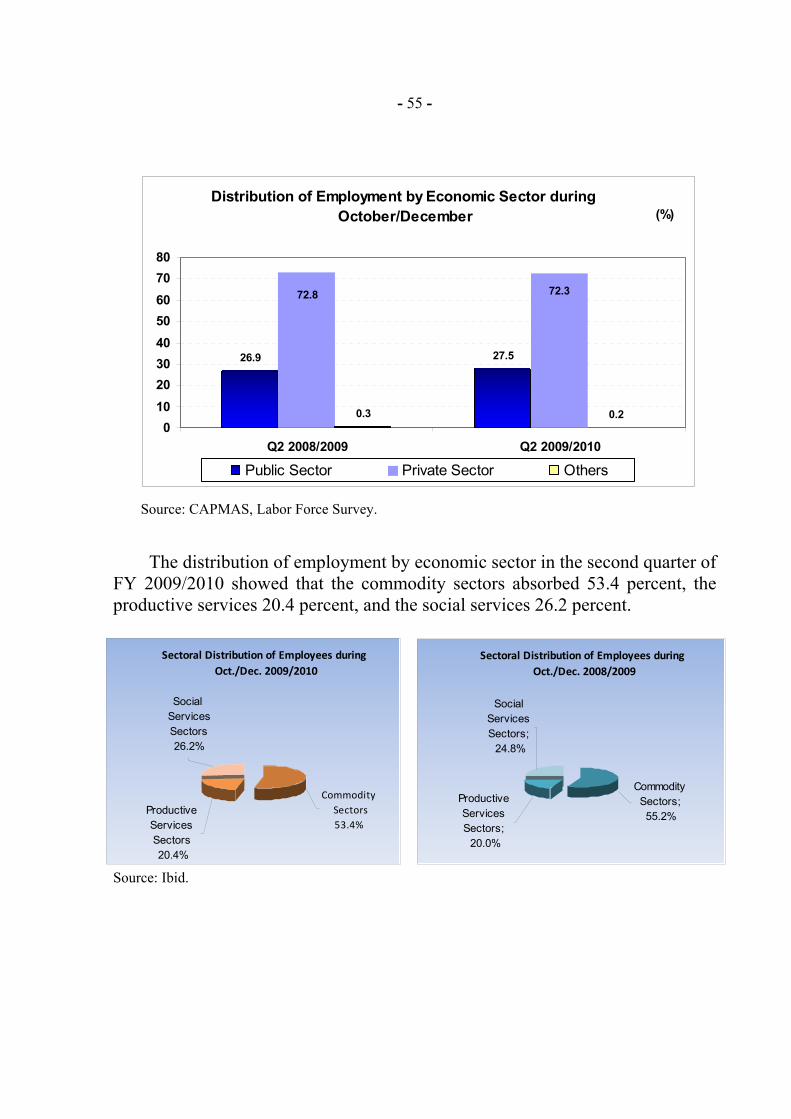
- 55 -
Source: CAPMAS, Labor Force Survey.
The distribution of employment by economic sector in the second quarter of FY 2009/2010 showed that the commodity sectors absorbed 53.4 percent, the productive services 20.4 percent, and the social services 26.2 percent.
Source: Ibid.
Distribution of Employment by Economic Sector during October/December
26.9 27.5
0.3 0.2
72.372.8
01020304050607080
Q2 2008/2009 Q2 2009/2010
Public Sector Private Sector Others
(%)
Sectoral Distribution of Employees during Oct./Dec. 2009/2010
Commodity Sectors
53.4%Productive Services Sectors 20.4%
Social Services Sectors
26.2%
Sectoral Distribution of Employees during Oct./Dec. 2008/2009
Commodity Sectors; 55.2%
Productive Services Sectors;
20.0%
Social Services Sectors;
24.8%
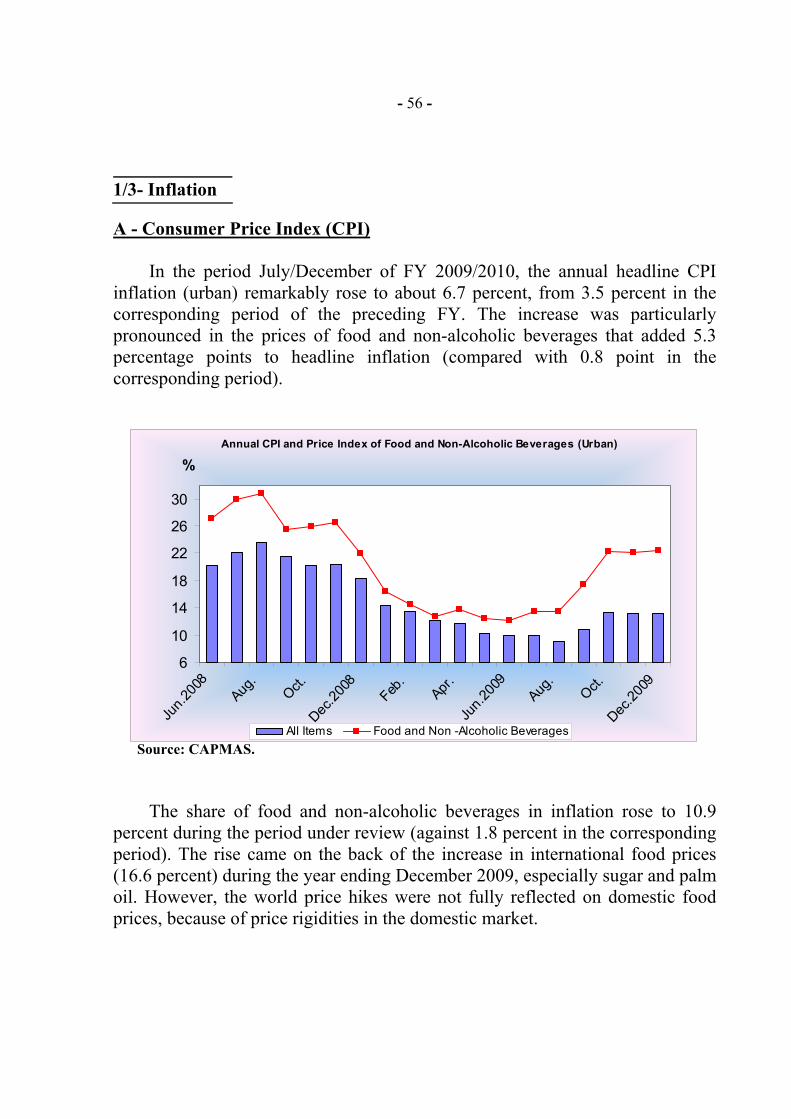
- 56 -
1/3- Inflation A - Consumer Price Index (CPI)
In the period July/December of FY 2009/2010, the annual headline CPI
inflation (urban) remarkably rose to about 6.7 percent, from 3.5 percent in the corresponding period of the preceding FY. The increase was particularly pronounced in the prices of food and non-alcoholic beverages that added 5.3 percentage points to headline inflation (compared with 0.8 point in the corresponding period).
Source: CAPMAS.
The share of food and non-alcoholic beverages in inflation rose to 10.9
percent during the period under review (against 1.8 percent in the corresponding period). The rise came on the back of the increase in international food prices (16.6 percent) during the year ending December 2009, especially sugar and palm oil. However, the world price hikes were not fully reflected on domestic food prices, because of price rigidities in the domestic market.
Annual CPI and Price Index of Food and Non-Alcoholic Beverages (Urban)
6
10
14
18
22
26
30
Jun.2
008
Aug.
Oct.Dec
.2008
Feb.
Apr.Ju
n.200
9
Aug.
Oct.Dec
.2009
%
All Items Food and Non -Alcoholic Beverages
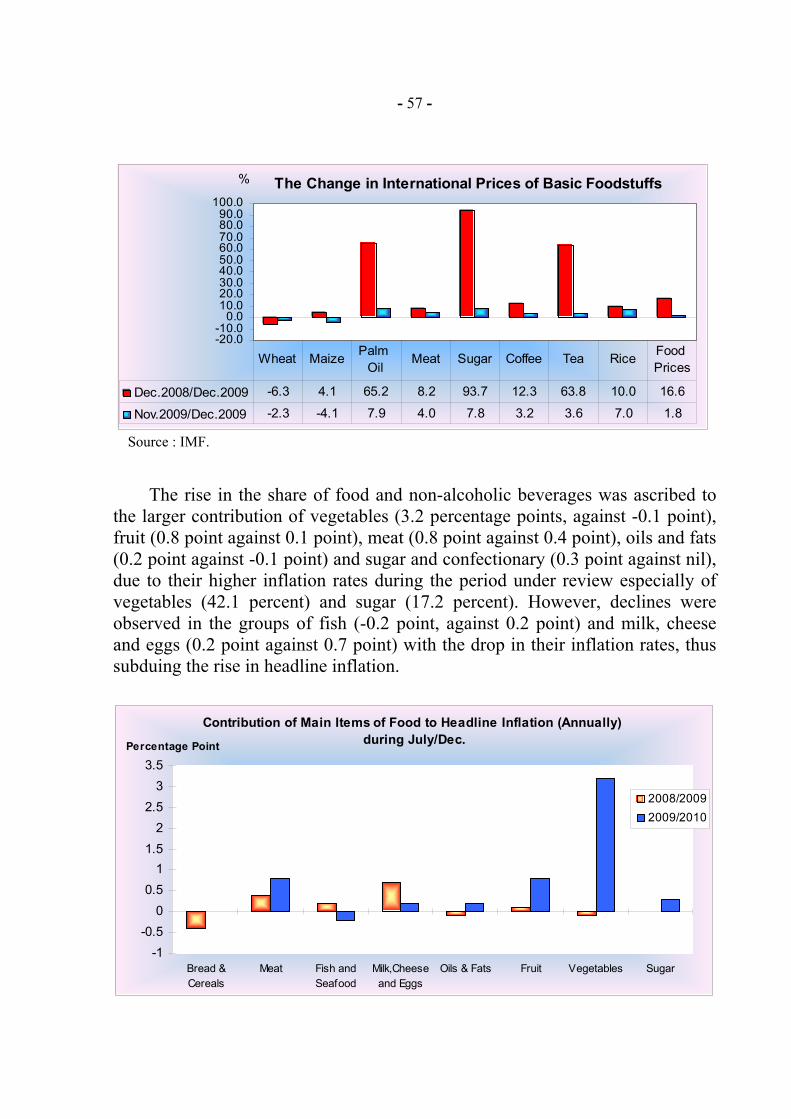
- 57 -
Source : IMF.
The rise in the share of food and non-alcoholic beverages was ascribed to the larger contribution of vegetables (3.2 percentage points, against -0.1 point), fruit (0.8 point against 0.1 point), meat (0.8 point against 0.4 point), oils and fats (0.2 point against -0.1 point) and sugar and confectionary (0.3 point against nil), due to their higher inflation rates during the period under review especially of vegetables (42.1 percent) and sugar (17.2 percent). However, declines were observed in the groups of fish (-0.2 point, against 0.2 point) and milk, cheese and eggs (0.2 point against 0.7 point) with the drop in their inflation rates, thus subduing the rise in headline inflation.
The Change in International Prices of Basic Foodstuffs
-20.0-10.0
0.010.020.030.040.050.060.070.080.090.0
100.0
Dec.2008/Dec.2009 -6.3 4.1 65.2 8.2 93.7 12.3 63.8 10.0 16.6
Nov.2009/Dec.2009 -2.3 -4.1 7.9 4.0 7.8 3.2 3.6 7.0 1.8
Wheat Maize Palm Oil
Meat Sugar Coffee Tea Rice Food Prices
%
Contribution of Main Items of Food to Headline Inflation (Annually) during July/Dec.
-1-0.5
00.5
11.5
22.5
33.5
Bread &Cereals
Meat Fish andSeafood
Milk,Cheeseand Eggs
Oils & Fats Fruit Vegetables Sugar
Percentage Point
2008/20092009/2010
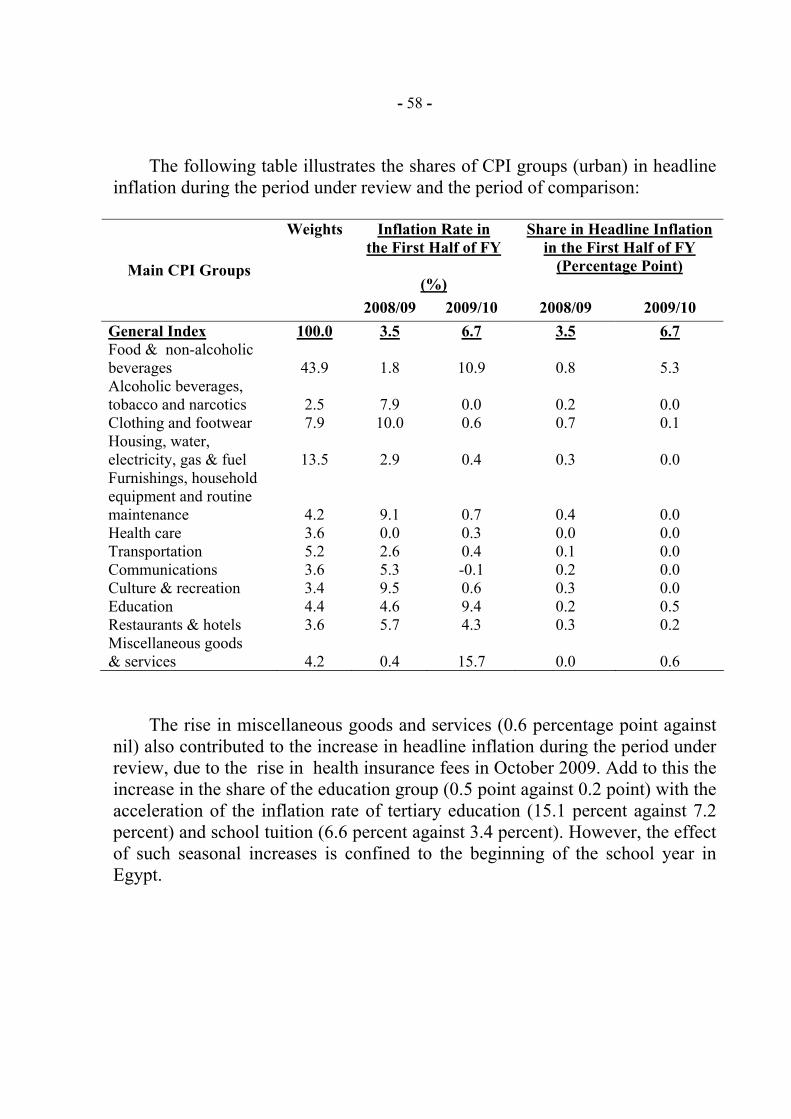
- 58 -
The following table illustrates the shares of CPI groups (urban) in headline inflation during the period under review and the period of comparison:
Inflation Rate in
the First Half of FY
(%)
Share in Headline Inflation in the First Half of FY
(Percentage Point) Main CPI Groups
Weights
2008/09 2009/10 2008/09 2009/10 General Index 100.0 3.5 6.7 3.5 6.7 Food & non-alcoholic beverages 43.9 1.8 10.9 0.8 5.3 Alcoholic beverages, tobacco and narcotics 2.5 7.9 0.0 0.2 0.0 Clothing and footwear 7.9 10.0 0.6 0.7 0.1 Housing, water, electricity, gas & fuel 13.5 2.9 0.4 0.3 0.0 Furnishings, household equipment and routine maintenance 4.2 9.1 0.7 0.4 0.0 Health care 3.6 0.0 0.3 0.0 0.0 Transportation 5.2 2.6 0.4 0.1 0.0 Communications 3.6 5.3 -0.1 0.2 0.0 Culture & recreation 3.4 9.5 0.6 0.3 0.0 Education 4.4 4.6 9.4 0.2 0.5 Restaurants & hotels 3.6 5.7 4.3 0.3 0.2 Miscellaneous goods & services 4.2 0.4 15.7 0.0 0.6
The rise in miscellaneous goods and services (0.6 percentage point against nil) also contributed to the increase in headline inflation during the period under review, due to the rise in health insurance fees in October 2009. Add to this the increase in the share of the education group (0.5 point against 0.2 point) with the acceleration of the inflation rate of tertiary education (15.1 percent against 7.2 percent) and school tuition (6.6 percent against 3.4 percent). However, the effect of such seasonal increases is confined to the beginning of the school year in Egypt.
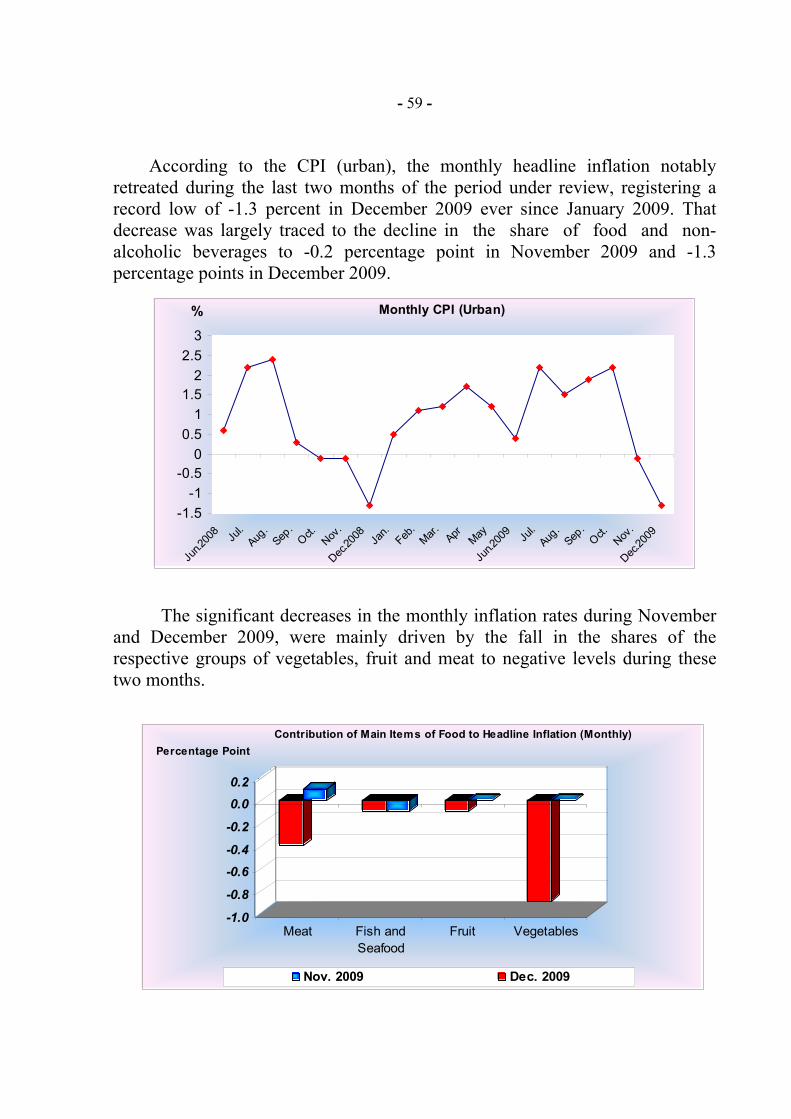
- 59 -
According to the CPI (urban), the monthly headline inflation notably
retreated during the last two months of the period under review, registering a record low of -1.3 percent in December 2009 ever since January 2009. That decrease was largely traced to the decline in the share of food and non-alcoholic beverages to -0.2 percentage point in November 2009 and -1.3 percentage points in December 2009.
The significant decreases in the monthly inflation rates during November
and December 2009, were mainly driven by the fall in the shares of the respective groups of vegetables, fruit and meat to negative levels during these two months.
Monthly CPI (Urban)
-1.5-1
-0.50
0.51
1.52
2.53
Jun.2
008 Ju
l.Aug
.Sep
.Oct.
Nov.
Dec.20
08 Jan.
Feb.
Mar. Apr May
Jun.2
009 Ju
l.Aug
.Sep
.Oct.
Nov.
Dec.20
09
%
-1.0
-0.8
-0.6-0.4
-0.2
0.00.2
Meat Fish andSeafood
Fruit Vegetables
Percentage PointContribution of Main Items of Food to Headline Inflation (Monthly)
Nov. 2009 Dec. 2009
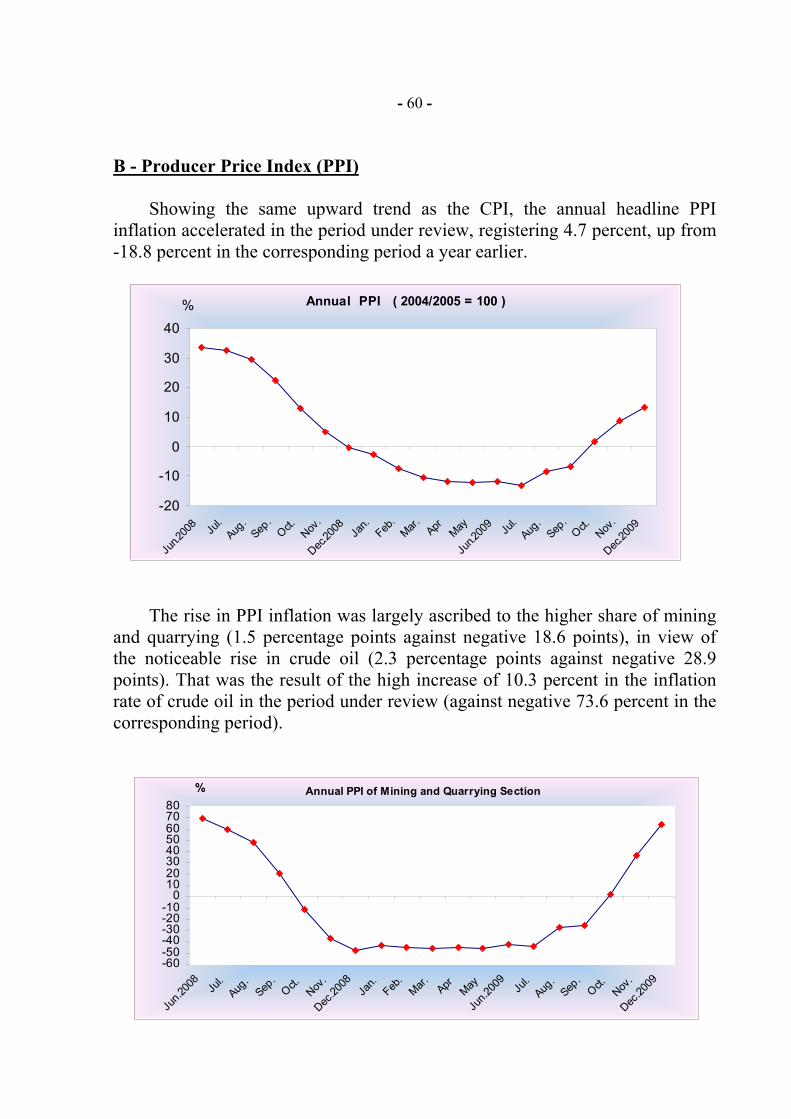
- 60 -
B - Producer Price Index (PPI)
Showing the same upward trend as the CPI, the annual headline PPI inflation accelerated in the period under review, registering 4.7 percent, up from -18.8 percent in the corresponding period a year earlier.
The rise in PPI inflation was largely ascribed to the higher share of mining
and quarrying (1.5 percentage points against negative 18.6 points), in view of the noticeable rise in crude oil (2.3 percentage points against negative 28.9 points). That was the result of the high increase of 10.3 percent in the inflation rate of crude oil in the period under review (against negative 73.6 percent in the corresponding period).
Annual PPI ( 2004/2005 = 100 )
-20
-10
0
10
20
30
40
Jun.2
008 Ju
l.Aug
.Sep
.Oct.
Nov.
Dec.20
08 Jan.
Feb.
Mar. Apr May
Jun.2
009 Ju
l.Aug
.Sep
.Oct.
Nov.
Dec.20
09
%
Annual PPI of Mining and Quarrying Section
-60-50-40-30-20-10
01020304050607080
Jun.2
008
Jul.
Aug.
Sep.
Oct.Nov
.
Dec.20
08Ja
n.Feb
.Mar. Apr May
Jun.2
009
Jul.
Aug.
Sep.
Oct.Nov
.
Dec.20
09
%
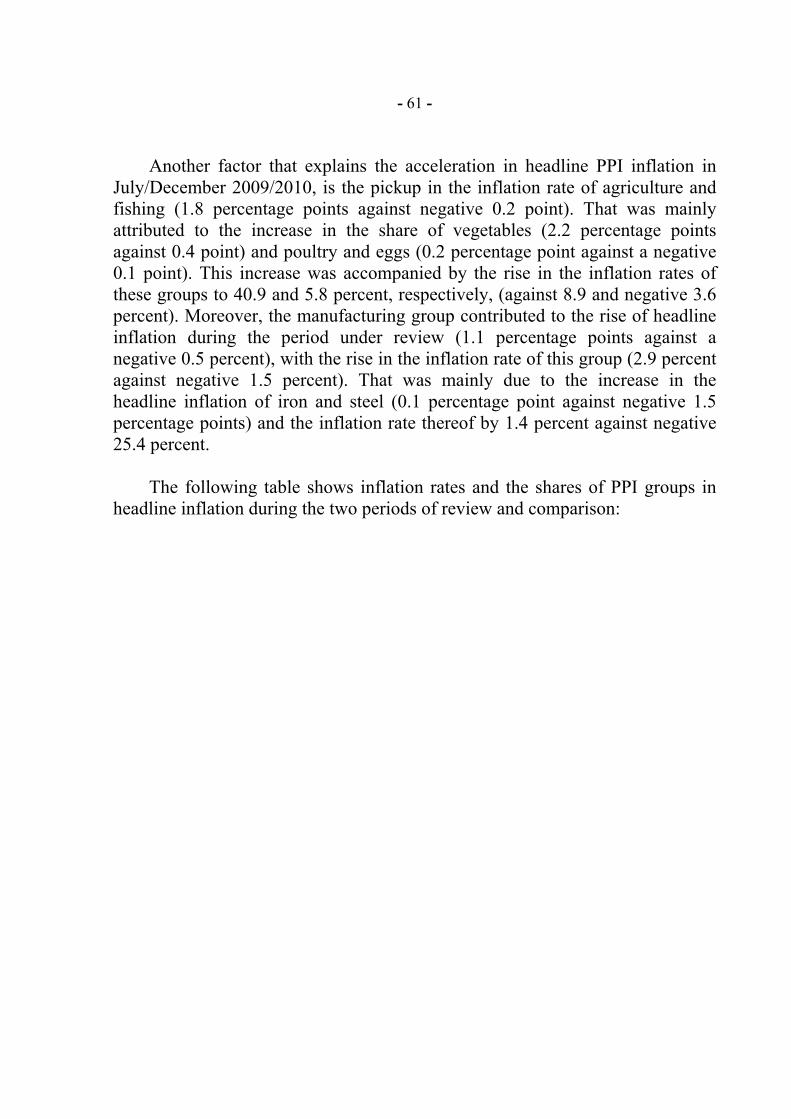
- 61 -
Another factor that explains the acceleration in headline PPI inflation in
July/December 2009/2010, is the pickup in the inflation rate of agriculture and fishing (1.8 percentage points against negative 0.2 point). That was mainly attributed to the increase in the share of vegetables (2.2 percentage points against 0.4 point) and poultry and eggs (0.2 percentage point against a negative 0.1 point). This increase was accompanied by the rise in the inflation rates of these groups to 40.9 and 5.8 percent, respectively, (against 8.9 and negative 3.6 percent). Moreover, the manufacturing group contributed to the rise of headline inflation during the period under review (1.1 percentage points against a negative 0.5 percent), with the rise in the inflation rate of this group (2.9 percent against negative 1.5 percent). That was mainly due to the increase in the headline inflation of iron and steel (0.1 percentage point against negative 1.5 percentage points) and the inflation rate thereof by 1.4 percent against negative 25.4 percent.
The following table shows inflation rates and the shares of PPI groups in headline inflation during the two periods of review and comparison:
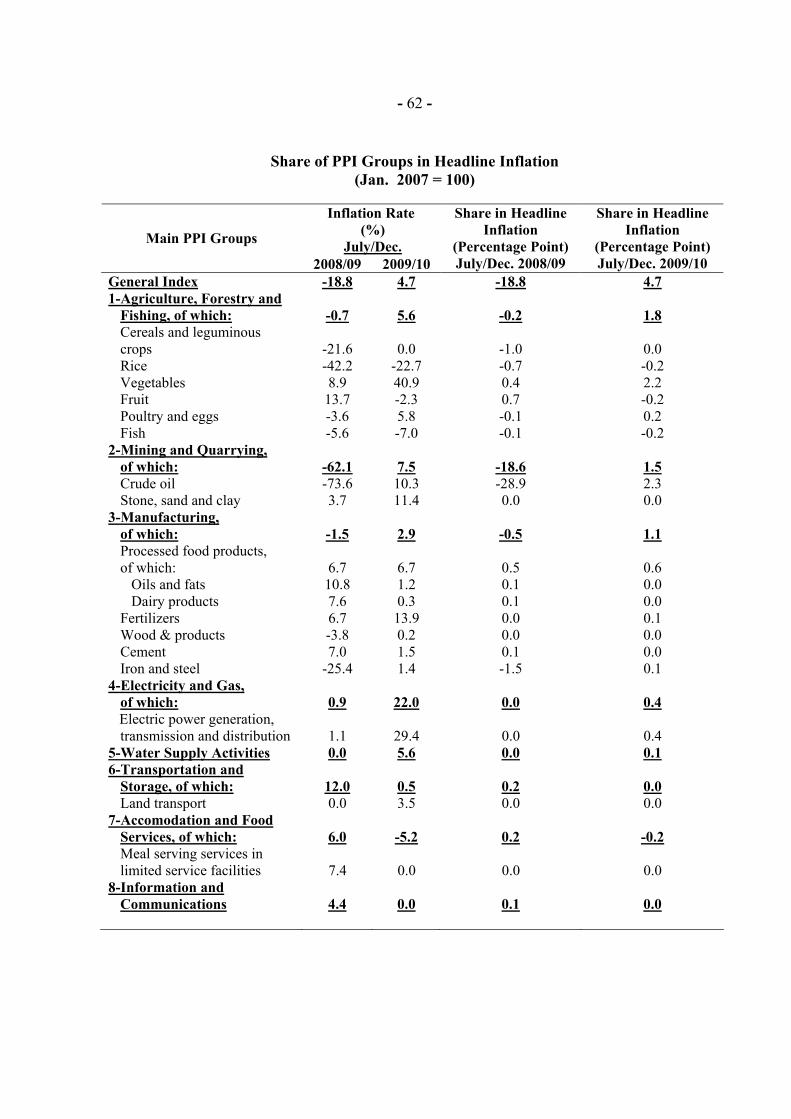
- 62 -
Share of PPI Groups in Headline Inflation
(Jan. 2007 = 100)
Inflation Rate (%)
July/Dec. Main PPI Groups
2008/09 2009/10
Share in Headline Inflation
(Percentage Point) July/Dec. 2008/09
Share in Headline Inflation
(Percentage Point) July/Dec. 2009/10
General Index -18.8 4.7 -18.8 4.7 1-Agriculture, Forestry and
Fishing, of which: -0.7 5.6 -0.2 1.8 Cereals and leguminous crops -21.6 0.0 -1.0 0.0 Rice -42.2 -22.7 -0.7 -0.2 Vegetables 8.9 40.9 0.4 2.2 Fruit 13.7 -2.3 0.7 -0.2 Poultry and eggs -3.6 5.8 -0.1 0.2 Fish -5.6 -7.0 -0.1 -0.2
2-Mining and Quarrying, of which: -62.1 7.5 -18.6 1.5 Crude oil -73.6 10.3 -28.9 2.3 Stone, sand and clay 3.7 11.4 0.0 0.0
3-Manufacturing, of which: -1.5 2.9 -0.5 1.1 Processed food products, of which: 6.7 6.7 0.5 0.6 Oils and fats 10.8 1.2 0.1 0.0 Dairy products 7.6 0.3 0.1 0.0 Fertilizers 6.7 13.9 0.0 0.1 Wood & products -3.8 0.2 0.0 0.0 Cement 7.0 1.5 0.1 0.0 Iron and steel -25.4 1.4 -1.5 0.1
4-Electricity and Gas, of which: 0.9 22.0 0.0 0.4
Electric power generation, transmission and distribution 1.1 29.4 0.0 0.4
5-Water Supply Activities 0.0 5.6 0.0 0.1 6-Transportation and
Storage, of which: 12.0 0.5 0.2 0.0 Land transport 0.0 3.5 0.0 0.0
7-Accomodation and Food Services, of which: 6.0 -5.2 0.2 -0.2 Meal serving services in limited service facilities 7.4 0.0 0.0 0.0
8-Information and Communications
4.4 0.0 0.1 0.0
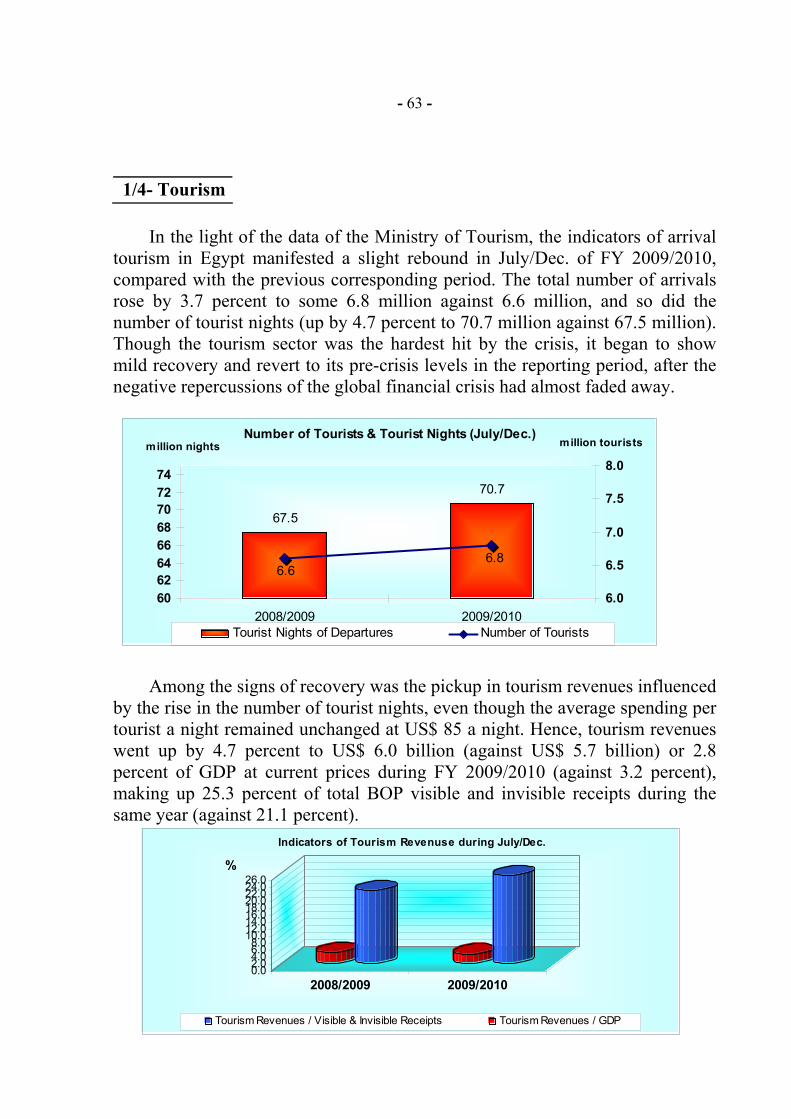
- 63 -
1/4- Tourism
In the light of the data of the Ministry of Tourism, the indicators of arrival tourism in Egypt manifested a slight rebound in July/Dec. of FY 2009/2010, compared with the previous corresponding period. The total number of arrivals rose by 3.7 percent to some 6.8 million against 6.6 million, and so did the number of tourist nights (up by 4.7 percent to 70.7 million against 67.5 million). Though the tourism sector was the hardest hit by the crisis, it began to show mild recovery and revert to its pre-crisis levels in the reporting period, after the negative repercussions of the global financial crisis had almost faded away.
Among the signs of recovery was the pickup in tourism revenues influenced
by the rise in the number of tourist nights, even though the average spending per tourist a night remained unchanged at US$ 85 a night. Hence, tourism revenues went up by 4.7 percent to US$ 6.0 billion (against US$ 5.7 billion) or 2.8 percent of GDP at current prices during FY 2009/2010 (against 3.2 percent), making up 25.3 percent of total BOP visible and invisible receipts during the same year (against 21.1 percent).
Number of Tourists & Tourist Nights (July/Dec.)
67.5
70.7
6.66.8
6062646668707274
2008/2009 2009/20106.0
6.5
7.0
7.5
8.0
Tourist Nights of Departures Number of Tourists
million touristsmillion nights
0.02.04.06.08.010.012.014.016.018.020.022.024.026.0
2008/2009 2009/2010
%
Indicators of Tourism Revenuse during July/Dec.
Tourism Revenues / Visible & Invisible Receipts Tourism Revenues / GDP
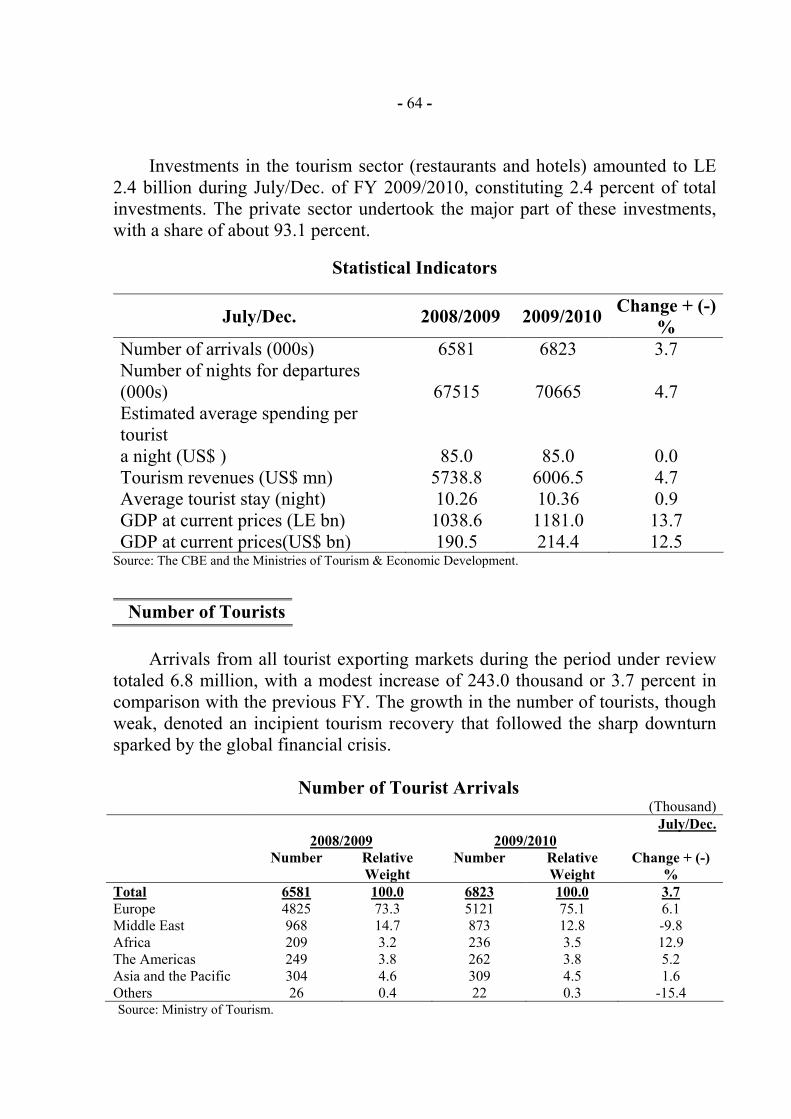
- 64 -
Investments in the tourism sector (restaurants and hotels) amounted to LE
2.4 billion during July/Dec. of FY 2009/2010, constituting 2.4 percent of total investments. The private sector undertook the major part of these investments, with a share of about 93.1 percent.
Statistical Indicators
July/Dec. 2008/2009 2009/2010 Change + (-)%
Number of arrivals (000s) 6581 6823 3.7 Number of nights for departures (000s) 67515 70665 4.7 Estimated average spending per tourist a night (US$ ) 85.0 85.0 0.0 Tourism revenues (US$ mn) 5738.8 6006.5 4.7 Average tourist stay (night) 10.26 10.36 0.9 GDP at current prices (LE bn) 1038.6 1181.0 13.7 GDP at current prices(US$ bn) 190.5 214.4 12.5
Source: The CBE and the Ministries of Tourism & Economic Development.
Number of Tourists
Arrivals from all tourist exporting markets during the period under review totaled 6.8 million, with a modest increase of 243.0 thousand or 3.7 percent in comparison with the previous FY. The growth in the number of tourists, though weak, denoted an incipient tourism recovery that followed the sharp downturn sparked by the global financial crisis.
Number of Tourist Arrivals
(Thousand) July/Dec.
2008/2009 2009/2010
Number Relative Weight
Number Relative Weight
Change + (-) %
Total 6581 100.0 6823 100.0 3.7 Europe 4825 73.3 5121 75.1 6.1 Middle East 968 14.7 873 12.8 -9.8 Africa 209 3.2 236 3.5 12.9 The Americas 249 3.8 262 3.8 5.2 Asia and the Pacific 304 4.6 309 4.5 1.6 Others 26 0.4 22 0.3 -15.4
Source: Ministry of Tourism.
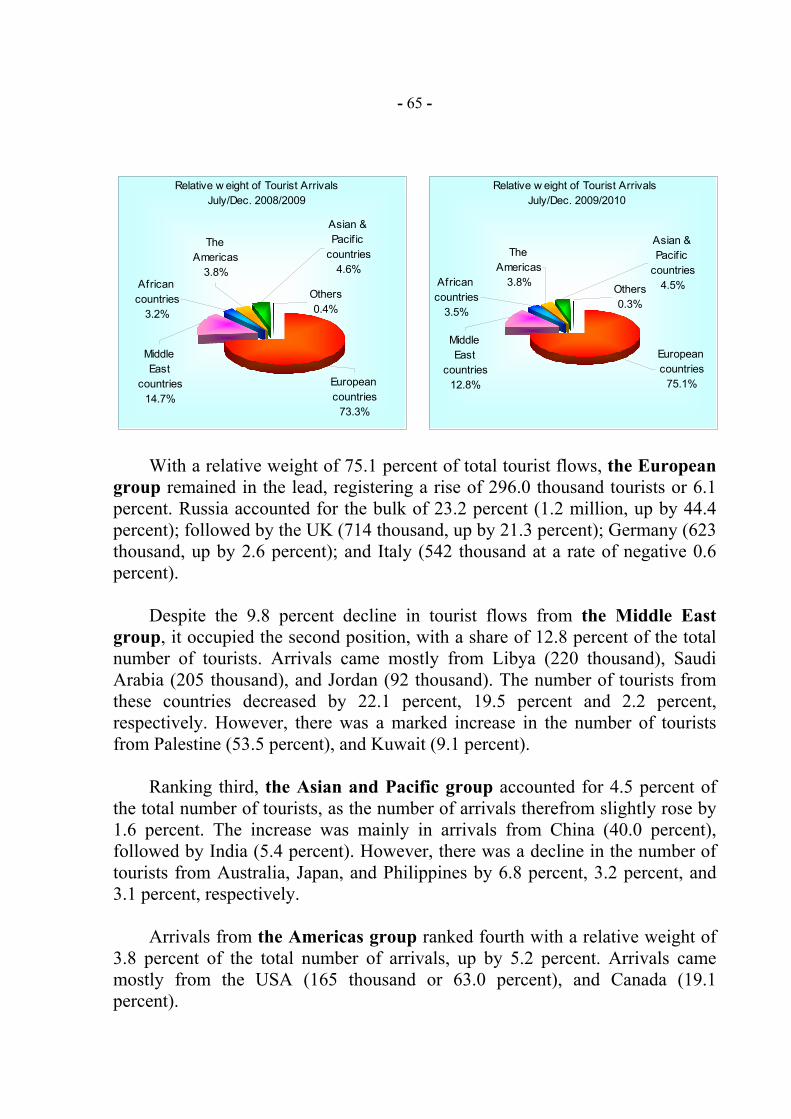
- 65 -
With a relative weight of 75.1 percent of total tourist flows, the European group remained in the lead, registering a rise of 296.0 thousand tourists or 6.1 percent. Russia accounted for the bulk of 23.2 percent (1.2 million, up by 44.4 percent); followed by the UK (714 thousand, up by 21.3 percent); Germany (623 thousand, up by 2.6 percent); and Italy (542 thousand at a rate of negative 0.6 percent).
Despite the 9.8 percent decline in tourist flows from the Middle East
group, it occupied the second position, with a share of 12.8 percent of the total number of tourists. Arrivals came mostly from Libya (220 thousand), Saudi Arabia (205 thousand), and Jordan (92 thousand). The number of tourists from these countries decreased by 22.1 percent, 19.5 percent and 2.2 percent, respectively. However, there was a marked increase in the number of tourists from Palestine (53.5 percent), and Kuwait (9.1 percent).
Ranking third, the Asian and Pacific group accounted for 4.5 percent of
the total number of tourists, as the number of arrivals therefrom slightly rose by 1.6 percent. The increase was mainly in arrivals from China (40.0 percent), followed by India (5.4 percent). However, there was a decline in the number of tourists from Australia, Japan, and Philippines by 6.8 percent, 3.2 percent, and 3.1 percent, respectively.
Arrivals from the Americas group ranked fourth with a relative weight of
3.8 percent of the total number of arrivals, up by 5.2 percent. Arrivals came mostly from the USA (165 thousand or 63.0 percent), and Canada (19.1 percent).
Relative w eight of Tourist ArrivalsJuly/Dec. 2008/2009
European countries
73.3%
Others0.4%
Middle East
countries14.7%
African countries
3.2%
The Americas
3.8%
Asian & Pacif ic
countries4.6%
Relative w eight of Tourist Arrivals July/Dec. 2009/2010
Asian & Pacif ic
countries4.5%
The Americas
3.8%African countries
3.5%
Middle East
countries12.8%
Others0.3%
European countries
75.1%
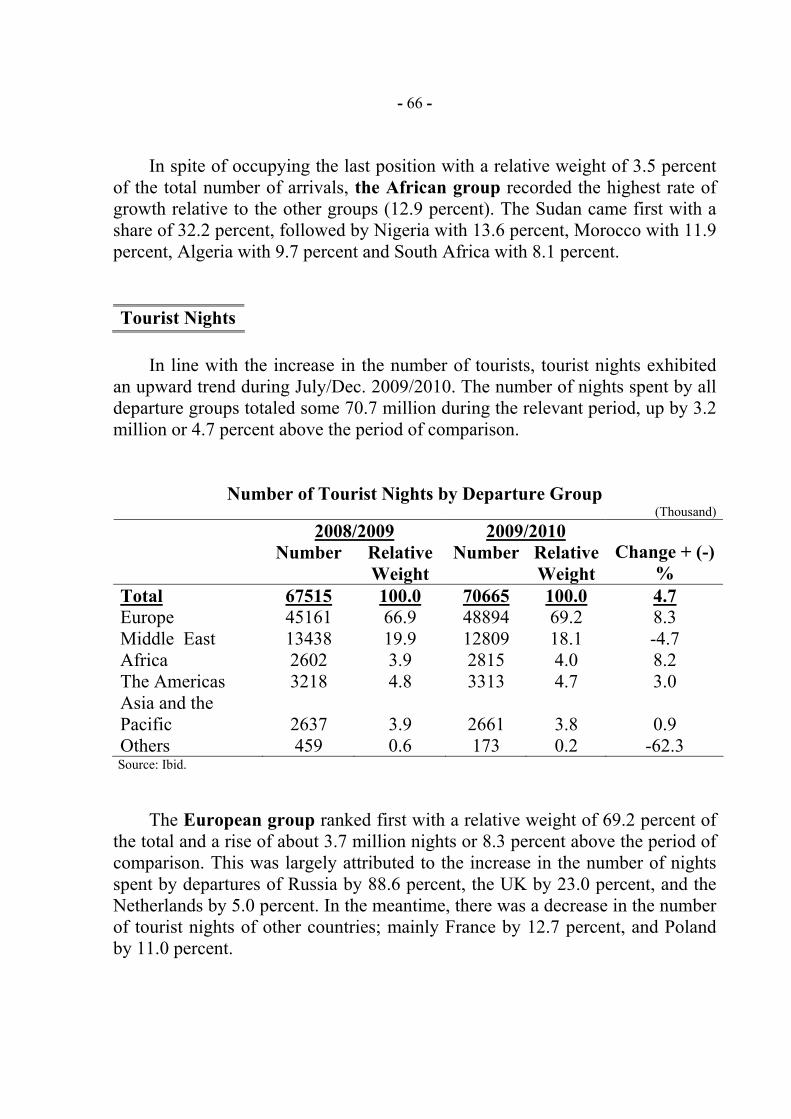
- 66 -
In spite of occupying the last position with a relative weight of 3.5 percent
of the total number of arrivals, the African group recorded the highest rate of growth relative to the other groups (12.9 percent). The Sudan came first with a share of 32.2 percent, followed by Nigeria with 13.6 percent, Morocco with 11.9 percent, Algeria with 9.7 percent and South Africa with 8.1 percent.
Tourist Nights
In line with the increase in the number of tourists, tourist nights exhibited an upward trend during July/Dec. 2009/2010. The number of nights spent by all departure groups totaled some 70.7 million during the relevant period, up by 3.2 million or 4.7 percent above the period of comparison.
Number of Tourist Nights by Departure Group (Thousand)
2008/2009 2009/2010 Number Relative
Weight Number Relative
Weight Change + (-)
% Total 67515 100.0 70665 100.0 4.7 Europe 45161 66.9 48894 69.2 8.3 Middle East 13438 19.9 12809 18.1 -4.7 Africa 2602 3.9 2815 4.0 8.2 The Americas 3218 4.8 3313 4.7 3.0 Asia and the Pacific 2637 3.9 2661 3.8 0.9 Others 459 0.6 173 0.2 -62.3
Source: Ibid.
The European group ranked first with a relative weight of 69.2 percent of
the total and a rise of about 3.7 million nights or 8.3 percent above the period of comparison. This was largely attributed to the increase in the number of nights spent by departures of Russia by 88.6 percent, the UK by 23.0 percent, and the Netherlands by 5.0 percent. In the meantime, there was a decrease in the number of tourist nights of other countries; mainly France by 12.7 percent, and Poland by 11.0 percent.
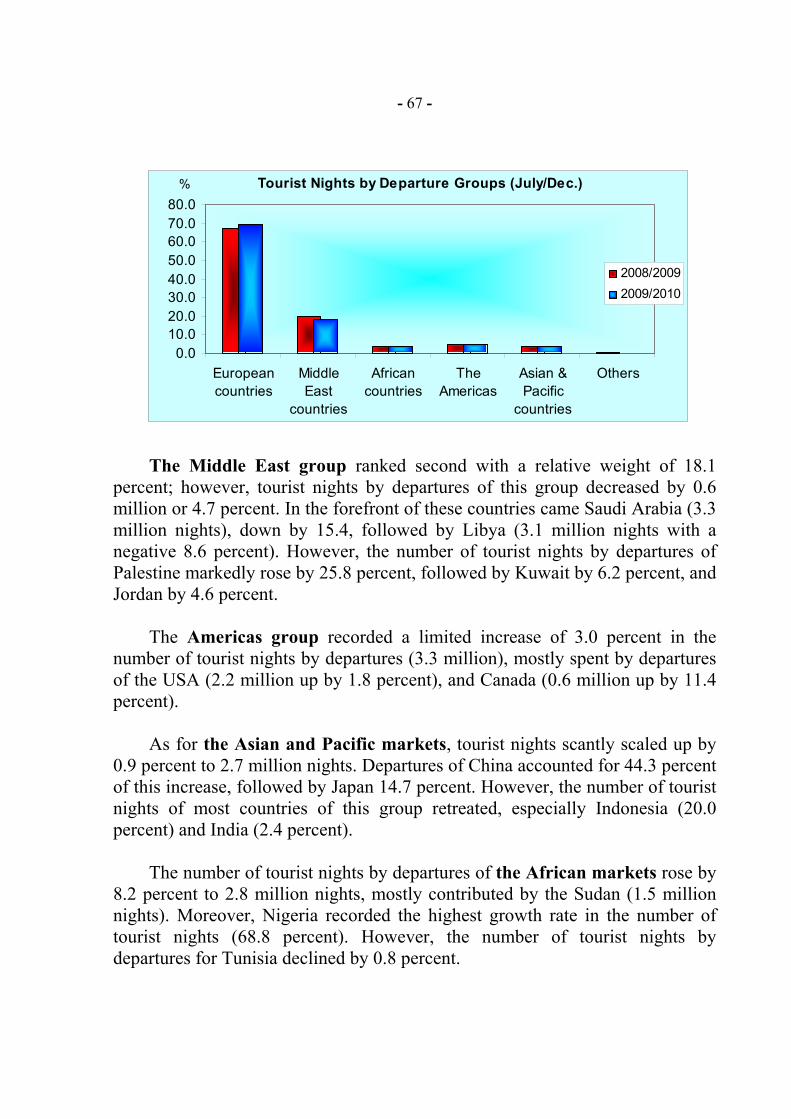
- 67 -
The Middle East group ranked second with a relative weight of 18.1 percent; however, tourist nights by departures of this group decreased by 0.6 million or 4.7 percent. In the forefront of these countries came Saudi Arabia (3.3 million nights), down by 15.4, followed by Libya (3.1 million nights with a negative 8.6 percent). However, the number of tourist nights by departures of Palestine markedly rose by 25.8 percent, followed by Kuwait by 6.2 percent, and Jordan by 4.6 percent.
The Americas group recorded a limited increase of 3.0 percent in the number of tourist nights by departures (3.3 million), mostly spent by departures of the USA (2.2 million up by 1.8 percent), and Canada (0.6 million up by 11.4 percent).
As for the Asian and Pacific markets, tourist nights scantly scaled up by 0.9 percent to 2.7 million nights. Departures of China accounted for 44.3 percent of this increase, followed by Japan 14.7 percent. However, the number of tourist nights of most countries of this group retreated, especially Indonesia (20.0 percent) and India (2.4 percent).
The number of tourist nights by departures of the African markets rose by 8.2 percent to 2.8 million nights, mostly contributed by the Sudan (1.5 million nights). Moreover, Nigeria recorded the highest growth rate in the number of tourist nights (68.8 percent). However, the number of tourist nights by departures for Tunisia declined by 0.8 percent.
Tourist Nights by Departure Groups (July/Dec.)
0.010.020.030.040.050.060.070.080.0
Europeancountries
MiddleEast
countries
Africancountries
TheAmericas
Asian &Pacific
countries
Others
2008/20092009/2010
%
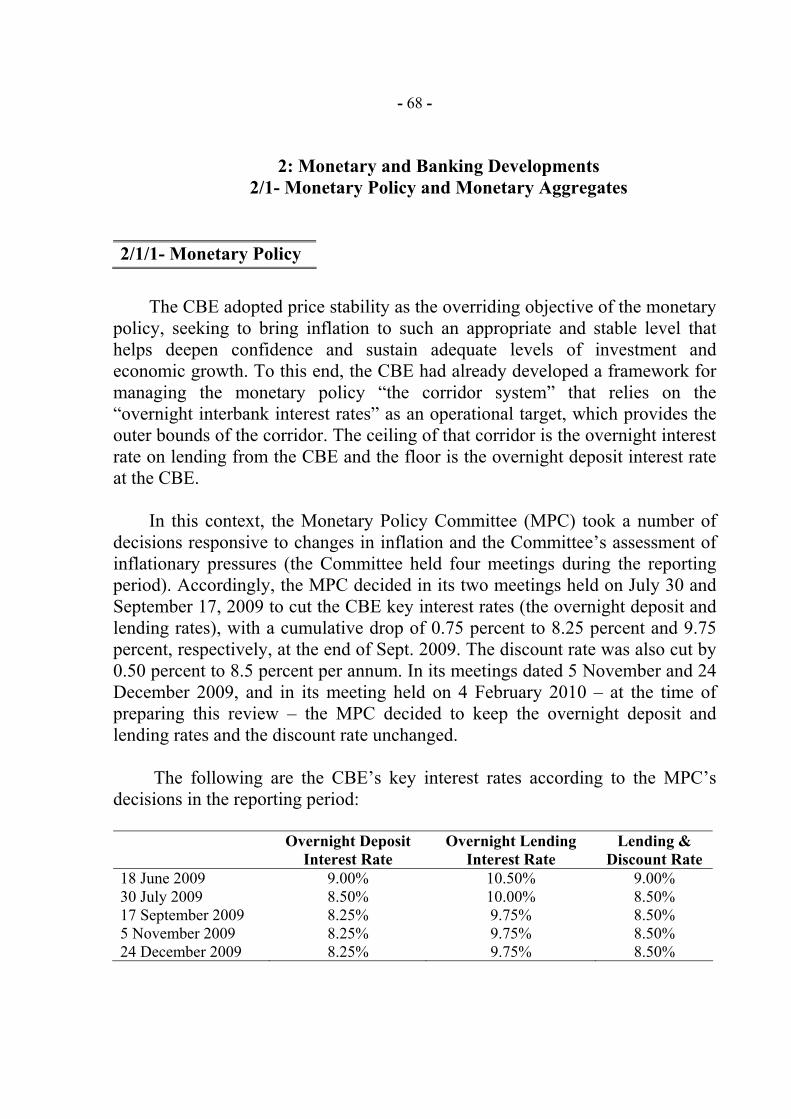
- 68 -
2: Monetary and Banking Developments 2/1- Monetary Policy and Monetary Aggregates
2/1/1- Monetary Policy
The CBE adopted price stability as the overriding objective of the monetary policy, seeking to bring inflation to such an appropriate and stable level that helps deepen confidence and sustain adequate levels of investment and economic growth. To this end, the CBE had already developed a framework for managing the monetary policy “the corridor system” that relies on the “overnight interbank interest rates” as an operational target, which provides the outer bounds of the corridor. The ceiling of that corridor is the overnight interest rate on lending from the CBE and the floor is the overnight deposit interest rate at the CBE.
In this context, the Monetary Policy Committee (MPC) took a number of
decisions responsive to changes in inflation and the Committee’s assessment of inflationary pressures (the Committee held four meetings during the reporting period). Accordingly, the MPC decided in its two meetings held on July 30 and September 17, 2009 to cut the CBE key interest rates (the overnight deposit and lending rates), with a cumulative drop of 0.75 percent to 8.25 percent and 9.75 percent, respectively, at the end of Sept. 2009. The discount rate was also cut by 0.50 percent to 8.5 percent per annum. In its meetings dated 5 November and 24 December 2009, and in its meeting held on 4 February 2010 – at the time of preparing this review – the MPC decided to keep the overnight deposit and lending rates and the discount rate unchanged.
The following are the CBE’s key interest rates according to the MPC’s decisions in the reporting period:
Overnight Deposit
Interest Rate Overnight Lending
Interest Rate Lending &
Discount Rate 18 June 2009 9.00% 10.50% 9.00% 30 July 2009 8.50% 10.00% 8.50% 17 September 2009 8.25% 9.75% 8.50% 5 November 2009 8.25% 9.75% 8.50% 24 December 2009 8.25% 9.75% 8.50%
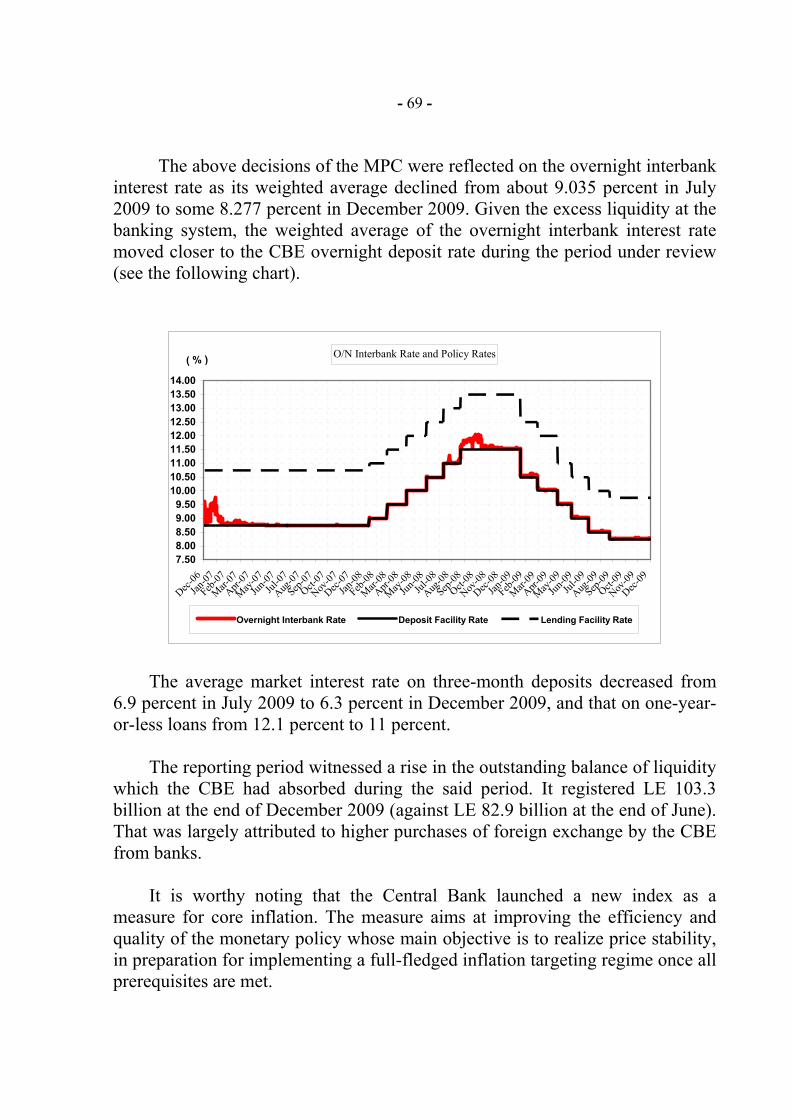
- 69 -
The above decisions of the MPC were reflected on the overnight interbank
interest rate as its weighted average declined from about 9.035 percent in July 2009 to some 8.277 percent in December 2009. Given the excess liquidity at the banking system, the weighted average of the overnight interbank interest rate moved closer to the CBE overnight deposit rate during the period under review (see the following chart).
O/N Interbank Rate and Policy Rates
7.508.008.509.009.50
10.0010.5011.0011.5012.0012.5013.0013.5014.00
Dec-06Jan
-07
Feb-07
Mar-07
Apr-07
May-07Jun
-07Jul
-07
Aug-07
Sep-07Oct-
07
Nov-07
Dec-07Jan
-08
Feb-08
Mar-08
Apr-08
May-08Jun
-08Jul
-08
Aug-08
Sep-08Oct-
08
Nov-08
Dec-08Jan
-09
Feb-09
Mar-09
Apr-09
May-09Jun
-09Jul
-09
Aug-09
Sep-09Oct-
09
Nov-09
Dec-09
( % )
Overnight Interbank Rate Deposit Facility Rate Lending Facility Rate
The average market interest rate on three-month deposits decreased from 6.9 percent in July 2009 to 6.3 percent in December 2009, and that on one-year-or-less loans from 12.1 percent to 11 percent.
The reporting period witnessed a rise in the outstanding balance of liquidity
which the CBE had absorbed during the said period. It registered LE 103.3 billion at the end of December 2009 (against LE 82.9 billion at the end of June). That was largely attributed to higher purchases of foreign exchange by the CBE from banks.
It is worthy noting that the Central Bank launched a new index as a measure for core inflation. The measure aims at improving the efficiency and quality of the monetary policy whose main objective is to realize price stability, in preparation for implementing a full-fledged inflation targeting regime once all prerequisites are met.
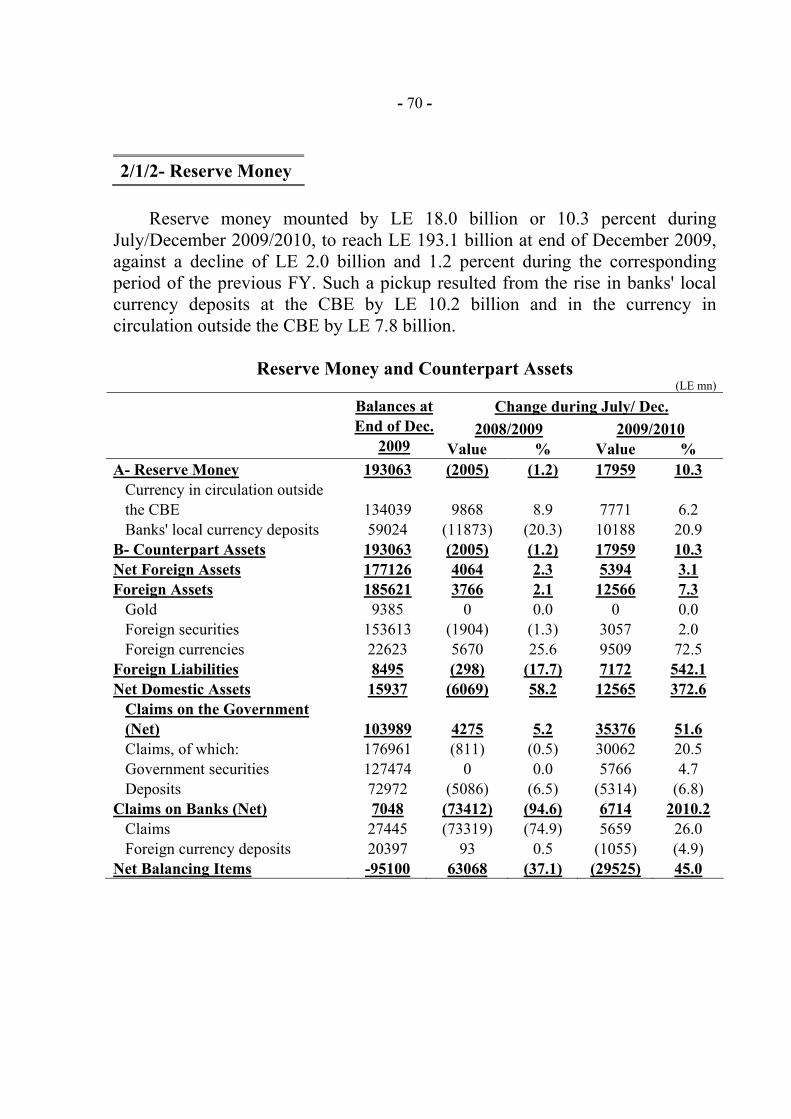
- 70 -
2/1/2- Reserve Money
Reserve money mounted by LE 18.0 billion or 10.3 percent during
July/December 2009/2010, to reach LE 193.1 billion at end of December 2009, against a decline of LE 2.0 billion and 1.2 percent during the corresponding period of the previous FY. Such a pickup resulted from the rise in banks' local currency deposits at the CBE by LE 10.2 billion and in the currency in circulation outside the CBE by LE 7.8 billion.
Reserve Money and Counterpart Assets (LE mn)
Change during July/ Dec. 2008/2009 2009/2010
Balances at End of Dec.
2009 Value % Value % A- Reserve Money 193063 (2005) (1.2) 17959 10.3
Currency in circulation outside the CBE 134039 9868 8.9 7771 6.2 Banks' local currency deposits 59024 (11873) (20.3) 10188 20.9
B- Counterpart Assets 193063 (2005) (1.2) 17959 10.3 Net Foreign Assets 177126 4064 2.3 5394 3.1 Foreign Assets 185621 3766 2.1 12566 7.3
Gold 9385 0 0.0 0 0.0 Foreign securities 153613 (1904) (1.3) 3057 2.0 Foreign currencies 22623 5670 25.6 9509 72.5
Foreign Liabilities 8495 (298) (17.7) 7172 542.1 Net Domestic Assets 15937 (6069) 58.2 12565 372.6
Claims on the Government (Net) 103989 4275 5.2 35376 51.6 Claims, of which: 176961 (811) (0.5) 30062 20.5 Government securities 127474 0 0.0 5766 4.7 Deposits 72972 (5086) (6.5) (5314) (6.8)
Claims on Banks (Net) 7048 (73412) (94.6) 6714 2010.2 Claims 27445 (73319) (74.9) 5659 26.0 Foreign currency deposits 20397 93 0.5 (1055) (4.9)
Net Balancing Items -95100 63068 (37.1) (29525) 45.0
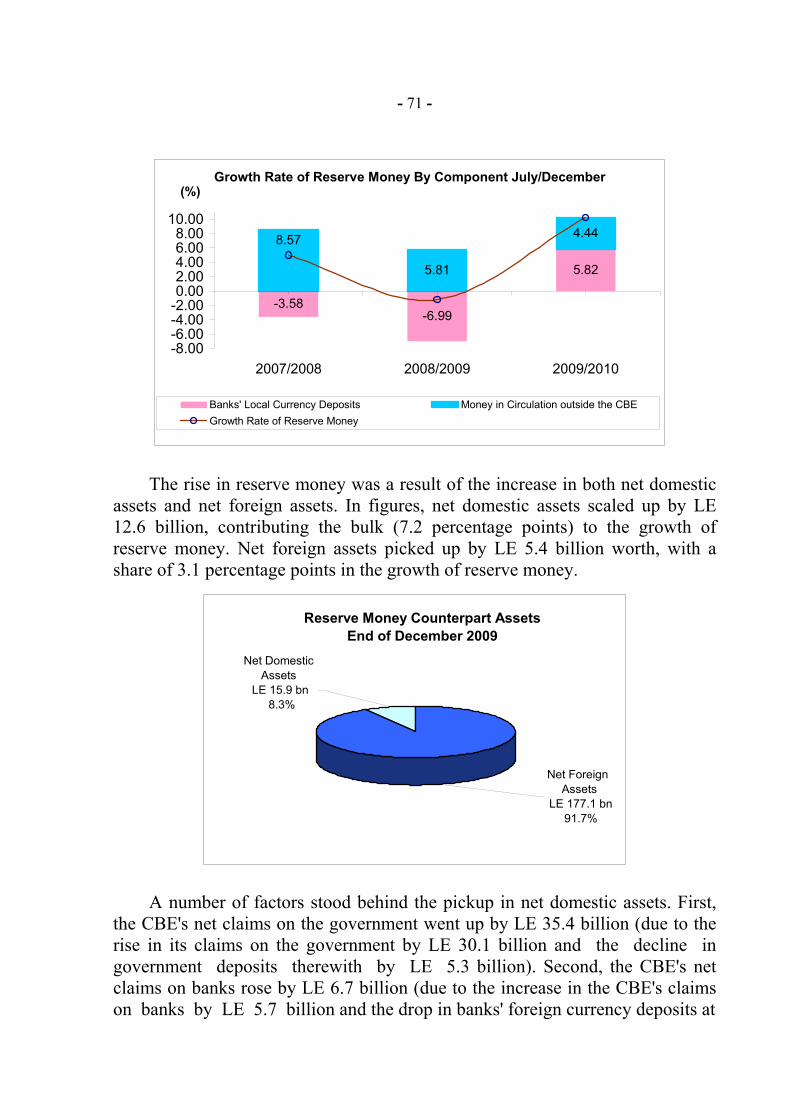
- 71 -
Growth Rate of Reserve Money By Component July/December
-3.58-6.99
5.825.81
4.448.57
-8.00-6.00-4.00-2.000.002.004.006.008.00
10.00
2007/2008 2008/2009 2009/2010
(%)
Banks' Local Currency Deposits Money in Circulation outside the CBEGrowth Rate of Reserve Money
The rise in reserve money was a result of the increase in both net domestic
assets and net foreign assets. In figures, net domestic assets scaled up by LE 12.6 billion, contributing the bulk (7.2 percentage points) to the growth of reserve money. Net foreign assets picked up by LE 5.4 billion worth, with a share of 3.1 percentage points in the growth of reserve money.
Reserve Money Counterpart AssetsEnd of December 2009
Net Domestic Assets
LE 15.9 bn 8.3%
Net Foreign Assets
LE 177.1 bn 91.7%
A number of factors stood behind the pickup in net domestic assets. First, the CBE's net claims on the government went up by LE 35.4 billion (due to the rise in its claims on the government by LE 30.1 billion and the decline in government deposits therewith by LE 5.3 billion). Second, the CBE's net claims on banks rose by LE 6.7 billion (due to the increase in the CBE's claims on banks by LE 5.7 billion and the drop in banks' foreign currency deposits at
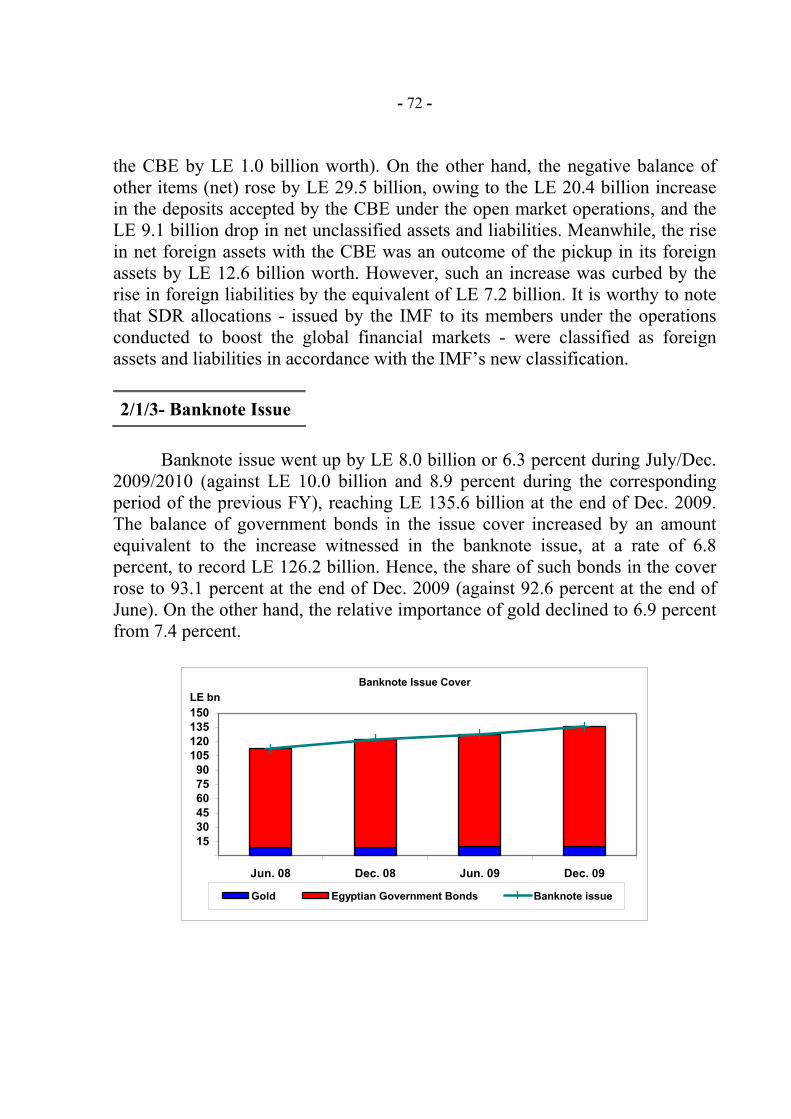
- 72 -
the CBE by LE 1.0 billion worth). On the other hand, the negative balance of other items (net) rose by LE 29.5 billion, owing to the LE 20.4 billion increase in the deposits accepted by the CBE under the open market operations, and the LE 9.1 billion drop in net unclassified assets and liabilities. Meanwhile, the rise in net foreign assets with the CBE was an outcome of the pickup in its foreign assets by LE 12.6 billion worth. However, such an increase was curbed by the rise in foreign liabilities by the equivalent of LE 7.2 billion. It is worthy to note that SDR allocations - issued by the IMF to its members under the operations conducted to boost the global financial markets - were classified as foreign assets and liabilities in accordance with the IMF’s new classification. 2/1/3- Banknote Issue
Banknote issue went up by LE 8.0 billion or 6.3 percent during July/Dec.
2009/2010 (against LE 10.0 billion and 8.9 percent during the corresponding period of the previous FY), reaching LE 135.6 billion at the end of Dec. 2009. The balance of government bonds in the issue cover increased by an amount equivalent to the increase witnessed in the banknote issue, at a rate of 6.8 percent, to record LE 126.2 billion. Hence, the share of such bonds in the cover rose to 93.1 percent at the end of Dec. 2009 (against 92.6 percent at the end of June). On the other hand, the relative importance of gold declined to 6.9 percent from 7.4 percent.
Banknote Issue Cover
153045607590
105120135150
Jun. 08 Dec. 08 Jun. 09 Dec. 09
LE bn
Gold Egyptian Government Bonds Banknote issue
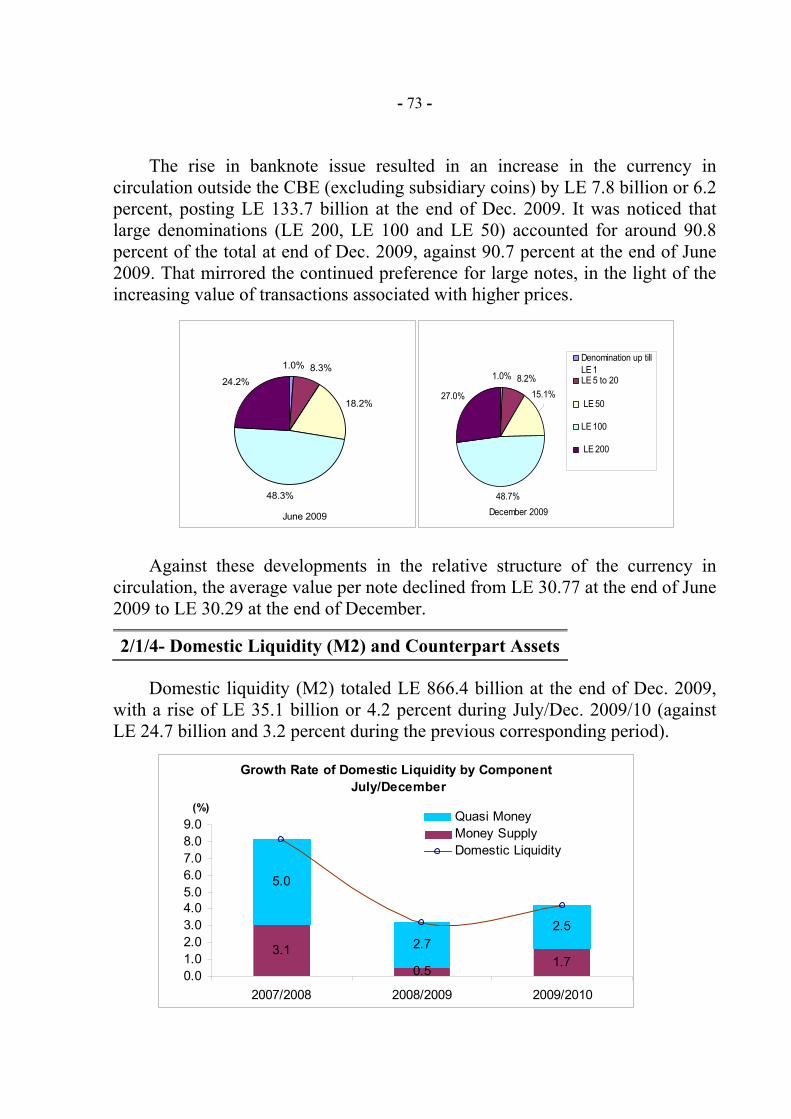
- 73 -
The rise in banknote issue resulted in an increase in the currency in
circulation outside the CBE (excluding subsidiary coins) by LE 7.8 billion or 6.2 percent, posting LE 133.7 billion at the end of Dec. 2009. It was noticed that large denominations (LE 200, LE 100 and LE 50) accounted for around 90.8 percent of the total at end of Dec. 2009, against 90.7 percent at the end of June 2009. That mirrored the continued preference for large notes, in the light of the increasing value of transactions associated with higher prices.
Against these developments in the relative structure of the currency in
circulation, the average value per note declined from LE 30.77 at the end of June 2009 to LE 30.29 at the end of December.
2/1/4- Domestic Liquidity (M2) and Counterpart Assets
Domestic liquidity (M2) totaled LE 866.4 billion at the end of Dec. 2009,
with a rise of LE 35.1 billion or 4.2 percent during July/Dec. 2009/10 (against LE 24.7 billion and 3.2 percent during the previous corresponding period).
Growth Rate of Domestic Liquidity by Component July/December
3.10.5
1.7
5.0
2.72.5
0.01.02.03.04.05.06.07.08.09.0
2007/2008 2008/2009 2009/2010
(%)Quasi MoneyMoney SupplyDomestic Liquidity
June 2009
1.0% 8.3%
18.2%
48.3%
24.2%
December 2009
1.0% 8.2%
48.7%
27.0% 15.1%
Denomination up tillLE 1LE 5 to 20
LE 50
LE 100
LE 200
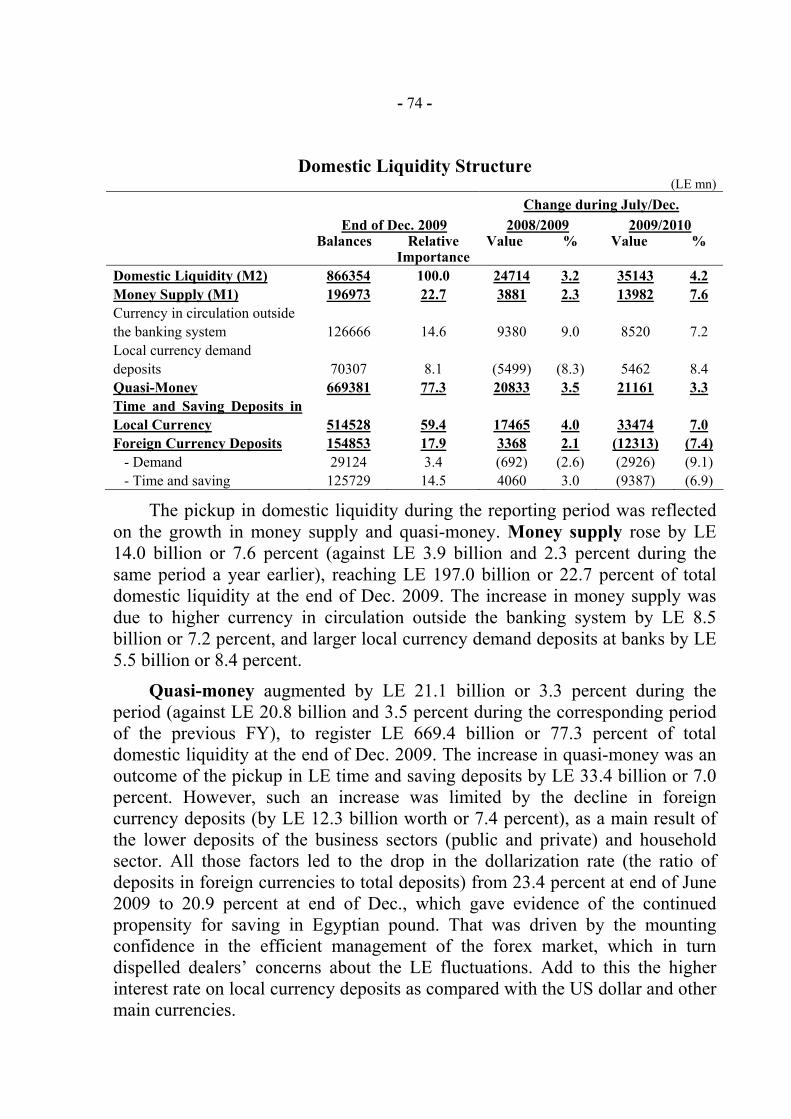
- 74 -
Domestic Liquidity Structure (LE mn)
Change during July/Dec. End of Dec. 2009 2008/2009 2009/2010 Balances Relative
Importance Value % Value %
Domestic Liquidity (M2) 866354 100.0 24714 3.2 35143 4.2 Money Supply (M1) 196973 22.7 3881 2.3 13982 7.6 Currency in circulation outside the banking system 126666 14.6 9380 9.0 8520 7.2 Local currency demand deposits 70307 8.1 (5499) (8.3) 5462 8.4 Quasi-Money 669381 77.3 20833 3.5 21161 3.3 Time and Saving Deposits in Local Currency 514528 59.4 17465 4.0 33474 7.0 Foreign Currency Deposits 154853 17.9 3368 2.1 (12313) (7.4) - Demand 29124 3.4 (692) (2.6) (2926) (9.1) - Time and saving 125729 14.5 4060 3.0 (9387) (6.9)
The pickup in domestic liquidity during the reporting period was reflected on the growth in money supply and quasi-money. Money supply rose by LE 14.0 billion or 7.6 percent (against LE 3.9 billion and 2.3 percent during the same period a year earlier), reaching LE 197.0 billion or 22.7 percent of total domestic liquidity at the end of Dec. 2009. The increase in money supply was due to higher currency in circulation outside the banking system by LE 8.5 billion or 7.2 percent, and larger local currency demand deposits at banks by LE 5.5 billion or 8.4 percent.
Quasi-money augmented by LE 21.1 billion or 3.3 percent during the period (against LE 20.8 billion and 3.5 percent during the corresponding period of the previous FY), to register LE 669.4 billion or 77.3 percent of total domestic liquidity at the end of Dec. 2009. The increase in quasi-money was an outcome of the pickup in LE time and saving deposits by LE 33.4 billion or 7.0 percent. However, such an increase was limited by the decline in foreign currency deposits (by LE 12.3 billion worth or 7.4 percent), as a main result of the lower deposits of the business sectors (public and private) and household sector. All those factors led to the drop in the dollarization rate (the ratio of deposits in foreign currencies to total deposits) from 23.4 percent at end of June 2009 to 20.9 percent at end of Dec., which gave evidence of the continued propensity for saving in Egyptian pound. That was driven by the mounting confidence in the efficient management of the forex market, which in turn dispelled dealers’ concerns about the LE fluctuations. Add to this the higher interest rate on local currency deposits as compared with the US dollar and other main currencies.
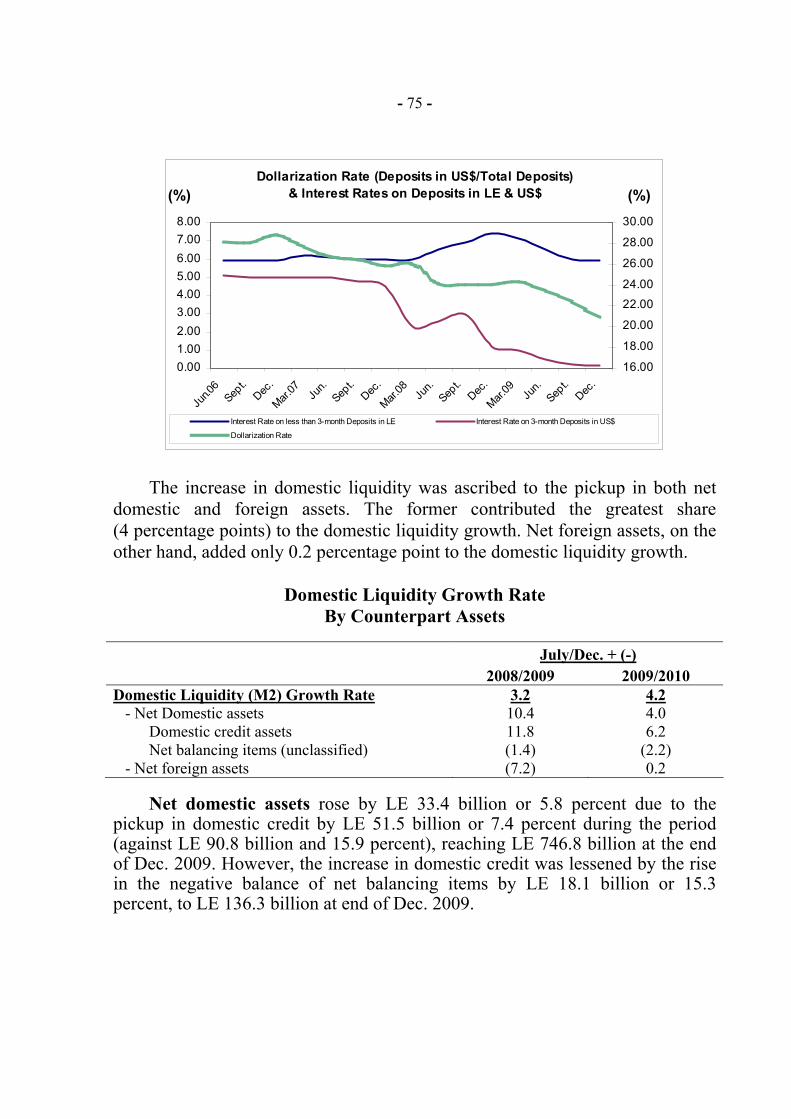
- 75 -
Dollarization Rate (Deposits in US$/Total Deposits)
& Interest Rates on Deposits in LE & US$
0.001.002.003.004.005.006.007.008.00
Jun.0
6Sep
t.Dec
.
Mar.07 Ju
n. Sep
t.Dec
.
Mar.08 Ju
n.Sep
t.Dec
.
Mar.09 Ju
n.Sep
t.Dec
.
(%)
16.00
18.00
20.00
22.00
24.00
26.00
28.00
30.00
(%)
Interest Rate on less than 3-month Deposits in LE Interest Rate on 3-month Deposits in US$
Dollarization Rate
The increase in domestic liquidity was ascribed to the pickup in both net domestic and foreign assets. The former contributed the greatest share (4 percentage points) to the domestic liquidity growth. Net foreign assets, on the other hand, added only 0.2 percentage point to the domestic liquidity growth.
Domestic Liquidity Growth Rate
By Counterpart Assets
July/Dec. + (-) 2008/2009 2009/2010 Domestic Liquidity (M2) Growth Rate 3.2 4.2
- Net Domestic assets 10.4 4.0 Domestic credit assets 11.8 6.2
Net balancing items (unclassified) (1.4) (2.2) - Net foreign assets (7.2) 0.2
Net domestic assets rose by LE 33.4 billion or 5.8 percent due to the pickup in domestic credit by LE 51.5 billion or 7.4 percent during the period (against LE 90.8 billion and 15.9 percent), reaching LE 746.8 billion at the end of Dec. 2009. However, the increase in domestic credit was lessened by the rise in the negative balance of net balancing items by LE 18.1 billion or 15.3 percent, to LE 136.3 billion at end of Dec. 2009.
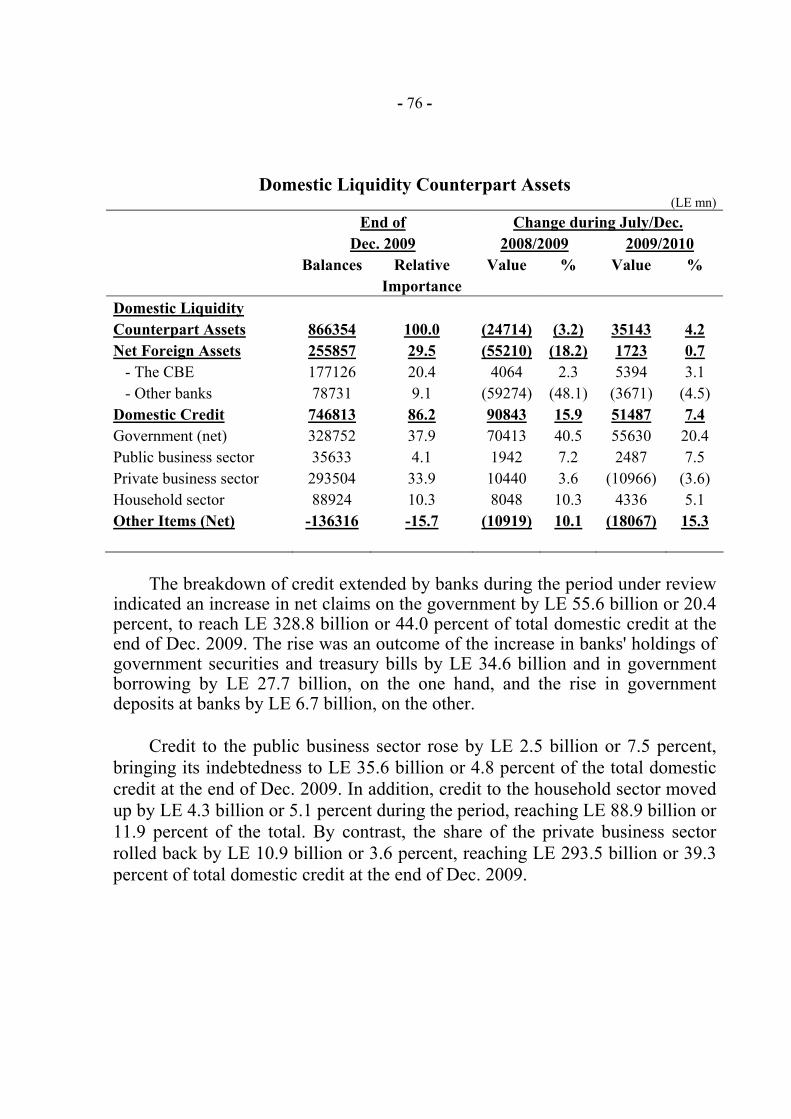
- 76 -
Domestic Liquidity Counterpart Assets (LE mn)
End of Change during July/Dec. Dec. 2009 2008/2009 2009/2010 Balances Relative
Importance Value % Value %
Domestic Liquidity Counterpart Assets 866354 100.0 (24714) (3.2) 35143 4.2 Net Foreign Assets 255857 29.5 (55210) (18.2) 1723 0.7
- The CBE 177126 20.4 4064 2.3 5394 3.1 - Other banks 78731 9.1 (59274) (48.1) (3671) (4.5)
Domestic Credit 746813 86.2 90843 15.9 51487 7.4 Government (net) 328752 37.9 70413 40.5 55630 20.4 Public business sector 35633 4.1 1942 7.2 2487 7.5 Private business sector 293504 33.9 10440 3.6 (10966) (3.6) Household sector 88924 10.3 8048 10.3 4336 5.1 Other Items (Net) -136316 -15.7 (10919) 10.1 (18067) 15.3
The breakdown of credit extended by banks during the period under review indicated an increase in net claims on the government by LE 55.6 billion or 20.4 percent, to reach LE 328.8 billion or 44.0 percent of total domestic credit at the end of Dec. 2009. The rise was an outcome of the increase in banks' holdings of government securities and treasury bills by LE 34.6 billion and in government borrowing by LE 27.7 billion, on the one hand, and the rise in government deposits at banks by LE 6.7 billion, on the other.
Credit to the public business sector rose by LE 2.5 billion or 7.5 percent, bringing its indebtedness to LE 35.6 billion or 4.8 percent of the total domestic credit at the end of Dec. 2009. In addition, credit to the household sector moved up by LE 4.3 billion or 5.1 percent during the period, reaching LE 88.9 billion or 11.9 percent of the total. By contrast, the share of the private business sector rolled back by LE 10.9 billion or 3.6 percent, reaching LE 293.5 billion or 39.3 percent of total domestic credit at the end of Dec. 2009.
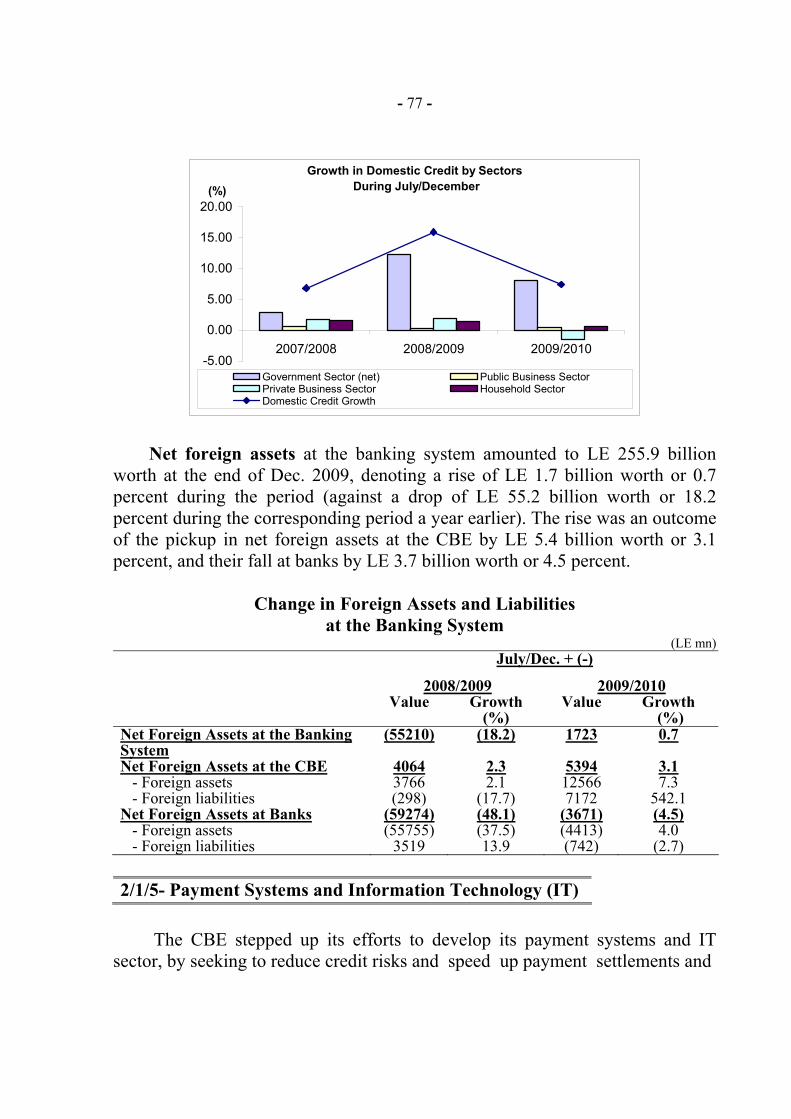
- 77 -
Growth in Domestic Credit by Sectors
During July/December
-5.00
0.00
5.00
10.00
15.00
20.00
2007/2008 2008/2009 2009/2010
(%)
Government Sector (net) Public Business SectorPrivate Business Sector Household SectorDomestic Credit Growth
Net foreign assets at the banking system amounted to LE 255.9 billion worth at the end of Dec. 2009, denoting a rise of LE 1.7 billion worth or 0.7 percent during the period (against a drop of LE 55.2 billion worth or 18.2 percent during the corresponding period a year earlier). The rise was an outcome of the pickup in net foreign assets at the CBE by LE 5.4 billion worth or 3.1 percent, and their fall at banks by LE 3.7 billion worth or 4.5 percent.
Change in Foreign Assets and Liabilities at the Banking System
(LE mn) July/Dec. + (-)
2008/2009 2009/2010 Value Growth
(%) Value Growth
(%) Net Foreign Assets at the Banking System
(55210) (18.2) 1723 0.7
Net Foreign Assets at the CBE 4064 2.3 5394 3.1 - Foreign assets 3766 2.1 12566 7.3 - Foreign liabilities (298) (17.7) 7172 542.1
Net Foreign Assets at Banks (59274) (48.1) (3671) (4.5) - Foreign assets (55755) (37.5) (4413) 4.0 - Foreign liabilities 3519 13.9 (742) (2.7)
2/1/5- Payment Systems and Information Technology (IT)
The CBE stepped up its efforts to develop its payment systems and IT
sector, by seeking to reduce credit risks and speed up payment settlements and

- 78 -
ensure their reliability and confidentiality. It aimed ultimately at enhancing the soundness and stability of the financial system and progressively moving to a cashless society. In this respect, the following achievements were made during July/December 2009/2010:
• A project was initiated to develop the operating systems (Core Banking &
Financial Systems). An international bid was made for this purpose and the Bank received offers from international companies with high experience in that field. The project aims at raising the efficiency of the CBE’s branches and different departments and sectors. By facilitating the Ministry of Finance access to its relevant data and reports, with timeliness and accuracy, the aforementioned system will enable it to monitor - on a real time basis - the transactions that affect its accounts at the CBE. Moreover, the project aims to apply the international accounting standards. As an initial step, the updating and development of the Bank’s accounting framework was completed with the participation of all the sectors concerned.
• The development of the banking sector units database at the CBE is currently under way, by setting up a data warehouse conforming to the international standards. The warehouse is designed to help the CBE’s different sectors to obtain such accurate and transparent reports that are required for them to follow up the performance of the banking sector’s units and make the appropriate decisions.
• The establishment of a permanent backup site for the CBE is on track, to be functional in emergencies as an alternative of the main center at El-Gomhoria building. The action aims at ensuring access to data and services with accuracy and timeliness, taking into account that the backup site should conform to the international rules and conditions. The CBE building in Tanta was chosen to be the location for this site, and a study was approved for this purpose.
• The CBE has finished preparing, implementing and operating the new Domestic Market Monitoring System (DMMS). The system aims to electronically monitor the performance of the domestic market (mutual funds, interbank, and interest rates). Technically, the system receives electronic files through the interface with the CBE. After files are uploaded to the system, data would be analyzed and a number of monitoring reports are produced with the aim of following up banks' performance.
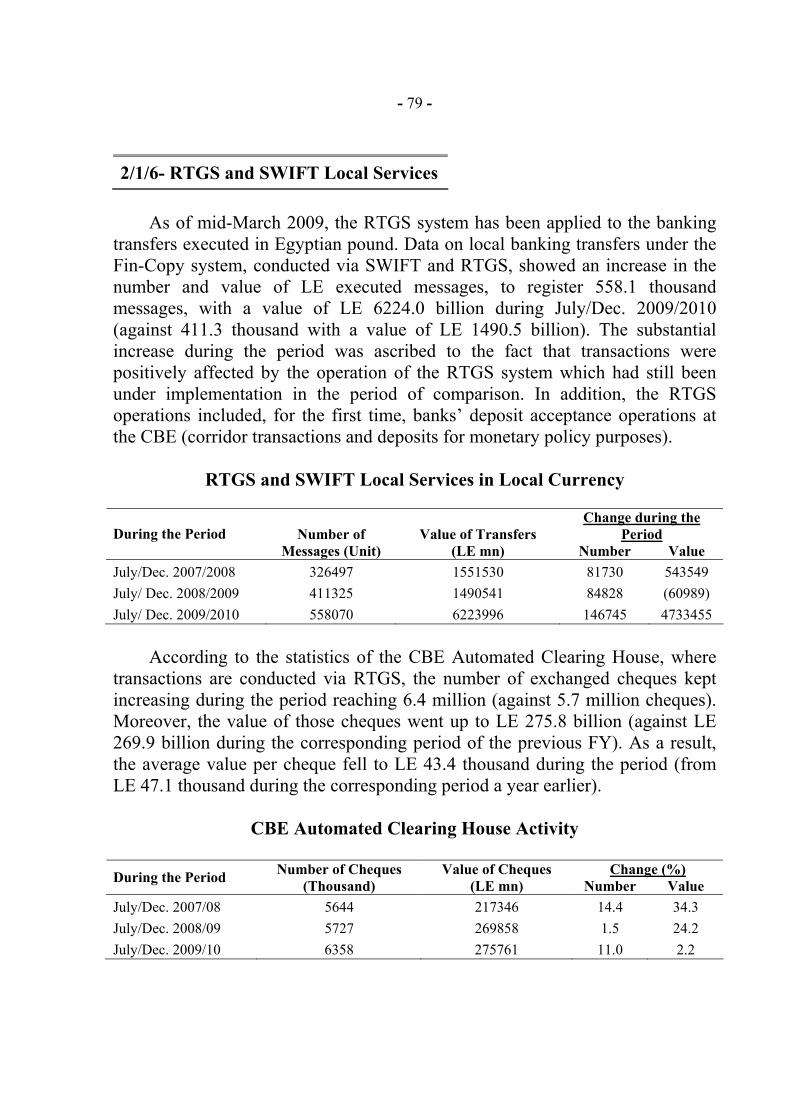
- 79 -
2/1/6- RTGS and SWIFT Local Services
As of mid-March 2009, the RTGS system has been applied to the banking
transfers executed in Egyptian pound. Data on local banking transfers under the Fin-Copy system, conducted via SWIFT and RTGS, showed an increase in the number and value of LE executed messages, to register 558.1 thousand messages, with a value of LE 6224.0 billion during July/Dec. 2009/2010 (against 411.3 thousand with a value of LE 1490.5 billion). The substantial increase during the period was ascribed to the fact that transactions were positively affected by the operation of the RTGS system which had still been under implementation in the period of comparison. In addition, the RTGS operations included, for the first time, banks’ deposit acceptance operations at the CBE (corridor transactions and deposits for monetary policy purposes).
RTGS and SWIFT Local Services in Local Currency
Change during the Period During the Period
Number of
Messages (Unit)
Value of Transfers
(LE mn) Number Value July/Dec. 2007/2008 326497 1551530 81730 543549 July/ Dec. 2008/2009 411325 1490541 84828 (60989) July/ Dec. 2009/2010 558070 6223996 146745 4733455
According to the statistics of the CBE Automated Clearing House, where
transactions are conducted via RTGS, the number of exchanged cheques kept increasing during the period reaching 6.4 million (against 5.7 million cheques). Moreover, the value of those cheques went up to LE 275.8 billion (against LE 269.9 billion during the corresponding period of the previous FY). As a result, the average value per cheque fell to LE 43.4 thousand during the period (from LE 47.1 thousand during the corresponding period a year earlier).
CBE Automated Clearing House Activity
Change (%) During the Period Number of Cheques (Thousand)
Value of Cheques (LE mn) Number Value
July/Dec. 2007/08 5644 217346 14.4 34.3 July/Dec. 2008/09 5727 269858 1.5 24.2 July/Dec. 2009/10 6358 275761 11.0 2.2
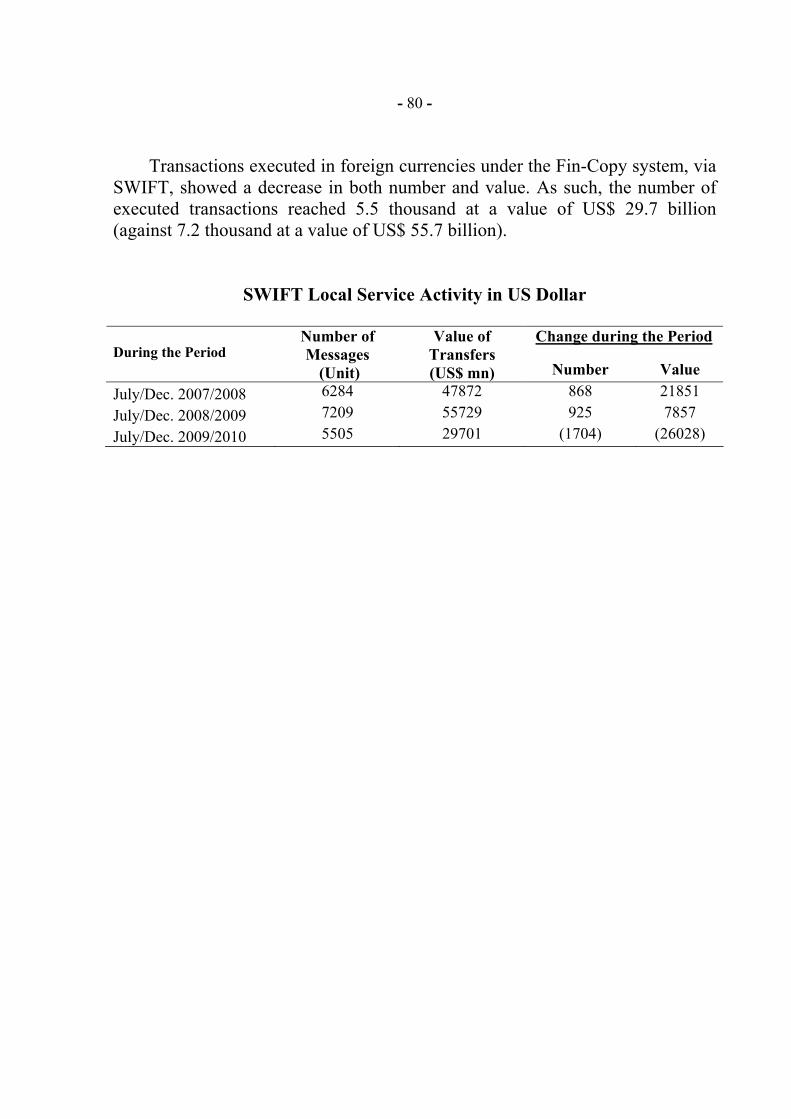
- 80 -
Transactions executed in foreign currencies under the Fin-Copy system, via
SWIFT, showed a decrease in both number and value. As such, the number of executed transactions reached 5.5 thousand at a value of US$ 29.7 billion (against 7.2 thousand at a value of US$ 55.7 billion).
SWIFT Local Service Activity in US Dollar
Change during the Period During the Period
Number of Messages
(Unit)
Value of Transfers (US$ mn) Number Value
July/Dec. 2007/2008 6284 47872 868 21851 July/Dec. 2008/2009 7209 55729 925 7857 July/Dec. 2009/2010 5505 29701 (1704) (26028)
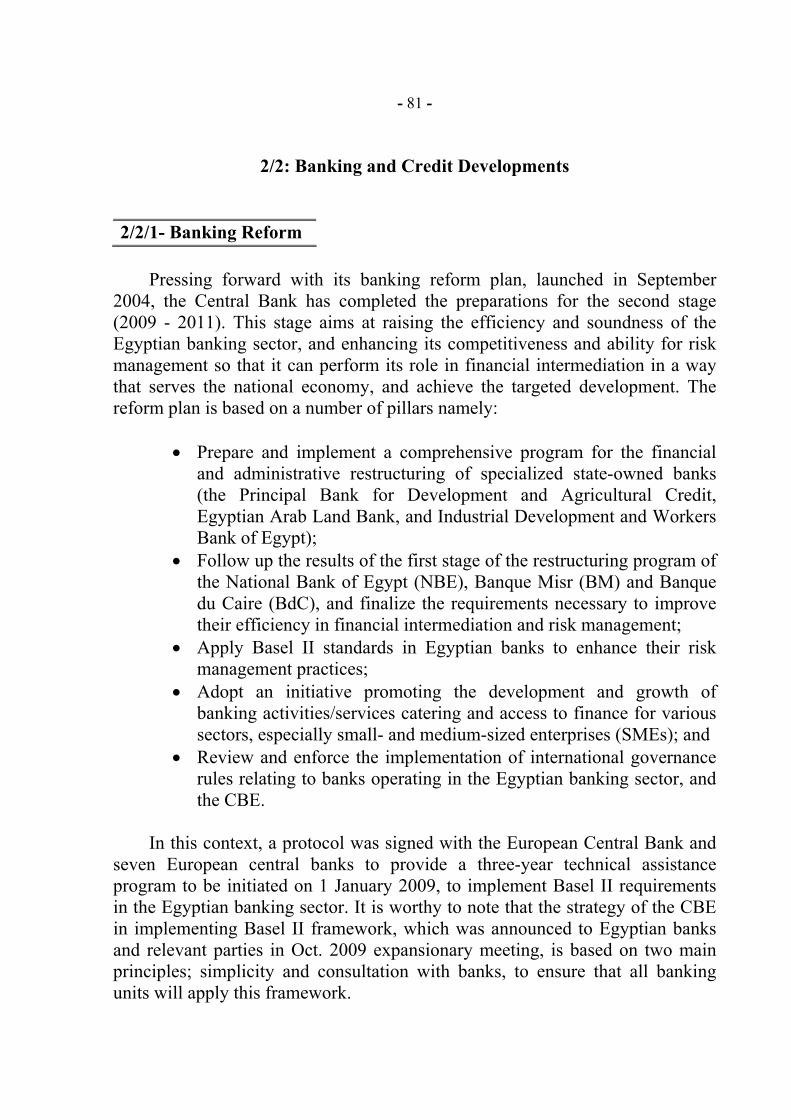
- 81 -
2/2: Banking and Credit Developments
2/2/1- Banking Reform
Pressing forward with its banking reform plan, launched in September
2004, the Central Bank has completed the preparations for the second stage (2009 - 2011). This stage aims at raising the efficiency and soundness of the Egyptian banking sector, and enhancing its competitiveness and ability for risk management so that it can perform its role in financial intermediation in a way that serves the national economy, and achieve the targeted development. The reform plan is based on a number of pillars namely:
• Prepare and implement a comprehensive program for the financial
and administrative restructuring of specialized state-owned banks (the Principal Bank for Development and Agricultural Credit, Egyptian Arab Land Bank, and Industrial Development and Workers Bank of Egypt);
• Follow up the results of the first stage of the restructuring program of the National Bank of Egypt (NBE), Banque Misr (BM) and Banque du Caire (BdC), and finalize the requirements necessary to improve their efficiency in financial intermediation and risk management;
• Apply Basel II standards in Egyptian banks to enhance their risk management practices;
• Adopt an initiative promoting the development and growth of banking activities/services catering and access to finance for various sectors, especially small- and medium-sized enterprises (SMEs); and
• Review and enforce the implementation of international governance rules relating to banks operating in the Egyptian banking sector, and the CBE.
In this context, a protocol was signed with the European Central Bank and
seven European central banks to provide a three-year technical assistance program to be initiated on 1 January 2009, to implement Basel II requirements in the Egyptian banking sector. It is worthy to note that the strategy of the CBE in implementing Basel II framework, which was announced to Egyptian banks and relevant parties in Oct. 2009 expansionary meeting, is based on two main principles; simplicity and consultation with banks, to ensure that all banking units will apply this framework.
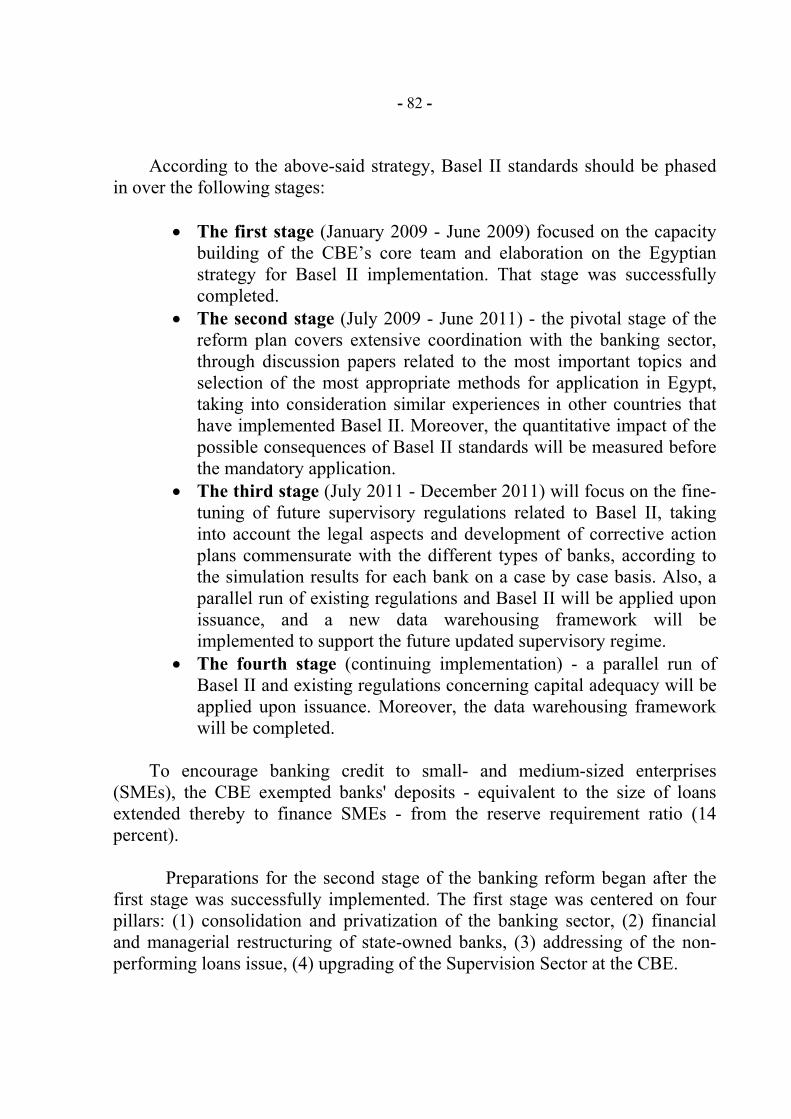
- 82 -
According to the above-said strategy, Basel II standards should be phased
in over the following stages:
• The first stage (January 2009 - June 2009) focused on the capacity building of the CBE’s core team and elaboration on the Egyptian strategy for Basel II implementation. That stage was successfully completed.
• The second stage (July 2009 - June 2011) - the pivotal stage of the reform plan covers extensive coordination with the banking sector, through discussion papers related to the most important topics and selection of the most appropriate methods for application in Egypt, taking into consideration similar experiences in other countries that have implemented Basel II. Moreover, the quantitative impact of the possible consequences of Basel II standards will be measured before the mandatory application.
• The third stage (July 2011 - December 2011) will focus on the fine-tuning of future supervisory regulations related to Basel II, taking into account the legal aspects and development of corrective action plans commensurate with the different types of banks, according to the simulation results for each bank on a case by case basis. Also, a parallel run of existing regulations and Basel II will be applied upon issuance, and a new data warehousing framework will be implemented to support the future updated supervisory regime.
• The fourth stage (continuing implementation) - a parallel run of Basel II and existing regulations concerning capital adequacy will be applied upon issuance. Moreover, the data warehousing framework will be completed.
To encourage banking credit to small- and medium-sized enterprises
(SMEs), the CBE exempted banks' deposits - equivalent to the size of loans extended thereby to finance SMEs - from the reserve requirement ratio (14 percent).
Preparations for the second stage of the banking reform began after the
first stage was successfully implemented. The first stage was centered on four pillars: (1) consolidation and privatization of the banking sector, (2) financial and managerial restructuring of state-owned banks, (3) addressing of the non-performing loans issue, (4) upgrading of the Supervision Sector at the CBE.
- 83 -
As for the first pillar, some voluntary and state-forced mergers took place,
leading to a decrease in the number of banks operating in Egypt from 57 at the end of December 2004 to 39 banks at end the of December 2008. Under this plan, 80 percent of the stake of the Bank of Alexandria was sold to Italy’s Sanpaolo Bank, besides the divestiture of the shareholdings of state-owned banks in a number of joint venture banks.
With respect to the second pillar, state-owned banks were restructured
under a comprehensive and time-lined plan, designed by the Banking Reform Unit at the CBE. The plan was intended to reform the practices of all departments and technological systems, while establishing new departments, particularly for risk management, information technology (IT), management information systems (MIS) and human resources. In addition, a full audit of state-owned banks was conducted according to the international accounting standards, covering the years from 2004 to 2008.
Finally, the recruitment of highly qualified banking cadres and leaderships
at state-owned banks (with finance from the Banking Reform Fund) enabled those banks to push ahead with reform and development.
Concerning the third pillar, to address the problem of non-performing
loans, the CBE's NPL Management Unit worked out a variety of approaches and programs that helped settle more than 90 percent of NPLs (excluding debts of the public business sector). With regard to the irregular debts of public business sector enterprises to public banks, an amount of LE 16 billion (62%) was repaid in cash to the public commercial banks. In addition, the ministries of Finance and Investment pledged to repay the remaining debts (38%).
A program for the reform of the Supervision Sector was devised to
achieve the following targets: enhance the efficiency of this sector by benefiting from the international best practices, and apply the concept of risk-based supervision to ensure the sector’s robustness and soundness. Furthermore, efforts were exerted to recruit for this sector highly qualified staff acquainted with new technology, enhance the efficiency of human cadres to be capable of managing this key sector, and upgrade the management information system (MIS) to ensure timely access to accurate data. In this context, a technical assistance program in collaboration with the European Central Bank (ECB) and four European central banks, was completed in the last quarter of 2007.
It is worth noting that the successful and timely implementation of the first
stage of the CBE's banking reform plan started to yield fruit, helping this sector to weather the adverse effects of the global financial crisis on the banking sector.
- 84 -
2/2/2- Banking Supervision Sector
The CBE is the authority in charge of bank supervision in Egypt, to ensure
the soundness of banks’ financial positions and evaluate their performance from the perspective of risk-based supervision. In addition, it ascertains banks’ compliance with the established regulatory requirements, including the minimum reserve requirement and liquidity ratios, the maximum limits of a bank’s exposure to a single customer, his related parties, and exposures abroad, as well as the asset-liability matching in terms of maturity and currency. This is in addition to a number of qualitative standards that ensure the soundness of banks’ performance and the safety of depositors’ funds, including governance rules, information systems efficiency rules and eligibility and competency criteria for the officials and managers of the key sectors at banks.
In response to the financial crisis that hit the world markets, the Central Bank instructed banks to study the exposure limits in each country according to the scale of its economy and its sovereign credit rating. Moreover, banks are to study and determine the maximum limits of exposure to their customers of foreign financial institutions, given that these limits are to be periodically reviewed. They should also comply - on a daily basis - with the maximum limits determined by the CBE’s Board of Directors in this respect. Amidst the financial crisis, it became clear that the instructions and reform policies adopted by the CBE to restructure banks, raise their capital and strengthen their risk management systems proved instrumental in containing the effects of the crisis. Within this context, the CBE closely followed up the financial crisis in Dubai and Greece to make immediate decisions when necessary to avoid negative repercussions in due time.
In the period under review, the CBE took the following actions:
1- The Bank held an expansionary meeting with the leaders of the
banking sector to discuss the strategy of applying Basel II accords at the Egyptian banking sector as of 2009 till the end of 2011 within the framework of the second stage of the banking reform plan launched by the CBE.
2- The Bank emphasized that banks operating in the foreign exchange
market shall be prohibited from conducting any margin trading on any currency or precious metal on behalf of their customers.

- 85 -
3- Within the framework of the complementary rules of the interbank
foreign exchange market agreement, the CBE realizing the need for banks to change their market rates, decided that banks should be free to change the list of their announced market rates whenever the interbank rates change, without being restricted by the lapse of one-hour condition. However, any change to be made by banks should be within the limits stipulated by the agreement regulating the foreign exchange market; specifically that buying market rates should not exceed buying interbank rates, and that the selling market rates should be higher than the selling interbank rates.
4- In the field of credit, banks should abide by the following CBE
instructions:
(A) Obtain data and information from the Egyptian Credit Bureau (I-Score) on the credit history of natural persons and SMEs, as part of the process of analyzing information on, and assessing the creditworthiness of, each customer to decide whether credit be offered, increased or renewed. The credit information report (CIR) received from I-Score shall be an obligatory document to be submitted, along with the credit memo, to the relevant credit grantor.
(B) Observe accuracy of the information sent by banks to the Credit
Bureau to ensure the reliability of the Bureau’s reports, on the basis of which banks should assess the creditworthiness of their customers.
As for credit extended to activity sectors as well as the natural persons and
SMEs, the CBE’s system of pooling credit risk was updated to provide all the information (positive and negative) about customers who make regular or irregular payments and obtain finance and credit facilities in an amount of LE 30 thousand or more. The purpose is to notify banks, through the CBE's data network, of the aggregate positions of these customers before deciding whether credit be offered, renewed, or increased. On the other hand, the credit registration system at the CBE provides a set of supervisory reports that ensure banks' compliance with the CBE’s supervisory regulations.
- 86 -
To make the credit registration system at the CBE more effective and transparent in taking sound credit decisions, and cope with the changes in the structure of economic activities at the international level, the CBE introduced the following measures:
• Obliging banks to send the Obligor Risk Rating (ORR) of their customers on a monthly basis.
• Updating the information from banks on the activities of each
customer, according to the International Standard Industrial Classification (ISIC) set by the CAPMAS.
5- To develop the procedures of submitting bids for treasury bills, bonds
and the CBE certificates of deposits (CDs), it was decided to abolish as of 29 September 2009 the existing system of submitting bids through the SWIFT system. As of that date, a new system called the “Auction Portal System” has been in operation within the scope of the secure and private data network which connects the banks operating in Egypt with the CBE.
6- As for liquidity, the CBE agreed to include some of the bonds issued by a public economic authority in the numerator of the local currency liquidity ratio.
As regards on-site supervision, the Central Bank has prepared its 2010
plan for the inspection of the banking sector units (banks) and exchange dealer companies. Under this plan, the inspection is expected to cover many banks as possible and each bank is inspected in a comprehensive or a limited manner according to its level of risk and quality of products and activities. In this context, the inspection capacity is gradually increased whether in terms of number or quality. It is worth noting that a major part of bank inspection is being conducted by means of automated systems and laptops. For this purpose, a program was developed to produce the credit examination sample in a more comprehensive way, and to help inspectors identify with a higher degree of accuracy the strengths, weaknesses and risks of customers and banks. Moreover, an examination of certain aspects of specific bank customers has been under way, to help take immediate corrective actions as deemed necessary, needless of waiting for the full examination over these banks to be made.
- 87 -
The inspection reports that were prepared in the last period have contributed to improving the framework of risk management in several banks. They also helped in approaching the international best practices in various fields such as governance, and outsourcing and creating a more developed environment for internal control and combating money laundering and terrorism finance.
On the other hand, the Supervision Sector at the CBE continued to
cooperate with the other supervisory and judicial authorities in resolving a number of money and banking issues. Moreover, the Sector examines the complaints filed by bank customers and provides the required banking expertise.
As for enhancing the framework of governance at the Egyptian banking
sector, the CBE's Board of Directors approved the standards verifying the competency of chairmen and members of banks boards of directors as well as the executive managers. Moreover, the Board agreed to update these standards by introducing new criteria that prevent any conflict of interests and comply with the sound governance practices. In addition, interviews are being held with the chairmen, deputies, delegated members, executive members of the banks boards of directors and the executive managers to verify their competency for the jobs they are nominated to with a focus on those occupying risk and compliance posts.
In line with the CBE's policy of encouraging the growth and spread of
banks by opening new branches in different governorates, the currently applied standards were revised to regulate and facilitate the procedures approving the establishment of new branches/agencies for banks. Moreover, a number of guiding regulations were set that take into account the soundness of financial positions, the internal control systems, the efficiency of information systems at banks that apply for new branches, and banks capital adequacy to better face the risks resulting from the increase in their activities.
The CBE has set and updated the regulations required for examining the
documents submitted by the houses of expertise (that are capable of participating in the evaluation of collaterals/guarantees provided to banks) to be recorded in the register of houses of expertise prepared at the CBE. Such a step will contribute to raising the efficiency and effectiveness of the credit decisions taken by banks to prevent the recurrence of the problem of non performing loans. On the other hand, the auditors who are allowed to audit the financial statements of banks shall be registered in a special register according to certain criteria that ensure the required degree of efficiency and expertise.

- 88 -
Recently, banks have accorded high importance to conducting e-banking
operations to cope with the technological progress in this field. The operations included the offering of traditional or innovative banking services via the electronic network or banks' issue of e-money means of payment. Against this background, the CBE's Board of Directors approved the regulations required for offering these services. Currently, the CBE is updating these regulations and setting other payment system regulations in light of the provisions of Law No. 88 of 2003 of the Central Bank, the Banking Sector and Money regarding the supervision of the CBE on the national payment system.
2/2/3- Banks' Aggregate Financial Position
The aggregate financial position of registered banks operating in Egypt (39
banks) reached LE 1.2 trillion at the end of Dec. 2009, up by LE 59.7 billion or 5.5 percent during July/Dec. 2009/2010 against a decline of LE 37.7 billion or 3.5 percent a year earlier.
On the liabilities side, the rise stemmed mainly from deposits at banks
which grew by LE 39.0 billion or 4.8 percent, constituting 65.3 percent of the increase in total finance resources available with banks. In addition, obligations to local banks rose by LE 3.5 billion or 11.3 percent as an outcome of the rise in obligations to the CBE by LE 5.7 billion, and the decline in obligations to other banks by LE 2.2 billion. Increases were also seen in banks provisions by LE 1.0 billion or 1.4 percent and other liabilities by LE 17.0 billion or 21.6 percent. However, the increase in liabilities was held back by the decline in obligations to banks abroad by LE 1.1 billion or 6.0 percent.
Growth Rate of the Banking System Liabilities during July/December
14.5
4.8
1.4
(1.4)
(6.0)
(9.7)
4.8
21.6
7.5
2.7
(5.8)
45.3
(87.3)
(9.4)
(9.5)
2.7
(6.4)
69.3
Capital
Reserves
Provisions
Bonds & Long-term Loans
Obligations to Banks Abroad
Obligations to CBE
Obligations to Banks in Egypt
Total Deposits
Other Liabilities
%
2009/20102008/2009
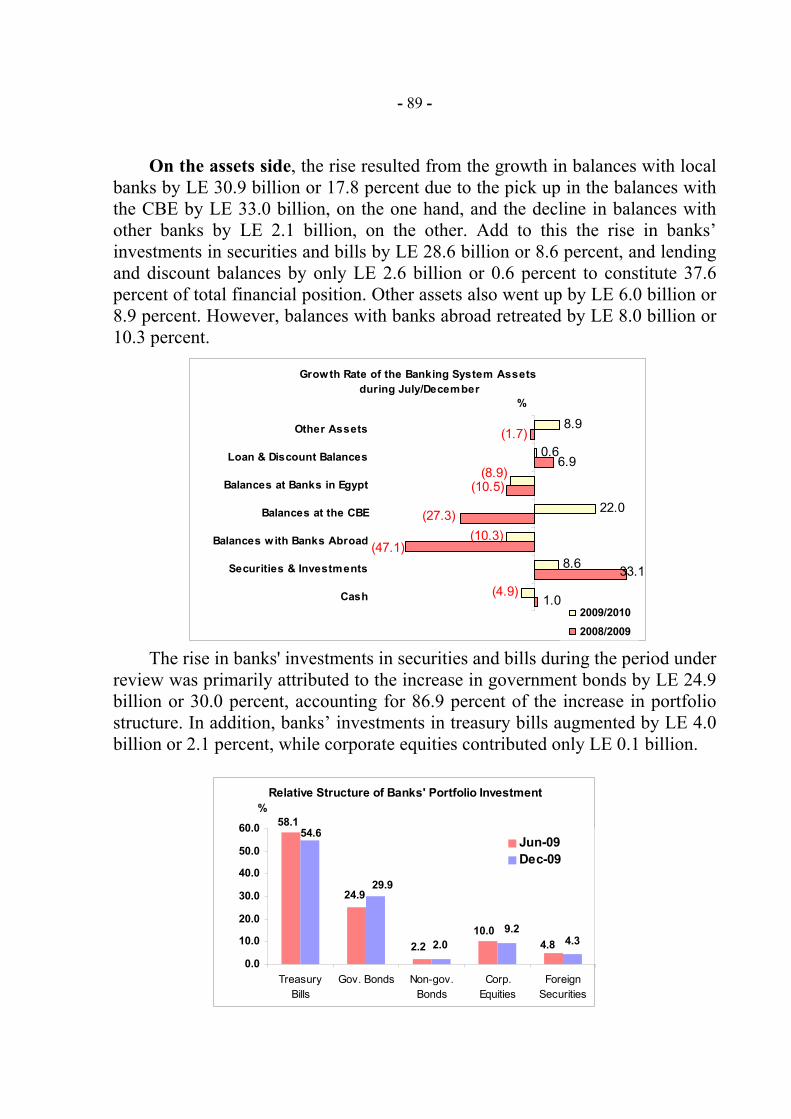
- 89 -
On the assets side, the rise resulted from the growth in balances with local
banks by LE 30.9 billion or 17.8 percent due to the pick up in the balances with the CBE by LE 33.0 billion, on the one hand, and the decline in balances with other banks by LE 2.1 billion, on the other. Add to this the rise in banks’ investments in securities and bills by LE 28.6 billion or 8.6 percent, and lending and discount balances by only LE 2.6 billion or 0.6 percent to constitute 37.6 percent of total financial position. Other assets also went up by LE 6.0 billion or 8.9 percent. However, balances with banks abroad retreated by LE 8.0 billion or 10.3 percent.
The rise in banks' investments in securities and bills during the period under
review was primarily attributed to the increase in government bonds by LE 24.9 billion or 30.0 percent, accounting for 86.9 percent of the increase in portfolio structure. In addition, banks’ investments in treasury bills augmented by LE 4.0 billion or 2.1 percent, while corporate equities contributed only LE 0.1 billion.
Growth Rate of the Banking System Assets during July/December
6.9
(1.7)
(4.9)
8.6
(10.3)
22.0
0.6
8.9
33.1
(47.1)
(10.5)
(27.3)
1.0
(8.9)
Cash
Securities & Investments
Balances with Banks Abroad
Balances at the CBE
Balances at Banks in Egypt
Loan & Discount Balances
Other Assets
%
2009/20102008/2009
Relative Structure of Banks' Portfolio Investment
4.310.0
2.2
58.1
24.9
4.8
54.6
2.09.2
29.9
0.0
10.0
20.0
30.0
40.0
50.0
60.0
TreasuryBills
Gov. Bonds Non-gov.Bonds
Corp.Equities
ForeignSecurities
%
Jun-09Dec-09
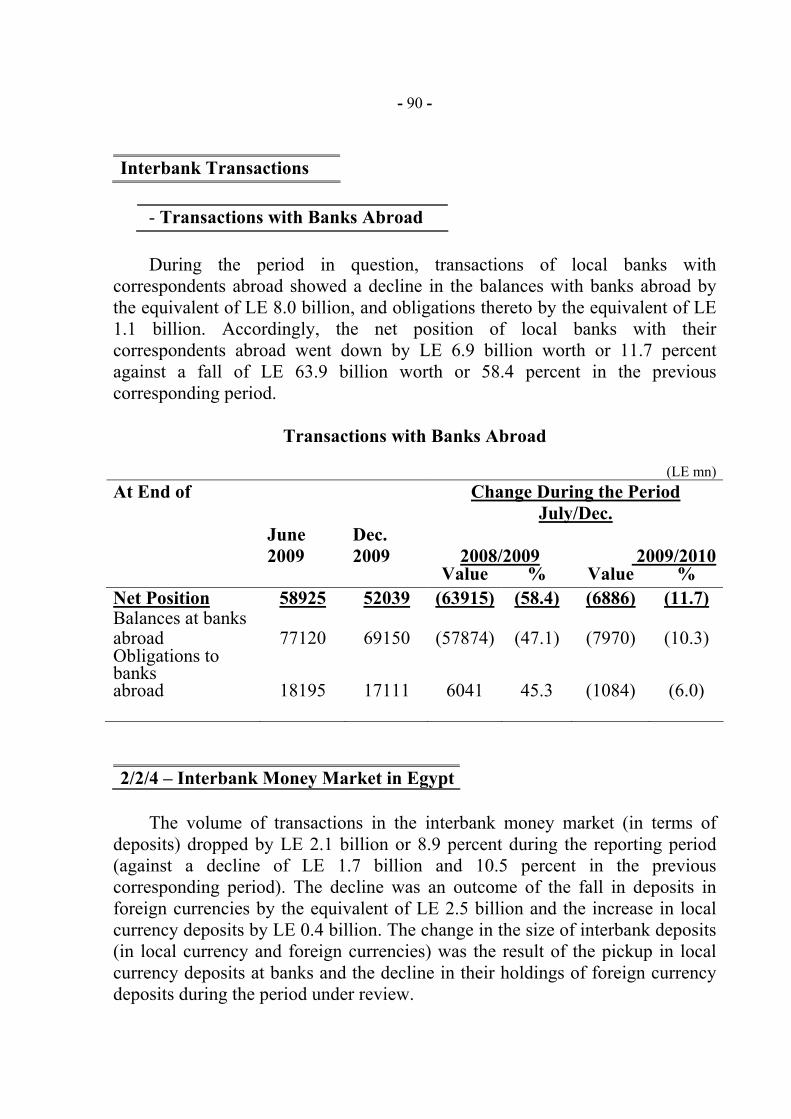
- 90 -
Interbank Transactions
- Transactions with Banks Abroad
During the period in question, transactions of local banks with
correspondents abroad showed a decline in the balances with banks abroad by the equivalent of LE 8.0 billion, and obligations thereto by the equivalent of LE 1.1 billion. Accordingly, the net position of local banks with their correspondents abroad went down by LE 6.9 billion worth or 11.7 percent against a fall of LE 63.9 billion worth or 58.4 percent in the previous corresponding period.
Transactions with Banks Abroad
(LE mn) Change During the Period
July/Dec. At End of
June 2009
Dec. 2009 2008/2009 2009/2010
Value % Value % Net Position 58925 52039 (63915) (58.4) (6886) (11.7) Balances at banks abroad 77120 69150 (57874) (47.1) (7970) (10.3) Obligations to banks abroad 18195 17111 6041 45.3 (1084) (6.0) 2/2/4 – Interbank Money Market in Egypt
The volume of transactions in the interbank money market (in terms of
deposits) dropped by LE 2.1 billion or 8.9 percent during the reporting period (against a decline of LE 1.7 billion and 10.5 percent in the previous corresponding period). The decline was an outcome of the fall in deposits in foreign currencies by the equivalent of LE 2.5 billion and the increase in local currency deposits by LE 0.4 billion. The change in the size of interbank deposits (in local currency and foreign currencies) was the result of the pickup in local currency deposits at banks and the decline in their holdings of foreign currency deposits during the period under review.
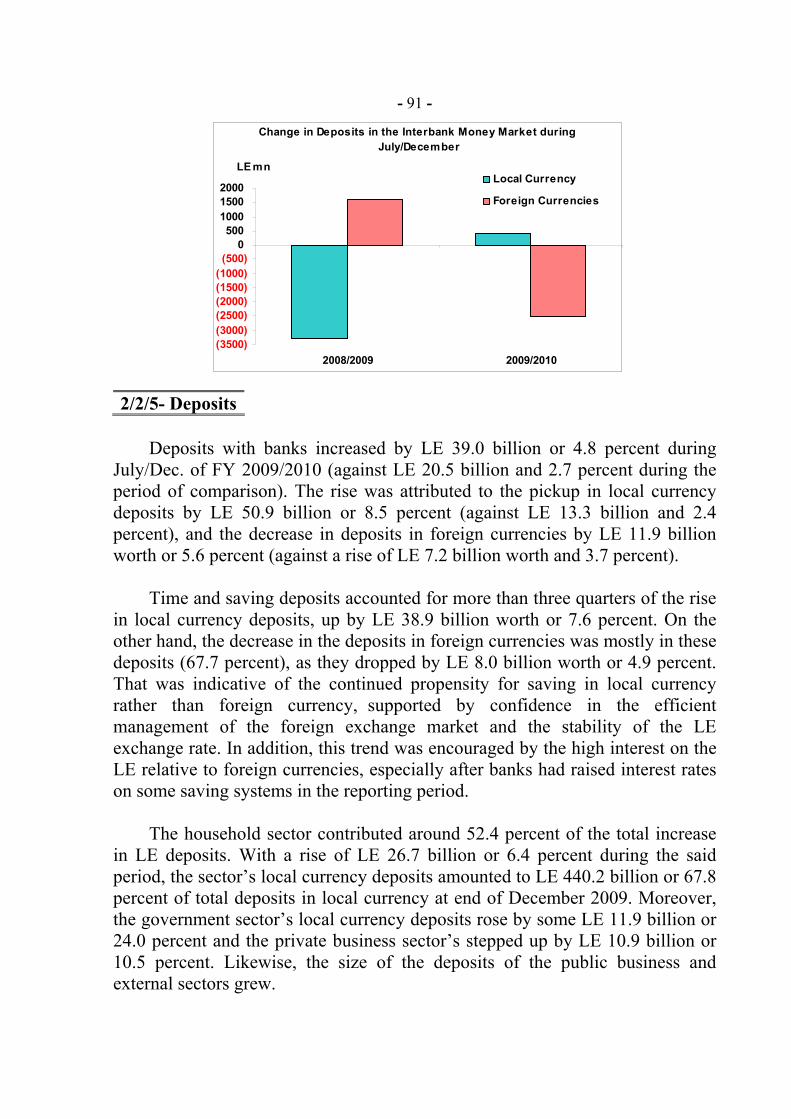
- 91 -
2/2/5- Deposits
Deposits with banks increased by LE 39.0 billion or 4.8 percent during
July/Dec. of FY 2009/2010 (against LE 20.5 billion and 2.7 percent during the period of comparison). The rise was attributed to the pickup in local currency deposits by LE 50.9 billion or 8.5 percent (against LE 13.3 billion and 2.4 percent), and the decrease in deposits in foreign currencies by LE 11.9 billion worth or 5.6 percent (against a rise of LE 7.2 billion worth and 3.7 percent).
Time and saving deposits accounted for more than three quarters of the rise
in local currency deposits, up by LE 38.9 billion worth or 7.6 percent. On the other hand, the decrease in the deposits in foreign currencies was mostly in these deposits (67.7 percent), as they dropped by LE 8.0 billion worth or 4.9 percent. That was indicative of the continued propensity for saving in local currency rather than foreign currency, supported by confidence in the efficient management of the foreign exchange market and the stability of the LE exchange rate. In addition, this trend was encouraged by the high interest on the LE relative to foreign currencies, especially after banks had raised interest rates on some saving systems in the reporting period.
The household sector contributed around 52.4 percent of the total increase
in LE deposits. With a rise of LE 26.7 billion or 6.4 percent during the said period, the sector’s local currency deposits amounted to LE 440.2 billion or 67.8 percent of total deposits in local currency at end of December 2009. Moreover, the government sector’s local currency deposits rose by some LE 11.9 billion or 24.0 percent and the private business sector’s stepped up by LE 10.9 billion or 10.5 percent. Likewise, the size of the deposits of the public business and external sectors grew.
Change in Deposits in the Interbank Money Market during July/December
(3500)(3000)(2500)(2000)(1500)(1000)(500)
0500
100015002000
2008/2009 2009/2010
Local Currency
Foreign Currencies
LE mn
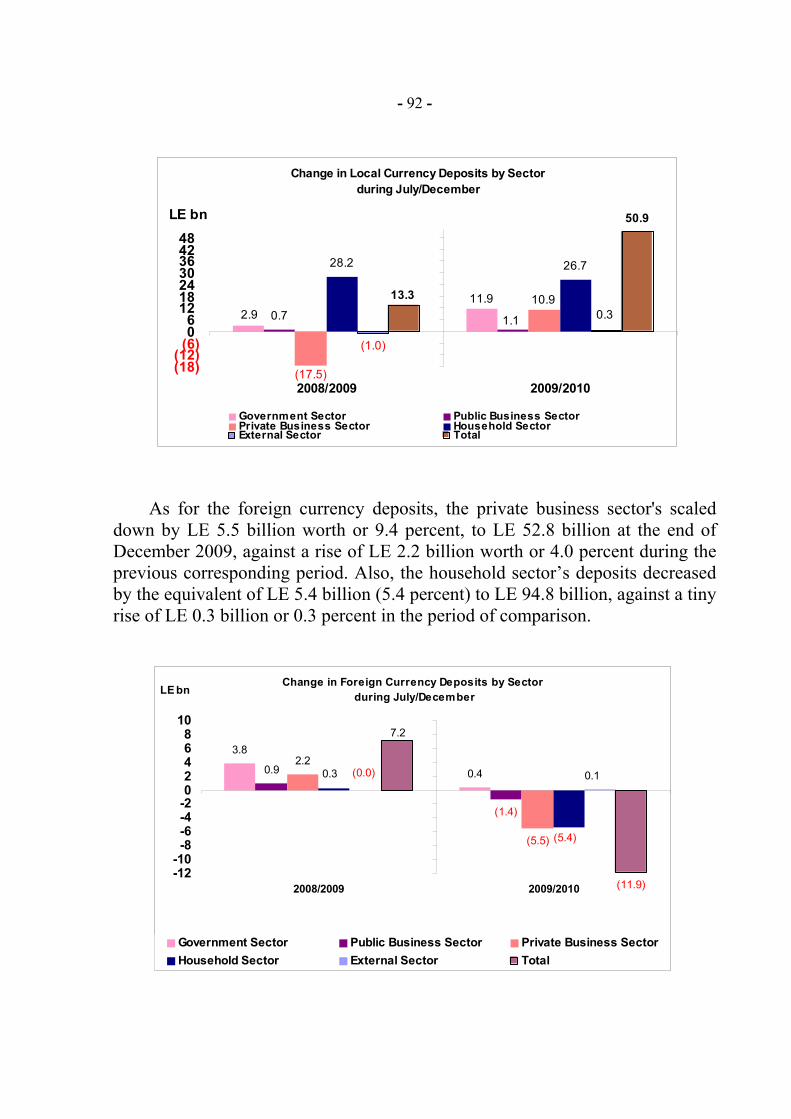
- 92 -
As for the foreign currency deposits, the private business sector's scaled
down by LE 5.5 billion worth or 9.4 percent, to LE 52.8 billion at the end of December 2009, against a rise of LE 2.2 billion worth or 4.0 percent during the previous corresponding period. Also, the household sector’s deposits decreased by the equivalent of LE 5.4 billion (5.4 percent) to LE 94.8 billion, against a tiny rise of LE 0.3 billion or 0.3 percent in the period of comparison.
Change in Local Currency Deposits by Sector during July/December
0.7
28.2 26.7
(1.0)
50.9
11.92.9 1.1
10.9
(17.5)
0.313.3
(18)(12)
(6)06
12182430364248
2008/2009 2009/2010
LE bn
Government Sector Public Business Sector Private Business Sector Household SectorExternal Sector Total
Change in Foreign Currency Deposits by Sector during July/December
3.8
0.40.92.2
(1.4)
(5.5)
0.3
(5.4)
(0.0) 0.1
(11.9)
7.2
-12-10-8-6-4-202468
10
2008/2009 2009/2010
LE bn
Government Sector Public Business Sector Private Business SectorHousehold Sector External Sector Total
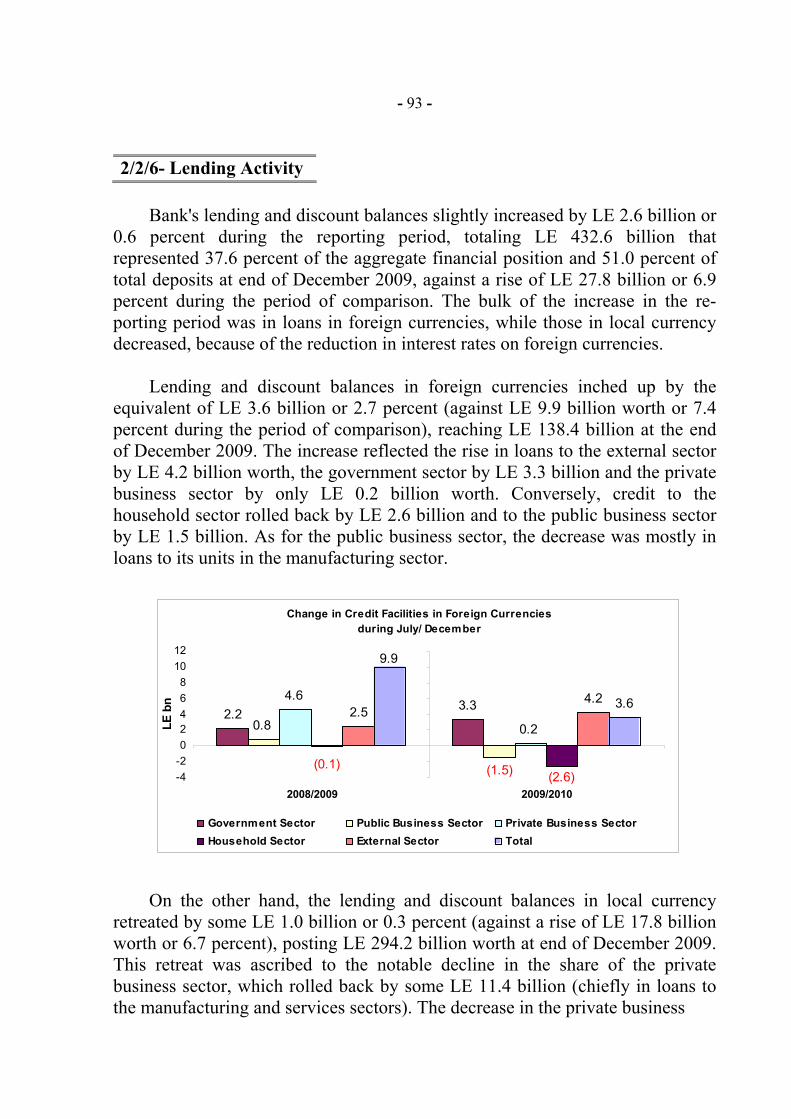
- 93 -
2/2/6- Lending Activity
Bank's lending and discount balances slightly increased by LE 2.6 billion or 0.6 percent during the reporting period, totaling LE 432.6 billion that represented 37.6 percent of the aggregate financial position and 51.0 percent of total deposits at end of December 2009, against a rise of LE 27.8 billion or 6.9 percent during the period of comparison. The bulk of the increase in the re-porting period was in loans in foreign currencies, while those in local currency decreased, because of the reduction in interest rates on foreign currencies.
Lending and discount balances in foreign currencies inched up by the
equivalent of LE 3.6 billion or 2.7 percent (against LE 9.9 billion worth or 7.4 percent during the period of comparison), reaching LE 138.4 billion at the end of December 2009. The increase reflected the rise in loans to the external sector by LE 4.2 billion worth, the government sector by LE 3.3 billion and the private business sector by only LE 0.2 billion worth. Conversely, credit to the household sector rolled back by LE 2.6 billion and to the public business sector by LE 1.5 billion. As for the public business sector, the decrease was mostly in loans to its units in the manufacturing sector.
On the other hand, the lending and discount balances in local currency retreated by some LE 1.0 billion or 0.3 percent (against a rise of LE 17.8 billion worth or 6.7 percent), posting LE 294.2 billion worth at end of December 2009. This retreat was ascribed to the notable decline in the share of the private business sector, which rolled back by some LE 11.4 billion (chiefly in loans to the manufacturing and services sectors). The decrease in the private business
Change in Credit Facilities in Foreign Currencies during July/ December
2.23.3
0.8
(1.5)
4.6
0.22.5
4.2 3.6
(0.1)(2.6)
9.9
-4-202468
1012
2008/2009 2009/2010
LE b
n
Government Sector Public Business Sector Private Business SectorHousehold Sector External Sector Total
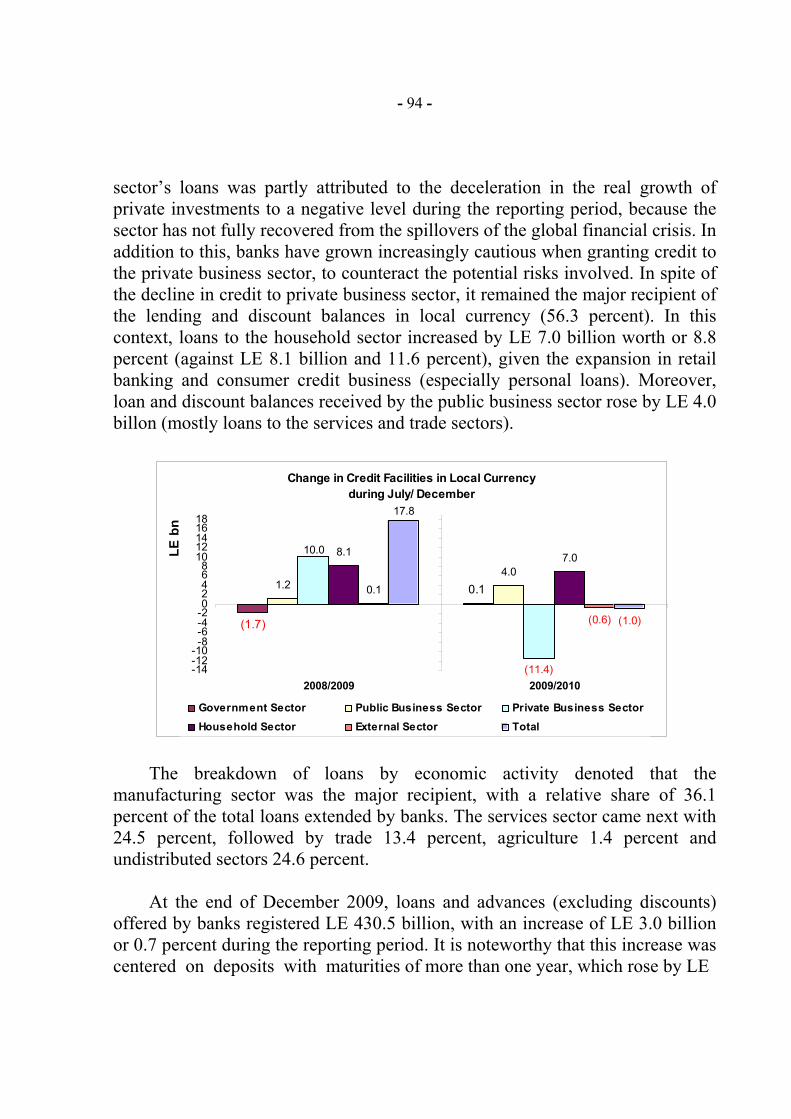
- 94 -
sector’s loans was partly attributed to the deceleration in the real growth of private investments to a negative level during the reporting period, because the sector has not fully recovered from the spillovers of the global financial crisis. In addition to this, banks have grown increasingly cautious when granting credit to the private business sector, to counteract the potential risks involved. In spite of the decline in credit to private business sector, it remained the major recipient of the lending and discount balances in local currency (56.3 percent). In this context, loans to the household sector increased by LE 7.0 billion worth or 8.8 percent (against LE 8.1 billion and 11.6 percent), given the expansion in retail banking and consumer credit business (especially personal loans). Moreover, loan and discount balances received by the public business sector rose by LE 4.0 billon (mostly loans to the services and trade sectors).
The breakdown of loans by economic activity denoted that the manufacturing sector was the major recipient, with a relative share of 36.1 percent of the total loans extended by banks. The services sector came next with 24.5 percent, followed by trade 13.4 percent, agriculture 1.4 percent and undistributed sectors 24.6 percent.
At the end of December 2009, loans and advances (excluding discounts)
offered by banks registered LE 430.5 billion, with an increase of LE 3.0 billion or 0.7 percent during the reporting period. It is noteworthy that this increase was centered on deposits with maturities of more than one year, which rose by LE
Change in Credit Facilities in Local Currency during July/ December
(1.7)
1.24.0
(11.4)
8.1 7.0
0.1 0.1
10.0
(0.6)
17.8
(1.0)
-14-12-10-8-6-4-202468
1012141618
2008/2009 2009/2010
LE b
n
Government Sector Public Business Sector Private Business SectorHousehold Sector External Sector Total
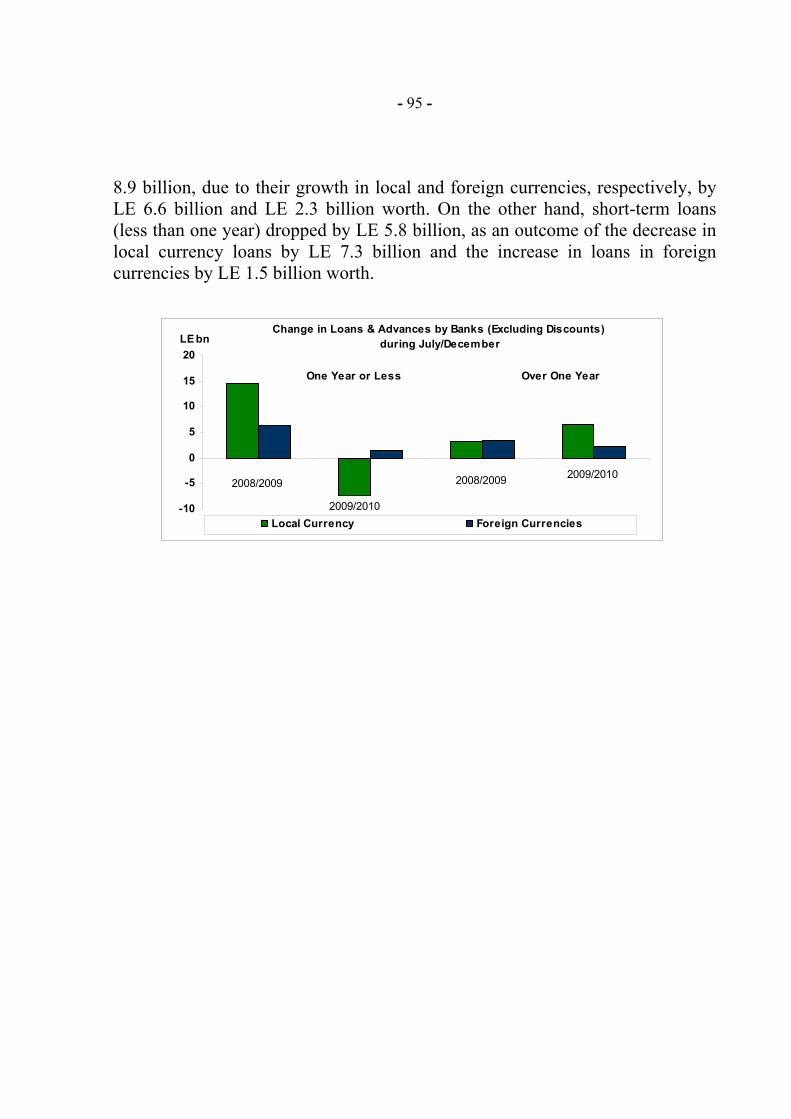
- 95 -
8.9 billion, due to their growth in local and foreign currencies, respectively, by LE 6.6 billion and LE 2.3 billion worth. On the other hand, short-term loans (less than one year) dropped by LE 5.8 billion, as an outcome of the decrease in local currency loans by LE 7.3 billion and the increase in loans in foreign currencies by LE 1.5 billion worth.
2009/2010
2008/20092009/20102008/2009
-10
-5
0
5
10
15
20
Local Currency Foreign Currencies
One Year or Less Over One Year
Change in Loans & Advances by Banks (Excluding Discounts) during July/DecemberLE bn
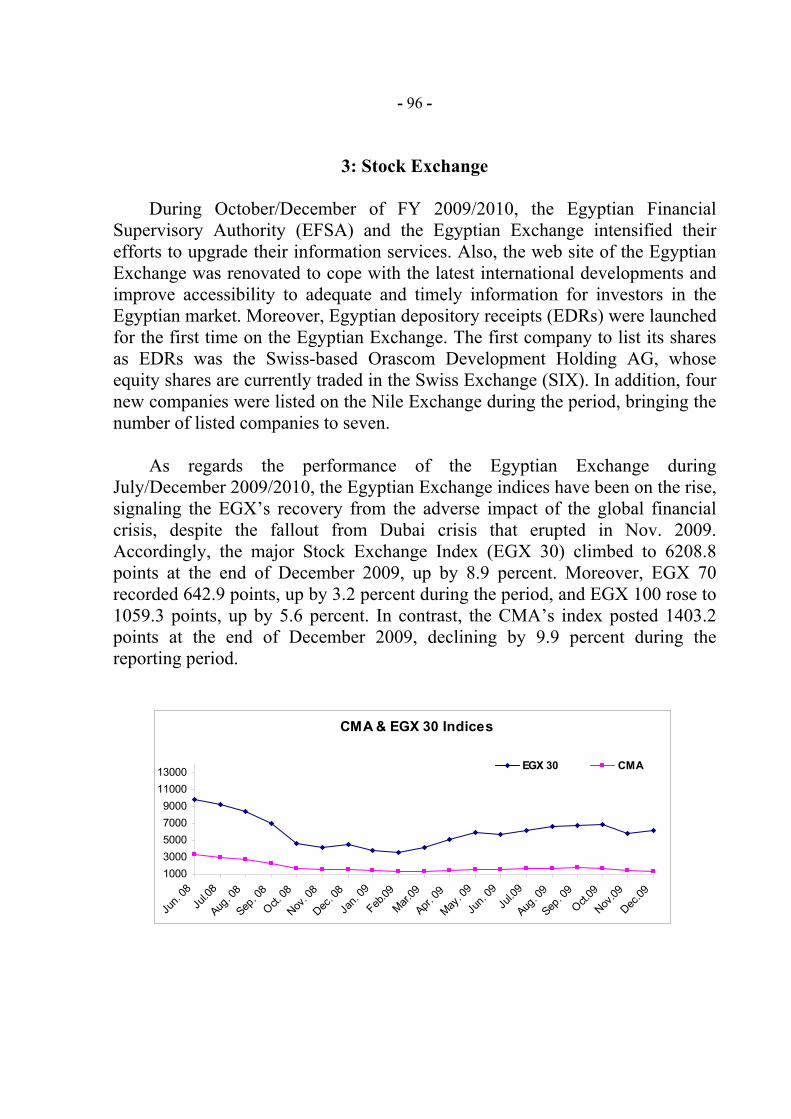
- 96 -
3: Stock Exchange
During October/December of FY 2009/2010, the Egyptian Financial Supervisory Authority (EFSA) and the Egyptian Exchange intensified their efforts to upgrade their information services. Also, the web site of the Egyptian Exchange was renovated to cope with the latest international developments and improve accessibility to adequate and timely information for investors in the Egyptian market. Moreover, Egyptian depository receipts (EDRs) were launched for the first time on the Egyptian Exchange. The first company to list its shares as EDRs was the Swiss-based Orascom Development Holding AG, whose equity shares are currently traded in the Swiss Exchange (SIX). In addition, four new companies were listed on the Nile Exchange during the period, bringing the number of listed companies to seven.
As regards the performance of the Egyptian Exchange during
July/December 2009/2010, the Egyptian Exchange indices have been on the rise, signaling the EGX’s recovery from the adverse impact of the global financial crisis, despite the fallout from Dubai crisis that erupted in Nov. 2009. Accordingly, the major Stock Exchange Index (EGX 30) climbed to 6208.8 points at the end of December 2009, up by 8.9 percent. Moreover, EGX 70 recorded 642.9 points, up by 3.2 percent during the period, and EGX 100 rose to 1059.3 points, up by 5.6 percent. In contrast, the CMA’s index posted 1403.2 points at the end of December 2009, declining by 9.9 percent during the reporting period.
CMA & EGX 30 Indices
10003000500070009000
1100013000
Jun.
08Ju
l.08
Aug. 0
8
Sep. 0
8
Oct. 08
Nov. 0
8
Dec. 0
8
Jan.
09
Feb.09
Mar.09
Apr. 09
May. 0
9
Jun.
09Ju
l.09
Aug. 0
9
Sep. 0
9Oct.
09
Nov.09
Dec.09
EGX 30 CMA

- 97 -
The indicators of trading in shares and bonds (on the floor and over the counter) during the first half of FY 2009/2010 revealed an upturn in terms of the number of transactions, and the volume and value of traded securities. Thus, the number of transactions rose by 29.3 percent compared with the previous corresponding period, reaching 6.5 million transactions. Likewise, the volume of traded securities went up by 44.1 percent to 15 billion papers, and their value more than doubled compared with the corresponding period, reaching LE 257.1 billion during the period. Shares accounted for most of trading on the EGX (92.2 percent of the total value of transactions), while dealing in bonds represented only 7.8 percent.
Foreigners' transactions on the EGX (in LE and US$) declined by 4.1
percent during the reporting period below the period of comparison. Despite this drop, their transactions unfolded net purchases of LE 2.8 billion during the period, against net sales of LE 1.9 billion during the corresponding period a year earlier.
3/1- Shares Market
3/1/1- Primary (Issue) Market
A- New Issues
The EFSA approved 1493 new issues during the period under review. New
incorporations accounted for 947 issues, with 569 million shares, at a value of LE 6.2 billion or 20.0 percent of the total value of issues. Issues for capital increases amounted to 546 issues, with 1.5 billion shares, at a value of LE 24.8 billion during the period.
Foreign Investors' Transactions during Jul./Dec.
-5
0
5
10
15
20
25
30
35
2008/2009 2009/2010
PurchasesSalesNet
LE bn
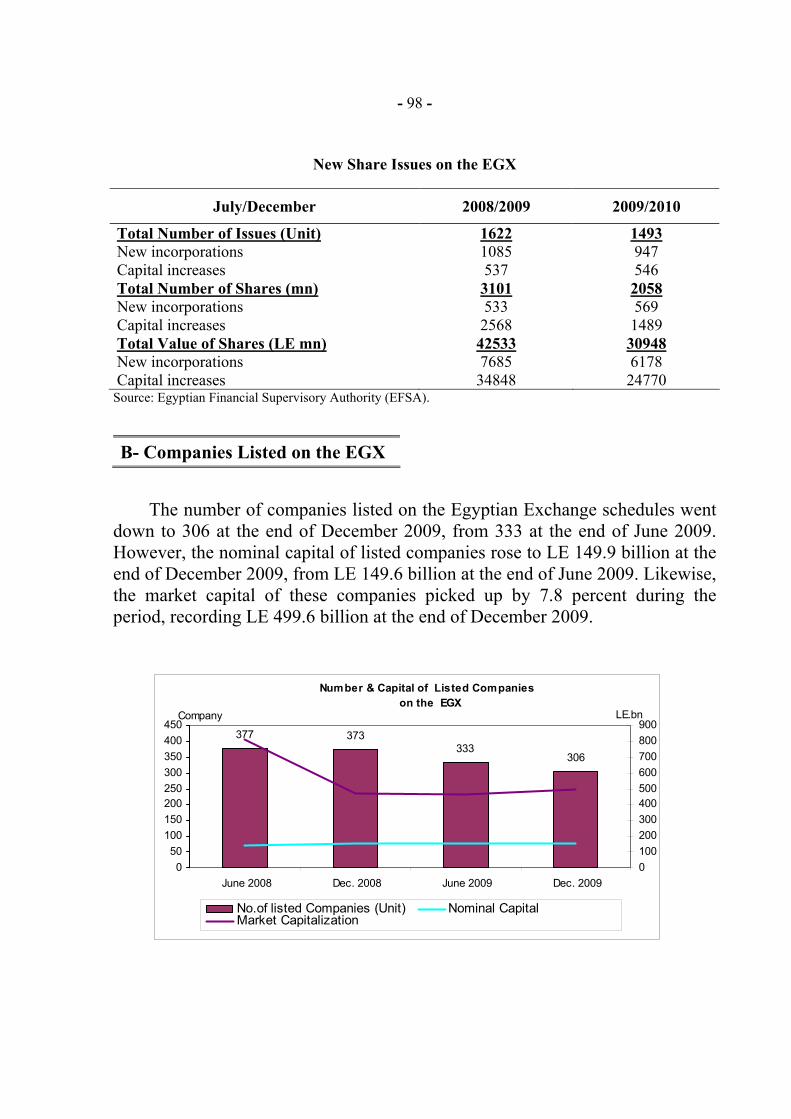
- 98 -
New Share Issues on the EGX
July/December 2008/2009 2009/2010
Total Number of Issues (Unit) 1622 1493 New incorporations 1085 947 Capital increases 537 546 Total Number of Shares (mn) 3101 2058 New incorporations 533 569 Capital increases 2568 1489 Total Value of Shares (LE mn) 42533 30948 New incorporations 7685 6178 Capital increases 34848 24770
Source: Egyptian Financial Supervisory Authority (EFSA).
B- Companies Listed on the EGX
The number of companies listed on the Egyptian Exchange schedules went down to 306 at the end of December 2009, from 333 at the end of June 2009. However, the nominal capital of listed companies rose to LE 149.9 billion at the end of December 2009, from LE 149.6 billion at the end of June 2009. Likewise, the market capital of these companies picked up by 7.8 percent during the period, recording LE 499.6 billion at the end of December 2009.
Number & Capital of Listed Companies on the EGX
377 373333
306
050
100150200250300350400450
June 2008 Dec. 2008 June 2009 Dec. 20090100200300400500600700800900
No.of listed Companies (Unit) Nominal Capital Market Capitalization
LE.bnCompany
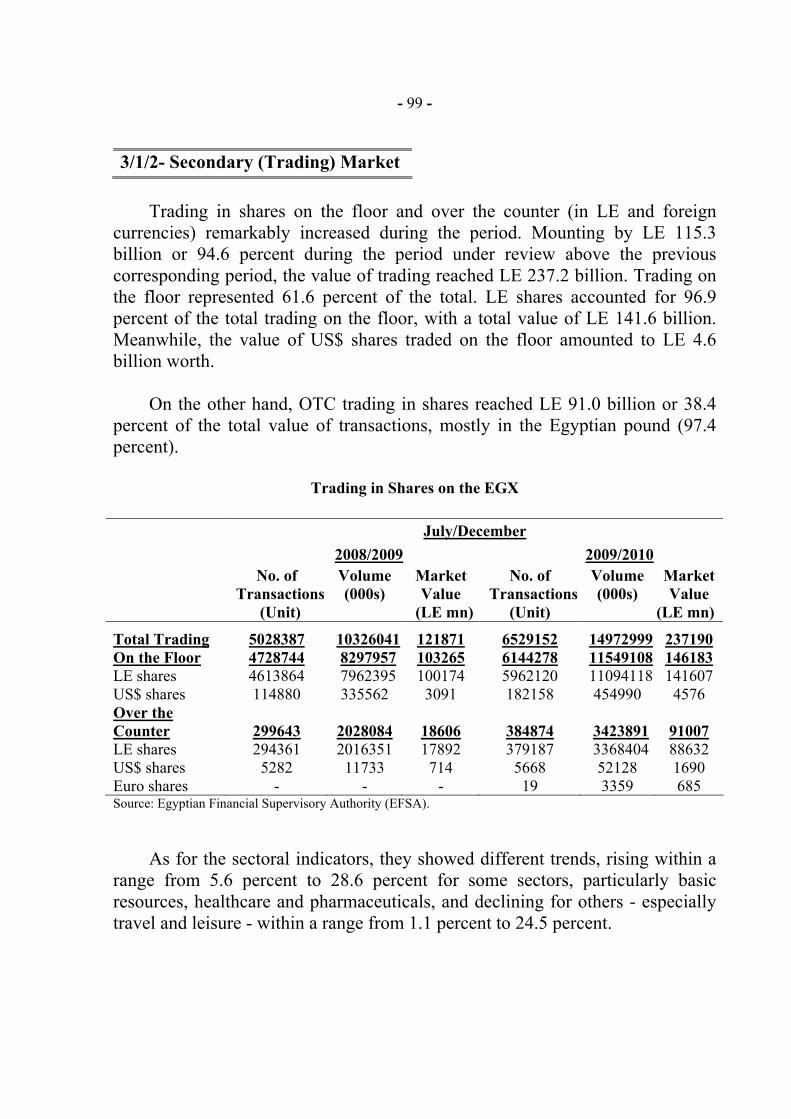
- 99 -
3/1/2- Secondary (Trading) Market
Trading in shares on the floor and over the counter (in LE and foreign currencies) remarkably increased during the period. Mounting by LE 115.3 billion or 94.6 percent during the period under review above the previous corresponding period, the value of trading reached LE 237.2 billion. Trading on the floor represented 61.6 percent of the total. LE shares accounted for 96.9 percent of the total trading on the floor, with a total value of LE 141.6 billion. Meanwhile, the value of US$ shares traded on the floor amounted to LE 4.6 billion worth.
On the other hand, OTC trading in shares reached LE 91.0 billion or 38.4
percent of the total value of transactions, mostly in the Egyptian pound (97.4 percent).
Trading in Shares on the EGX
July/December
2008/2009 2009/2010 No. of
Transactions (Unit)
Volume (000s)
Market Value
(LE mn)
No. of Transactions
(Unit)
Volume (000s)
MarketValue
(LE mn)
Total Trading 5028387 10326041 121871 6529152 14972999 237190 On the Floor 4728744 8297957 103265 6144278 11549108 146183 LE shares 4613864 7962395 100174 5962120 11094118 141607 US$ shares 114880 335562 3091 182158 454990 4576 Over the Counter 299643 2028084 18606 384874 3423891 91007 LE shares 294361 2016351 17892 379187 3368404 88632 US$ shares 5282 11733 714 5668 52128 1690 Euro shares - - - 19 3359 685 Source: Egyptian Financial Supervisory Authority (EFSA).
As for the sectoral indicators, they showed different trends, rising within a
range from 5.6 percent to 28.6 percent for some sectors, particularly basic resources, healthcare and pharmaceuticals, and declining for others - especially travel and leisure - within a range from 1.1 percent to 24.5 percent.
- 100 -
26.2%-11.6%
-15.6%-3.4%
-24.5%5.6%
9.7%8.8%
-1.5%26.5%
28.6%-1.1%
-30% -20% -10% 0% 10% 20% 30% 40%
Construction & Materials
Personal & Household Products
Travel & Leisure
Banks
Food & Beverages
Basic Resources
Change in Sector Indices during July/Dec. 2009/2010
3/2- Bonds Market
3/2/1- Primary (Issue) Market
During July/December 2009/2010, the nominal value of listed bonds
increased by LE 36.6 billion, to LE 134.2 billion at the end of December 2009, as a result of the rise of LE 31.7 billion in the balance of treasury bonds (primary dealers system), and of LE 5.1 billion in securitization bonds. In contrast, there was a decline in corporate bonds by LE 0.2 billion.
Bonds Listed on the EGX
(Value in LE mn) End of June 2009 December 2009
Listed % Listed % Total 97586 100.0 134226 100.0 Government Bonds 92625 94.9 124390 92.7 - Treasury bonds 92500 94.8 124267 92.6 - Housing bonds 115 0.1 114 0.1 - US dollar development
bonds 10 0.0 9 0.0 Corporate Bonds 3096 3.2 2864 2.1 Securitization Bonds 1865 1.9 6972 5.2 Source: EGX.
- 101 - 3/2/2- Secondary (Trading) Market
The value of traded bonds rose by LE 13.8 billion during the period under
review as compared with the corresponding period, reaching LE 19.9 billion. All transactions were conducted on the floor and were mostly in treasury bonds (under the primary dealers system), as 19.4 million bonds were traded at a value of LE 19.9 billion through 517 transactions.
Dealing in Bonds on the Floor
July/December 2008/2009 2009/2010
No. of Transactions
(Unit)
Volume(000s)
Value(mn)
No. of Transactions
(Unit)
Volume(000s)
Value (mn)
Total Bonds in Egyptian Pound 23524 81658 6174 519 19470 19933 Treasury bonds 23201 74597 199 0 0 0 Treasury bonds (primary dealers) 314 5903 5918 517 19377 19929 Housing bonds 4 0.4 0.0 0 0 0 Corporate bonds 5 1158 57 2 93 4 Total Bonds in US Dollar 9 1.3 0.1 0 0.0 0.0 Development bonds 9 1.3 0.1 0 0.0 0.0 Corporate bonds 0 0.0 0.0 0 0.0 0.0
Source: Egyptian Financial Supervisory Authority (EFSA).
3/3- Mutual Funds
The Egyptian Financial Supervisory Authority (EFSA) approved the
establishment of six new mutual funds during the period under review, thus bringing their number to 59 at the end of December 2009 (56 open-end and 3 close-end funds), against 53 funds at the end of June 2009.
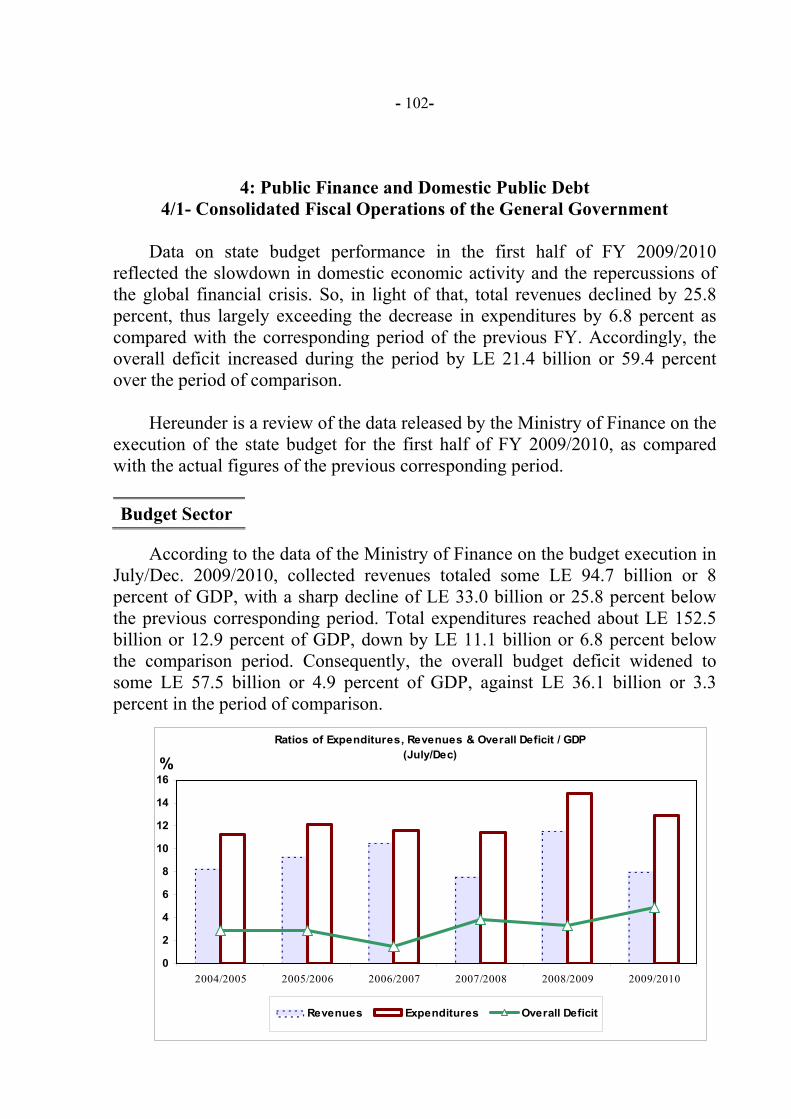
- 102-
4: Public Finance and Domestic Public Debt 4/1- Consolidated Fiscal Operations of the General Government
Data on state budget performance in the first half of FY 2009/2010
reflected the slowdown in domestic economic activity and the repercussions of the global financial crisis. So, in light of that, total revenues declined by 25.8 percent, thus largely exceeding the decrease in expenditures by 6.8 percent as compared with the corresponding period of the previous FY. Accordingly, the overall deficit increased during the period by LE 21.4 billion or 59.4 percent over the period of comparison.
Hereunder is a review of the data released by the Ministry of Finance on the execution of the state budget for the first half of FY 2009/2010, as compared with the actual figures of the previous corresponding period. Budget Sector
According to the data of the Ministry of Finance on the budget execution in
July/Dec. 2009/2010, collected revenues totaled some LE 94.7 billion or 8 percent of GDP, with a sharp decline of LE 33.0 billion or 25.8 percent below the previous corresponding period. Total expenditures reached about LE 152.5 billion or 12.9 percent of GDP, down by LE 11.1 billion or 6.8 percent below the comparison period. Consequently, the overall budget deficit widened to some LE 57.5 billion or 4.9 percent of GDP, against LE 36.1 billion or 3.3 percent in the period of comparison.
0
2
4
6
8
10
12
14
16
2004/2005 2005/2006 2006/2007 2007/2008 2008/2009 2009/2010
Revenues Expenditures Overall Deficit
Ratios of Expenditures, Revenues & Overall Deficit / GDP(July/Dec) %
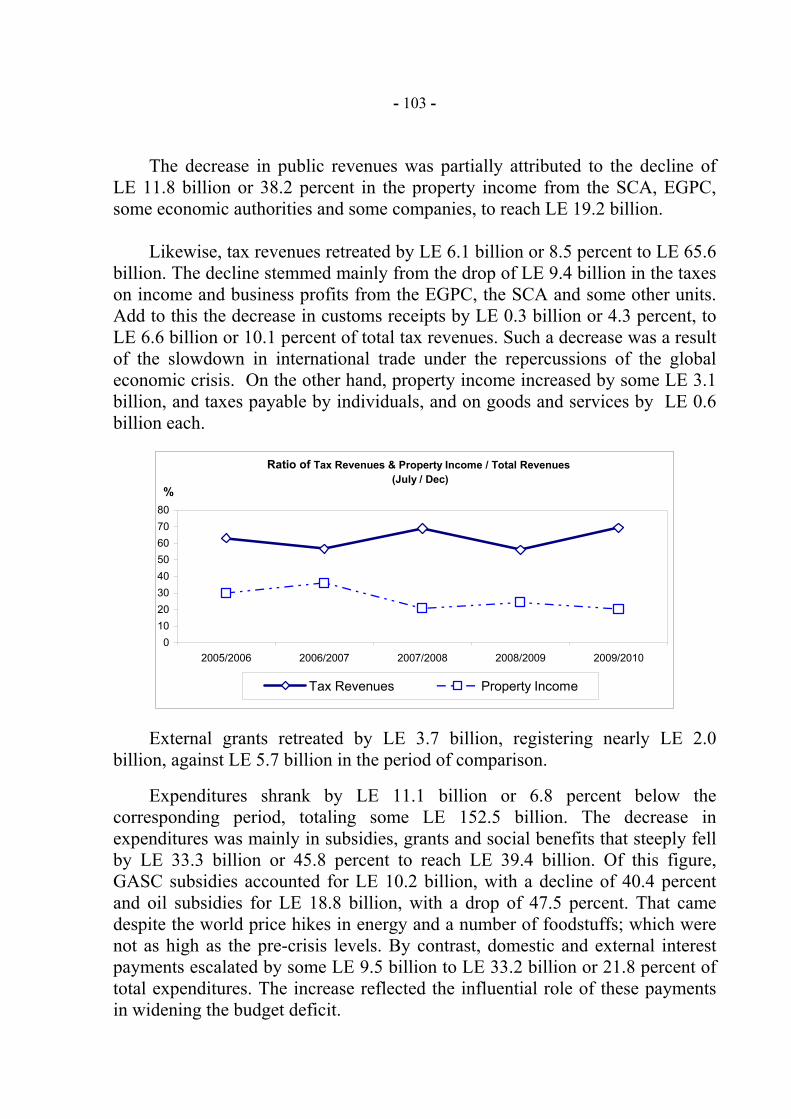
- 103 -
The decrease in public revenues was partially attributed to the decline of
LE 11.8 billion or 38.2 percent in the property income from the SCA, EGPC, some economic authorities and some companies, to reach LE 19.2 billion.
Likewise, tax revenues retreated by LE 6.1 billion or 8.5 percent to LE 65.6
billion. The decline stemmed mainly from the drop of LE 9.4 billion in the taxes on income and business profits from the EGPC, the SCA and some other units. Add to this the decrease in customs receipts by LE 0.3 billion or 4.3 percent, to LE 6.6 billion or 10.1 percent of total tax revenues. Such a decrease was a result of the slowdown in international trade under the repercussions of the global economic crisis. On the other hand, property income increased by some LE 3.1 billion, and taxes payable by individuals, and on goods and services by LE 0.6 billion each.
01020304050607080
2005/2006 2006/2007 2007/2008 2008/2009 2009/2010
Tax Revenues Property Income
%
Ratio of Tax Revenues & Property Income / Total Revenues (July / Dec)
External grants retreated by LE 3.7 billion, registering nearly LE 2.0
billion, against LE 5.7 billion in the period of comparison.
Expenditures shrank by LE 11.1 billion or 6.8 percent below the corresponding period, totaling some LE 152.5 billion. The decrease in expenditures was mainly in subsidies, grants and social benefits that steeply fell by LE 33.3 billion or 45.8 percent to reach LE 39.4 billion. Of this figure, GASC subsidies accounted for LE 10.2 billion, with a decline of 40.4 percent and oil subsidies for LE 18.8 billion, with a drop of 47.5 percent. That came despite the world price hikes in energy and a number of foodstuffs; which were not as high as the pre-crisis levels. By contrast, domestic and external interest payments escalated by some LE 9.5 billion to LE 33.2 billion or 21.8 percent of total expenditures. The increase reflected the influential role of these payments in widening the budget deficit.
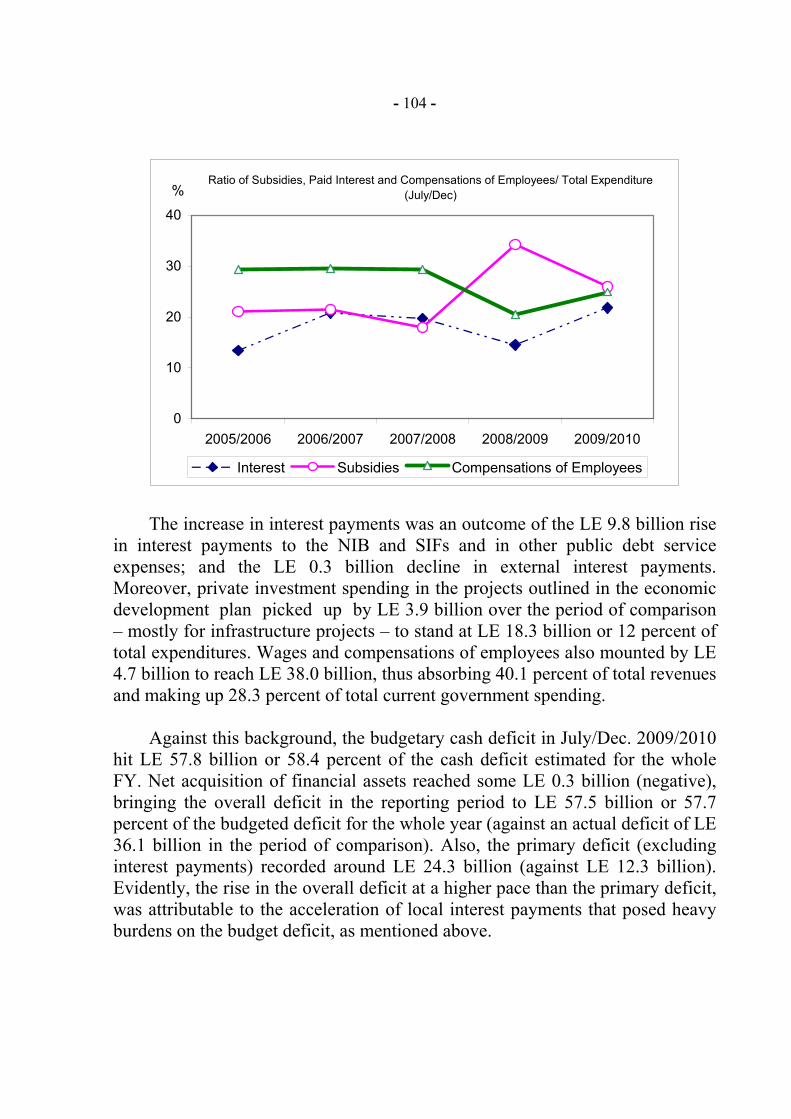
- 104 -
0
10
20
30
40
2005/2006 2006/2007 2007/2008 2008/2009 2009/2010
Interest Subsidies Compensations of Employees
%Ratio of Subsidies, Paid Interest and Compensations of Employees/ Total Expenditure
(July/Dec)
The increase in interest payments was an outcome of the LE 9.8 billion rise in interest payments to the NIB and SIFs and in other public debt service expenses; and the LE 0.3 billion decline in external interest payments. Moreover, private investment spending in the projects outlined in the economic development plan picked up by LE 3.9 billion over the period of comparison – mostly for infrastructure projects – to stand at LE 18.3 billion or 12 percent of total expenditures. Wages and compensations of employees also mounted by LE 4.7 billion to reach LE 38.0 billion, thus absorbing 40.1 percent of total revenues and making up 28.3 percent of total current government spending.
Against this background, the budgetary cash deficit in July/Dec. 2009/2010 hit LE 57.8 billion or 58.4 percent of the cash deficit estimated for the whole FY. Net acquisition of financial assets reached some LE 0.3 billion (negative), bringing the overall deficit in the reporting period to LE 57.5 billion or 57.7 percent of the budgeted deficit for the whole year (against an actual deficit of LE 36.1 billion in the period of comparison). Also, the primary deficit (excluding interest payments) recorded around LE 24.3 billion (against LE 12.3 billion). Evidently, the rise in the overall deficit at a higher pace than the primary deficit, was attributable to the acceleration of local interest payments that posed heavy burdens on the budget deficit, as mentioned above.
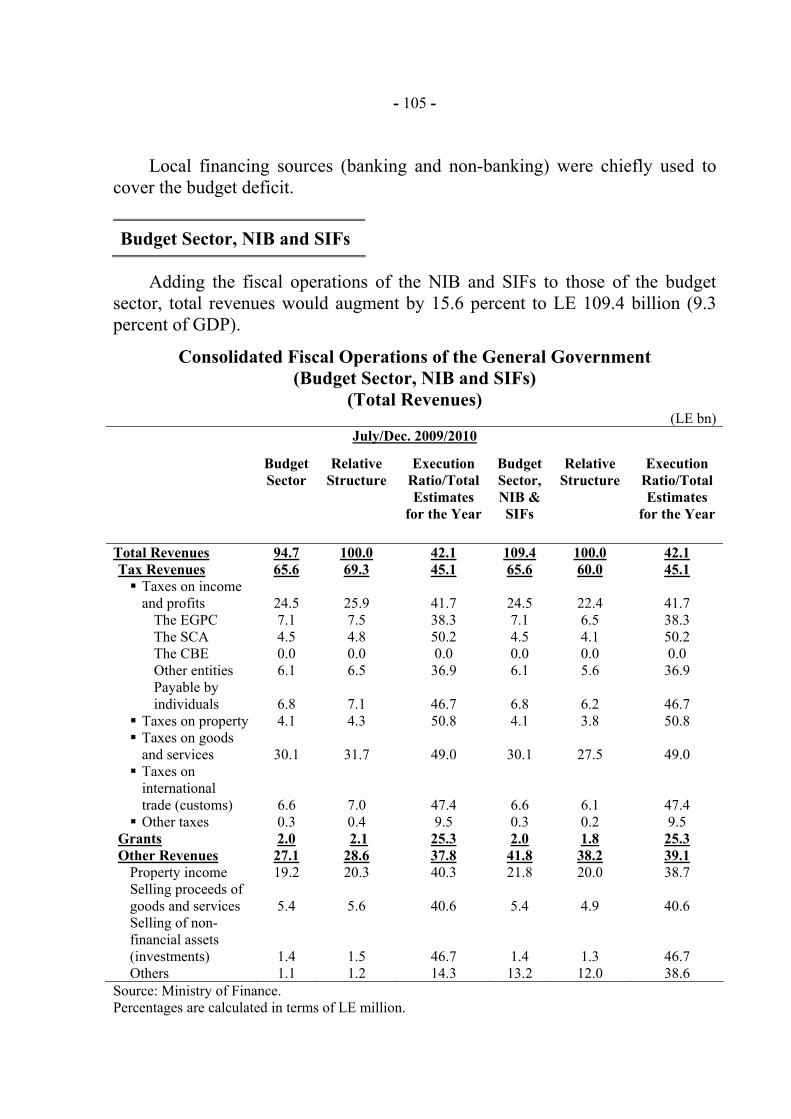
- 105 -
Local financing sources (banking and non-banking) were chiefly used to cover the budget deficit. Budget Sector, NIB and SIFs
Adding the fiscal operations of the NIB and SIFs to those of the budget
sector, total revenues would augment by 15.6 percent to LE 109.4 billion (9.3 percent of GDP).
Consolidated Fiscal Operations of the General Government
(Budget Sector, NIB and SIFs) (Total Revenues)
(LE bn) July/Dec. 2009/2010
Budget Sector
Relative Structure
Execution Ratio/Total Estimates
for the Year
BudgetSector,NIB & SIFs
Relative Structure
Execution Ratio/Total Estimates
for the Year
Total Revenues 94.7 100.0 42.1 109.4 100.0 42.1 Tax Revenues 65.6 69.3 45.1 65.6 60.0 45.1
Taxes on income and profits 24.5 25.9 41.7 24.5 22.4 41.7
The EGPC 7.1 7.5 38.3 7.1 6.5 38.3 The SCA 4.5 4.8 50.2 4.5 4.1 50.2 The CBE 0.0 0.0 0.0 0.0 0.0 0.0 Other entities 6.1 6.5 36.9 6.1 5.6 36.9 Payable by individuals 6.8 7.1 46.7 6.8 6.2 46.7
Taxes on property 4.1 4.3 50.8 4.1 3.8 50.8 Taxes on goods and services 30.1 31.7 49.0 30.1 27.5 49.0
Taxes on international trade (customs) 6.6 7.0 47.4 6.6 6.1 47.4
Other taxes 0.3 0.4 9.5 0.3 0.2 9.5 Grants 2.0 2.1 25.3 2.0 1.8 25.3 Other Revenues 27.1 28.6 37.8 41.8 38.2 39.1
Property income 19.2 20.3 40.3 21.8 20.0 38.7 Selling proceeds of goods and services
5.4
5.6
40.6
5.4
4.9
40.6
Selling of non-financial assets (investments) 1.4 1.5 46.7 1.4 1.3 46.7 Others 1.1 1.2 14.3 13.2 12.0 38.6
Source: Ministry of Finance. Percentages are calculated in terms of LE million.
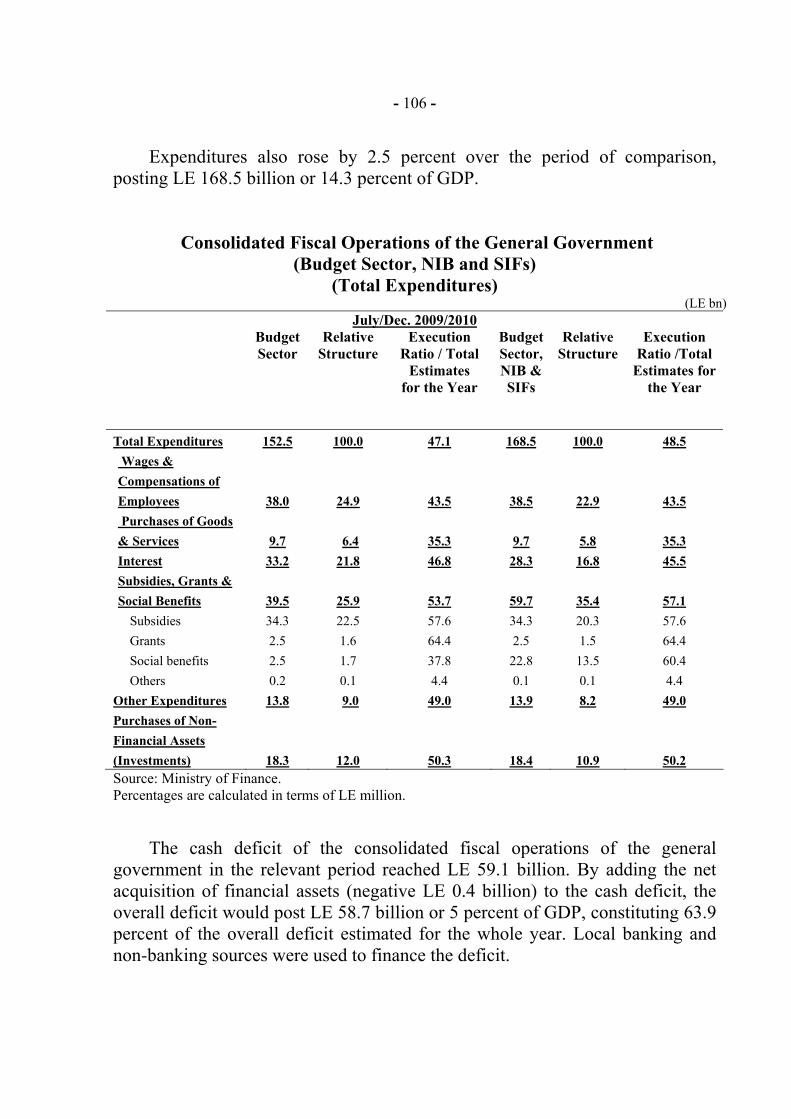
- 106 -
Expenditures also rose by 2.5 percent over the period of comparison, posting LE 168.5 billion or 14.3 percent of GDP.
Consolidated Fiscal Operations of the General Government (Budget Sector, NIB and SIFs)
(Total Expenditures) (LE bn)
July/Dec. 2009/2010 Budget
Sector Relative
Structure
Execution Ratio / Total
Estimates for the Year
BudgetSector,NIB & SIFs
Relative Structure
Execution Ratio /Total
Estimates for the Year
Total Expenditures 152.5 100.0 47.1 168.5 100.0 48.5 Wages & Compensations of Employees 38.0 24.9 43.5 38.5 22.9 43.5 Purchases of Goods & Services 9.7 6.4 35.3 9.7 5.8 35.3 Interest 33.2 21.8 46.8 28.3 16.8 45.5 Subsidies, Grants & Social Benefits 39.5 25.9 53.7 59.7 35.4 57.1
Subsidies 34.3 22.5 57.6 34.3 20.3 57.6 Grants 2.5 1.6 64.4 2.5 1.5 64.4 Social benefits 2.5 1.7 37.8 22.8 13.5 60.4 Others 0.2 0.1 4.4 0.1 0.1 4.4 Other Expenditures 13.8 9.0 49.0 13.9 8.2 49.0 Purchases of Non-Financial Assets (Investments) 18.3 12.0 50.3 18.4 10.9 50.2 Source: Ministry of Finance. Percentages are calculated in terms of LE million.
The cash deficit of the consolidated fiscal operations of the general government in the relevant period reached LE 59.1 billion. By adding the net acquisition of financial assets (negative LE 0.4 billion) to the cash deficit, the overall deficit would post LE 58.7 billion or 5 percent of GDP, constituting 63.9 percent of the overall deficit estimated for the whole year. Local banking and non-banking sources were used to finance the deficit.
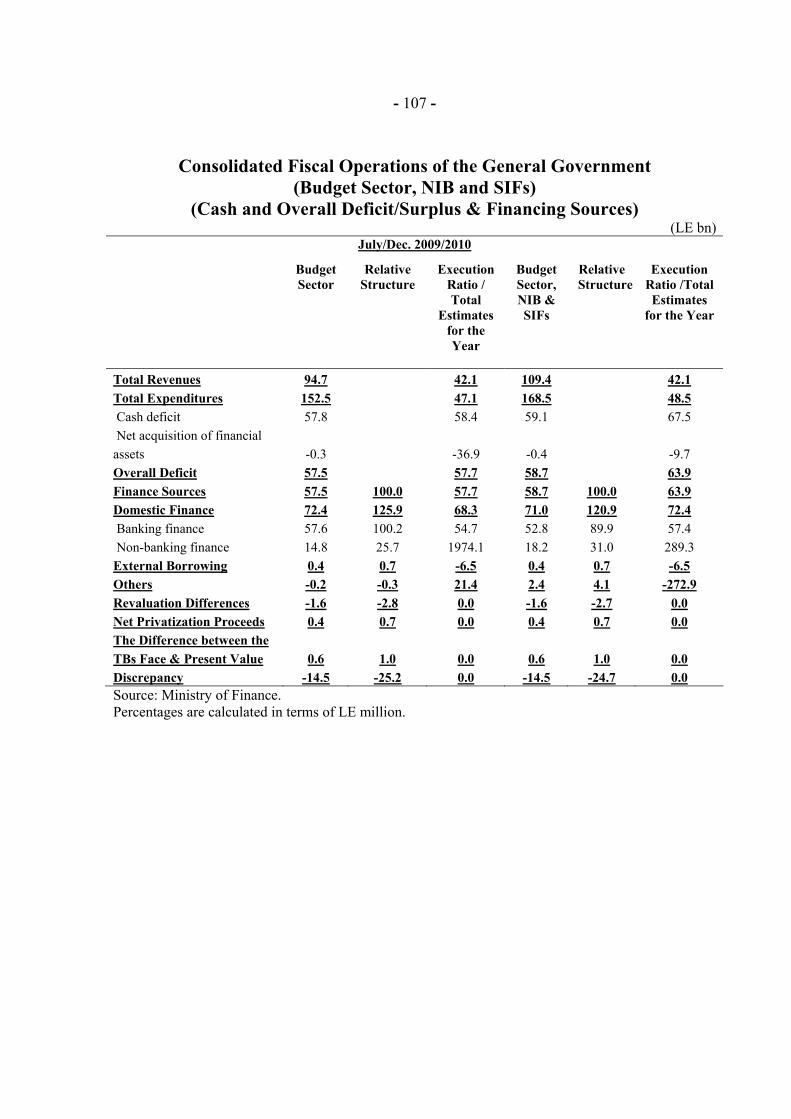
- 107 -
Consolidated Fiscal Operations of the General Government
(Budget Sector, NIB and SIFs) (Cash and Overall Deficit/Surplus & Financing Sources)
(LE bn) July/Dec. 2009/2010
Budget Sector
Relative Structure
Execution Ratio / Total
Estimates for the Year
Budget Sector, NIB & SIFs
Relative Structure
Execution Ratio /Total Estimates
for the Year
Total Revenues 94.7 42.1 109.4 42.1 Total Expenditures 152.5 47.1 168.5 48.5 Cash deficit 57.8 58.4 59.1 67.5 Net acquisition of financial assets -0.3 -36.9 -0.4 -9.7 Overall Deficit 57.5 57.7 58.7 63.9 Finance Sources 57.5 100.0 57.7 58.7 100.0 63.9 Domestic Finance 72.4 125.9 68.3 71.0 120.9 72.4 Banking finance 57.6 100.2 54.7 52.8 89.9 57.4 Non-banking finance 14.8 25.7 1974.1 18.2 31.0 289.3 External Borrowing 0.4 0.7 -6.5 0.4 0.7 -6.5 Others -0.2 -0.3 21.4 2.4 4.1 -272.9 Revaluation Differences -1.6 -2.8 0.0 -1.6 -2.7 0.0 Net Privatization Proceeds 0.4 0.7 0.0 0.4 0.7 0.0 The Difference between the TBs Face & Present Value 0.6 1.0 0.0 0.6 1.0 0.0 Discrepancy -14.5 -25.2 0.0 -14.5 -24.7 0.0 Source: Ministry of Finance. Percentages are calculated in terms of LE million.
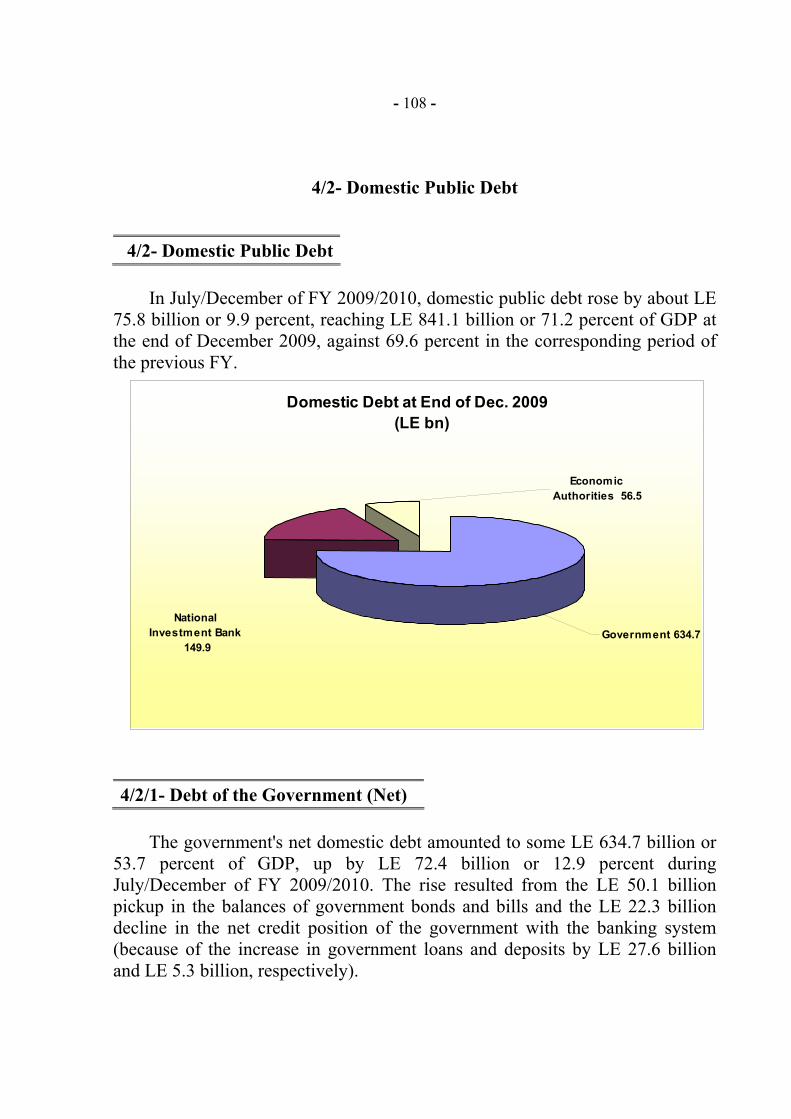
- 108 -
4/2- Domestic Public Debt
4/2- Domestic Public Debt
In July/December of FY 2009/2010, domestic public debt rose by about LE 75.8 billion or 9.9 percent, reaching LE 841.1 billion or 71.2 percent of GDP at the end of December 2009, against 69.6 percent in the corresponding period of the previous FY.
4/2/1- Debt of the Government (Net) The government's net domestic debt amounted to some LE 634.7 billion or 53.7 percent of GDP, up by LE 72.4 billion or 12.9 percent during July/December of FY 2009/2010. The rise resulted from the LE 50.1 billion pickup in the balances of government bonds and bills and the LE 22.3 billion decline in the net credit position of the government with the banking system (because of the increase in government loans and deposits by LE 27.6 billion and LE 5.3 billion, respectively).
Domestic Debt at End of Dec. 2009 (LE bn)
Government 634.7
Economic Authorities 56.5
National Investment Bank
149.9
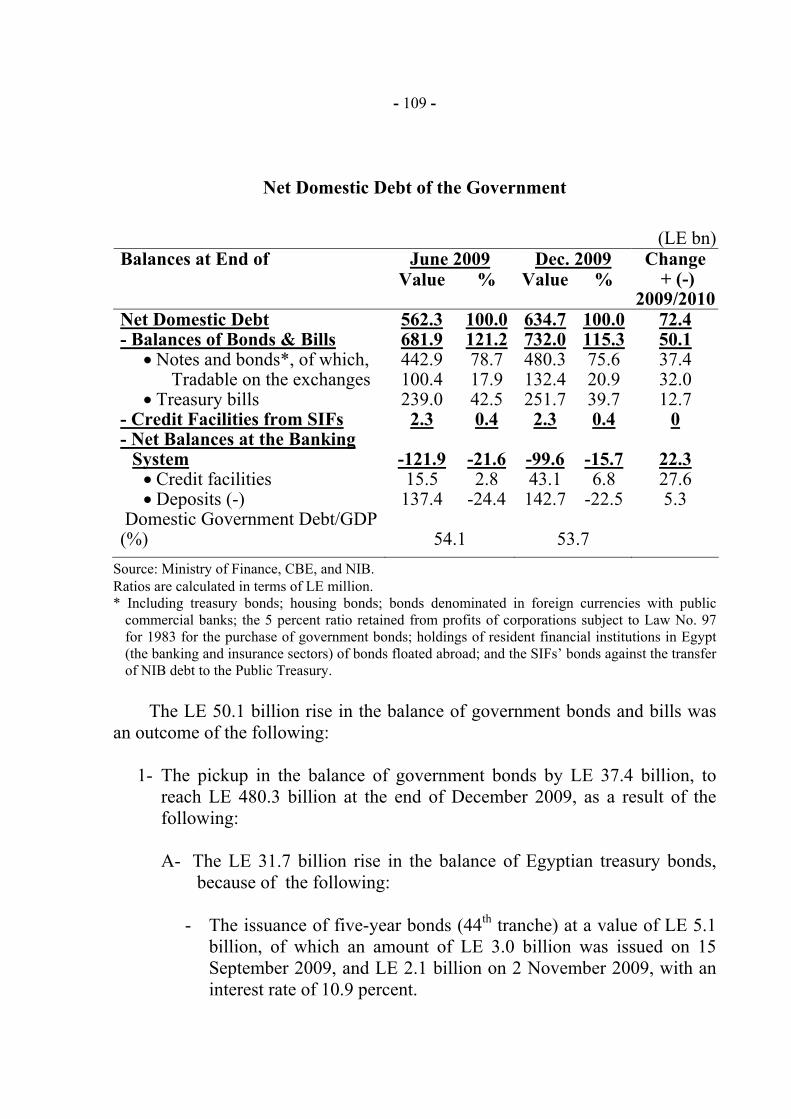
- 109 -
Net Domestic Debt of the Government
(LE bn) Balances at End of June 2009 Dec. 2009 Value % Value %
Change + (-)
2009/2010Net Domestic Debt 562.3 100.0 634.7 100.0 72.4 - Balances of Bonds & Bills 681.9 121.2 732.0 115.3 50.1
• Notes and bonds*, of which, 442.9 78.7 480.3 75.6 37.4 Tradable on the exchanges 100.4 17.9 132.4 20.9 32.0
• Treasury bills 239.0 42.5 251.7 39.7 12.7 - Credit Facilities from SIFs 2.3 0.4 2.3 0.4 0 - Net Balances at the Banking
System -121.9 -21.6 -99.6 -15.7 22.3 • Credit facilities 15.5 2.8 43.1 6.8 27.6 • Deposits (-) 137.4 -24.4 142.7 -22.5 5.3
Domestic Government Debt/GDP (%) 54.1 53.7
Source: Ministry of Finance, CBE, and NIB. Ratios are calculated in terms of LE million. * Including treasury bonds; housing bonds; bonds denominated in foreign currencies with public
commercial banks; the 5 percent ratio retained from profits of corporations subject to Law No. 97 for 1983 for the purchase of government bonds; holdings of resident financial institutions in Egypt (the banking and insurance sectors) of bonds floated abroad; and the SIFs’ bonds against the transfer of NIB debt to the Public Treasury.
The LE 50.1 billion rise in the balance of government bonds and bills was
an outcome of the following:
1- The pickup in the balance of government bonds by LE 37.4 billion, to reach LE 480.3 billion at the end of December 2009, as a result of the following:
A- The LE 31.7 billion rise in the balance of Egyptian treasury bonds,
because of the following:
- The issuance of five-year bonds (44th tranche) at a value of LE 5.1 billion, of which an amount of LE 3.0 billion was issued on 15 September 2009, and LE 2.1 billion on 2 November 2009, with an interest rate of 10.9 percent.
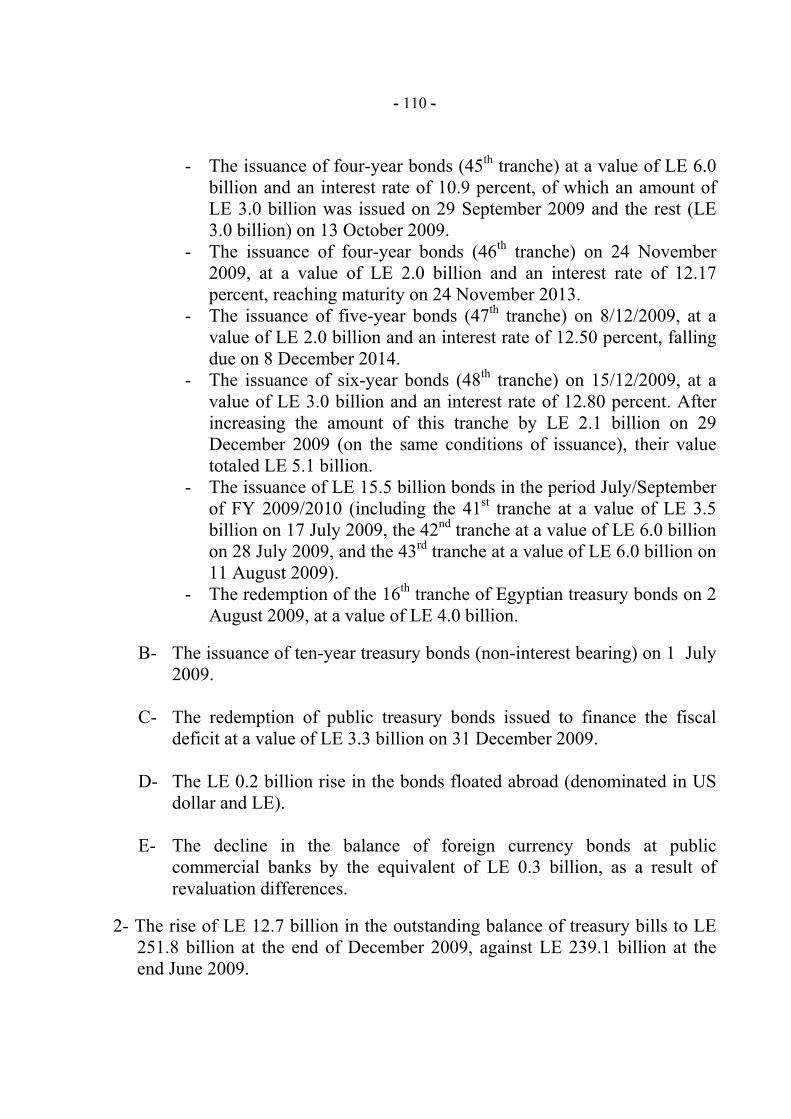
- 110 -
- The issuance of four-year bonds (45th tranche) at a value of LE 6.0 billion and an interest rate of 10.9 percent, of which an amount of LE 3.0 billion was issued on 29 September 2009 and the rest (LE 3.0 billion) on 13 October 2009.
- The issuance of four-year bonds (46th tranche) on 24 November 2009, at a value of LE 2.0 billion and an interest rate of 12.17 percent, reaching maturity on 24 November 2013.
- The issuance of five-year bonds (47th tranche) on 8/12/2009, at a value of LE 2.0 billion and an interest rate of 12.50 percent, falling due on 8 December 2014.
- The issuance of six-year bonds (48th tranche) on 15/12/2009, at a value of LE 3.0 billion and an interest rate of 12.80 percent. After increasing the amount of this tranche by LE 2.1 billion on 29 December 2009 (on the same conditions of issuance), their value totaled LE 5.1 billion.
- The issuance of LE 15.5 billion bonds in the period July/September of FY 2009/2010 (including the 41st tranche at a value of LE 3.5 billion on 17 July 2009, the 42nd tranche at a value of LE 6.0 billion on 28 July 2009, and the 43rd tranche at a value of LE 6.0 billion on 11 August 2009).
- The redemption of the 16th tranche of Egyptian treasury bonds on 2 August 2009, at a value of LE 4.0 billion.
B- The issuance of ten-year treasury bonds (non-interest bearing) on 1 July
2009. C- The redemption of public treasury bonds issued to finance the fiscal
deficit at a value of LE 3.3 billion on 31 December 2009.
D- The LE 0.2 billion rise in the bonds floated abroad (denominated in US dollar and LE).
E- The decline in the balance of foreign currency bonds at public
commercial banks by the equivalent of LE 0.3 billion, as a result of revaluation differences.
2- The rise of LE 12.7 billion in the outstanding balance of treasury bills to LE
251.8 billion at the end of December 2009, against LE 239.1 billion at the end June 2009.

- 111 -
4/2/2- Debt of Public Economic Authorities
The public economic authorities’ debt went up by LE 4.2 billion, posting LE 56.5 billion at the end of December 2009. The rise was traceable to the increase in their net borrowing from the banking system by LE 3.0 billion (because of the LE 2.9 billion decrease in their deposits and LE 0.1 billion rise in their loans), along with the rise of LE 1.2 billion in their borrowing from the NIB.
4/2/3- Resources and Uses of the National Investment Bank
The NIB's resources augmented by LE 4.6 billion during the reporting period, standing at LE 210.2 billion at the end of December 2009. The rise was an outcome of the following: the increase in the proceeds of investment certificates and the accumulated interest on the investment certificate group (A) by some LE 5.6 billion, in post office deposits by LE 3.5 billion, and the decrease in the resources of other local entities by LE 4.5 billion.
Net Domestic Debt of the Government
-200
-100
0100
200
300
400
500600
700
800
Dec.2008 June 2009 Dec.20090
10
20
30
40
50
60
70
Treasury BillsBondsNet Government Balances with the Banking SystemRatio of Government Debt / GDP
%LE bn
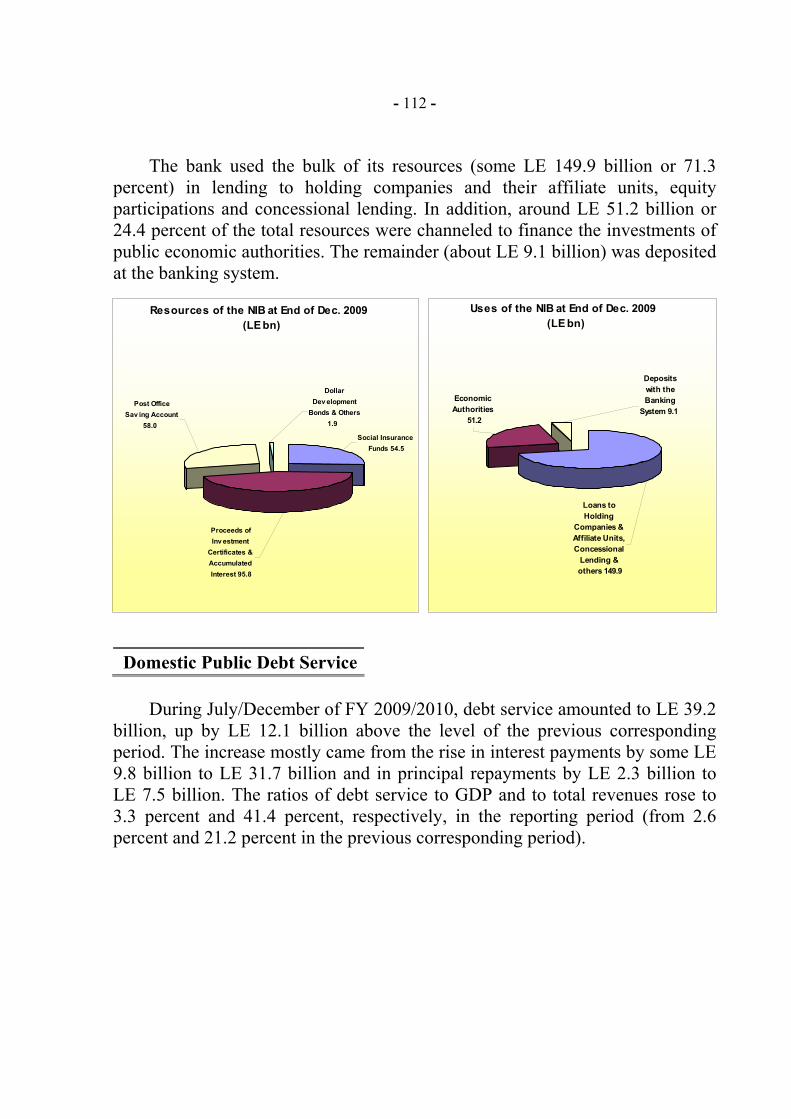
- 112 - The bank used the bulk of its resources (some LE 149.9 billion or 71.3 percent) in lending to holding companies and their affiliate units, equity participations and concessional lending. In addition, around LE 51.2 billion or 24.4 percent of the total resources were channeled to finance the investments of public economic authorities. The remainder (about LE 9.1 billion) was deposited at the banking system.
Domestic Public Debt Service
During July/December of FY 2009/2010, debt service amounted to LE 39.2 billion, up by LE 12.1 billion above the level of the previous corresponding period. The increase mostly came from the rise in interest payments by some LE 9.8 billion to LE 31.7 billion and in principal repayments by LE 2.3 billion to LE 7.5 billion. The ratios of debt service to GDP and to total revenues rose to 3.3 percent and 41.4 percent, respectively, in the reporting period (from 2.6 percent and 21.2 percent in the previous corresponding period).
Resources of the NIB at End of Dec. 2009 (LE bn)
Dollar Dev elopment
Bonds & Others 1.9
Social Insurance Funds 54.5
Proceeds of Inv estment
Certificates & Accumulated Interest 95.8
Post Office Sav ing Account
58.0
Uses of the NIB at End of Dec. 2009 (LE bn)
Loans to Holding
Companies & Affiliate Units, Concessional
Lending & others 149.9
Economic Authorities
51.2
Deposits with the Banking
System 9.1
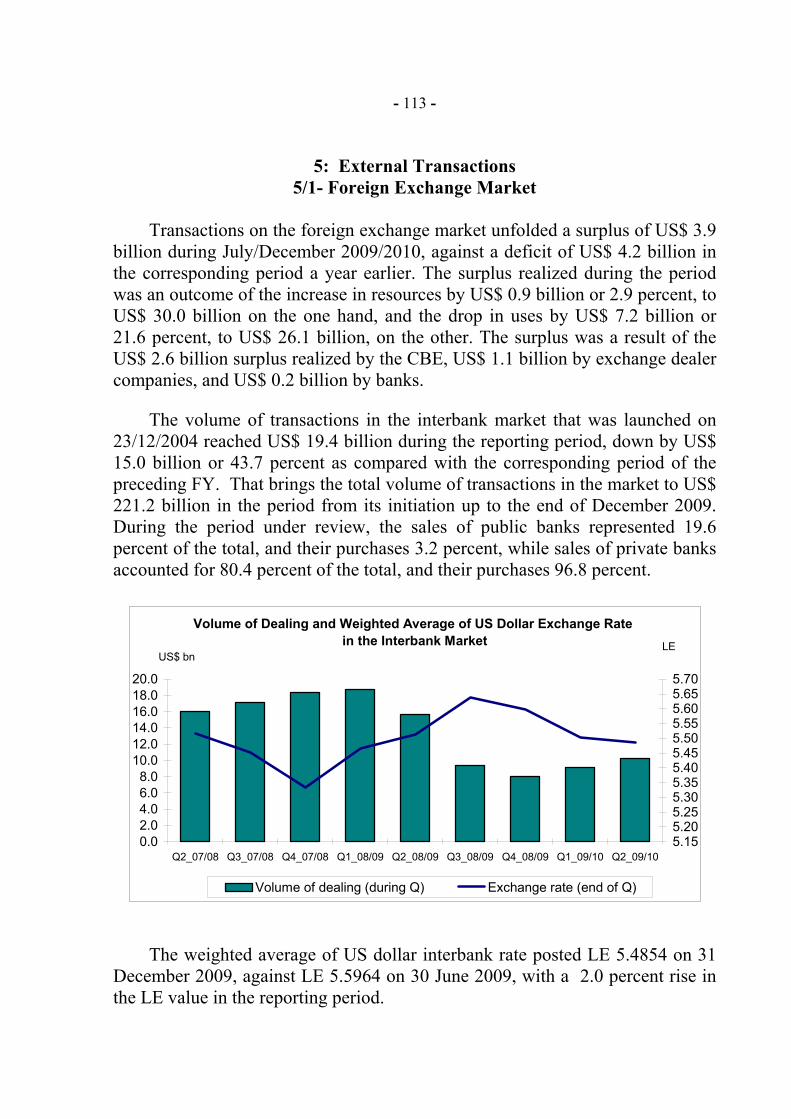
- 113 -
5: External Transactions
5/1- Foreign Exchange Market
Transactions on the foreign exchange market unfolded a surplus of US$ 3.9 billion during July/December 2009/2010, against a deficit of US$ 4.2 billion in the corresponding period a year earlier. The surplus realized during the period was an outcome of the increase in resources by US$ 0.9 billion or 2.9 percent, to US$ 30.0 billion on the one hand, and the drop in uses by US$ 7.2 billion or 21.6 percent, to US$ 26.1 billion, on the other. The surplus was a result of the US$ 2.6 billion surplus realized by the CBE, US$ 1.1 billion by exchange dealer companies, and US$ 0.2 billion by banks.
The volume of transactions in the interbank market that was launched on
23/12/2004 reached US$ 19.4 billion during the reporting period, down by US$ 15.0 billion or 43.7 percent as compared with the corresponding period of the preceding FY. That brings the total volume of transactions in the market to US$ 221.2 billion in the period from its initiation up to the end of December 2009. During the period under review, the sales of public banks represented 19.6 percent of the total, and their purchases 3.2 percent, while sales of private banks accounted for 80.4 percent of the total, and their purchases 96.8 percent.
Volume of Dealing and Weighted Average of US Dollar Exchange Rate in the Interbank Market
0.02.04.06.08.0
10.012.014.016.018.020.0
Q2_07/08 Q3_07/08 Q4_07/08 Q1_08/09 Q2_08/09 Q3_08/09 Q4_08/09 Q1_09/10 Q2_09/105.155.205.255.305.355.405.455.505.555.605.655.70
Volume of dealing (during Q) Exchange rate (end of Q)
LEUS$ bn
The weighted average of US dollar interbank rate posted LE 5.4854 on 31 December 2009, against LE 5.5964 on 30 June 2009, with a 2.0 percent rise in the LE value in the reporting period.
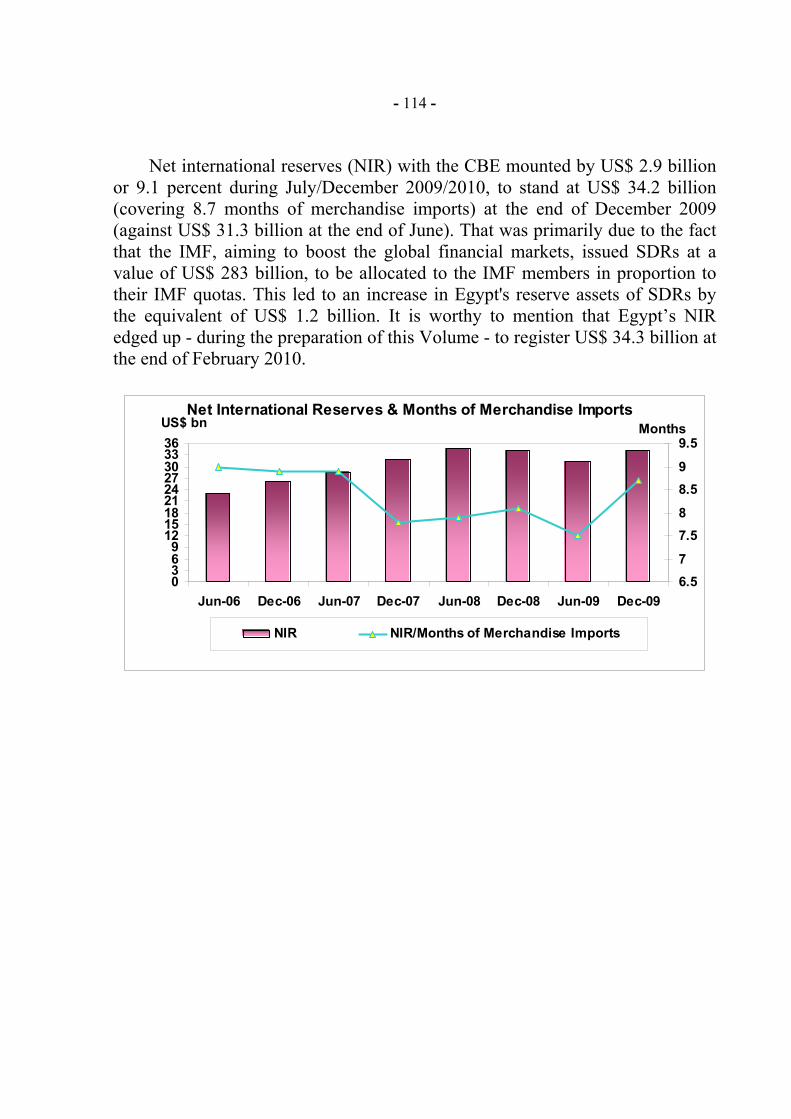
- 114 -
Net international reserves (NIR) with the CBE mounted by US$ 2.9 billion or 9.1 percent during July/December 2009/2010, to stand at US$ 34.2 billion (covering 8.7 months of merchandise imports) at the end of December 2009 (against US$ 31.3 billion at the end of June). That was primarily due to the fact that the IMF, aiming to boost the global financial markets, issued SDRs at a value of US$ 283 billion, to be allocated to the IMF members in proportion to their IMF quotas. This led to an increase in Egypt's reserve assets of SDRs by the equivalent of US$ 1.2 billion. It is worthy to mention that Egypt’s NIR edged up - during the preparation of this Volume - to register US$ 34.3 billion at the end of February 2010.
Net International Reserves & Months of Merchandise Imports
0369
121518212427303336
Jun-06 Dec-06 Jun-07 Dec-07 Jun-08 Dec-08 Jun-09 Dec-09
US$ bn
6.57
7.58
8.59
9.5
NIR NIR/Months of Merchandise Imports
Months

Overall Balance
-1.0
0.60.5
-1.0
-1.8
2.1
-2.0-1.5-1.0-0.50.00.51.01.52.02.5
Q1 Q2 Q3 Q4 Q1 Q2
2008/2009 2009/2010
US$ bn
- 115 -
5/2- Balance of Payments∗
In the first half of FY 2009/2010, transactions with the external world recorded an overall BOP surplus of US$ 2.6 billion (against an overall deficit of US$ 546.8 million in the corresponding period). The surplus caused an equivalent increase in the international reserves with the CBE. The deficit in the current account retreated by 48.9 percent to about US$ 1.3 billion (against a deficit of US$ 2.5 billion in the corresponding period of the previous FY which witnessed the aggravation of the global financial crisis). The capital and financial account achieved a net inflow of about US$ 3.3 billion (against about US$ 2.0 billion during the corresponding period). 5/2/1-Trade Balance
The volume of trade shrank by 16.4 percent, reaching US$ 34.9 billion
during the period July/December 2009/2010 (against US$ 41.8 billion during the corresponding period of the previous FY). This was an outcome of the retreat in merchandise exports and import payments, due to the weak external demand associated with the world economic slowdown triggered by the global financial crisis. ∗ Compiled in accordance with the Fifth Edition of the IMF’s Balance of Payments Manual, September 1993.
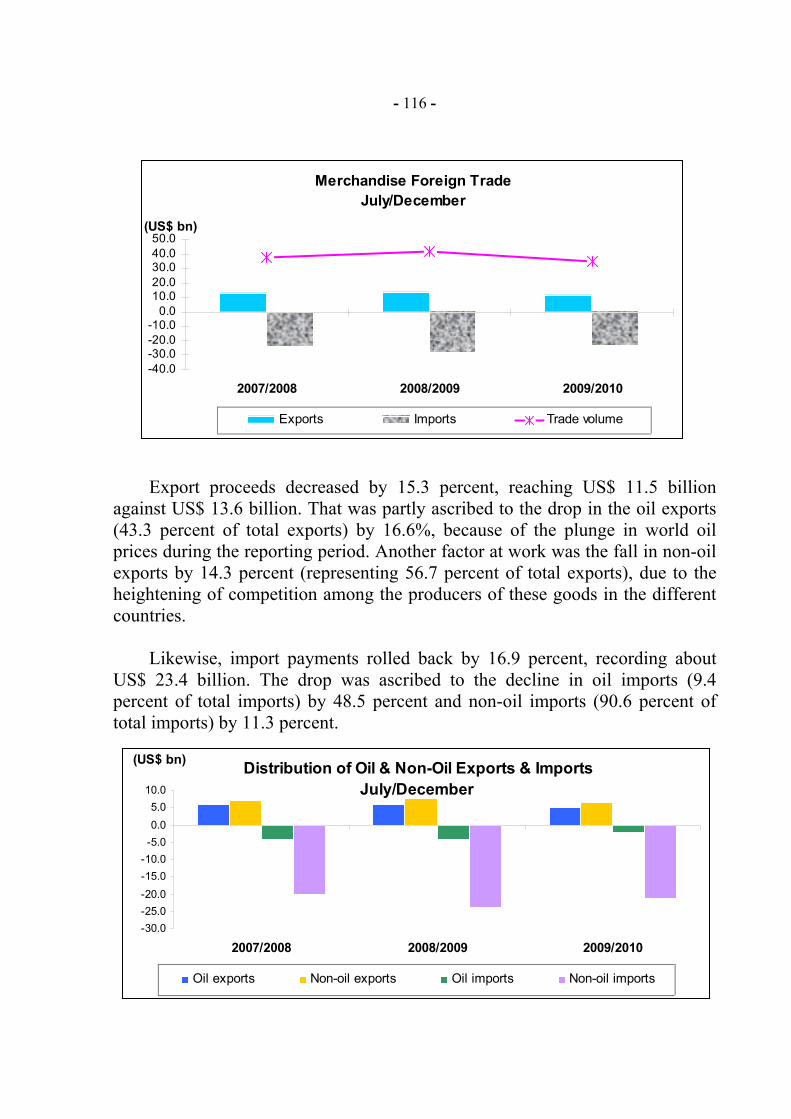
- 116 -
Export proceeds decreased by 15.3 percent, reaching US$ 11.5 billion against US$ 13.6 billion. That was partly ascribed to the drop in the oil exports (43.3 percent of total exports) by 16.6%, because of the plunge in world oil prices during the reporting period. Another factor at work was the fall in non-oil exports by 14.3 percent (representing 56.7 percent of total exports), due to the heightening of competition among the producers of these goods in the different countries.
Likewise, import payments rolled back by 16.9 percent, recording about US$ 23.4 billion. The drop was ascribed to the decline in oil imports (9.4 percent of total imports) by 48.5 percent and non-oil imports (90.6 percent of total imports) by 11.3 percent.
Merchandise Foreign TradeJuly/December
-40.0-30.0-20.0-10.0
0.010.020.030.040.050.0
2007/2008 2008/2009 2009/2010
(US$ bn)
Exports Imports Trade volume
Distribution of Oil & Non-Oil Exports & ImportsJuly/December
-30.0-25.0-20.0-15.0-10.0-5.00.05.0
10.0
2007/2008 2008/2009 2009/2010
(US$ bn)
Oil exports Non-oil exports Oil imports Non-oil imports
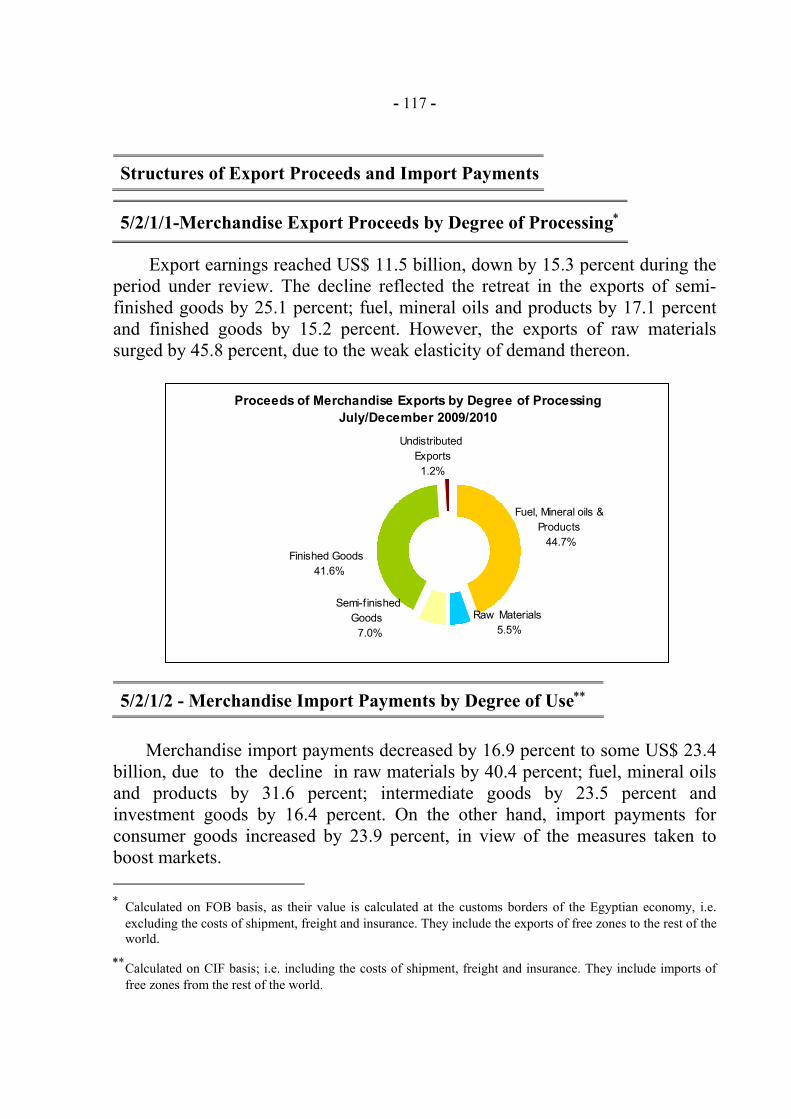
- 117 -
Structures of Export Proceeds and Import Payments 5/2/1/1-Merchandise Export Proceeds by Degree of Processing∗
Export earnings reached US$ 11.5 billion, down by 15.3 percent during the
period under review. The decline reflected the retreat in the exports of semi-finished goods by 25.1 percent; fuel, mineral oils and products by 17.1 percent and finished goods by 15.2 percent. However, the exports of raw materials surged by 45.8 percent, due to the weak elasticity of demand thereon. 5/2/1/2 - Merchandise Import Payments by Degree of Use∗∗
Merchandise import payments decreased by 16.9 percent to some US$ 23.4 billion, due to the decline in raw materials by 40.4 percent; fuel, mineral oils and products by 31.6 percent; intermediate goods by 23.5 percent and investment goods by 16.4 percent. On the other hand, import payments for consumer goods increased by 23.9 percent, in view of the measures taken to boost markets. ∗ Calculated on FOB basis, as their value is calculated at the customs borders of the Egyptian economy, i.e.
excluding the costs of shipment, freight and insurance. They include the exports of free zones to the rest of the world.
∗∗Calculated on CIF basis; i.e. including the costs of shipment, freight and insurance. They include imports of
free zones from the rest of the world.
Proceeds of Merchandise Exports by Degree of ProcessingJuly/December 2009/2010
Undistributed Exports1.2%
Fuel, Mineral oils & Products
44.7%
Raw Materials 5.5%
Semi-f inished Goods
7.0%
Finished Goods 41.6%
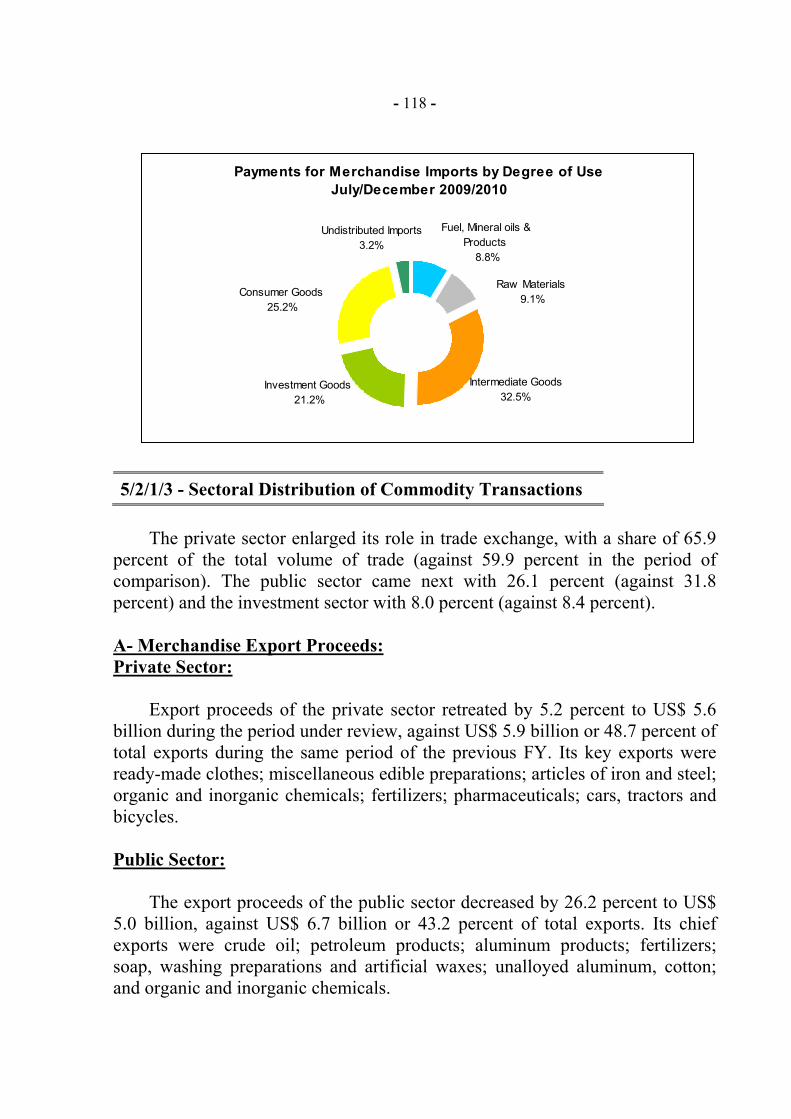
- 118 -
5/2/1/3 - Sectoral Distribution of Commodity Transactions
The private sector enlarged its role in trade exchange, with a share of 65.9
percent of the total volume of trade (against 59.9 percent in the period of comparison). The public sector came next with 26.1 percent (against 31.8 percent) and the investment sector with 8.0 percent (against 8.4 percent). A- Merchandise Export Proceeds: Private Sector:
Export proceeds of the private sector retreated by 5.2 percent to US$ 5.6 billion during the period under review, against US$ 5.9 billion or 48.7 percent of total exports during the same period of the previous FY. Its key exports were ready-made clothes; miscellaneous edible preparations; articles of iron and steel; organic and inorganic chemicals; fertilizers; pharmaceuticals; cars, tractors and bicycles. Public Sector:
The export proceeds of the public sector decreased by 26.2 percent to US$ 5.0 billion, against US$ 6.7 billion or 43.2 percent of total exports. Its chief exports were crude oil; petroleum products; aluminum products; fertilizers; soap, washing preparations and artificial waxes; unalloyed aluminum, cotton; and organic and inorganic chemicals.
Payments for Merchandise Imports by Degree of UseJuly/December 2009/2010
Undistributed Imports3.2%
Consumer Goods 25.2%
Investment Goods 21.2%
Fuel, Mineral oils & Products
8.8%
Raw Materials 9.1%
Intermediate Goods32.5%

- 119 -
Investment Sector:
The investment sector accounted for US$ 0.9 billion or 8.1 percent of total exports. Its main exports were oil products; ready-made clothes; organic and inorganic chemicals; cotton textiles; animal and vegetable fats, greases and oils and their products; and carpets and other floor coverings. B- Merchandise Import Payments: Private Sector:
The private sector’s import payments retreated by 8.8 percent, posting US$ 17.4 billion (against US$ 19.1 billion), representing 74.4 percent of total imports. The main imports were articles of iron and steel; pharmaceuticals; organic and inorganic chemicals; car spare parts and accessories and plastics and articles thereof. Public Sector:
The public sector’s import payments decreased by 36.4 percent to US$ 4.2 billion (against US$ 6.5 billion), accounting for 17.7 percent of total imports. Its key imports were oil products; animal and vegetable fats, greases and oils and products; wheat; motors, generators, transformers and parts thereof; crude oil; pumps and fans and pharmaceuticals. Investment Sector:
The sector's import payments scaled down by 28.0 percent to US$ 1.8 billion (against US$ 2.6 billion), representing 7.9 percent of total imports. Its main imports were crude oil; petroleum products; pumps, fans and their parts; animal and vegetable fats, greases and oils and products and car spare parts and accessories. The following chart demonstrates the sectoral distribution of imports and exports:
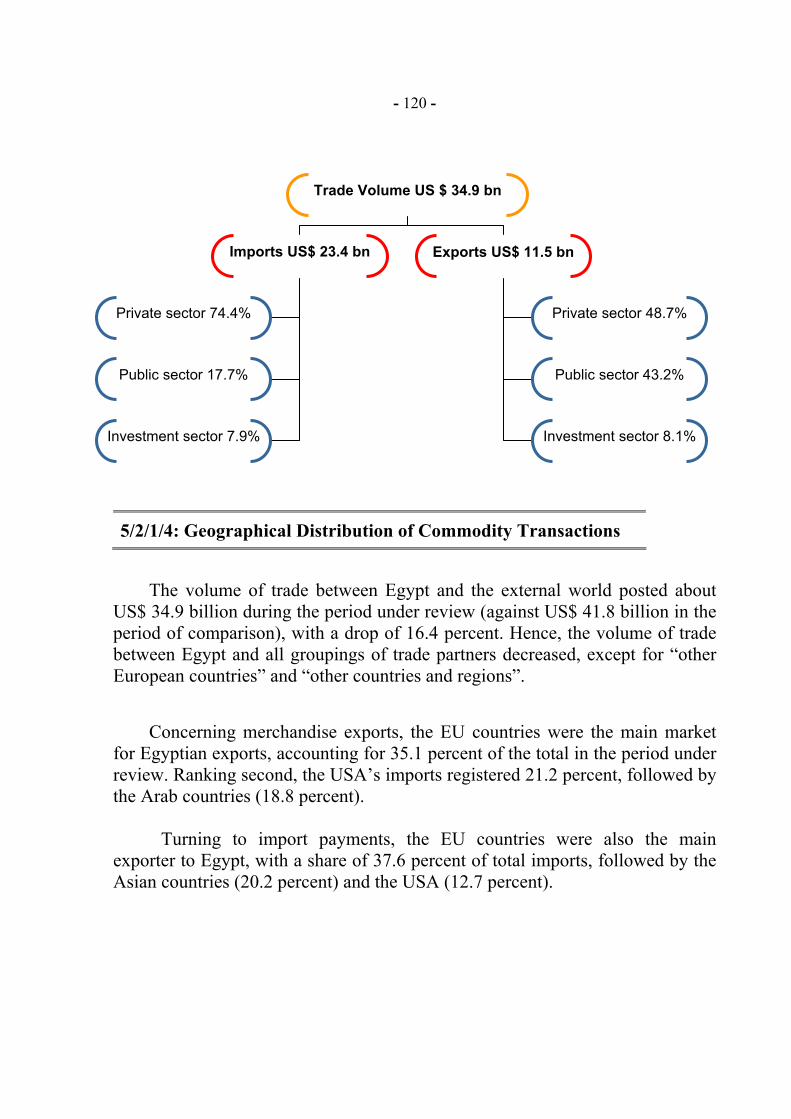
- 120 -
5/2/1/4: Geographical Distribution of Commodity Transactions
The volume of trade between Egypt and the external world posted about US$ 34.9 billion during the period under review (against US$ 41.8 billion in the period of comparison), with a drop of 16.4 percent. Hence, the volume of trade between Egypt and all groupings of trade partners decreased, except for “other European countries” and “other countries and regions”.
Concerning merchandise exports, the EU countries were the main market for Egyptian exports, accounting for 35.1 percent of the total in the period under review. Ranking second, the USA’s imports registered 21.2 percent, followed by the Arab countries (18.8 percent). Turning to import payments, the EU countries were also the main exporter to Egypt, with a share of 37.6 percent of total imports, followed by the Asian countries (20.2 percent) and the USA (12.7 percent).
Trade Volume US $ 34.9 bn
Imports US$ 23.4 bn Exports US$ 11.5 bn
Private sector 48.7%
Public sector 43.2%
Investment sector 8.1%
Private sector 74.4%
Public sector 17.7%
Investment sector 7.9%
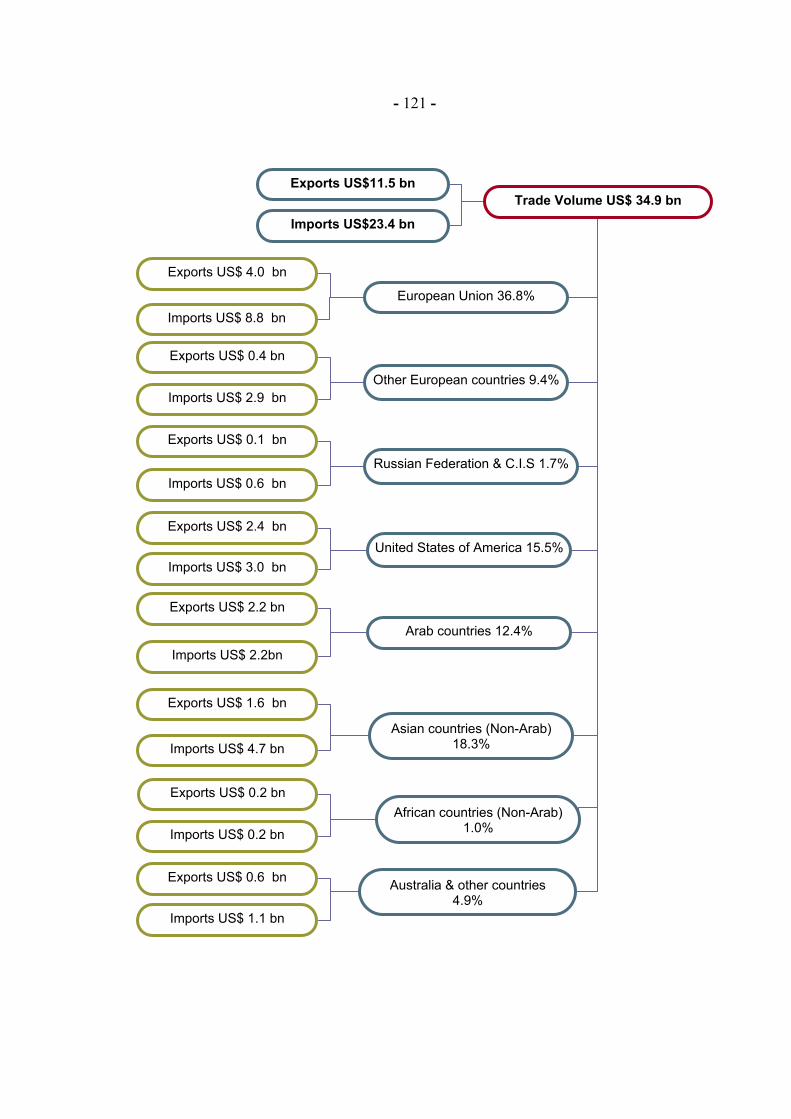
- 121 -
Trade Volume US$ 34.9 bn
European Union 36.8%
Other European countries 9.4%
Russian Federation & C.I.S 1.7%
United States of America 15.5%
Arab countries 12.4%
Asian countries (Non-Arab) 18.3%
African countries (Non-Arab) 1.0%
Australia & other countries 4.9%
Imports US$ 8.8 bn
Exports US$ 4.0 bn
Imports US$ 2.9 bn
Exports US$ 0.4 bn
Imports US$ 0.6 bn
Exports US$ 0.1 bn
Imports US$ 3.0 bn
Exports US$ 2.4 bn
Imports US$ 2.2bn
Exports US$ 2.2 bn
Imports US$ 4.7 bn
Exports US$ 1.6 bn
Imports US$ 0.2 bn
Exports US$ 0.2 bn
Imports US$ 1.1 bn
Exports US$ 0.6 bn
Exports US$11.5 bn
Imports US$23.4 bn
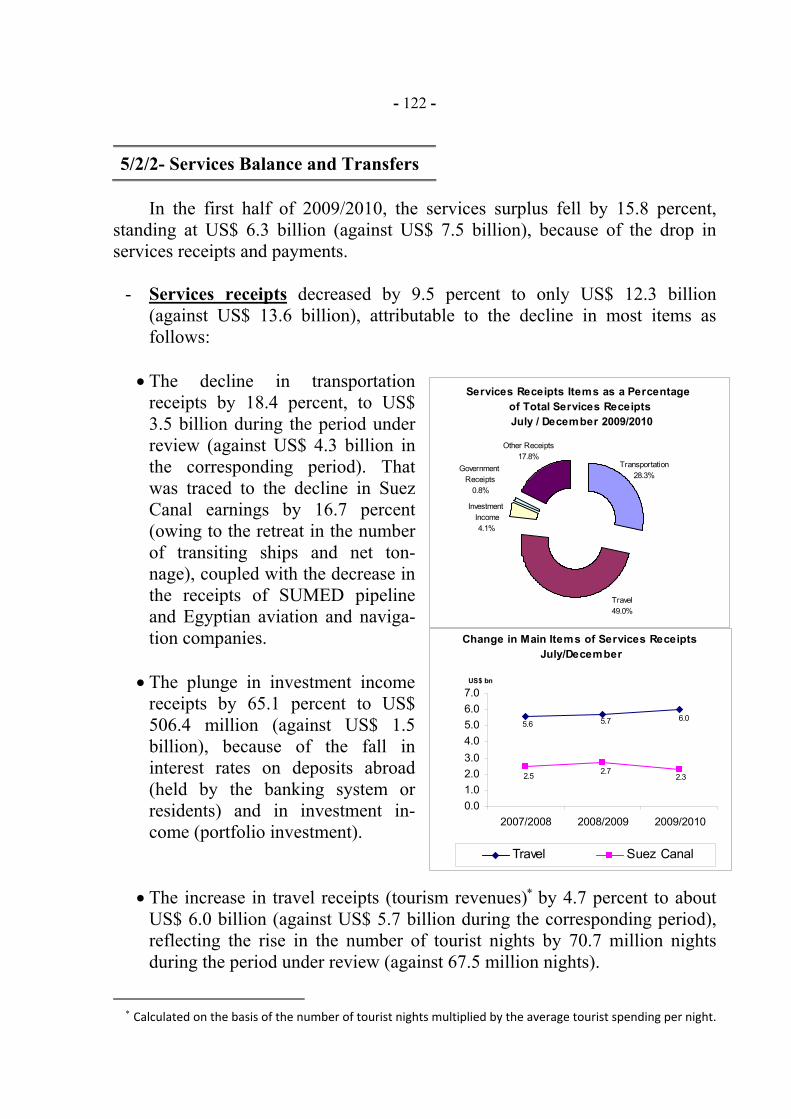
Services Receipts Items as a Percentage of Total Services Receipts July / December 2009/2010
Travel49.0%
Investment Income4.1%
Government Receipts
0.8%
Other Receipts17.8%
Transportation28.3%
Change in Main Items of Services Receipts July/December
5.6 5.7 6.0
2.5 2.72.3
0.01.02.03.04.05.06.07.0
2007/2008 2008/2009 2009/2010
US$ bn
Travel Suez Canal
- 122 - 5/2/2- Services Balance and Transfers
In the first half of 2009/2010, the services surplus fell by 15.8 percent,
standing at US$ 6.3 billion (against US$ 7.5 billion), because of the drop in services receipts and payments.
- Services receipts decreased by 9.5 percent to only US$ 12.3 billion
(against US$ 13.6 billion), attributable to the decline in most items as follows:
• The decline in transportation
receipts by 18.4 percent, to US$ 3.5 billion during the period under review (against US$ 4.3 billion in the corresponding period). That was traced to the decline in Suez Canal earnings by 16.7 percent (owing to the retreat in the number of transiting ships and net ton-nage), coupled with the decrease in the receipts of SUMED pipeline and Egyptian aviation and naviga-tion companies.
• The plunge in investment income
receipts by 65.1 percent to US$ 506.4 million (against US$ 1.5 billion), because of the fall in interest rates on deposits abroad (held by the banking system or residents) and in investment in-come (portfolio investment).
• The increase in travel receipts (tourism revenues)∗ by 4.7 percent to about US$ 6.0 billion (against US$ 5.7 billion during the corresponding period), reflecting the rise in the number of tourist nights by 70.7 million nights during the period under review (against 67.5 million nights).
∗ Calculated on the basis of the number of tourist nights multiplied by the average tourist spending per night.
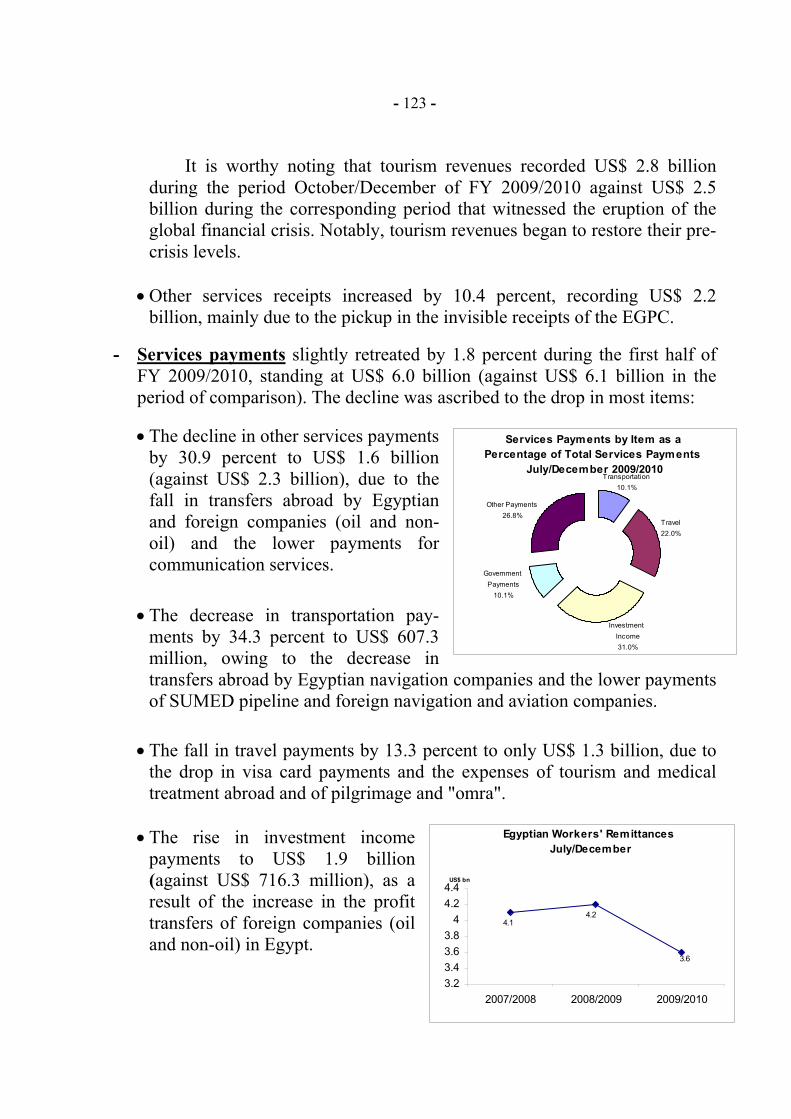
Services Payments by Item as a Percentage of Total Services Payments
July/December 2009/2010Transportation
10.1%
Travel22.0%
Investment Income31.0%
Government Payments
10.1%
Other Payments26.8%
Egyptian Workers' Remittances July/December
4.14.2
3.6
3.23.43.63.8
44.24.4
2007/2008 2008/2009 2009/2010
US$ bn
- 123 -
It is worthy noting that tourism revenues recorded US$ 2.8 billion during the period October/December of FY 2009/2010 against US$ 2.5 billion during the corresponding period that witnessed the eruption of the global financial crisis. Notably, tourism revenues began to restore their pre-crisis levels.
• Other services receipts increased by 10.4 percent, recording US$ 2.2 billion, mainly due to the pickup in the invisible receipts of the EGPC.
- Services payments slightly retreated by 1.8 percent during the first half of FY 2009/2010, standing at US$ 6.0 billion (against US$ 6.1 billion in the period of comparison). The decline was ascribed to the drop in most items: • The decline in other services payments
by 30.9 percent to US$ 1.6 billion (against US$ 2.3 billion), due to the fall in transfers abroad by Egyptian and foreign companies (oil and non-oil) and the lower payments for communication services.
• The decrease in transportation pay-ments by 34.3 percent to US$ 607.3 million, owing to the decrease in transfers abroad by Egyptian navigation companies and the lower payments of SUMED pipeline and foreign navigation and aviation companies.
• The fall in travel payments by 13.3 percent to only US$ 1.3 billion, due to the drop in visa card payments and the expenses of tourism and medical treatment abroad and of pilgrimage and "omra".
• The rise in investment income
payments to US$ 1.9 billion (against US$ 716.3 million), as a result of the increase in the profit transfers of foreign companies (oil and non-oil) in Egypt.
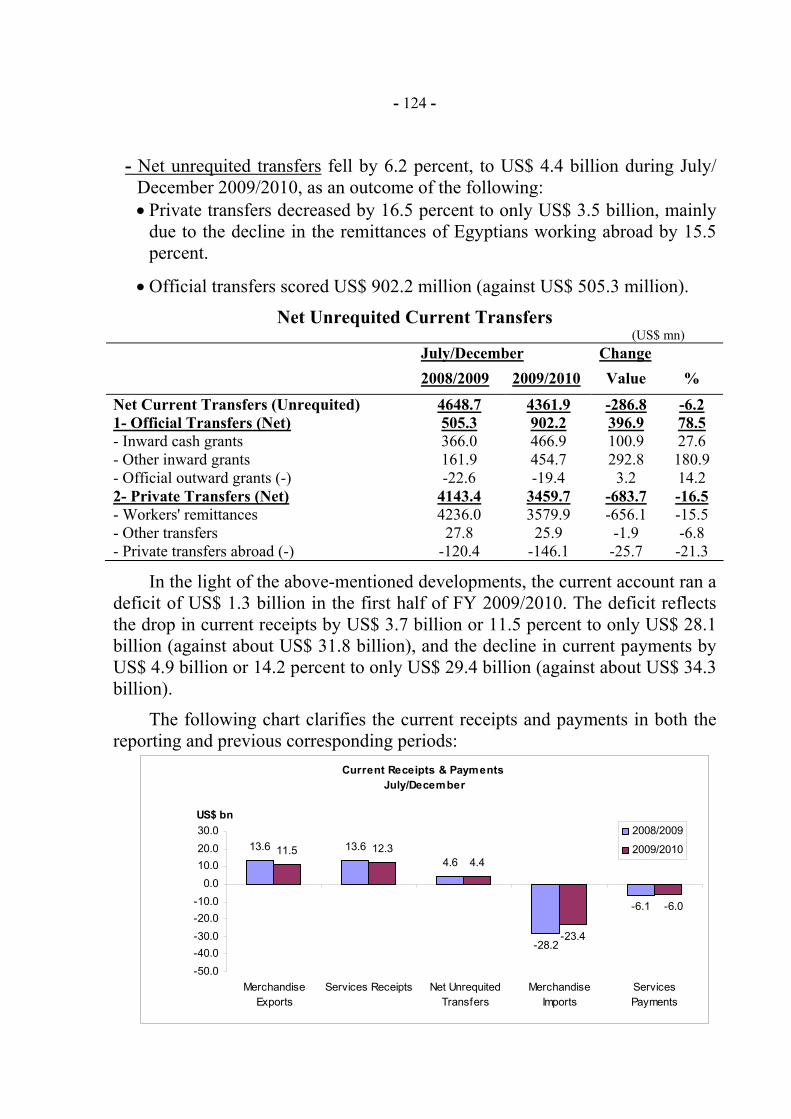
- 124 -
- Net unrequited transfers fell by 6.2 percent, to US$ 4.4 billion during July/ December 2009/2010, as an outcome of the following: • Private transfers decreased by 16.5 percent to only US$ 3.5 billion, mainly
due to the decline in the remittances of Egyptians working abroad by 15.5 percent.
• Official transfers scored US$ 902.2 million (against US$ 505.3 million).
Net Unrequited Current Transfers (US$ mn)
July/December Change 2008/2009 2009/2010 Value %
Net Current Transfers (Unrequited) 4648.7 4361.9 -286.8 -6.2 1- Official Transfers (Net) 505.3 902.2 396.9 78.5 - Inward cash grants 366.0 466.9 100.9 27.6 - Other inward grants 161.9 454.7 292.8 180.9 - Official outward grants (-) -22.6 -19.4 3.2 14.2 2- Private Transfers (Net) 4143.4 3459.7 -683.7 -16.5 - Workers' remittances 4236.0 3579.9 -656.1 -15.5 - Other transfers 27.8 25.9 -1.9 -6.8 - Private transfers abroad (-) -120.4 -146.1 -25.7 -21.3
In the light of the above-mentioned developments, the current account ran a deficit of US$ 1.3 billion in the first half of FY 2009/2010. The deficit reflects the drop in current receipts by US$ 3.7 billion or 11.5 percent to only US$ 28.1 billion (against about US$ 31.8 billion), and the decline in current payments by US$ 4.9 billion or 14.2 percent to only US$ 29.4 billion (against about US$ 34.3 billion).
The following chart clarifies the current receipts and payments in both the reporting and previous corresponding periods:
Current Receipts & Payments July/December
13.6 13.64.6
-28.2
-6.1
11.5 12.34.4
-23.4
-6.0
-50.0-40.0-30.0-20.0-10.0
0.010.020.030.0
MerchandiseExports
Services Receipts Net UnrequitedTransfers
MerchandiseImports
ServicesPayments
US$ bn2008/2009
2009/2010
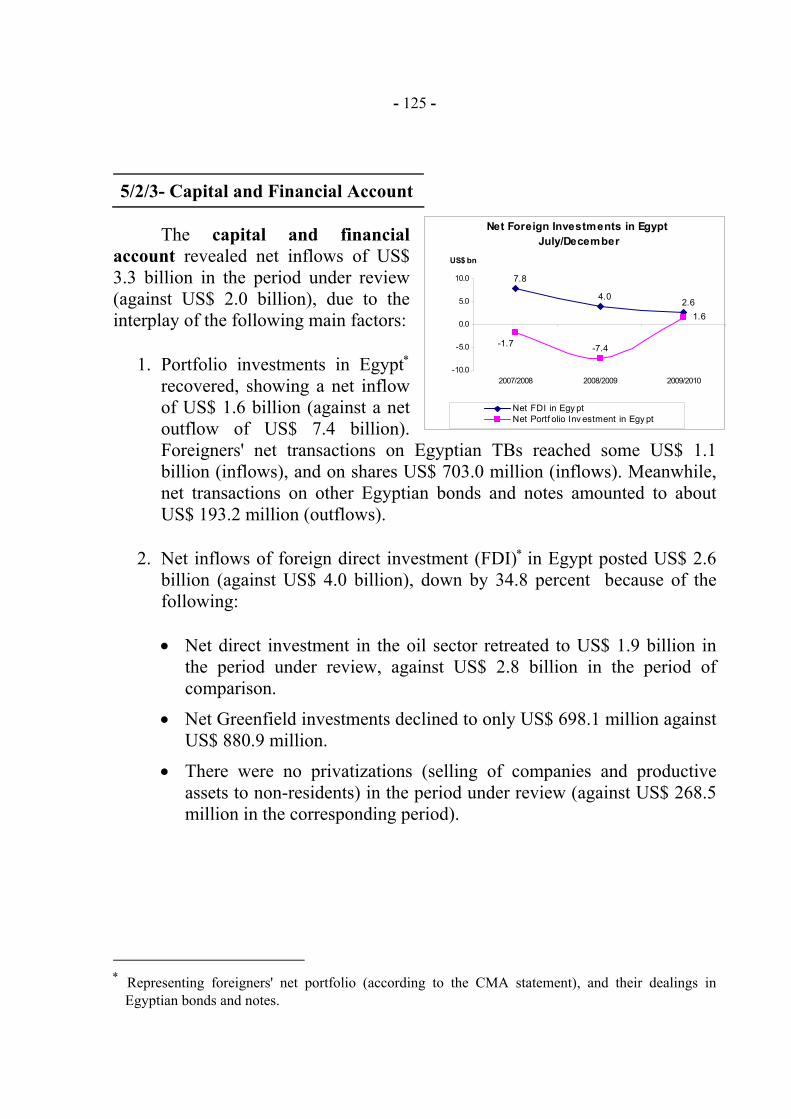
Net Foreign Investments in Egypt July/December
1.6
7.8
4.02.6
-7.4-1.7
-10.0
-5.0
0.0
5.0
10.0
2007/2008 2008/2009 2009/2010
US$ bn
Net FDI in Egy ptNet Portf olio Inv estment in Egy pt
- 125 -
5/2/3- Capital and Financial Account The capital and financial account revealed net inflows of US$ 3.3 billion in the period under review (against US$ 2.0 billion), due to the interplay of the following main factors:
1. Portfolio investments in Egypt∗
recovered, showing a net inflow of US$ 1.6 billion (against a net outflow of US$ 7.4 billion). Foreigners' net transactions on Egyptian TBs reached some US$ 1.1 billion (inflows), and on shares US$ 703.0 million (inflows). Meanwhile, net transactions on other Egyptian bonds and notes amounted to about US$ 193.2 million (outflows).
2. Net inflows of foreign direct investment (FDI)∗ in Egypt posted US$ 2.6
billion (against US$ 4.0 billion), down by 34.8 percent because of the following:
• Net direct investment in the oil sector retreated to US$ 1.9 billion in
the period under review, against US$ 2.8 billion in the period of comparison.
• Net Greenfield investments declined to only US$ 698.1 million against US$ 880.9 million.
• There were no privatizations (selling of companies and productive assets to non-residents) in the period under review (against US$ 268.5 million in the corresponding period).
∗ Representing foreigners' net portfolio (according to the CMA statement), and their dealings in
Egyptian bonds and notes.
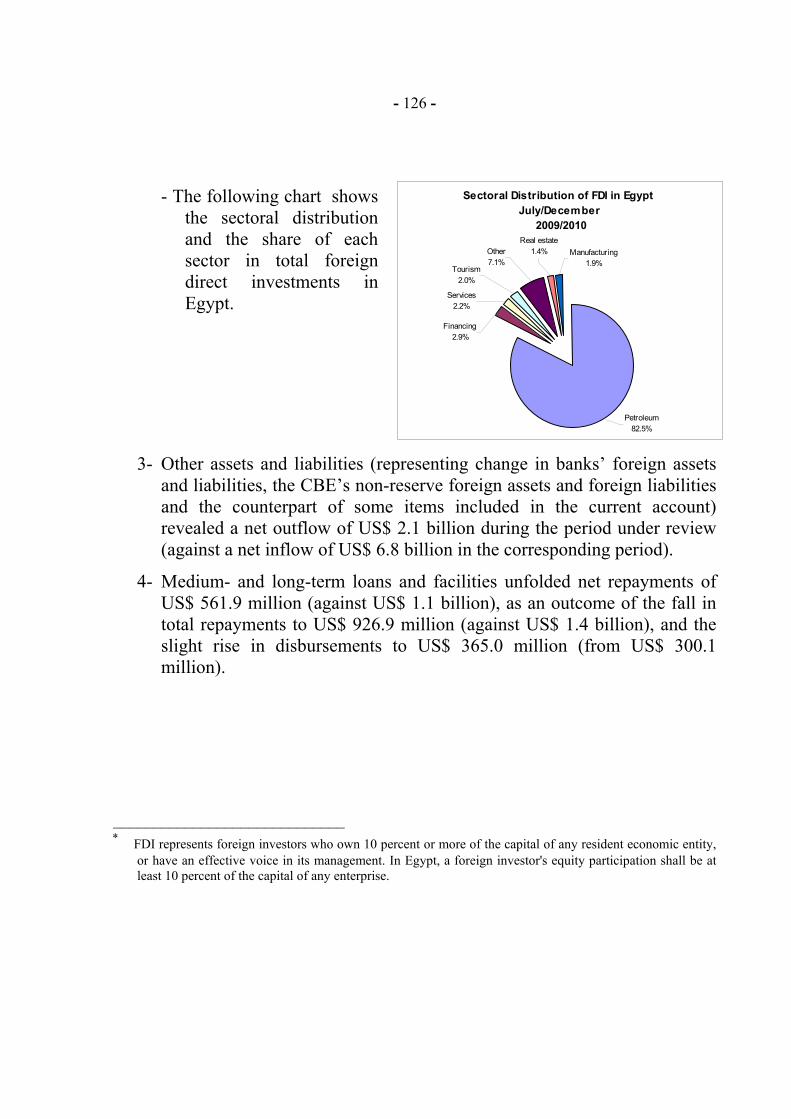
- 126 -
- The following chart shows
the sectoral distribution and the share of each sector in total foreign direct investments in Egypt.
3- Other assets and liabilities (representing change in banks’ foreign assets and liabilities, the CBE’s non-reserve foreign assets and foreign liabilities and the counterpart of some items included in the current account) revealed a net outflow of US$ 2.1 billion during the period under review (against a net inflow of US$ 6.8 billion in the corresponding period).
4- Medium- and long-term loans and facilities unfolded net repayments of US$ 561.9 million (against US$ 1.1 billion), as an outcome of the fall in total repayments to US$ 926.9 million (against US$ 1.4 billion), and the slight rise in disbursements to US$ 365.0 million (from US$ 300.1 million).
_____________________________ ∗ FDI represents foreign investors who own 10 percent or more of the capital of any resident economic entity,
or have an effective voice in its management. In Egypt, a foreign investor's equity participation shall be at least 10 percent of the capital of any enterprise.
Sectoral Distribution of FDI in Egypt July/December
2009/2010
Petroleum82.5%
Financing2.9%
Services2.2%
Tourism2.0%
Other7.1%
Manufacturing1.9%
Real estate1.4%
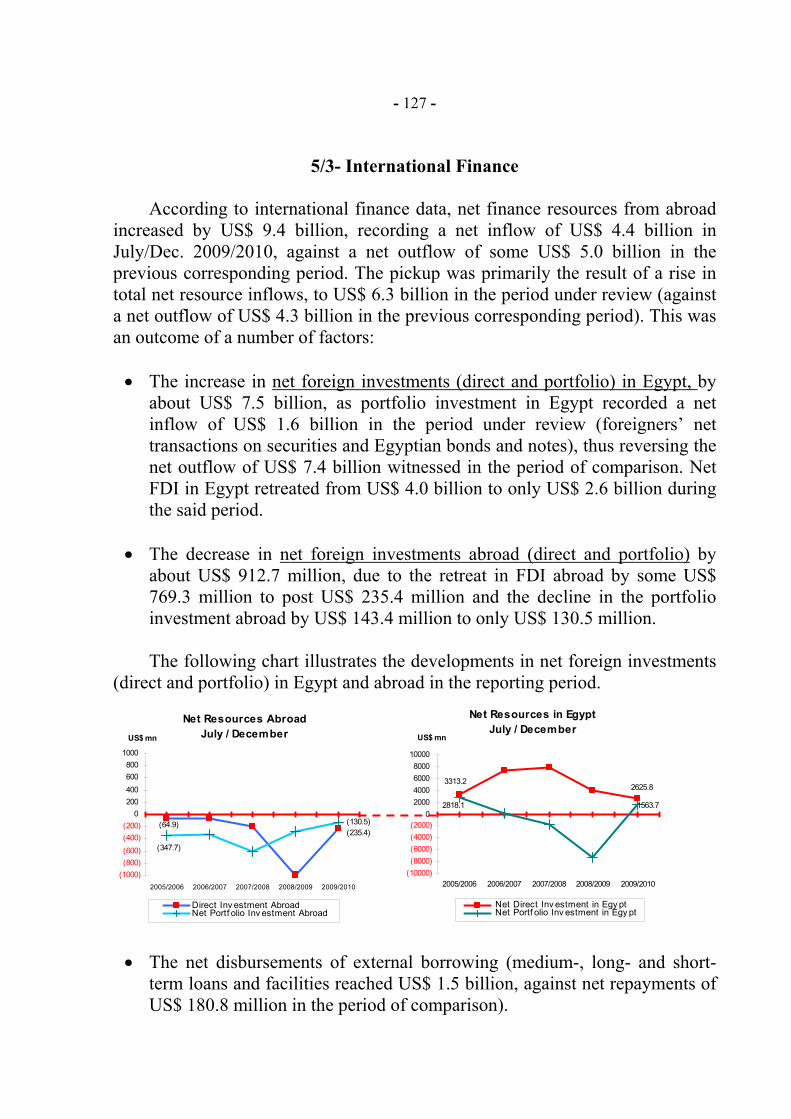
- 127 -
5/3- International Finance
According to international finance data, net finance resources from abroad
increased by US$ 9.4 billion, recording a net inflow of US$ 4.4 billion in July/Dec. 2009/2010, against a net outflow of some US$ 5.0 billion in the previous corresponding period. The pickup was primarily the result of a rise in total net resource inflows, to US$ 6.3 billion in the period under review (against a net outflow of US$ 4.3 billion in the previous corresponding period). This was an outcome of a number of factors:
• The increase in net foreign investments (direct and portfolio) in Egypt, by
about US$ 7.5 billion, as portfolio investment in Egypt recorded a net inflow of US$ 1.6 billion in the period under review (foreigners’ net transactions on securities and Egyptian bonds and notes), thus reversing the net outflow of US$ 7.4 billion witnessed in the period of comparison. Net FDI in Egypt retreated from US$ 4.0 billion to only US$ 2.6 billion during the said period.
• The decrease in net foreign investments abroad (direct and portfolio) by
about US$ 912.7 million, due to the retreat in FDI abroad by some US$ 769.3 million to post US$ 235.4 million and the decline in the portfolio investment abroad by US$ 143.4 million to only US$ 130.5 million.
The following chart illustrates the developments in net foreign investments
(direct and portfolio) in Egypt and abroad in the reporting period.
• The net disbursements of external borrowing (medium-, long- and short-term loans and facilities reached US$ 1.5 billion, against net repayments of US$ 180.8 million in the period of comparison).
Net Resources AbroadJuly / December
(64.9)(235.4)
(347.7)
(130.5)
(1000)(800)(600)(400)(200)
0200400600800
1000
2005/2006 2006/2007 2007/2008 2008/2009 2009/2010
US$ mn
Direct Inv estment AbroadNet Portf olio Inv estment Abroad
Net Resources in EgyptJuly / December
3313.22625.8
2818.1 1563.7
(10000)(8000)(6000)(4000)(2000)
02000400060008000
10000
2005/2006 2006/2007 2007/2008 2008/2009 2009/2010
US$ mn
Net Direct Inv estment in Egy pt Net Portf olio Inv estment in Egy pt
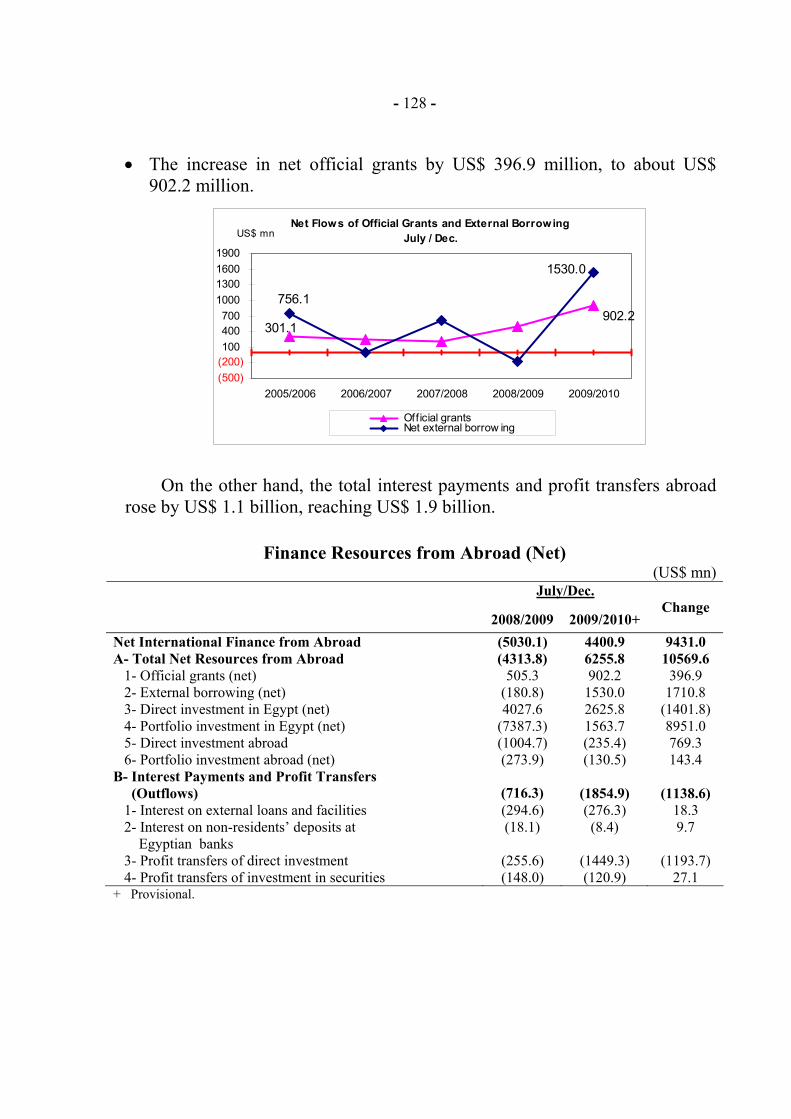
- 128 -
• The increase in net official grants by US$ 396.9 million, to about US$
902.2 million.
On the other hand, the total interest payments and profit transfers abroad rose by US$ 1.1 billion, reaching US$ 1.9 billion.
Finance Resources from Abroad (Net)
(US$ mn) July/Dec.
2008/2009 2009/2010+ Change
Net International Finance from Abroad (5030.1) 4400.9 9431.0 A- Total Net Resources from Abroad (4313.8) 6255.8 10569.6 1- Official grants (net) 505.3 902.2 396.9 2- External borrowing (net) (180.8) 1530.0 1710.8 3- Direct investment in Egypt (net) 4027.6 2625.8 (1401.8) 4- Portfolio investment in Egypt (net) (7387.3) 1563.7 8951.0 5- Direct investment abroad (1004.7) (235.4) 769.3 6- Portfolio investment abroad (net) (273.9) (130.5) 143.4 B- Interest Payments and Profit Transfers (Outflows) (716.3) (1854.9) (1138.6) 1- Interest on external loans and facilities (294.6) (276.3) 18.3 2- Interest on non-residents’ deposits at Egyptian banks
(18.1) (8.4) 9.7
3- Profit transfers of direct investment (255.6) (1449.3) (1193.7) 4- Profit transfers of investment in securities (148.0) (120.9) 27.1 + Provisional.
Net Flows of Official Grants and External BorrowingJuly / Dec.
301.1902.2
756.1
1530.0
(500)(200)100400700
1000130016001900
2005/2006 2006/2007 2007/2008 2008/2009 2009/2010
US$ mn
Official grants Net external borrow ing
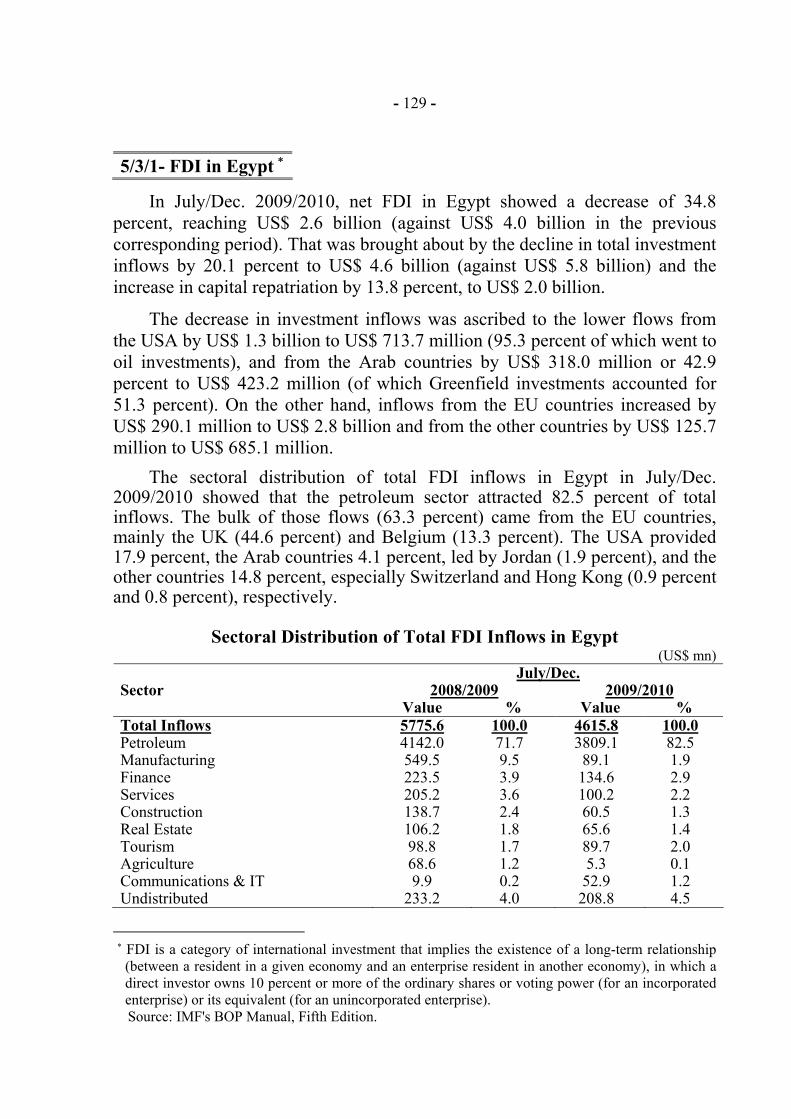
- 129 -
5/3/1- FDI in Egypt ∗
In July/Dec. 2009/2010, net FDI in Egypt showed a decrease of 34.8
percent, reaching US$ 2.6 billion (against US$ 4.0 billion in the previous corresponding period). That was brought about by the decline in total investment inflows by 20.1 percent to US$ 4.6 billion (against US$ 5.8 billion) and the increase in capital repatriation by 13.8 percent, to US$ 2.0 billion.
The decrease in investment inflows was ascribed to the lower flows from
the USA by US$ 1.3 billion to US$ 713.7 million (95.3 percent of which went to oil investments), and from the Arab countries by US$ 318.0 million or 42.9 percent to US$ 423.2 million (of which Greenfield investments accounted for 51.3 percent). On the other hand, inflows from the EU countries increased by US$ 290.1 million to US$ 2.8 billion and from the other countries by US$ 125.7 million to US$ 685.1 million.
The sectoral distribution of total FDI inflows in Egypt in July/Dec. 2009/2010 showed that the petroleum sector attracted 82.5 percent of total inflows. The bulk of those flows (63.3 percent) came from the EU countries, mainly the UK (44.6 percent) and Belgium (13.3 percent). The USA provided 17.9 percent, the Arab countries 4.1 percent, led by Jordan (1.9 percent), and the other countries 14.8 percent, especially Switzerland and Hong Kong (0.9 percent and 0.8 percent), respectively.
Sectoral Distribution of Total FDI Inflows in Egypt (US$ mn)
July/Dec. 2008/2009 2009/2010
Sector
Value % Value % Total Inflows 5775.6 100.0 4615.8 100.0 Petroleum 4142.0 71.7 3809.1 82.5 Manufacturing 549.5 9.5 89.1 1.9 Finance 223.5 3.9 134.6 2.9 Services 205.2 3.6 100.2 2.2 Construction 138.7 2.4 60.5 1.3 Real Estate 106.2 1.8 65.6 1.4 Tourism 98.8 1.7 89.7 2.0 Agriculture 68.6 1.2 5.3 0.1 Communications & IT 9.9 0.2 52.9 1.2 Undistributed 233.2 4.0 208.8 4.5
∗ FDI is a category of international investment that implies the existence of a long-term relationship (between a resident in a given economy and an enterprise resident in another economy), in which a direct investor owns 10 percent or more of the ordinary shares or voting power (for an incorporated enterprise) or its equivalent (for an unincorporated enterprise).
Source: IMF's BOP Manual, Fifth Edition.
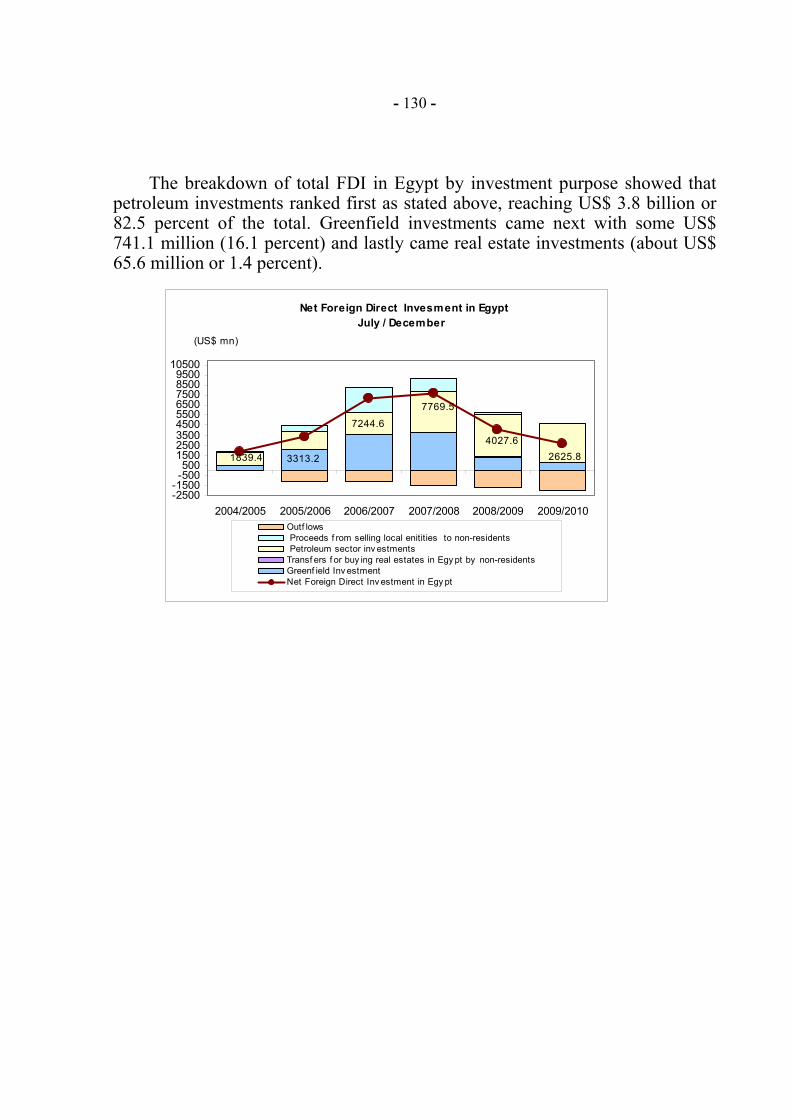
- 130 -
The breakdown of total FDI in Egypt by investment purpose showed that petroleum investments ranked first as stated above, reaching US$ 3.8 billion or 82.5 percent of the total. Greenfield investments came next with some US$ 741.1 million (16.1 percent) and lastly came real estate investments (about US$ 65.6 million or 1.4 percent).
1839.4 3313.2
7244.6
7769.5
4027.62625.8
-2500-1500-500500
150025003500450055006500750085009500
10500
2004/2005 2005/2006 2006/2007 2007/2008 2008/2009 2009/2010Outf lows Proceeds f rom selling local enitities to non-residents Petroleum sector inv estments Transf ers f or buy ing real estates in Egy pt by non-residents Greenf ield Inv estment Net Foreign Direct Inv estment in Egy pt
Net Foreign Direct Invesment in EgyptJuly / December
(US$ mn)
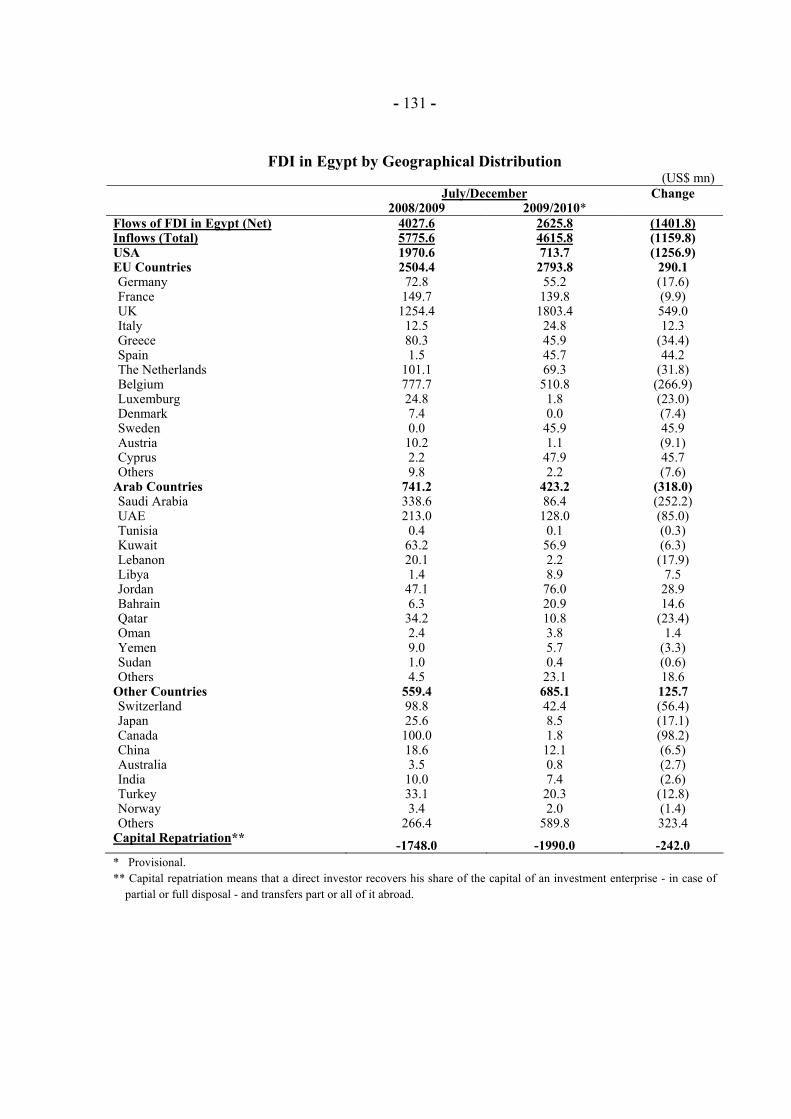
- 131 -
FDI in Egypt by Geographical Distribution
(US$ mn) July/December
2008/2009 2009/2010* Change
Flows of FDI in Egypt (Net) 4027.6 2625.8 (1401.8) Inflows (Total) 5775.6 4615.8 (1159.8) USA 1970.6 713.7 (1256.9) EU Countries 2504.4 2793.8 290.1 Germany 72.8 55.2 (17.6) France 149.7 139.8 (9.9) UK 1254.4 1803.4 549.0 Italy 12.5 24.8 12.3 Greece 80.3 45.9 (34.4) Spain 1.5 45.7 44.2 The Netherlands 101.1 69.3 (31.8) Belgium 777.7 510.8 (266.9) Luxemburg 24.8 1.8 (23.0) Denmark 7.4 0.0 (7.4) Sweden 0.0 45.9 45.9 Austria 10.2 1.1 (9.1) Cyprus 2.2 47.9 45.7 Others 9.8 2.2 (7.6)
Arab Countries 741.2 423.2 (318.0) Saudi Arabia 338.6 86.4 (252.2) UAE 213.0 128.0 (85.0) Tunisia 0.4 0.1 (0.3) Kuwait 63.2 56.9 (6.3) Lebanon 20.1 2.2 (17.9) Libya 1.4 8.9 7.5 Jordan 47.1 76.0 28.9 Bahrain 6.3 20.9 14.6 Qatar 34.2 10.8 (23.4) Oman 2.4 3.8 1.4 Yemen 9.0 5.7 (3.3) Sudan 1.0 0.4 (0.6) Others 4.5 23.1 18.6
Other Countries 559.4 685.1 125.7 Switzerland 98.8 42.4 (56.4) Japan 25.6 8.5 (17.1) Canada 100.0 1.8 (98.2) China 18.6 12.1 (6.5) Australia 3.5 0.8 (2.7) India 10.0 7.4 (2.6) Turkey 33.1 20.3 (12.8) Norway 3.4 2.0 (1.4) Others 266.4 589.8 323.4
Capital Repatriation** -1748.0 -1990.0 -242.0 * Provisional. ** Capital repatriation means that a direct investor recovers his share of the capital of an investment enterprise - in case of
partial or full disposal - and transfers part or all of it abroad.
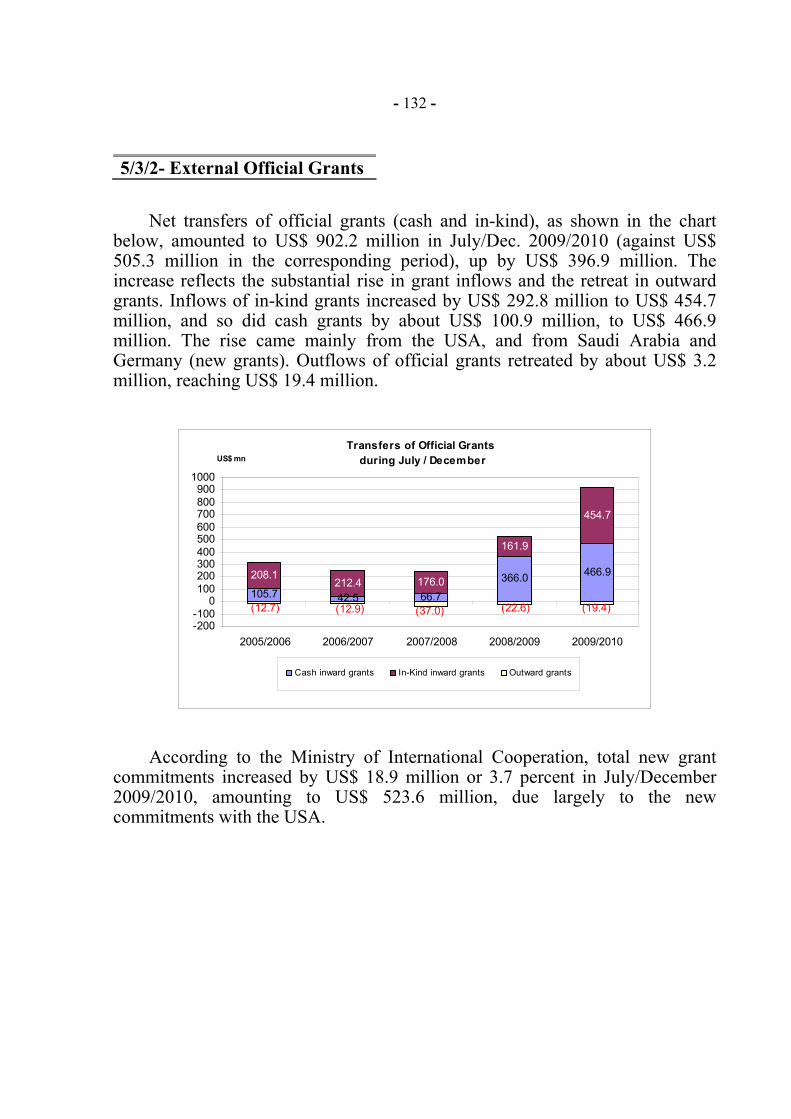
- 132 -
5/3/2- External Official Grants
Net transfers of official grants (cash and in-kind), as shown in the chart below, amounted to US$ 902.2 million in July/Dec. 2009/2010 (against US$ 505.3 million in the corresponding period), up by US$ 396.9 million. The increase reflects the substantial rise in grant inflows and the retreat in outward grants. Inflows of in-kind grants increased by US$ 292.8 million to US$ 454.7 million, and so did cash grants by about US$ 100.9 million, to US$ 466.9 million. The rise came mainly from the USA, and from Saudi Arabia and Germany (new grants). Outflows of official grants retreated by about US$ 3.2 million, reaching US$ 19.4 million.
According to the Ministry of International Cooperation, total new grant commitments increased by US$ 18.9 million or 3.7 percent in July/December 2009/2010, amounting to US$ 523.6 million, due largely to the new commitments with the USA.
105.7 42.5 66.7
366.0 466.9208.1212.4 176.0
161.9
454.7
(37.0) (22.6) (19.4)(12.9)(12.7)-200-100
0100200300400500600700800900
1000
2005/2006 2006/2007 2007/2008 2008/2009 2009/2010
Cash inward grants In-Kind inward grants Outward grants
Transfers of Official Grants during July / DecemberUS$ mn
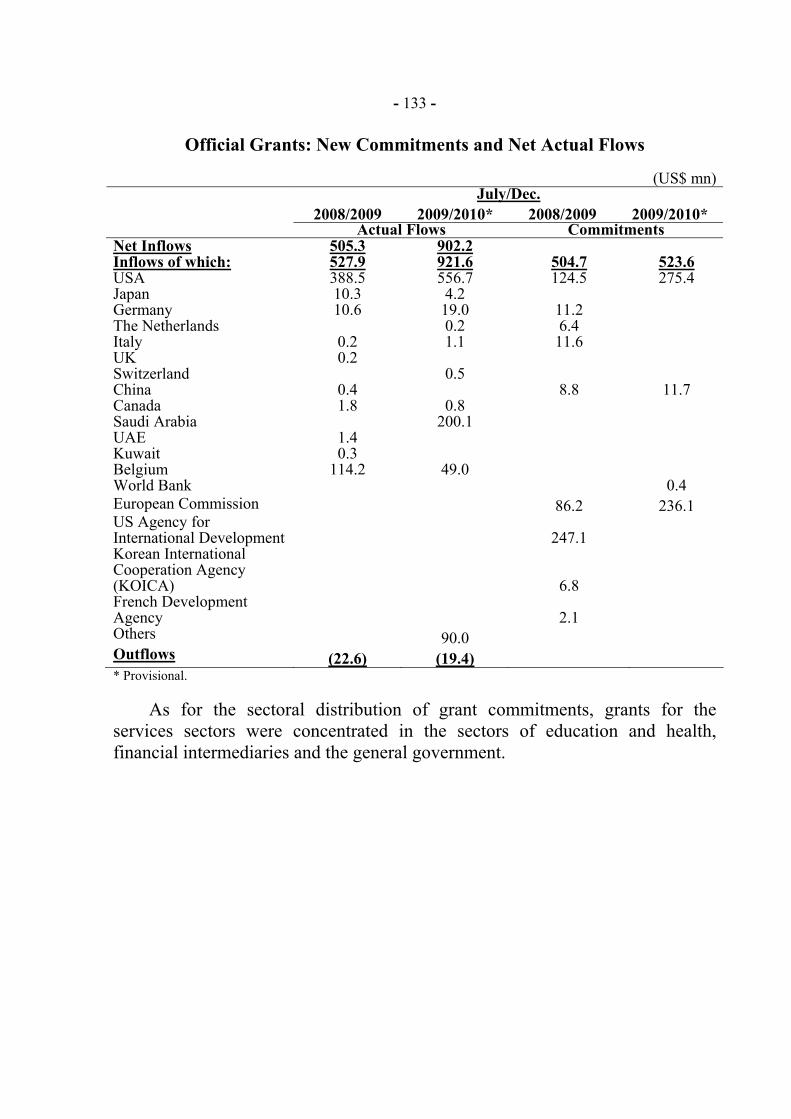
- 133 -
Official Grants: New Commitments and Net Actual Flows
(US$ mn) July/Dec.
2008/2009 2009/2010* 2008/2009 2009/2010* Actual Flows Commitments
Net Inflows 505.3 902.2 Inflows of which: 527.9 921.6 504.7 523.6 USA 388.5 556.7 124.5 275.4 Japan 10.3 4.2 Germany 10.6 19.0 11.2 The Netherlands 0.2 6.4 Italy 0.2 1.1 11.6 UK 0.2 Switzerland 0.5 China 0.4 8.8 11.7 Canada 1.8 0.8 Saudi Arabia 200.1 UAE 1.4 Kuwait 0.3 Belgium 114.2 49.0 World Bank 0.4 European Commission 86.2 236.1 US Agency for International Development 247.1 Korean International Cooperation Agency (KOICA) 6.8 French Development Agency 2.1 Others 90.0 Outflows (22.6) (19.4) * Provisional.
As for the sectoral distribution of grant commitments, grants for the services sectors were concentrated in the sectors of education and health, financial intermediaries and the general government.

- 134 -
Breakdown of Official Grant Commitments (By Beneficiary)
(US$ mn) July/Dec.
2008/2009 % 2009/2010 % ChangeTotal 504.7 100.0 523.6 100.0 18.9 Productive Sectors 44.3 8.8 (44.3) Agriculture and irrigation 2.1 0.4 (2.1) Energy & electricity 42.2 8.4 (42.2) Services Sectors 460.4 91.2 523.6 100.0 63.2 Transportation, communications and IT & Suez Canal 11.6 2.3 0.0 0.0 (11.6) Financial intermediaries & supporting services 14.3 2.8 15.3 2.9 1.0 Real estates 57.0 11.3 0.0 0.0 (57.0) General government 30.7 6.1 13.0 2.5 (17.6) Education and health 91.0 18.0 61.3 11.7 (29.7) Others 255.8 50.7 433.9 82.9 178.1
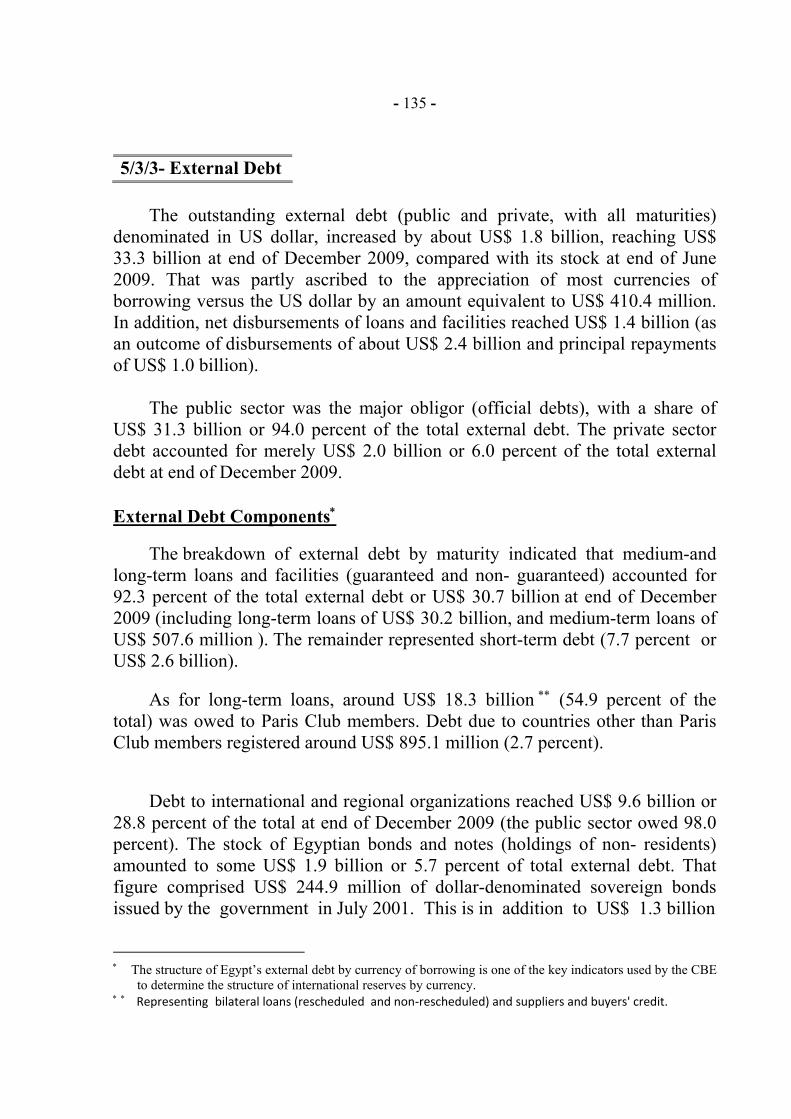
- 135 -
5/3/3- External Debt
The outstanding external debt (public and private, with all maturities)
denominated in US dollar, increased by about US$ 1.8 billion, reaching US$ 33.3 billion at end of December 2009, compared with its stock at end of June 2009. That was partly ascribed to the appreciation of most currencies of borrowing versus the US dollar by an amount equivalent to US$ 410.4 million. In addition, net disbursements of loans and facilities reached US$ 1.4 billion (as an outcome of disbursements of about US$ 2.4 billion and principal repayments of US$ 1.0 billion). The public sector was the major obligor (official debts), with a share of US$ 31.3 billion or 94.0 percent of the total external debt. The private sector debt accounted for merely US$ 2.0 billion or 6.0 percent of the total external debt at end of December 2009. External Debt Components∗
The breakdown of external debt by maturity indicated that medium-and long-term loans and facilities (guaranteed and non- guaranteed) accounted for 92.3 percent of the total external debt or US$ 30.7 billion at end of December 2009 (including long-term loans of US$ 30.2 billion, and medium-term loans of US$ 507.6 million .) The remainder represented short-term debt (7.7 percent or US$ 2.6 billion).
As for long-term loans, around US$ 18.3 billion ∗∗ (54.9 percent of the total) was owed to Paris Club members. Debt due to countries other than Paris Club members registered around US$ 895.1 million (2.7 percent).
Debt to international and regional organizations reached US$ 9.6 billion or
28.8 percent of the total at end of December 2009 (the public sector owed 98.0 percent). The stock of Egyptian bonds and notes (holdings of non- residents) amounted to some US$ 1.9 billion or 5.7 percent of total external debt. That figure comprised US$ 244.9 million of dollar-denominated sovereign bonds issued by the government in July 2001. This is in addition to US$ 1.3 billion ∗ The structure of Egypt’s external debt by currency of borrowing is one of the key indicators used by the CBE
to determine the structure of international reserves by currency. bilateral loans (rescheduled and non‐rescheduled) and suppliers and buyers' credit. Representing ∗ ∗
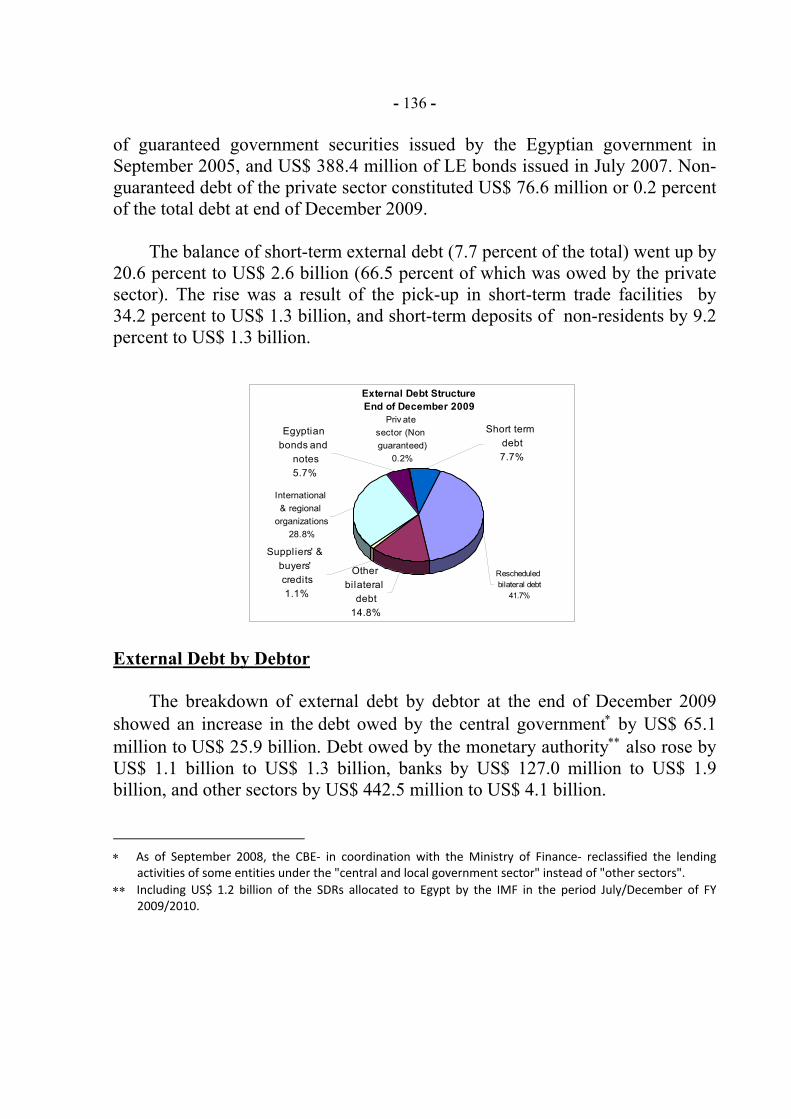
- 136 - of guaranteed government securities issued by the Egyptian government in September 2005, and US$ 388.4 million of LE bonds issued in July 2007. Non- guaranteed debt of the private sector constituted US$ 76.6 million or 0.2 percent of the total debt at end of December 2009.
The balance of short-term external debt (7.7 percent of the total) went up by 20.6 percent to US$ 2.6 billion (66.5 percent of which was owed by the private sector). The rise was a result of the pick-up in short-term trade facilities by 34.2 percent to US$ 1.3 billion, and short-term deposits of non-residents by 9.2 percent to US$ 1.3 billion.
External Debt by Debtor
The breakdown of external debt by debtor at the end of December 2009 showed an increase in the debt owed by the central government∗ by US$ 65.1 million to US$ 25.9 billion. Debt owed by the monetary authority ∗∗ also rose by US$ 1.1 billion to US$ 1.3 billion, banks by US$ 127.0 million to US$ 1.9 billion, and other sectors by US$ 442.5 million to US$ 4.1 billion.
∗ As of September 2008, the CBE‐ in coordination with the Ministry of Finance‐ reclassified the lending
activities of some entities under the "central and local government sector" instead of "other sectors". ∗∗ Including US$ 1.2 billion of the SDRs allocated to Egypt by the IMF in the period July/December of FY
2009/2010.
External Debt StructureEnd of December 2009
Short term debt7.7%
Priv ate sector (Non guaranteed)
0.2%
Suppliers' & buyers' credits1.1%
Other bilateral
debt14.8%
Rescheduled bilateral debt
41.7%
International & regional
organizations28.8%
Egyptian bonds and
notes5.7%
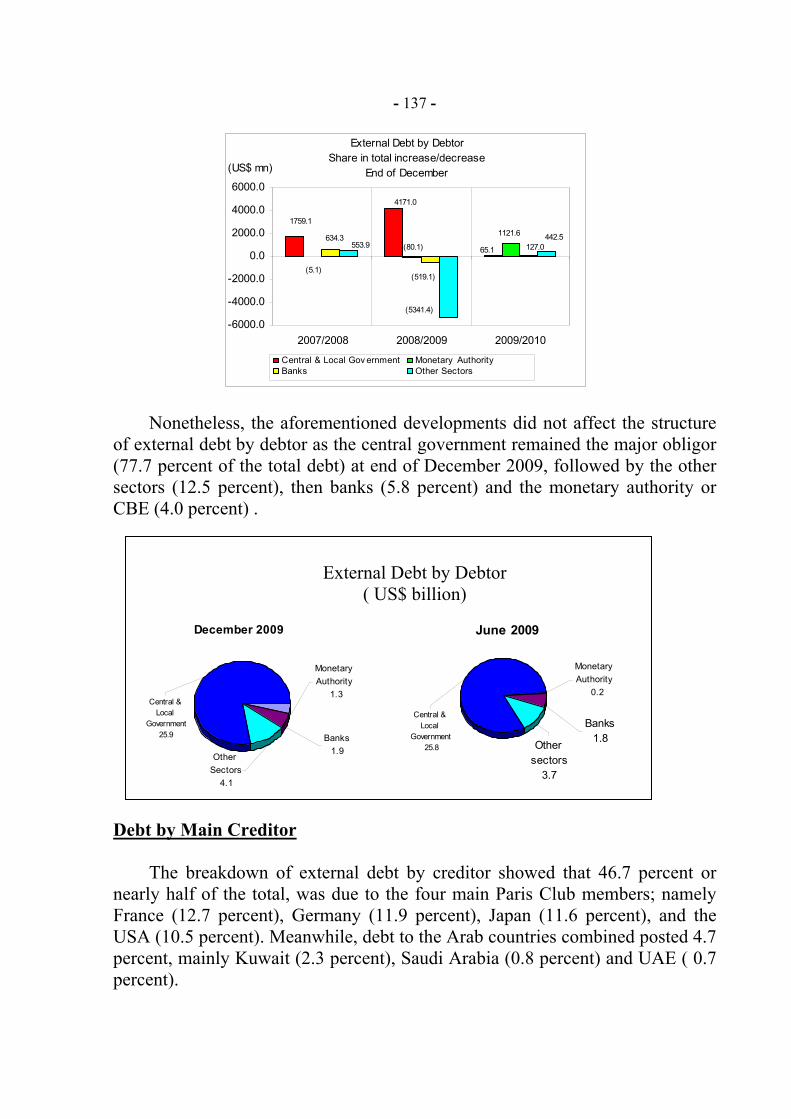
- 137 -
Nonetheless, the aforementioned developments did not affect the structure of external debt by debtor as the central government remained the major obligor (77.7 percent of the total debt) at end of December 2009, followed by the other sectors (12.5 percent), then banks (5.8 percent) and the monetary authority or CBE (4.0 percent) .
External Debt by Debtor ( US$ billion)
Debt by Main Creditor The breakdown of external debt by creditor showed that 46.7 percent or nearly half of the total, was due to the four main Paris Club members; namely France (12.7 percent), Germany (11.9 percent), Japan (11.6 percent), and the USA (10.5 percent). Meanwhile, debt to the Arab countries combined posted 4.7 percent, mainly Kuwait (2.3 percent), Saudi Arabia (0.8 percent) and UAE ( 0.7 percent).
External Debt by DebtorShare in total increase/decrease
End of December
65.1
4171.0
1759.1
(80.1)
1121.6
(5.1)
127.0
(519.1)
634.3553.9
(5341.4)
442.5
-6000.0
-4000.0
-2000.0
0.0
2000.0
4000.0
6000.0
2007/2008 2008/2009 2009/2010
(US$ mn)
Central & Local Gov ernment Monetary Authority Banks Other Sectors
June 2009
Central & Local
Government 25.8
Monetary Authority
0.2
Other sectors
3.7
Banks1.8
December 2009
Banks1.9
Other Sectors
4.1
Monetary Authority
1.3Central &
Local Government
25.9
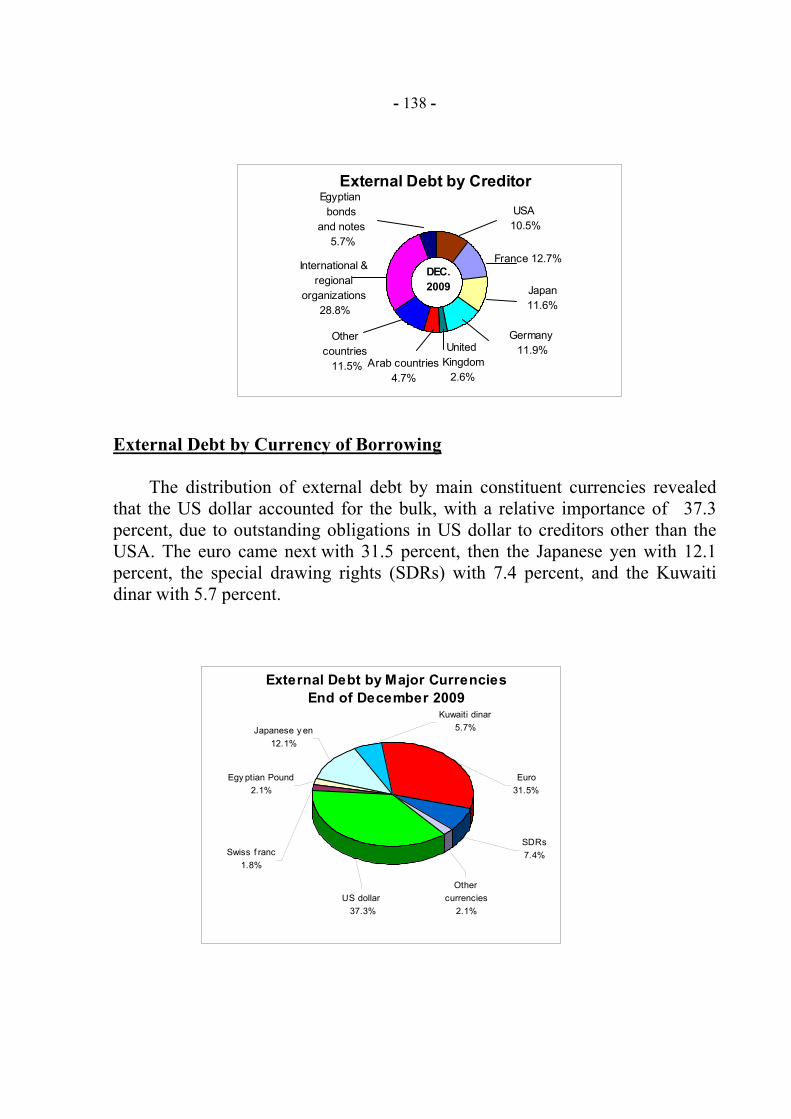
- 138 -
External Debt by Currency of Borrowing
The distribution of external debt by main constituent currencies revealed that the US dollar accounted for the bulk, with a relative importance of 37.3 percent, due to outstanding obligations in US dollar to creditors other than the USA. The euro came next with 31.5 percent, then the Japanese yen with 12.1 percent, the special drawing rights (SDRs) with 7.4 percent, and the Kuwaiti dinar with 5.7 percent.
External Debt by CreditorEgyptian
bondsand notes
5.7%
USA 10.5%
International & regional
organizations 28.8%
Other countries
11.5% Arab countries4.7%
United Kingdom
2.6%
Germany 11.9%
Japan11.6%
France 12.7%DEC.2009
External Debt by Major CurrenciesEnd of December 2009
SDRs7.4%
Other currencies
2.1%US dollar
37.3%
Euro31.5%
Japanese y en12.1%
Kuwaiti dinar5.7%
Egy ptian Pound2.1%
Swiss f ranc1.8%
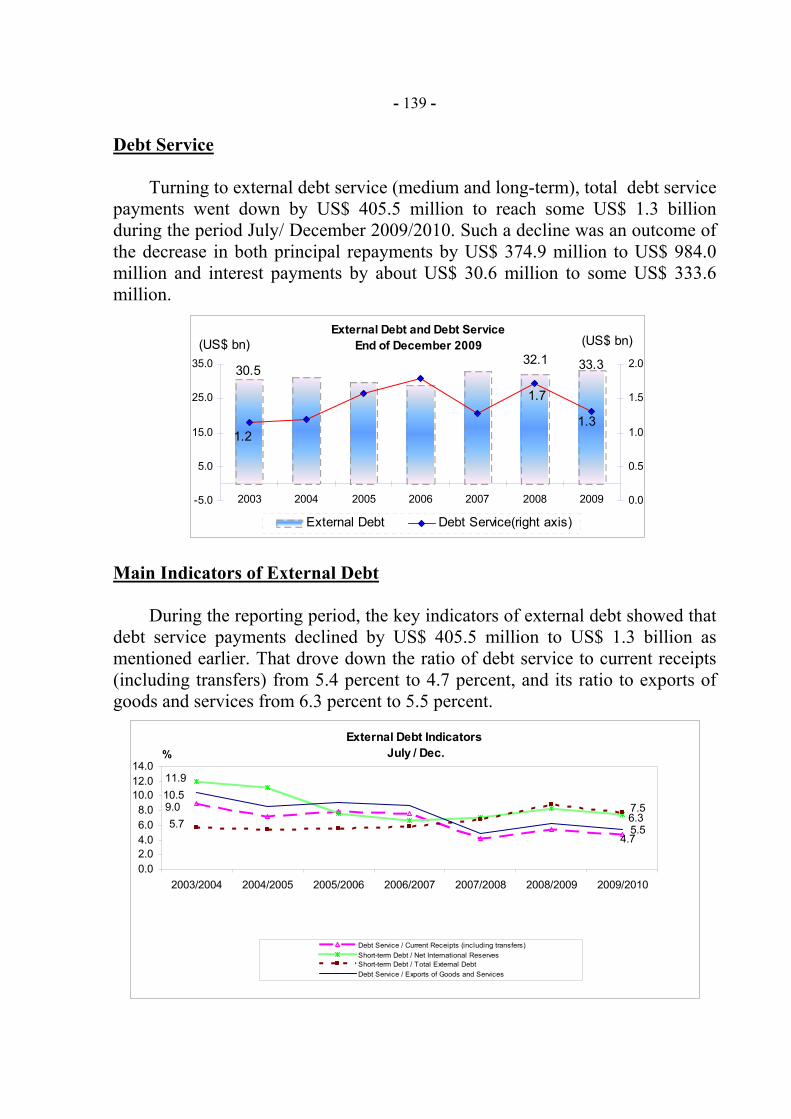
- 139 - Debt Service
Turning to external debt service (medium and long-term), total debt service payments went down by US$ 405.5 million to reach some US$ 1.3 billion during the period July/ December 2009/2010. Such a decline was an outcome of the decrease in both principal repayments by US$ 374.9 million to US$ 984.0 million and interest payments by about US$ 30.6 million to some US$ 333.6 million.
Main Indicators of External Debt
During the reporting period, the key indicators of external debt showed that debt service payments declined by US$ 405.5 million to US$ 1.3 billion as mentioned earlier. That drove down the ratio of debt service to current receipts (including transfers) from 5.4 percent to 4.7 percent, and its ratio to exports of goods and services from 6.3 percent to 5.5 percent.
External Debt and Debt ServiceEnd of December 2009
33.330.532.1
1.31.2
1.7
-5.0
5.0
15.0
25.0
35.0
2003 2004 2005 2006 2007 2008 2009 0.0
0.5
1.0
1.5
2.0
External Debt Debt Service(right axis)
(US$ bn)(US$ bn)
External Debt Indicators July / Dec.
4.7
9.06.3
11.9
7.55.7 5.5
10.5
0.02.04.06.08.0
10.012.014.0
2003/2004 2004/2005 2005/2006 2006/2007 2007/2008 2008/2009 2009/2010
%
Debt Service / Current Receipts (including transfers)Short-term Debt / Net International ReservesShort-term Debt / Total External DebtDebt Service / Exports of Goods and Services
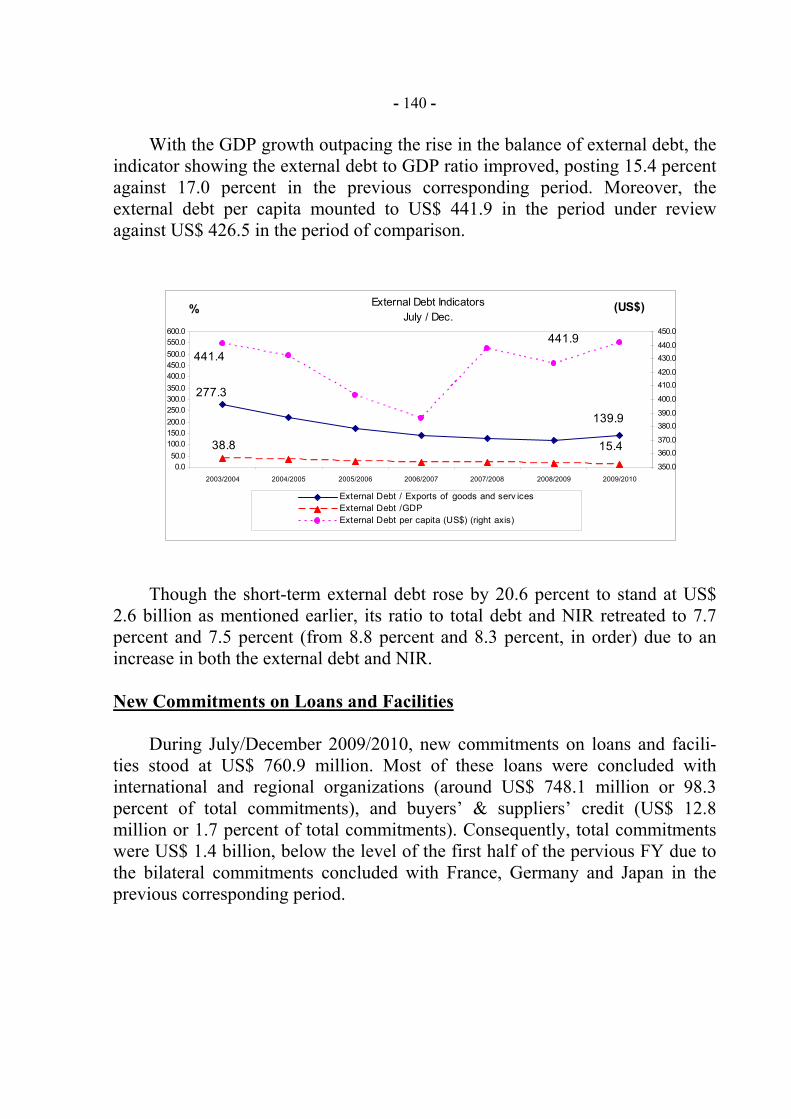
- 140 -
With the GDP growth outpacing the rise in the balance of external debt, the indicator showing the external debt to GDP ratio improved, posting 15.4 percent against 17.0 percent in the previous corresponding period. Moreover, the external debt per capita mounted to US$ 441.9 in the period under review against US$ 426.5 in the period of comparison.
Though the short-term external debt rose by 20.6 percent to stand at US$ 2.6 billion as mentioned earlier, its ratio to total debt and NIR retreated to 7.7 percent and 7.5 percent (from 8.8 percent and 8.3 percent, in order) due to an increase in both the external debt and NIR.
New Commitments on Loans and Facilities
During July/December 2009/2010, new commitments on loans and facili-ties stood at US$ 760.9 million. Most of these loans were concluded with international and regional organizations (around US$ 748.1 million or 98.3 percent of total commitments), and buyers’ & suppliers’ credit (US$ 12.8 million or 1.7 percent of total commitments). Consequently, total commitments were US$ 1.4 billion, below the level of the first half of the pervious FY due to the bilateral commitments concluded with France, Germany and Japan in the previous corresponding period.
External Debt IndicatorsJuly / Dec.
139.9
277.3
38.8 15.4
441.9441.4
0.050.0
100.0150.0200.0250.0300.0350.0400.0450.0500.0550.0600.0
2003/2004 2004/2005 2005/2006 2006/2007 2007/2008 2008/2009 2009/2010
%
350.0
360.0370.0
380.0390.0
400.0
410.0420.0
430.0440.0
450.0
(US$)
External Debt / Exports of goods and serv ices External Debt /GDPExternal Debt per capita (US$) (right axis)

Annex
- 141-
Statistical Section
(1) Indicators of Development and Economic Growth
(1/1) GDP at Factor Cost by Economic Sector (at 2006/2007 Prices) (1/2) GDP by Expenditure (1/3) Consumer Price Index (Urban) (January 2007=100) (1/4) Producer Price Index (2004/2005=100) (2) Monetary Aggregates (2/1/1) CBE Financial Position: Reserve Money and Counterpart Assets (2/1/2) Banking Survey: Domestic Liquidity and Counterpart Assets (2/1/3) Banking Survey: Deposits in Local Currency (2/1/4) Banking Survey: Deposits in Foreign Currencies (2/1/5) Banking Survey: Foreign Assets and Liabilities (2/1/6) Banking Survey: Domestic Credit and Other Items (Net) (2/1/7) Total Saving Vessels (2/1/8) Bank Lending and Discount Balances to Business Sector
Financial Sector (2/2/1) Structure of the Egyptian Banking System as at 31/12/2009 (2/2/2) Local Mutual Funds Authorized and Operating as at 31/12/2009 Activity of the Banking System
Central Bank of Egypt
(2/3/1) Note Issued by Denomination (2/3/2) Currency in Circulation outside CBE by Denomination (2/3/3) Activity of Clearing House
- 142 -
Banks
(2/4/1) Aggregate Financial Position (2/4/2) Deposits by Maturity (2/4/3) Deposits by Sector (2/4/4) Deposits by Economic Activity (2/4/5) Portfolio Investments by Sector (2/4/6) Lending and Discount Balances by Sector (2/4/7) Credit by Sector (2/4/8) Lending and Discount Balances by Economic Activity
Interest Rates
(2/5/1) Discount and Interest Rates on Deposits and Loans in Egyptian Pound (2/5/2) Domestic Interest Rates on 3-Month Deposits in Major Currencies (2/5/3) Interest Rates on Treasury Bills (Weekly Weighted Averages) (3) Non-Banking Financial Sector (3/1) Companies Listed on the Stock Exchange (3/2) Trading in Shares on the Stock Exchange (3/3) Trading in Bonds on the Stock Exchange (3/4) Foreign Transactions on the Stock Exchange (3/5) Global Depository Receipts (GDRs) (3/6) Outstanding Balance of Treasury Bills (Quarterly) (3/7) Outstanding Balance of Treasury Bills (Weekly) (3/8) Outstanding Balance of Treasury Bonds
- 143 -
(4) Public Finance & Domestic Public Debt (4/1) Consolidated Fiscal Operations of the General Government (Expenditures) (4/2) Consolidated Fiscal Operations of the General Government (Revenues) (4/3) Summary of the Consolidated Fiscal Operations of the General
Government (4/4) Government Domestic Debt & Economic Authorities Debt (4/5) National Investment Bank (Resources & Uses) (5) External Transactions
(5/1) Balance of Payments (US$) (5/2) Exports by Degree of Processing (5/3) Imports by Degree of Use (5/4) Regional Distribution of Exports and Imports (5/5) Average LE Exchange Rates (5/6) External Debt (5/7) Distribution of External Debt by Main Currencies
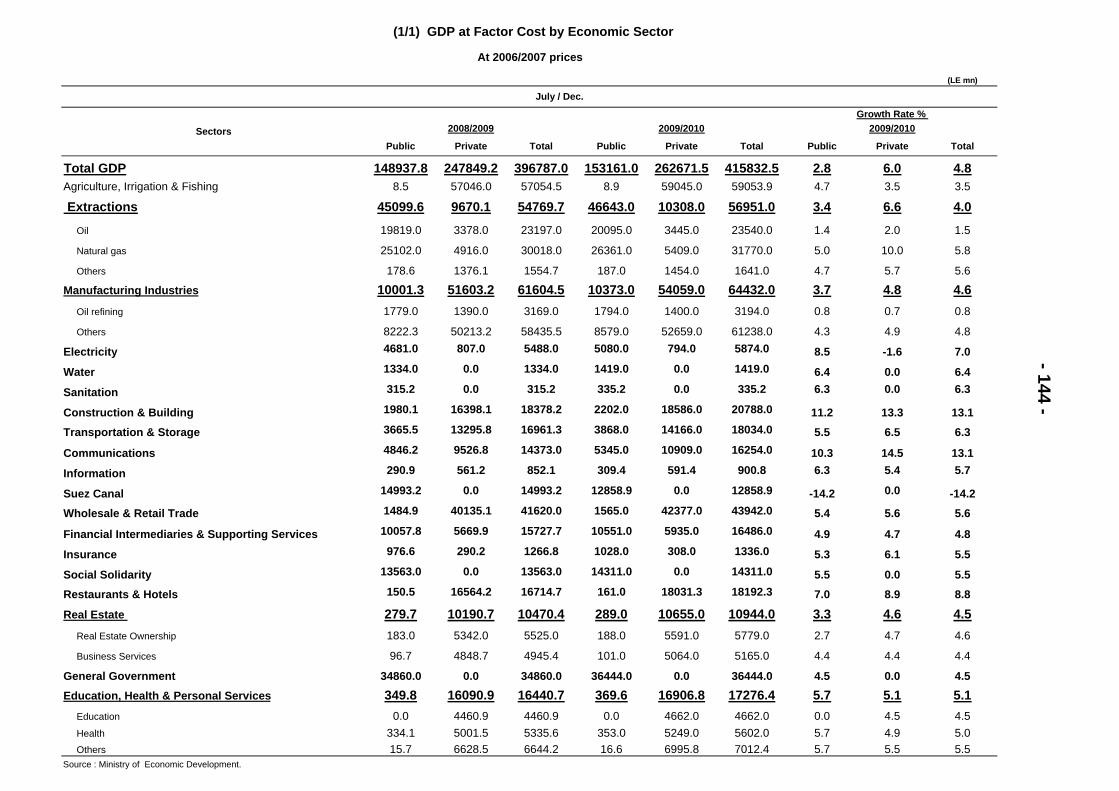
(LE mn)
Public Private Total Public Private Total Public Private Total
Total GDP 148937.8 247849.2 396787.0 153161.0 262671.5 415832.5 2.8 6.0 4.8Agriculture, Irrigation & Fishing 8.5 57046.0 57054.5 8.9 59045.0 59053.9 4.7 3.5 3.5
Extractions 45099.6 9670.1 54769.7 46643.0 10308.0 56951.0 3.4 6.6 4.0
Oil 19819.0 3378.0 23197.0 20095.0 3445.0 23540.0 1.4 2.0 1.5
Natural gas 25102.0 4916.0 30018.0 26361.0 5409.0 31770.0 5.0 10.0 5.8
Others 178.6 1376.1 1554.7 187.0 1454.0 1641.0 4.7 5.7 5.6
Manufacturing Industries 10001.3 51603.2 61604.5 10373.0 54059.0 64432.0 3.7 4.8 4.6Oil refining 1779.0 1390.0 3169.0 1794.0 1400.0 3194.0 0.8 0.7 0.8
Others 8222.3 50213.2 58435.5 8579.0 52659.0 61238.0 4.3 4.9 4.8
Electricity 4681.0 807.0 5488.0 5080.0 794.0 5874.0 8.5 -1.6 7.0
Water 1334.0 0.0 1334.0 1419.0 0.0 1419.0 6.4 0.0 6.4
Sanitation 315.2 0.0 315.2 335.2 0.0 335.2 6.3 0.0 6.3
Construction & Building 1980.1 16398.1 18378.2 2202.0 18586.0 20788.0 11.2 13.3 13.1Transportation & Storage 3665.5 13295.8 16961.3 3868.0 14166.0 18034.0 5.5 6.5 6.3
Communications 4846.2 9526.8 14373.0 5345.0 10909.0 16254.0 10.3 14.5 13.1
Information 290.9 561.2 852.1 309.4 591.4 900.8 6.3 5.4 5.7
Suez Canal 14993.2 0.0 14993.2 12858.9 0.0 12858.9 -14.2 0.0 -14.2Wholesale & Retail Trade 1484.9 40135.1 41620.0 1565.0 42377.0 43942.0 5.4 5.6 5.6
Financial Intermediaries & Supporting Services 10057.8 5669.9 15727.7 10551.0 5935.0 16486.0 4.9 4.7 4.8
Insurance 976.6 290.2 1266.8 1028.0 308.0 1336.0 5.3 6.1 5.5
Social Solidarity 13563.0 0.0 13563.0 14311.0 0.0 14311.0 5.5 0.0 5.5Restaurants & Hotels 150.5 16564.2 16714.7 161.0 18031.3 18192.3 7.0 8.9 8.8
Real Estate 279.7 10190.7 10470.4 289.0 10655.0 10944.0 3.3 4.6 4.5Real Estate Ownership 183.0 5342.0 5525.0 188.0 5591.0 5779.0 2.7 4.7 4.6
Business Services 96.7 4848.7 4945.4 101.0 5064.0 5165.0 4.4 4.4 4.4
General Government 34860.0 0.0 34860.0 36444.0 0.0 36444.0 4.5 0.0 4.5Education, Health & Personal Services 349.8 16090.9 16440.7 369.6 16906.8 17276.4 5.7 5.1 5.1
Education 0.0 4460.9 4460.9 0.0 4662.0 4662.0 0.0 4.5 4.5Health 334.1 5001.5 5335.6 353.0 5249.0 5602.0 5.7 4.9 5.0Others 15.7 6628.5 6644.2 16.6 6995.8 7012.4 5.7 5.5 5.5
Source : Ministry of Economic Development.
2008/2009Growth Rate %
- 144 - July / Dec.
Sectors
(1/1) GDP at Factor Cost by Economic Sector
At 2006/2007 prices
2009/20102009/2010
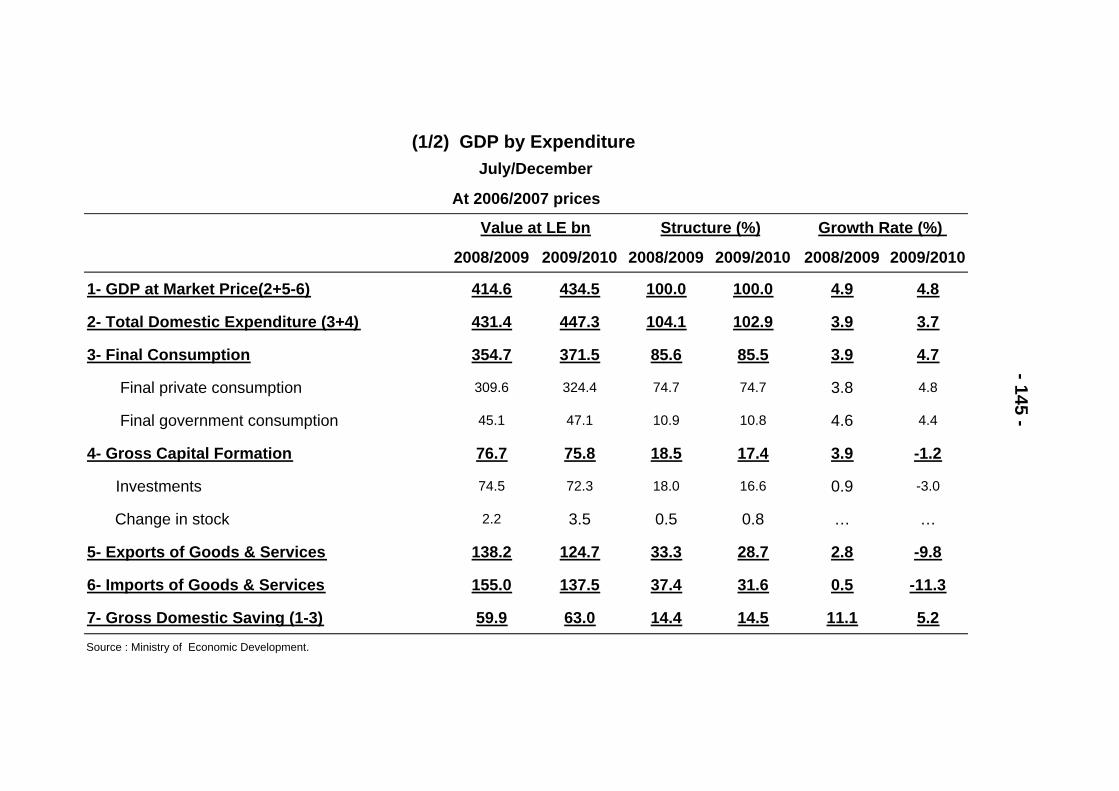
(1/2) GDP by Expenditure July/December
2008/2009 2009/2010 2008/2009 2009/2010 2008/2009 2009/2010
1- GDP at Market Price(2+5-6) 414.6 434.5 100.0 100.0 4.9 4.8
2- Total Domestic Expenditure (3+4) 431.4 447.3 104.1 102.9 3.9 3.7
3- Final Consumption 354.7 371.5 85.6 85.5 3.9 4.7
Final private consumption 309.6 324.4 74.7 74.7 3.8 4.8
Final government consumption 45.1 47.1 10.9 10.8 4.6 4.4
4- Gross Capital Formation 76.7 75.8 18.5 17.4 3.9 -1.2
Investments 74.5 72.3 18.0 16.6 0.9 -3.0
Change in stock 2.2 3.5 0.5 0.8 … …
5- Exports of Goods & Services 138.2 124.7 33.3 28.7 2.8 -9.8
6- Imports of Goods & Services 155.0 137.5 37.4 31.6 0.5 -11.3
7- Gross Domestic Saving (1-3) 59.9 63.0 14.4 14.5 11.1 5.2
- 145 -
Source : Ministry of Economic Development.
Structure (%) Growth Rate (%) Value at LE bn
At 2006/2007 prices
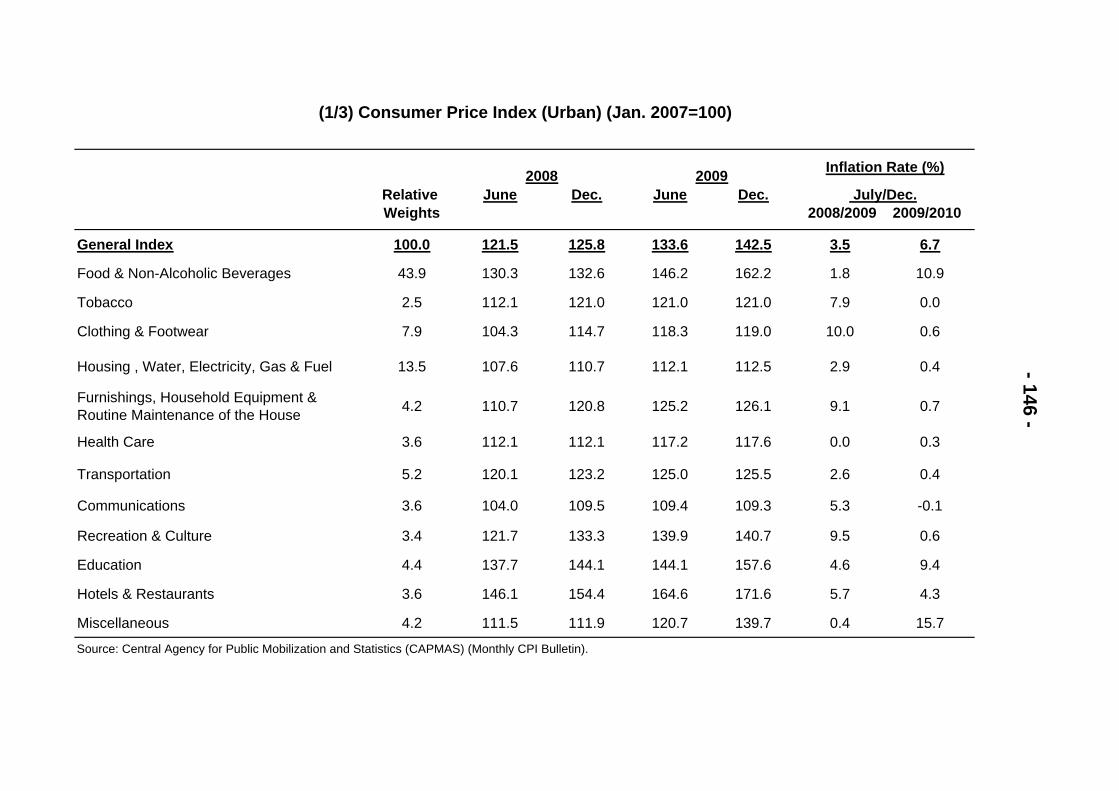
Relative Weights
June Dec. June Dec.
General Index 100.0 121.5 125.8 133.6 142.5 3.5 6.7
Food & Non-Alcoholic Beverages 43.9 130.3 132.6 146.2 162.2 1.8 10.9
Tobacco 2.5 112.1 121.0 121.0 121.0 7.9 0.0
Clothing & Footwear 7.9 104.3 114.7 118.3 119.0 10.0 0.6
Housing , Water, Electricity, Gas & Fuel 13.5 107.6 110.7 112.1 112.5 2.9 0.4
Furnishings, Household Equipment & Routine Maintenance of the House 4.2 110.7 120.8 125.2 126.1 9.1 0.7
Health Care 3.6 112.1 112.1 117.2 117.6 0.0 0.3
Transportation 5.2 120.1 123.2 125.0 125.5 2.6 0.4
Communications 3.6 104.0 109.5 109.4 109.3 5.3 -0.1
Recreation & Culture 3.4 121.7 133.3 139.9 140.7 9.5 0.6
Education 4.4 137.7 144.1 144.1 157.6 4.6 9.4
Hotels & Restaurants 3.6 146.1 154.4 164.6 171.6 5.7 4.3
Miscellaneous 4.2 111.5 111.9 120.7 139.7 0.4 15.7
Source: Central Agency for Public Mobilization and Statistics (CAPMAS) (Monthly CPI Bulletin).
- 146 -
July/Dec. 2008/2009 2009/2010
(1/3) Consumer Price Index (Urban) (Jan. 2007=100)
Inflation Rate (%)2008 2009
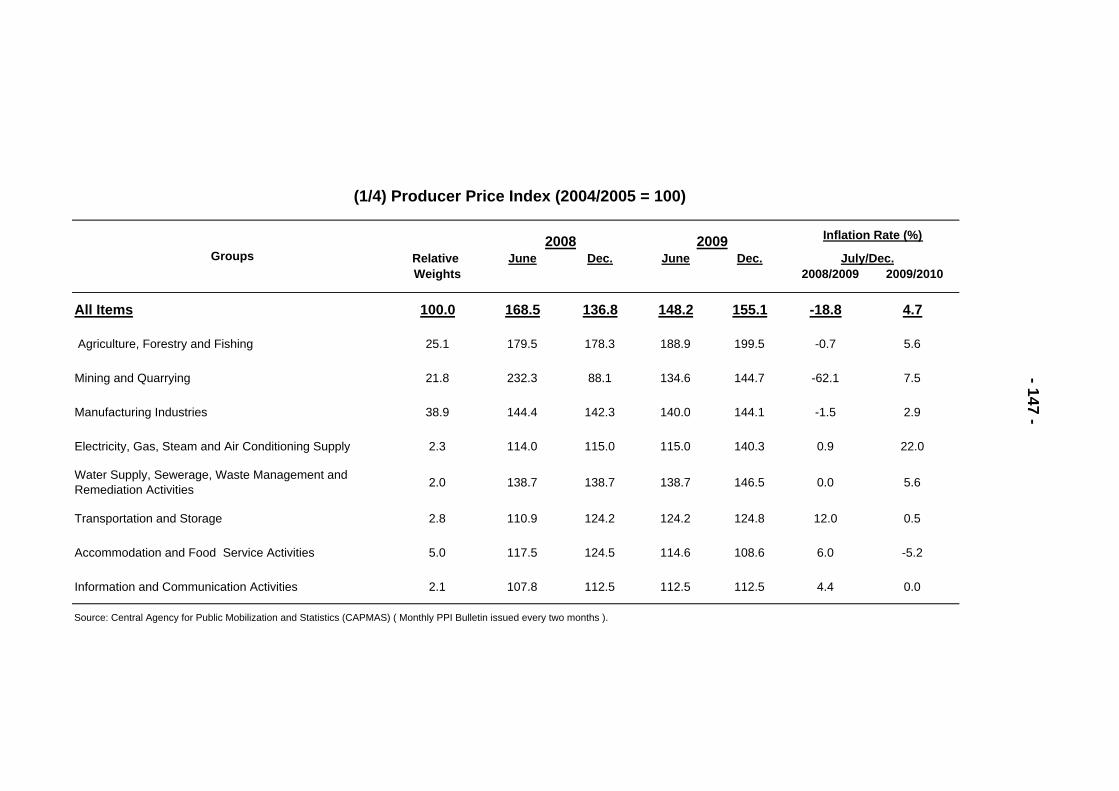
Relative Weights
June Dec. June Dec.
All Items 100.0 168.5 136.8 148.2 155.1 -18.8 4.7
Agriculture, Forestry and Fishing 25.1 179.5 178.3 188.9 199.5 -0.7 5.6
Mining and Quarrying 21.8 232.3 88.1 134.6 144.7 -62.1 7.5
Manufacturing Industries 38.9 144.4 142.3 140.0 144.1 -1.5 2.9
Electricity, Gas, Steam and Air Conditioning Supply 2.3 114.0 115.0 115.0 140.3 0.9 22.0
Water Supply, Sewerage, Waste Management and Remediation Activities 2.0 138.7 138.7 138.7 146.5 0.0 5.6
Transportation and Storage 2.8 110.9 124.2 124.2 124.8 12.0 0.5
Accommodation and Food Service Activities 5.0 117.5 124.5 114.6 108.6 6.0 -5.2
Information and Communication Activities 2.1 107.8 112.5 112.5 112.5 4.4 0.0
Source: Central Agency for Public Mobilization and Statistics (CAPMAS) ( Monthly PPI Bulletin issued every two months ).
- 147 -
(1/4) Producer Price Index (2004/2005 = 100)
Inflation Rate (%)
Groups2008 2009
July/Dec. 2008/2009 2009/2010
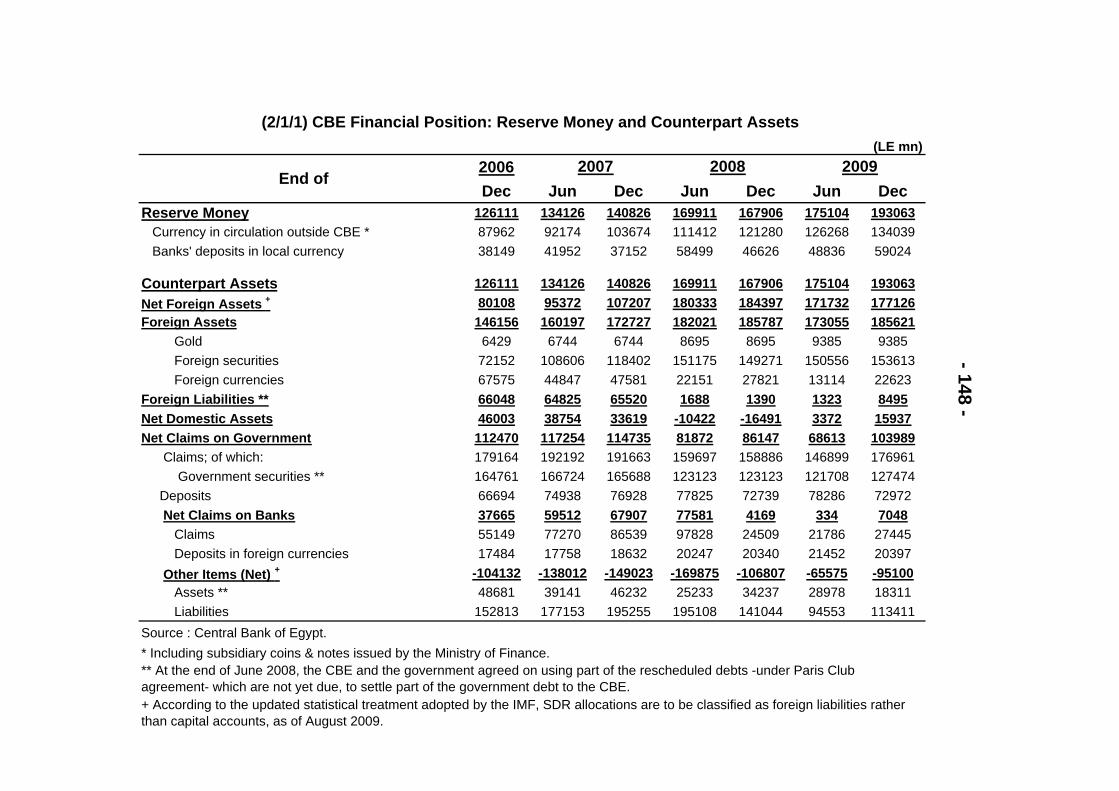
2006Dec Jun Dec Jun Dec Jun Dec
Reserve Money 126111 134126 140826 169911 167906 175104 193063Currency in circulation outside CBE * 87962 92174 103674 111412 121280 126268 134039Banks' deposits in local currency 38149 41952 37152 58499 46626 48836 59024
Counterpart Assets 126111 134126 140826 169911 167906 175104 193063Net Foreign Assets + 80108 95372 107207 180333 184397 171732 177126Foreign Assets 146156 160197 172727 182021 185787 173055 185621
Gold 6429 6744 6744 8695 8695 9385 9385Foreign securities 72152 108606 118402 151175 149271 150556 153613Foreign currencies 67575 44847 47581 22151 27821 13114 22623
Foreign Liabilities ** 66048 64825 65520 1688 1390 1323 8495Net Domestic Assets 46003 38754 33619 -10422 -16491 3372 15937Net Claims on Government 112470 117254 114735 81872 86147 68613 103989
Claims; of which: 179164 192192 191663 159697 158886 146899 176961 Government securities ** 164761 166724 165688 123123 123123 121708 127474
Deposits 66694 74938 76928 77825 72739 78286 72972Net Claims on Banks 37665 59512 67907 77581 4169 334 7048
Claims 55149 77270 86539 97828 24509 21786 27445Deposits in foreign currencies 17484 17758 18632 20247 20340 21452 20397
Other Items (Net) + -104132 -138012 -149023 -169875 -106807 -65575 -95100Assets ** 48681 39141 46232 25233 34237 28978 18311Liabilities 152813 177153 195255 195108 141044 94553 113411
Source : Central Bank of Egypt.* Including subsidiary coins & notes issued by the Ministry of Finance.
+ According to the updated statistical treatment adopted by the IMF, SDR allocations are to be classified as foreign liabilities rather than capital accounts, as of August 2009.
End of- 148 -
20082007 2009(LE mn)
(2/1/1) CBE Financial Position: Reserve Money and Counterpart Assets
** At the end of June 2008, the CBE and the government agreed on using part of the rescheduled debts -under Paris Club agreement- which are not yet due, to settle part of the government debt to the CBE.
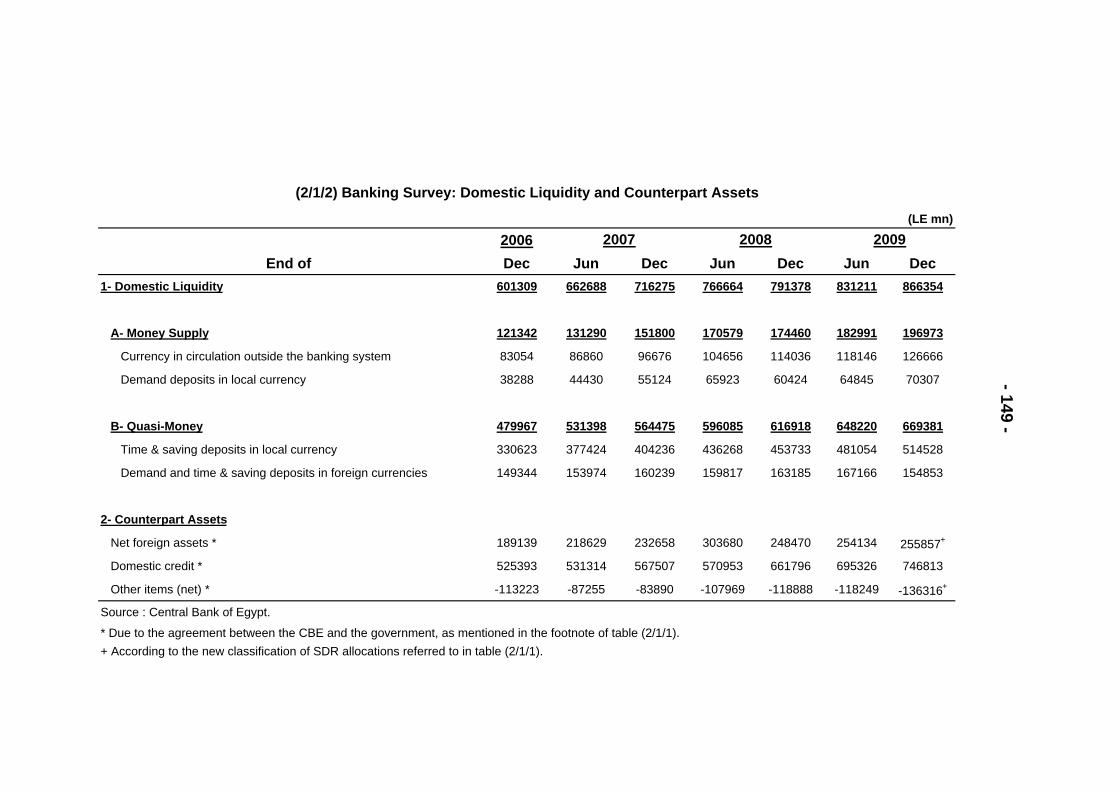
2006End of Dec Jun Dec Jun Dec Jun Dec
1- Domestic Liquidity 601309 662688 716275 766664 791378 831211 866354
A- Money Supply 121342 131290 151800 170579 174460 182991 196973
Currency in circulation outside the banking system 83054 86860 96676 104656 114036 118146 126666
Demand deposits in local currency 38288 44430 55124 65923 60424 64845 70307
B- Quasi-Money 479967 531398 564475 596085 616918 648220 669381
Time & saving deposits in local currency 330623 377424 404236 436268 453733 481054 514528
Demand and time & saving deposits in foreign currencies 149344 153974 160239 159817 163185 167166 154853
2- Counterpart Assets
Net foreign assets * 189139 218629 232658 303680 248470 254134 255857+
Domestic credit * 525393 531314 567507 570953 661796 695326 746813
Other items (net) * -113223 -87255 -83890 -107969 -118888 -118249 -136316+
+ According to the new classification of SDR allocations referred to in table (2/1/1).
- 149 -
2007 2008
Source : Central Bank of Egypt.
2009
* Due to the agreement between the CBE and the government, as mentioned in the footnote of table (2/1/1).
(2/1/2) Banking Survey: Domestic Liquidity and Counterpart Assets
(LE mn)
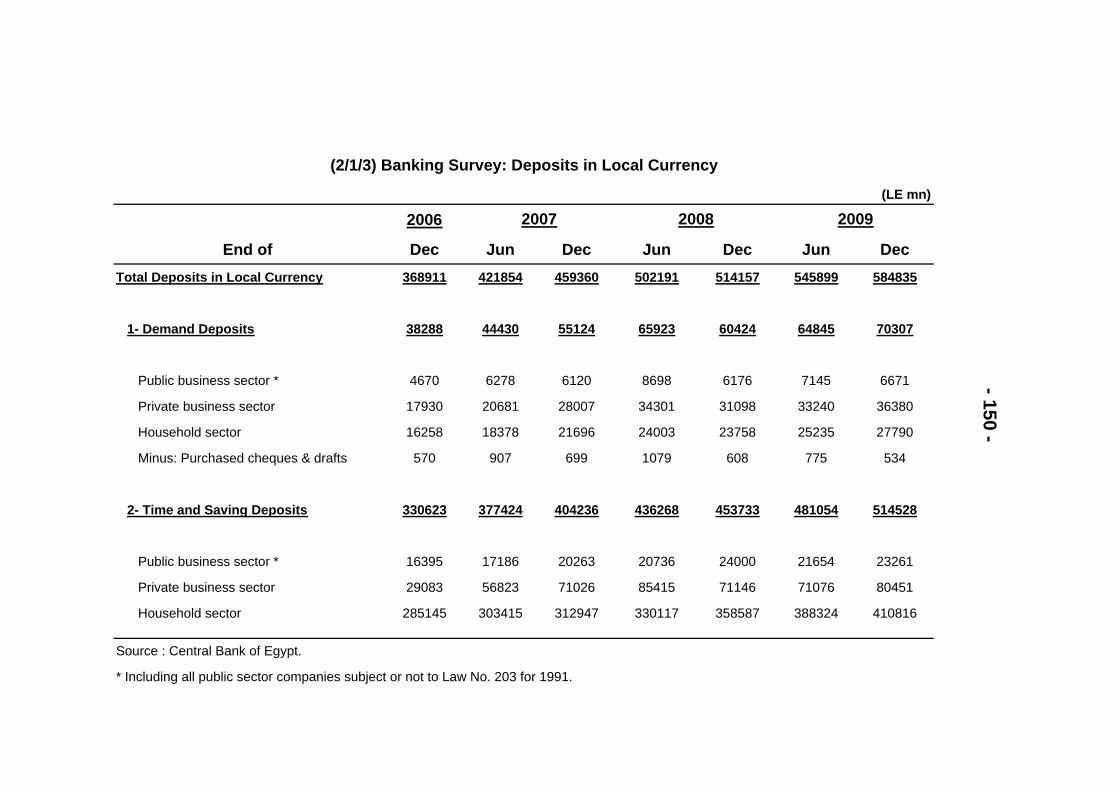
2006
End of Dec Jun Dec Jun Dec Jun DecTotal Deposits in Local Currency 368911 421854 459360 502191 514157 545899 584835
1- Demand Deposits 38288 44430 55124 65923 60424 64845 70307
Public business sector * 4670 6278 6120 8698 6176 7145 6671
Private business sector 17930 20681 28007 34301 31098 33240 36380
Household sector 16258 18378 21696 24003 23758 25235 27790
Minus: Purchased cheques & drafts 570 907 699 1079 608 775 534
2- Time and Saving Deposits 330623 377424 404236 436268 453733 481054 514528
Public business sector * 16395 17186 20263 20736 24000 21654 23261
Private business sector 29083 56823 71026 85415 71146 71076 80451
Household sector 285145 303415 312947 330117 358587 388324 410816
- 150 -
2007 2008
Source : Central Bank of Egypt.
2009
* Including all public sector companies subject or not to Law No. 203 for 1991.
(2/1/3) Banking Survey: Deposits in Local Currency
(LE mn)
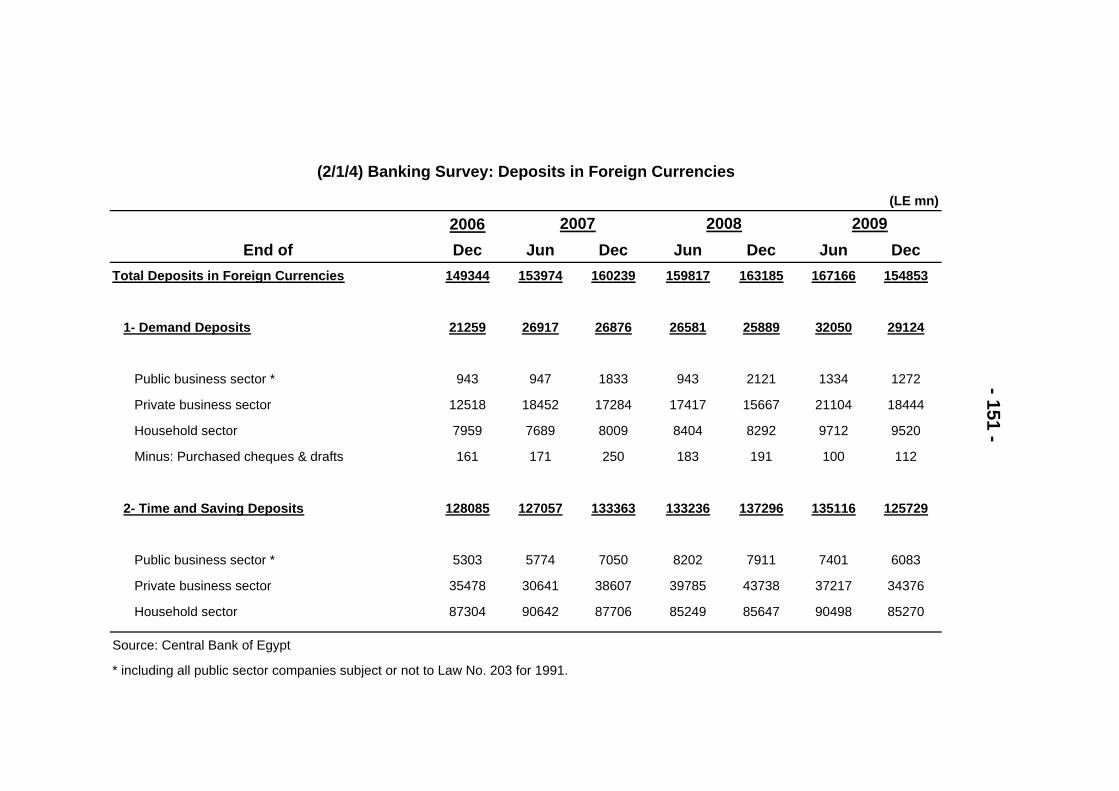
2006End of Dec Jun Dec Jun Dec Jun Dec
Total Deposits in Foreign Currencies 149344 153974 160239 159817 163185 167166 154853
1- Demand Deposits 21259 26917 26876 26581 25889 32050 29124
Public business sector * 943 947 1833 943 2121 1334 1272
Private business sector 12518 18452 17284 17417 15667 21104 18444
Household sector 7959 7689 8009 8404 8292 9712 9520
Minus: Purchased cheques & drafts 161 171 250 183 191 100 112
2- Time and Saving Deposits 128085 127057 133363 133236 137296 135116 125729
Public business sector * 5303 5774 7050 8202 7911 7401 6083
Private business sector 35478 30641 38607 39785 43738 37217 34376
Household sector 87304 90642 87706 85249 85647 90498 85270
Source: Central Bank of Egypt
- 151 -
2007 2008
* including all public sector companies subject or not to Law No. 203 for 1991.
2009(LE mn)
(2/1/4) Banking Survey: Deposits in Foreign Currencies
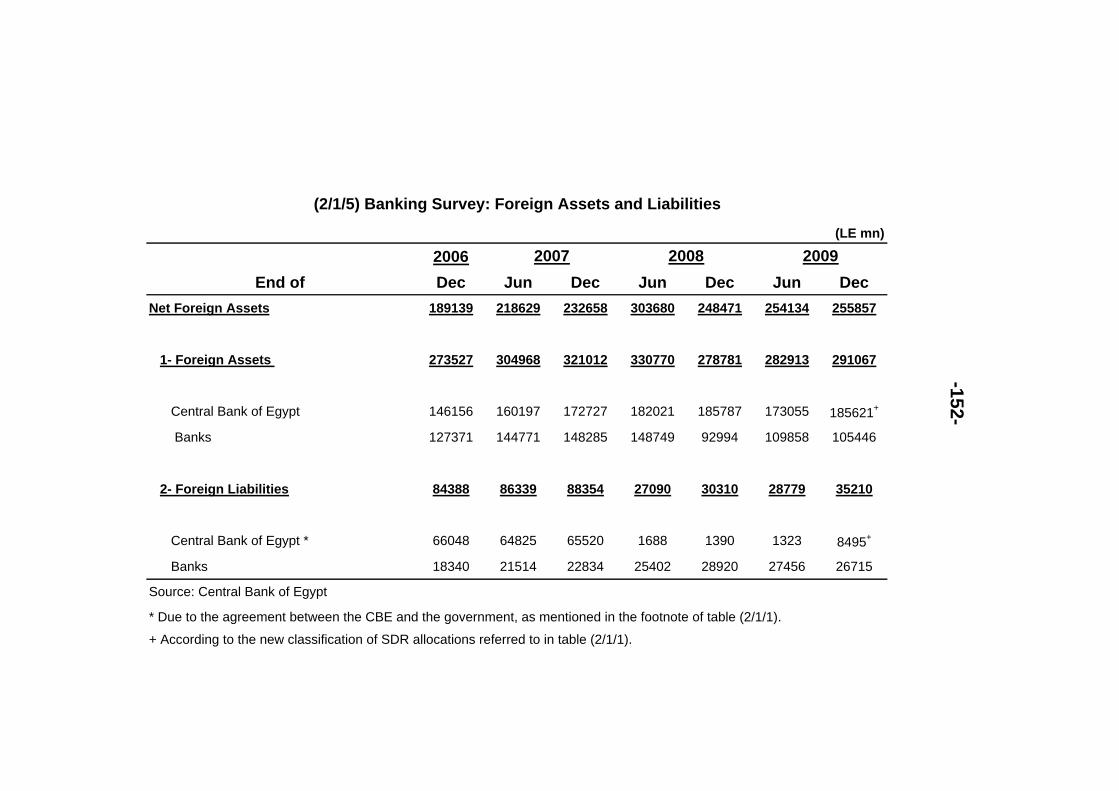
2006End of Dec Jun Dec Jun Dec Jun Dec
Net Foreign Assets 189139 218629 232658 303680 248471 254134 255857
1- Foreign Assets 273527 304968 321012 330770 278781 282913 291067
Central Bank of Egypt 146156 160197 172727 182021 185787 173055 185621+
Banks 127371 144771 148285 148749 92994 109858 105446
2- Foreign Liabilities 84388 86339 88354 27090 30310 28779 35210
Central Bank of Egypt * 66048 64825 65520 1688 1390 1323 8495+
Banks 18340 21514 22834 25402 28920 27456 26715
* Due to the agreement between the CBE and the government, as mentioned in the footnote of table (2/1/1).
+ According to the new classification of SDR allocations referred to in table (2/1/1).
-152-
2007 2008
Source: Central Bank of Egypt
2009
(2/1/5) Banking Survey: Foreign Assets and Liabilities
(LE mn)
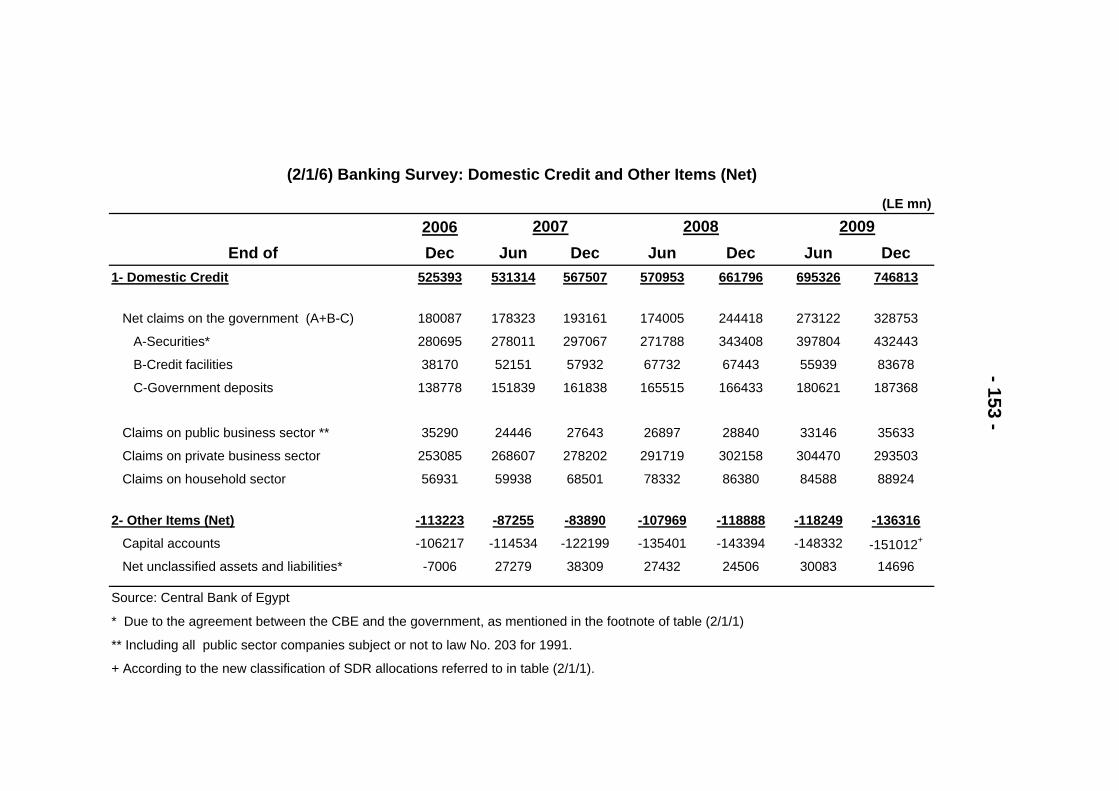
2006End of Dec Jun Dec Jun Dec Jun Dec
1- Domestic Credit 525393 531314 567507 570953 661796 695326 746813
Net claims on the government (A+B-C) 180087 178323 193161 174005 244418 273122 328753
A-Securities* 280695 278011 297067 271788 343408 397804 432443
B-Credit facilities 38170 52151 57932 67732 67443 55939 83678
C-Government deposits 138778 151839 161838 165515 166433 180621 187368
Claims on public business sector ** 35290 24446 27643 26897 28840 33146 35633
Claims on private business sector 253085 268607 278202 291719 302158 304470 293503
Claims on household sector 56931 59938 68501 78332 86380 84588 88924
2- Other Items (Net) -113223 -87255 -83890 -107969 -118888 -118249 -136316
Capital accounts -106217 -114534 -122199 -135401 -143394 -148332 -151012+
Net unclassified assets and liabilities* -7006 27279 38309 27432 24506 30083 14696
* Due to the agreement between the CBE and the government, as mentioned in the footnote of table (2/1/1)
** Including all public sector companies subject or not to law No. 203 for 1991.
+ According to the new classification of SDR allocations referred to in table (2/1/1).
- 153 -
2007 2008
Source: Central Bank of Egypt
2009
(2/1/6) Banking Survey: Domestic Credit and Other Items (Net)
(LE mn)
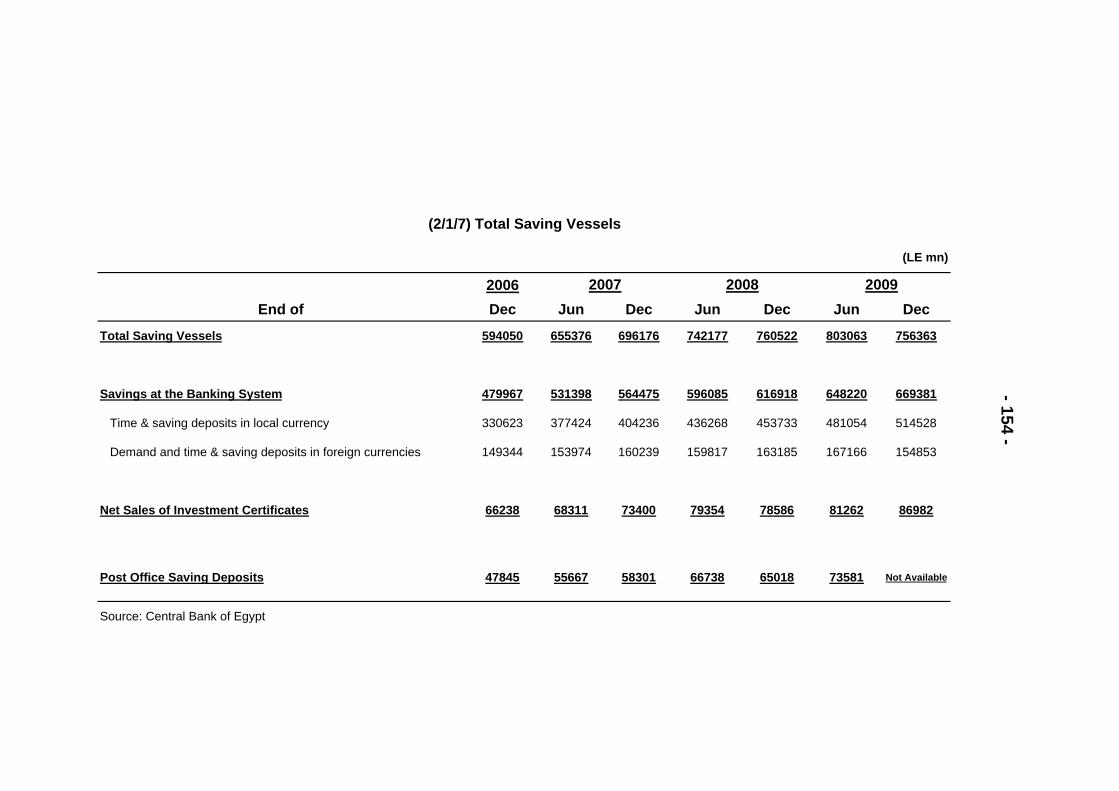
2006End of Dec Jun Dec Jun Dec Jun Dec
Total Saving Vessels 594050 655376 696176 742177 760522 803063 756363
Savings at the Banking System 479967 531398 564475 596085 616918 648220 669381
Time & saving deposits in local currency 330623 377424 404236 436268 453733 481054 514528
Demand and time & saving deposits in foreign currencies 149344 153974 160239 159817 163185 167166 154853
Net Sales of Investment Certificates 66238 68311 73400 79354 78586 81262 86982
Post Office Saving Deposits 47845 55667 58301 66738 65018 73581 Not Available
Source: Central Bank of Egypt
- 154 -
2007 2008 2009
(LE mn)
(2/1/7) Total Saving Vessels
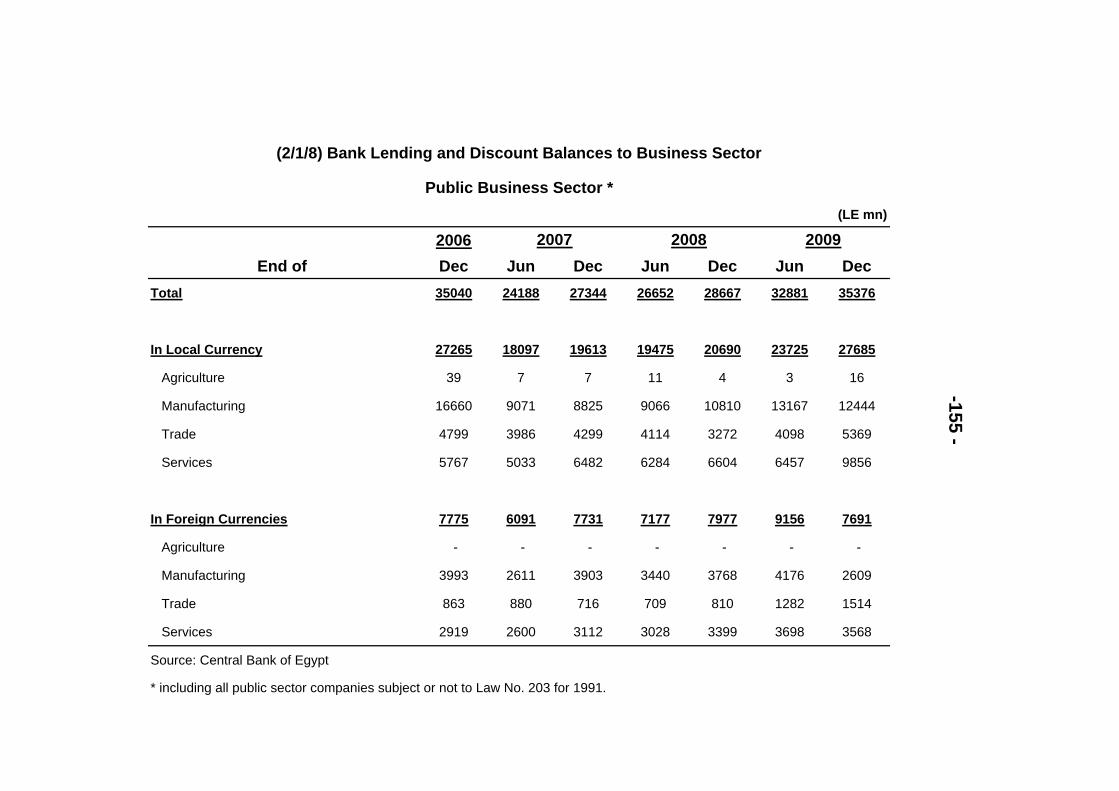
2006End of Dec Jun Dec Jun Dec Jun Dec
Total 35040 24188 27344 26652 28667 32881 35376
In Local Currency 27265 18097 19613 19475 20690 23725 27685
Agriculture 39 7 7 11 4 3 16
Manufacturing 16660 9071 8825 9066 10810 13167 12444
Trade 4799 3986 4299 4114 3272 4098 5369
Services 5767 5033 6482 6284 6604 6457 9856
In Foreign Currencies 7775 6091 7731 7177 7977 9156 7691
Agriculture - - - - - - -
Manufacturing 3993 2611 3903 3440 3768 4176 2609
Trade 863 880 716 709 810 1282 1514
Services 2919 2600 3112 3028 3399 3698 3568
Source: Central Bank of Egypt
(2/1/8) Bank Lending and Discount Balances to Business Sector
Public Business Sector * -155 -
2007 2008
* including all public sector companies subject or not to Law No. 203 for 1991.
2009(LE mn)
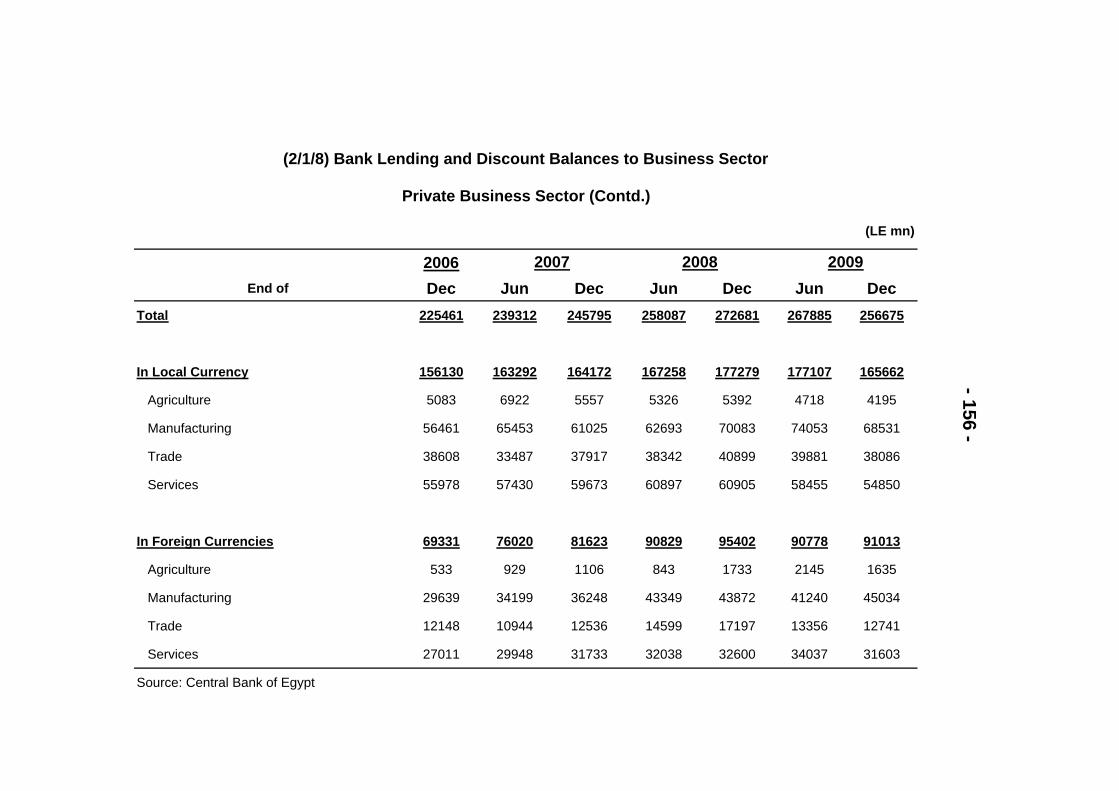
2006End of Dec Jun Dec Jun Dec Jun Dec
Total 225461 239312 245795 258087 272681 267885 256675
In Local Currency 156130 163292 164172 167258 177279 177107 165662
Agriculture 5083 6922 5557 5326 5392 4718 4195
Manufacturing 56461 65453 61025 62693 70083 74053 68531
Trade 38608 33487 37917 38342 40899 39881 38086
Services 55978 57430 59673 60897 60905 58455 54850
In Foreign Currencies 69331 76020 81623 90829 95402 90778 91013
Agriculture 533 929 1106 843 1733 2145 1635
Manufacturing 29639 34199 36248 43349 43872 41240 45034
Trade 12148 10944 12536 14599 17197 13356 12741
Services 27011 29948 31733 32038 32600 34037 31603
Source: Central Bank of Egypt
- 156 -
2007 2008 2009
(LE mn)
(2/1/8) Bank Lending and Discount Balances to Business Sector
Private Business Sector (Contd.)
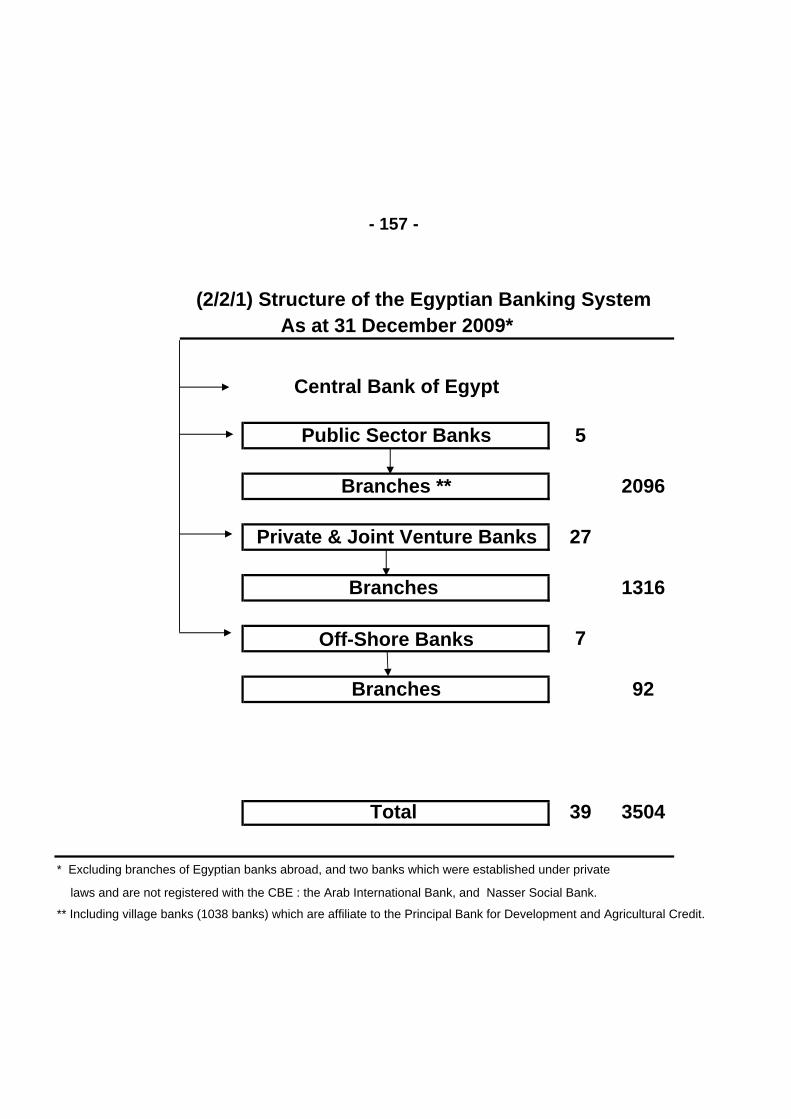
As at 31 December 2009*
Central Bank of Egypt
Public Sector Banks 5
Branches ** 2096
Private & Joint Venture Banks 27
Branches 1316
Off-Shore Banks 7
Branches 92
Total 39 3504
* Excluding branches of Egyptian banks abroad, and two banks which were established under private
laws and are not registered with the CBE : the Arab International Bank, and Nasser Social Bank.
** Including village banks (1038 banks) which are affiliate to the Principal Bank for Development and Agricultural Credit.
(2/2/1) Structure of the Egyptian Banking System
- 157 -
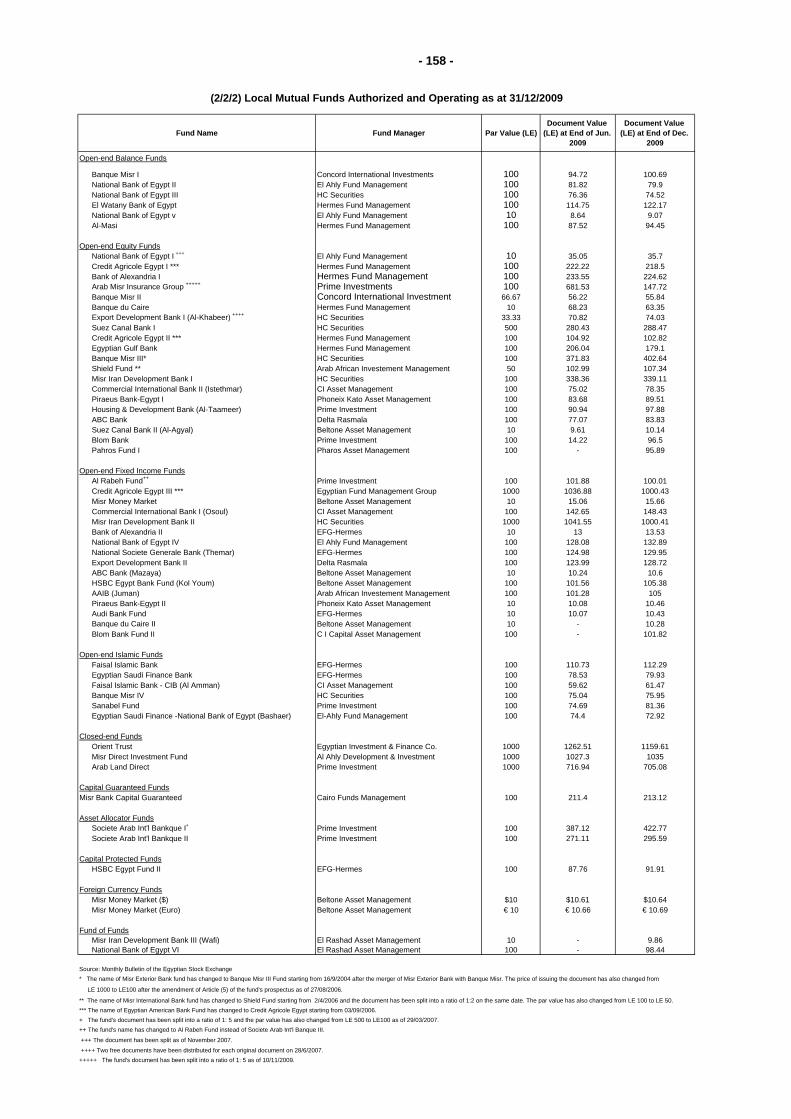
Fund Name Fund Manager Par Value (LE)Document Value
(LE) at End of Jun. 2009
Document Value (LE) at End of Dec.
2009
Open-end Balance Funds
Banque Misr I Concord International Investments 100 94.72 100.69National Bank of Egypt II El Ahly Fund Management 100 81.82 79.9National Bank of Egypt III HC Securities 100 76.36 74.52El Watany Bank of Egypt Hermes Fund Management 100 114.75 122.17National Bank of Egypt v El Ahly Fund Management 10 8.64 9.07Al-Masi Hermes Fund Management 100 87.52 94.45
Open-end Equity FundsNational Bank of Egypt I +++ El Ahly Fund Management 10 35.05 35.7Credit Agricole Egypt I *** Hermes Fund Management 100 222.22 218.5Bank of Alexandria I Hermes Fund Management 100 233.55 224.62Arab Misr Insurance Group +++++ Prime Investments 100 681.53 147.72Banque Misr II Concord International Investment 66.67 56.22 55.84Banque du Caire Hermes Fund Management 10 68.23 63.35Export Development Bank I (Al-Khabeer) ++++ HC Securities 33.33 70.82 74.03Suez Canal Bank I HC Securities 500 280.43 288.47Credit Agricole Egypt II *** Hermes Fund Management 100 104.92 102.82Egyptian Gulf Bank Hermes Fund Management 100 206.04 179.1Banque Misr III* HC Securities 100 371.83 402.64Shield Fund ** Arab African Investement Management 50 102.99 107.34Misr Iran Development Bank I HC Securities 100 338.36 339.11Commercial International Bank II (Istethmar) CI Asset Management 100 75.02 78.35Piraeus Bank-Egypt I Phoneix Kato Asset Management 100 83.68 89.51Housing & Development Bank (Al-Taameer) Prime Investment 100 90.94 97.88ABC Bank Delta Rasmala 100 77.07 83.83Suez Canal Bank II (Al-Agyal) Beltone Asset Management 10 9.61 10.14Blom Bank Prime Investment 100 14.22 96.5Pahros Fund I Pharos Asset Management 100 - 95.89
Open-end Fixed Income FundsAl Rabeh Fund++ Prime Investment 100 101.88 100.01Credit Agricole Egypt III *** Egyptian Fund Management Group 1000 1036.88 1000.43Misr Money Market Beltone Asset Management 10 15.06 15.66Commercial International Bank I (Osoul) CI Asset Management 100 142.65 148.43Misr Iran Development Bank II HC Securities 1000 1041.55 1000.41Bank of Alexandria II EFG-Hermes 10 13 13.53National Bank of Egypt IV El Ahly Fund Management 100 128.08 132.89National Societe Generale Bank (Themar) EFG-Hermes 100 124.98 129.95Export Development Bank II Delta Rasmala 100 123.99 128.72ABC Bank (Mazaya) Beltone Asset Management 10 10.24 10.6HSBC Egypt Bank Fund (Kol Youm) Beltone Asset Management 100 101.56 105.38AAIB (Juman) Arab African Investement Management 100 101.28 105Piraeus Bank-Egypt II Phoneix Kato Asset Management 10 10.08 10.46Audi Bank Fund EFG-Hermes 10 10.07 10.43Banque du Caire II Beltone Asset Management 10 - 10.28Blom Bank Fund II C I Capital Asset Management 100 - 101.82
Open-end Islamic FundsFaisal Islamic Bank EFG-Hermes 100 110.73 112.29Egyptian Saudi Finance Bank EFG-Hermes 100 78.53 79.93Faisal Islamic Bank - CIB (Al Amman) CI Asset Management 100 59.62 61.47Banque Misr IV HC Securities 100 75.04 75.95Sanabel Fund Prime Investment 100 74.69 81.36Egyptian Saudi Finance -National Bank of Egypt (Bashaer) El-Ahly Fund Management 100 74.4 72.92
Closed-end FundsOrient Trust Egyptian Investment & Finance Co. 1000 1262.51 1159.61Misr Direct Investment Fund Al Ahly Development & Investment 1000 1027.3 1035Arab Land Direct Prime Investment 1000 716.94 705.08
Capital Guaranteed FundsMisr Bank Capital Guaranteed Cairo Funds Management 100 211.4 213.12
Asset Allocator FundsSociete Arab Int'l Bankque I+ Prime Investment 100 387.12 422.77Societe Arab Int'l Bankque II Prime Investment 100 271.11 295.59
Capital Protected FundsHSBC Egypt Fund II EFG-Hermes 100 87.76 91.91
Foreign Currency FundsMisr Money Market ($) Beltone Asset Management $10 $10.61 $10.64Misr Money Market (Euro) Beltone Asset Management € 10 € 10.66 € 10.69
Fund of FundsMisr Iran Development Bank III (Wafi) El Rashad Asset Management 10 - 9.86National Bank of Egypt VI El Rashad Asset Management 100 - 98.44
Source: Monthly Bulletin of the Egyptian Stock Exchange* The name of Misr Exterior Bank fund has changed to Banque Misr III Fund starting from 16/9/2004 after the merger of Misr Exterior Bank with Banque Misr. The price of issuing the document has also changed from
LE 1000 to LE100 after the amendment of Article (5) of the fund's prospectus as of 27/08/2006.
** The name of Misr International Bank fund has changed to Shield Fund starting from 2/4/2006 and the document has been split into a ratio of 1:2 on the same date. The par value has also changed from LE 100 to LE 50.*** The name of Egyptian American Bank Fund has changed to Credit Agricole Egypt starting from 03/09/2006.+ The fund's document has been split into a ratio of 1: 5 and the par value has also changed from LE 500 to LE100 as of 29/03/2007.++ The fund's name has changed to Al Rabeh Fund instead of Societe Arab Int'l Banque III.
+++ The document has been split as of November 2007.
++++ Two free documents have been distributed for each original document on 28/6/2007.+++++ The fund's document has been split into a ratio of 1: 5 as of 10/11/2009.
(2/2/2) Local Mutual Funds Authorized and Operating as at 31/12/2009
- 158 -
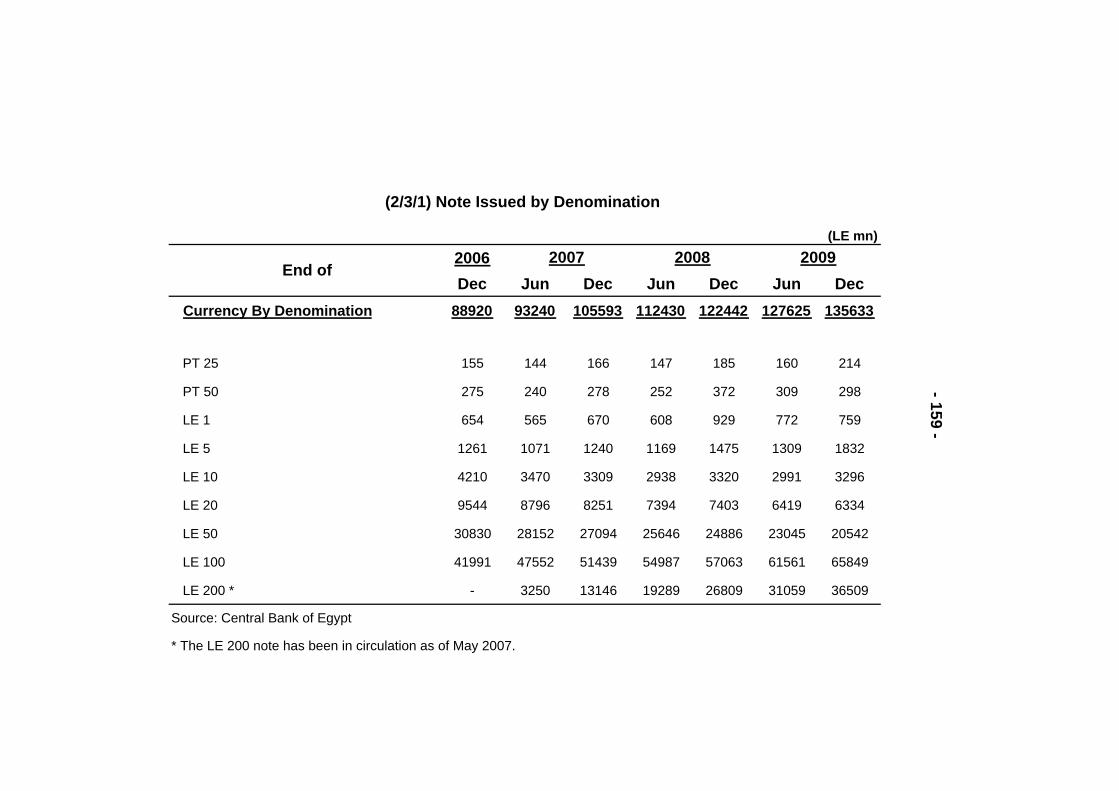
2006Dec Jun Dec Jun Dec Jun Dec
Currency By Denomination 88920 93240 105593 112430 122442 127625 135633
PT 25 155 144 166 147 185 160 214
PT 50 275 240 278 252 372 309 298
LE 1 654 565 670 608 929 772 759
LE 5 1261 1071 1240 1169 1475 1309 1832
LE 10 4210 3470 3309 2938 3320 2991 3296
LE 20 9544 8796 8251 7394 7403 6419 6334
LE 50 30830 28152 27094 25646 24886 23045 20542
LE 100 41991 47552 51439 54987 57063 61561 65849
LE 200 * - 3250 13146 19289 26809 31059 36509
Source: Central Bank of Egypt
* The LE 200 note has been in circulation as of May 2007.
End of
- 159 -
2007 2008 2009(LE mn)
(2/3/1) Note Issued by Denomination
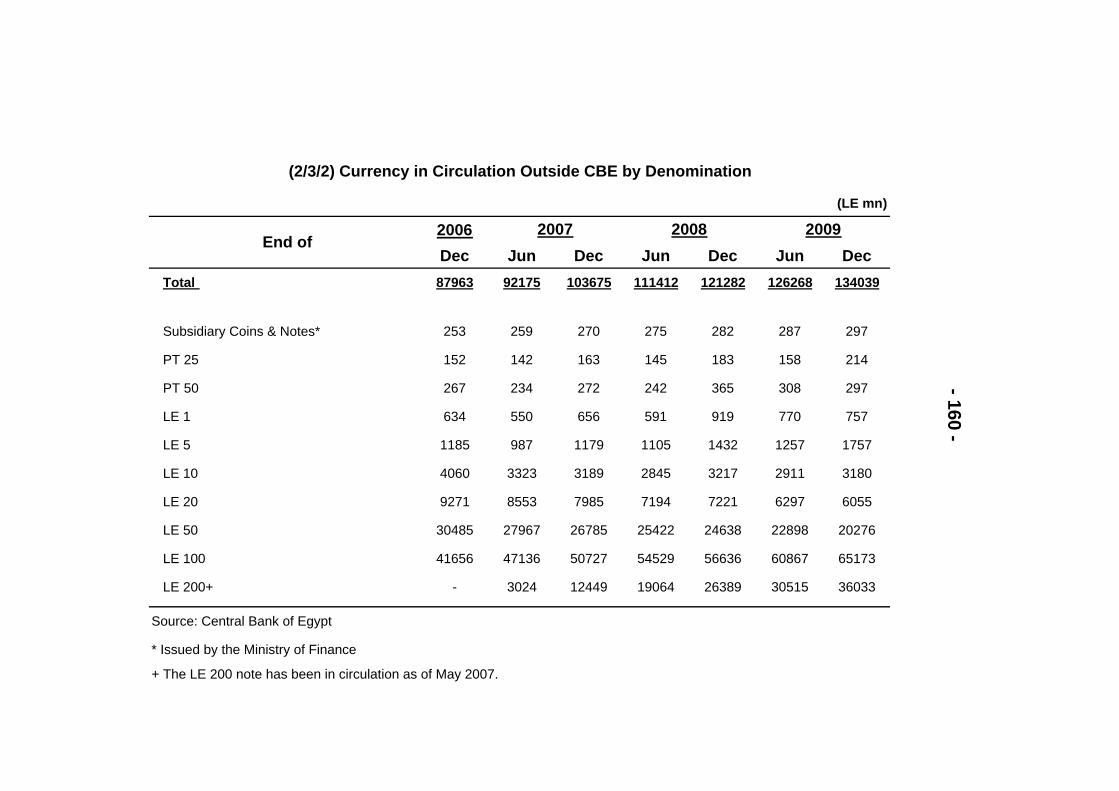
2006Dec Jun Dec Jun Dec Jun Dec
Total 87963 92175 103675 111412 121282 126268 134039
Subsidiary Coins & Notes* 253 259 270 275 282 287 297
PT 25 152 142 163 145 183 158 214
PT 50 267 234 272 242 365 308 297
LE 1 634 550 656 591 919 770 757
LE 5 1185 987 1179 1105 1432 1257 1757
LE 10 4060 3323 3189 2845 3217 2911 3180
LE 20 9271 8553 7985 7194 7221 6297 6055
LE 50 30485 27967 26785 25422 24638 22898 20276
LE 100 41656 47136 50727 54529 56636 60867 65173
LE 200+ - 3024 12449 19064 26389 30515 36033
Source: Central Bank of Egypt
* Issued by the Ministry of Finance
+ The LE 200 note has been in circulation as of May 2007.
- 160 -
2007 2008 End of
2009(LE mn)
(2/3/2) Currency in Circulation Outside CBE by Denomination
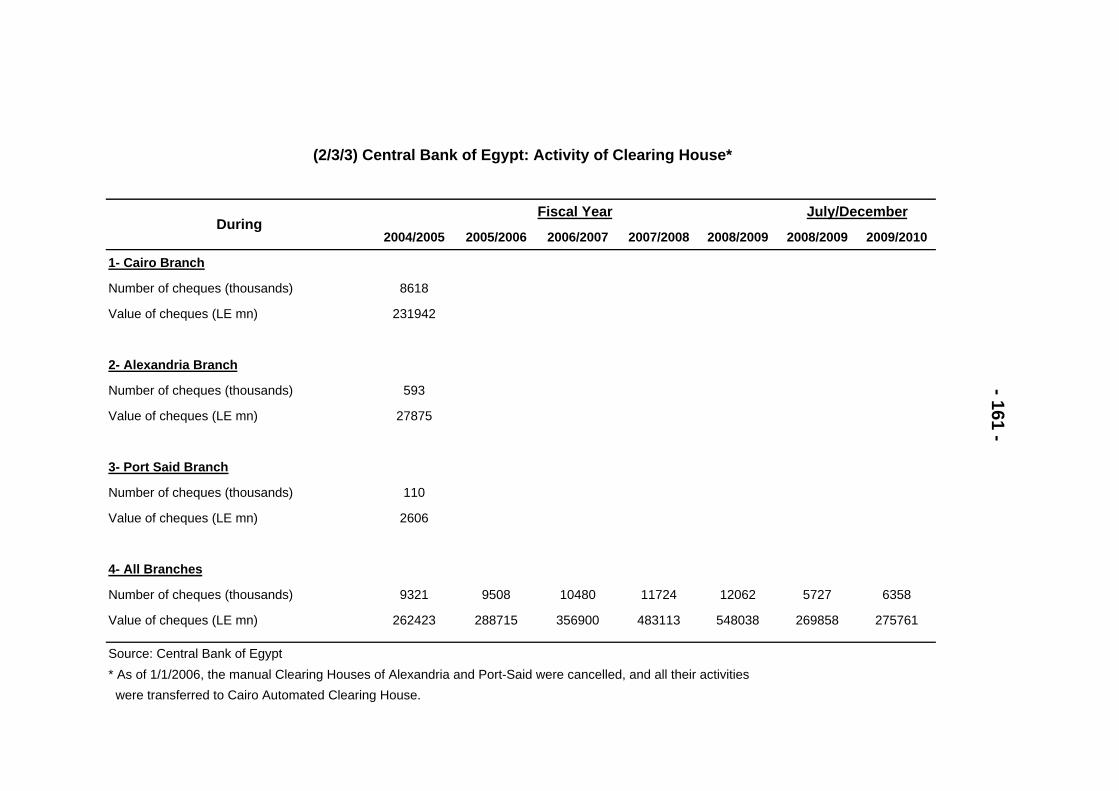
2004/2005 2005/2006 2006/2007 2007/2008 2008/2009 2008/2009 2009/2010
1- Cairo Branch
Number of cheques (thousands) 8618
Value of cheques (LE mn) 231942
2- Alexandria Branch
Number of cheques (thousands) 593
Value of cheques (LE mn) 27875
3- Port Said Branch
Number of cheques (thousands) 110
Value of cheques (LE mn) 2606
4- All Branches
Number of cheques (thousands) 9321 9508 10480 11724 12062 5727 6358
Value of cheques (LE mn) 262423 288715 356900 483113 548038 269858 275761
Source: Central Bank of Egypt
(2/3/3) Central Bank of Egypt: Activity of Clearing House*
- 161 -
* As of 1/1/2006, the manual Clearing Houses of Alexandria and Port-Said were cancelled, and all their activities were transferred to Cairo Automated Clearing House.
DuringJuly/DecemberFiscal Year
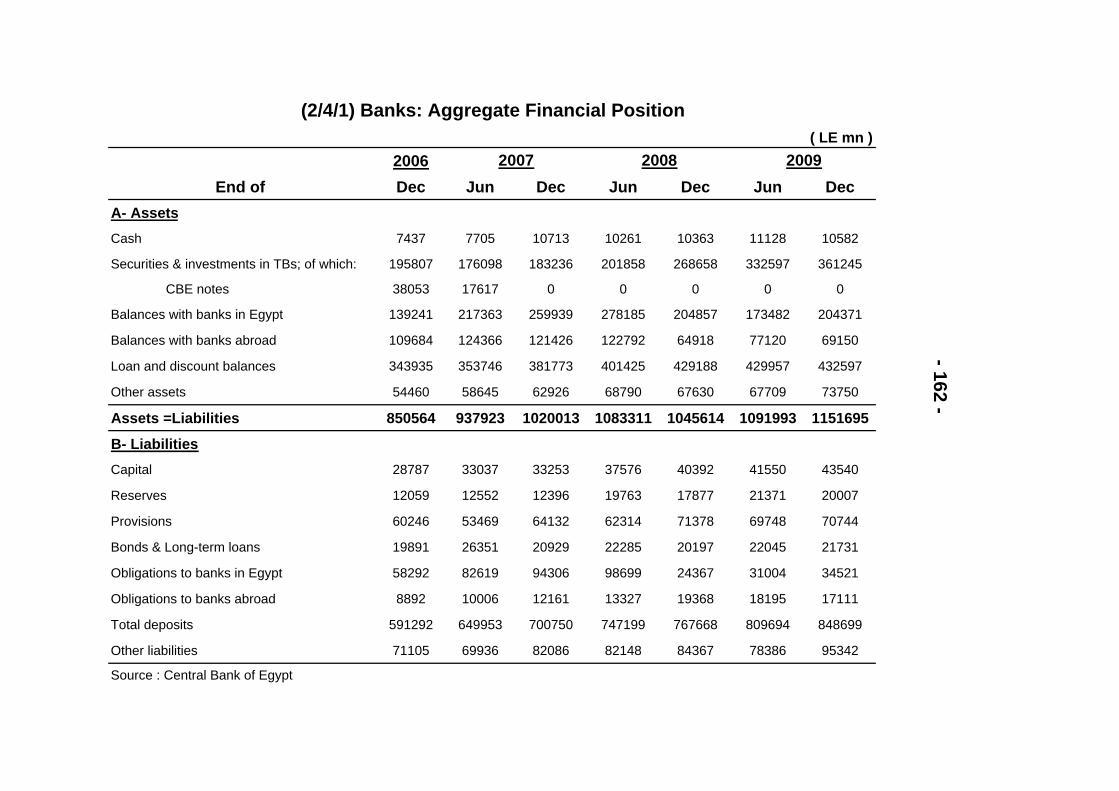
2006End of Dec Jun Dec Jun Dec Jun Dec
A- AssetsCash 7437 7705 10713 10261 10363 11128 10582
Securities & investments in TBs; of which: 195807 176098 183236 201858 268658 332597 361245
CBE notes 38053 17617 0 0 0 0 0
Balances with banks in Egypt 139241 217363 259939 278185 204857 173482 204371
Balances with banks abroad 109684 124366 121426 122792 64918 77120 69150
Loan and discount balances 343935 353746 381773 401425 429188 429957 432597
Other assets 54460 58645 62926 68790 67630 67709 73750
Assets =Liabilities 850564 937923 1020013 1083311 1045614 1091993 1151695
B- LiabilitiesCapital 28787 33037 33253 37576 40392 41550 43540
Reserves 12059 12552 12396 19763 17877 21371 20007
Provisions 60246 53469 64132 62314 71378 69748 70744
Bonds & Long-term loans 19891 26351 20929 22285 20197 22045 21731
Obligations to banks in Egypt 58292 82619 94306 98699 24367 31004 34521
Obligations to banks abroad 8892 10006 12161 13327 19368 18195 17111
Total deposits 591292 649953 700750 747199 767668 809694 848699
Other liabilities 71105 69936 82086 82148 84367 78386 95342
Source : Central Bank of Egypt
- 162 - 2007 2008 2009
( LE mn )
(2/4/1) Banks: Aggregate Financial Position
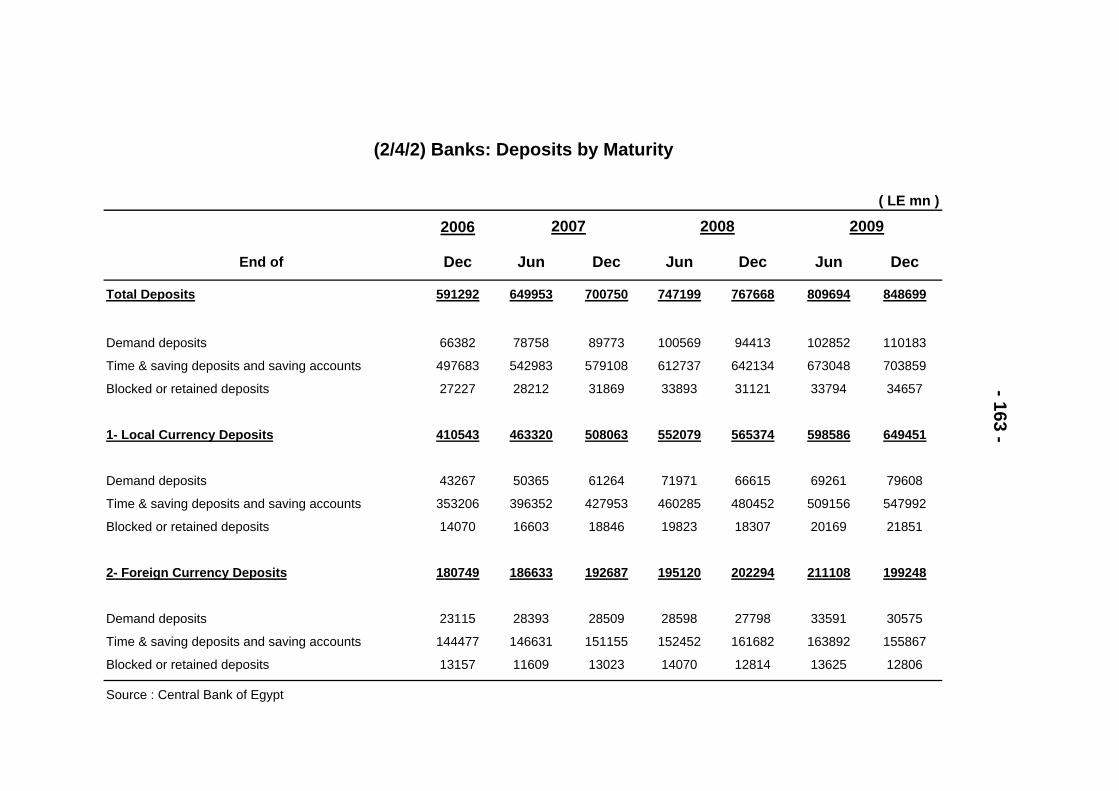
2006
End of Dec Jun Dec Jun Dec Jun Dec
Total Deposits 591292 649953 700750 747199 767668 809694 848699
Demand deposits 66382 78758 89773 100569 94413 102852 110183
Time & saving deposits and saving accounts 497683 542983 579108 612737 642134 673048 703859
Blocked or retained deposits 27227 28212 31869 33893 31121 33794 34657
1- Local Currency Deposits 410543 463320 508063 552079 565374 598586 649451
Demand deposits 43267 50365 61264 71971 66615 69261 79608
Time & saving deposits and saving accounts 353206 396352 427953 460285 480452 509156 547992
Blocked or retained deposits 14070 16603 18846 19823 18307 20169 21851
2- Foreign Currency Deposits 180749 186633 192687 195120 202294 211108 199248
Demand deposits 23115 28393 28509 28598 27798 33591 30575
Time & saving deposits and saving accounts 144477 146631 151155 152452 161682 163892 155867
Blocked or retained deposits 13157 11609 13023 14070 12814 13625 12806
Source : Central Bank of Egypt
- 163 -
2007 2008 2009( LE mn )
(2/4/2) Banks: Deposits by Maturity

2006End of Dec Jun Dec Jun Dec Jun Dec
Total Deposits 591292 649953 700750 747199 767668 809694 848699
Local Currency Deposits 410543 463320 508063 552079 565374 598586 649451
Government sector 38733 37233 44780 44789 47659 49564 61450
Public business sector * 21066 23464 26493 29434 30176 28799 29932
Private business sector 47013 77504 99295 119716 102175 104250 115160
Household sector 301403 321793 334097 354119 382345 413558 440215
External sector ** 2328 3326 3398 4021 3019 2415 2694
Foreign Currency Deposits 180749 186633 192687 195120 202294 211108 199248
Government sector 30063 30329 30644 33203 37016 41481 41839
Public business sector * 6247 6721 8884 9146 10032 8736 7355
Private business sector 47996 49093 55927 57202 59405 58321 52820
Household sector 95262 98331 95678 93653 93938 100210 94790
External sector** 1181 2159 1554 1916 1903 2360 2444
Source : Central Bank of Egypt
*Including all public sector companies subject or not to Law No. 203 for 1991 .
**Including counterpart deposits of USAID .
- 164 -
2007 2008 2009( LE mn )
(2/4/3) Banks: Deposits by Sector
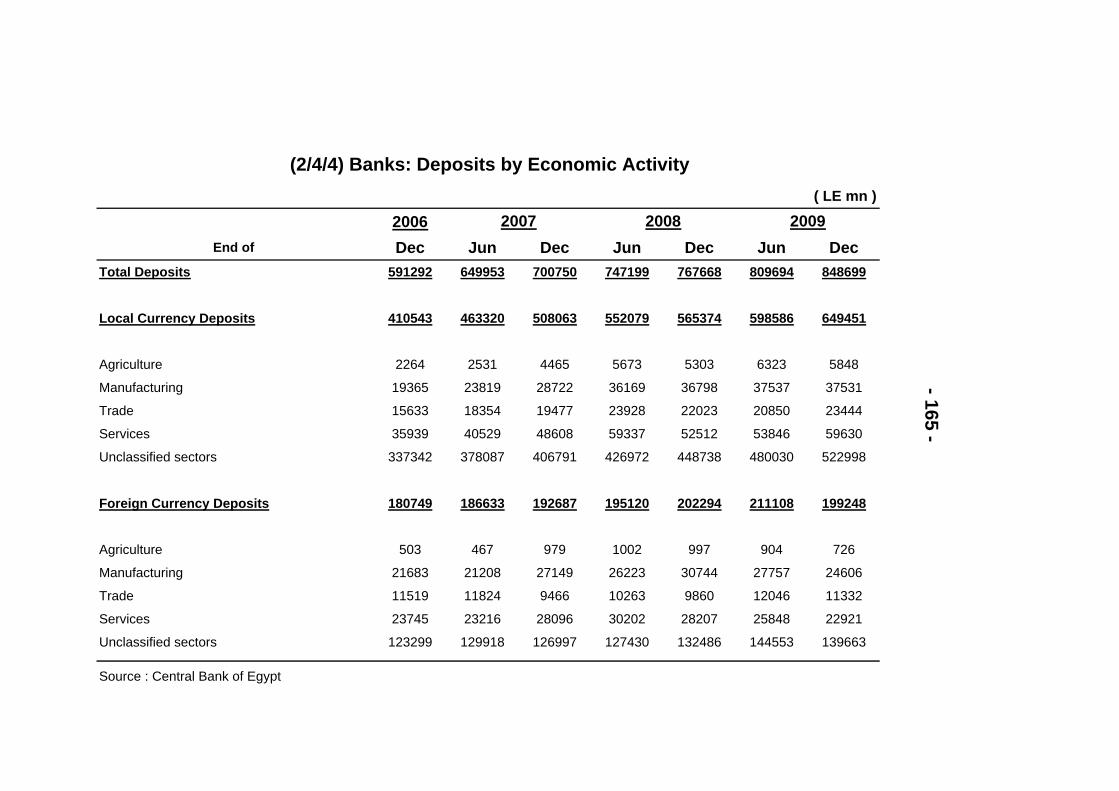
2006End of Dec Jun Dec Jun Dec Jun Dec
Total Deposits 591292 649953 700750 747199 767668 809694 848699
Local Currency Deposits 410543 463320 508063 552079 565374 598586 649451
Agriculture 2264 2531 4465 5673 5303 6323 5848
Manufacturing 19365 23819 28722 36169 36798 37537 37531
Trade 15633 18354 19477 23928 22023 20850 23444
Services 35939 40529 48608 59337 52512 53846 59630
Unclassified sectors 337342 378087 406791 426972 448738 480030 522998
Foreign Currency Deposits 180749 186633 192687 195120 202294 211108 199248
Agriculture 503 467 979 1002 997 904 726
Manufacturing 21683 21208 27149 26223 30744 27757 24606
Trade 11519 11824 9466 10263 9860 12046 11332
Services 23745 23216 28096 30202 28207 25848 22921
Unclassified sectors 123299 129918 126997 127430 132486 144553 139663
Source : Central Bank of Egypt
- 165 - 2007 2008 2009
(2/4/4) Banks: Deposits by Economic Activity( LE mn )
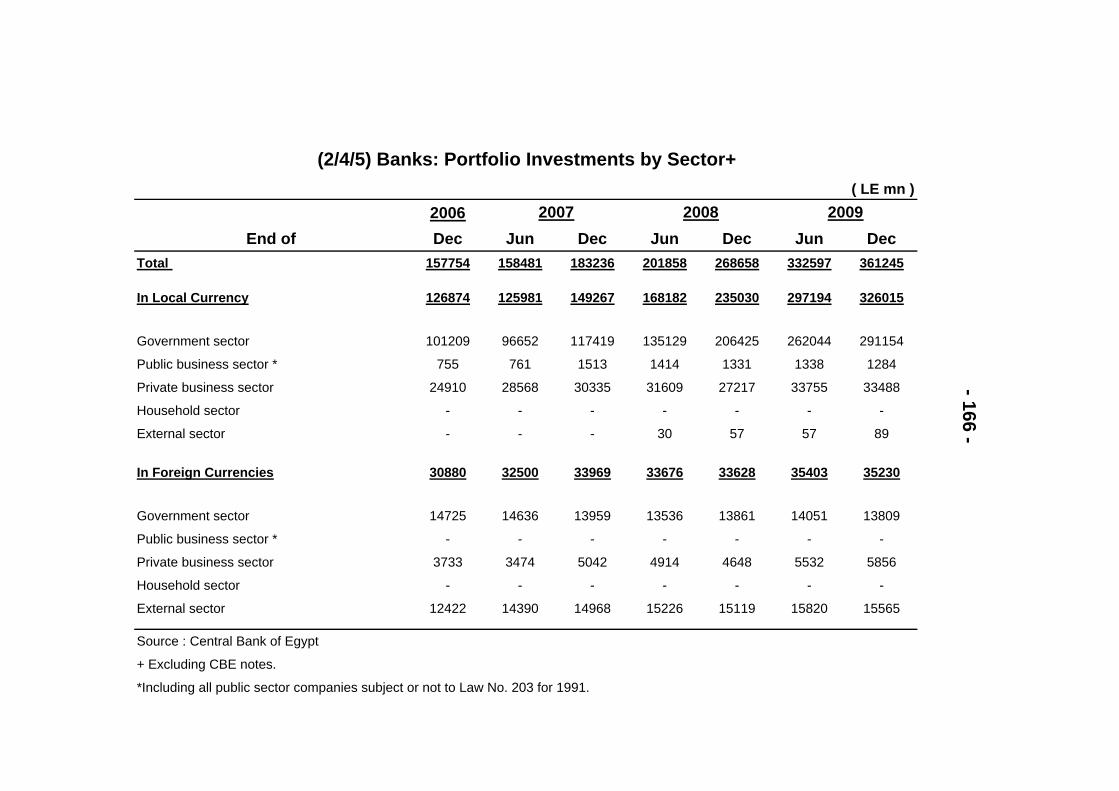
2006End of Dec Jun Dec Jun Dec Jun Dec
Total 157754 158481 183236 201858 268658 332597 361245
In Local Currency 126874 125981 149267 168182 235030 297194 326015
Government sector 101209 96652 117419 135129 206425 262044 291154
Public business sector * 755 761 1513 1414 1331 1338 1284
Private business sector 24910 28568 30335 31609 27217 33755 33488
Household sector - - - - - - -
External sector - - - 30 57 57 89
In Foreign Currencies 30880 32500 33969 33676 33628 35403 35230
Government sector 14725 14636 13959 13536 13861 14051 13809
Public business sector * - - - - - - -
Private business sector 3733 3474 5042 4914 4648 5532 5856
Household sector - - - - - - -
External sector 12422 14390 14968 15226 15119 15820 15565
Source : Central Bank of Egypt
+ Excluding CBE notes.
*Including all public sector companies subject or not to Law No. 203 for 1991.
- 166 -
2007 2008 2009
(2/4/5) Banks: Portfolio Investments by Sector+( LE mn )
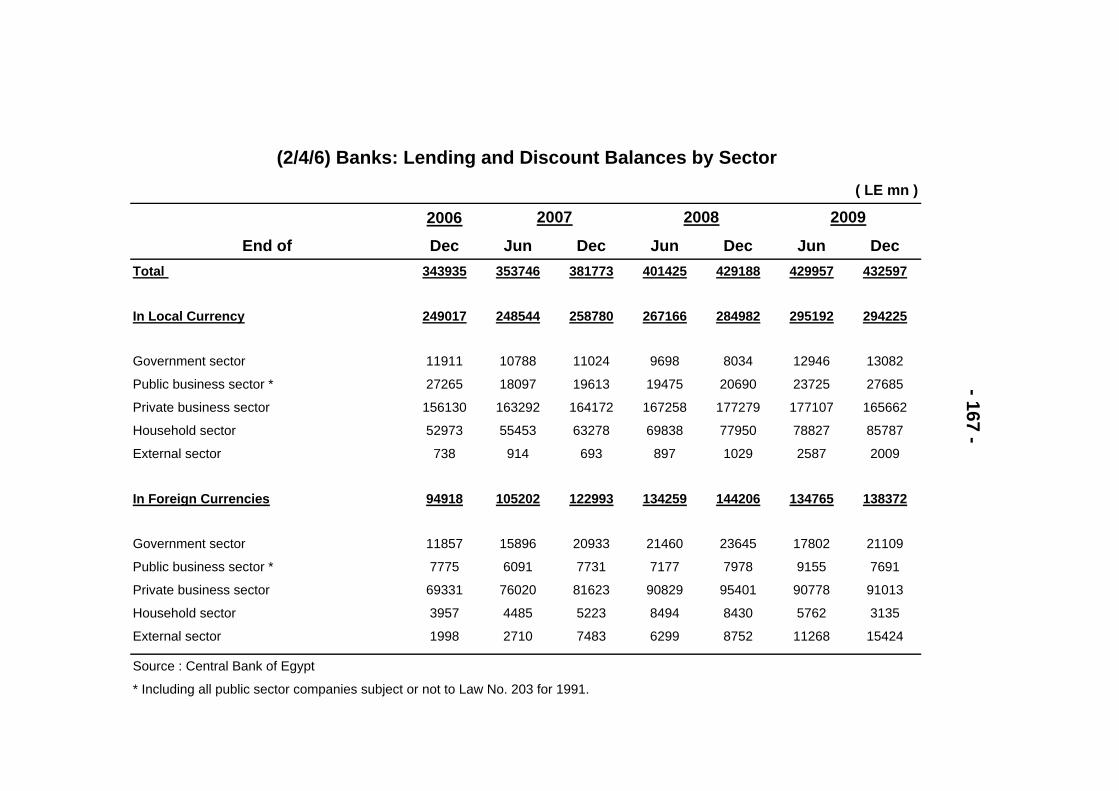
2006
End of Dec Jun Dec Jun Dec Jun DecTotal 343935 353746 381773 401425 429188 429957 432597
In Local Currency 249017 248544 258780 267166 284982 295192 294225
Government sector 11911 10788 11024 9698 8034 12946 13082
Public business sector * 27265 18097 19613 19475 20690 23725 27685
Private business sector 156130 163292 164172 167258 177279 177107 165662
Household sector 52973 55453 63278 69838 77950 78827 85787
External sector 738 914 693 897 1029 2587 2009
In Foreign Currencies 94918 105202 122993 134259 144206 134765 138372
Government sector 11857 15896 20933 21460 23645 17802 21109
Public business sector * 7775 6091 7731 7177 7978 9155 7691
Private business sector 69331 76020 81623 90829 95401 90778 91013
Household sector 3957 4485 5223 8494 8430 5762 3135
External sector 1998 2710 7483 6299 8752 11268 15424
Source : Central Bank of Egypt
* Including all public sector companies subject or not to Law No. 203 for 1991.
- 167 -
2007 2008 2009
(2/4/6) Banks: Lending and Discount Balances by Sector( LE mn )

2006End of Dec Jun Dec Jun Dec Jun Dec
Total 501689 512227 565009 603283 697846 762554 793842
In Local Currency 375891 374525 408047 435348 520012 592386 620240
Government sector 113120 107440 128443 144827 214459 274990 304236
Public business sector * 28020 18858 21126 20889 22021 25063 28969
Private business sector 181040 191860 194507 198867 204496 210862 199150
Household sector 52973 55453 63278 69838 77950 78827 85787
External sector 738 914 693 927 1086 2644 2098
In Foreign Currencies 125798 137702 156962 167935 177834 170168 173602
Government sector 26582 30532 34892 34996 37506 31853 34918
Public business sector * 7775 6091 7731 7177 7978 9155 7691
Private business sector 73064 79494 86665 95743 100049 96310 96869
Household sector 3957 4485 5223 8494 8430 5762 3135
External sector 14420 17100 22451 21525 23871 27088 30989
Source : Central Bank of Egypt
*Including all public sector companies subject or not to Law No. 203 for 1991.
- 168 -
2007 2008 2009( LE mn )
(2/4/7) Banks: Credit by Sector
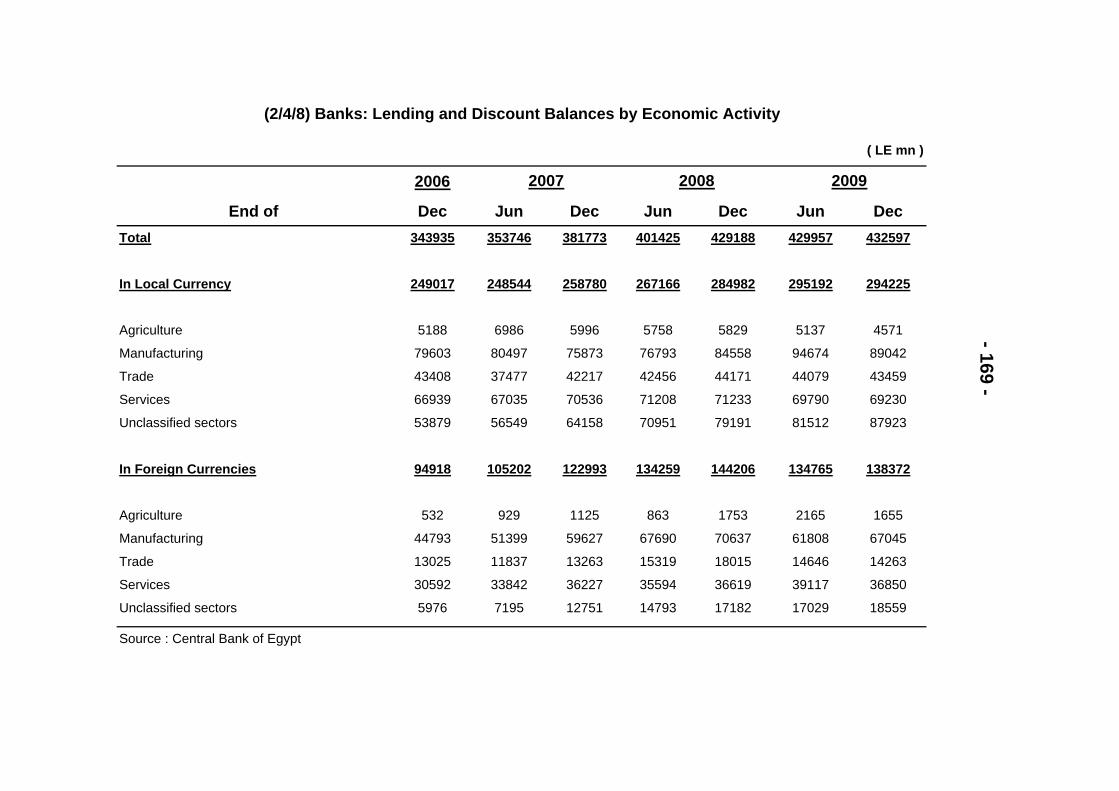
2006
End of Dec Jun Dec Jun Dec Jun DecTotal 343935 353746 381773 401425 429188 429957 432597
In Local Currency 249017 248544 258780 267166 284982 295192 294225
Agriculture 5188 6986 5996 5758 5829 5137 4571
Manufacturing 79603 80497 75873 76793 84558 94674 89042
Trade 43408 37477 42217 42456 44171 44079 43459
Services 66939 67035 70536 71208 71233 69790 69230
Unclassified sectors 53879 56549 64158 70951 79191 81512 87923
In Foreign Currencies 94918 105202 122993 134259 144206 134765 138372
Agriculture 532 929 1125 863 1753 2165 1655
Manufacturing 44793 51399 59627 67690 70637 61808 67045
Trade 13025 11837 13263 15319 18015 14646 14263
Services 30592 33842 36227 35594 36619 39117 36850
Unclassified sectors 5976 7195 12751 14793 17182 17029 18559
Source : Central Bank of Egypt
- 169 -
2007 2008 2009
( LE mn )
(2/4/8) Banks: Lending and Discount Balances by Economic Activity
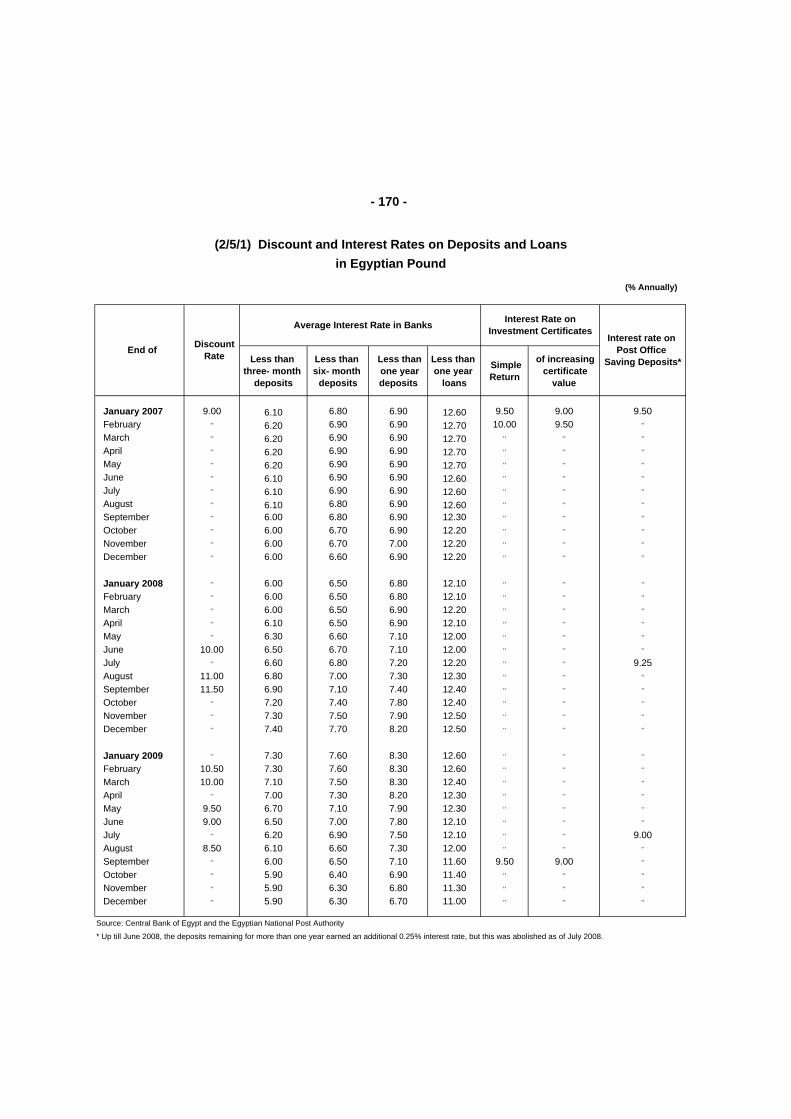
Less than three- month
deposits
Less than six- month
deposits
Less than one yeardeposits
Less than one year
loans
SimpleReturn
of increasing certificate
value
January 2007 9.00 6.10 6.80 6.90 12.60 9.50 9.00 9.50February ,, 6.20 6.90 6.90 12.70 10.00 9.50 ,,
March ,, 6.20 6.90 6.90 12.70 ,, ,, ,,
April ,, 6.20 6.90 6.90 12.70 ,, ,, ,,
May ,, 6.20 6.90 6.90 12.70 ,, ,, ,,
June ,, 6.10 6.90 6.90 12.60 ,, ,, ,,
July ,, 6.10 6.90 6.90 12.60 ,, ,, ,,
August ,, 6.10 6.80 6.90 12.60 ,, ,, ,,
September ,, 6.00 6.80 6.90 12.30 ,, ,, ,,
October ,, 6.00 6.70 6.90 12.20 ,, ,, ,,
November ,, 6.00 6.70 7.00 12.20 ,, ,, ,,
December ,, 6.00 6.60 6.90 12.20 ,, ,, ,,
January 2008 ,, 6.00 6.50 6.80 12.10 ,, ,, ,,
February ,, 6.00 6.50 6.80 12.10 ,, ,, ,,
March ,, 6.00 6.50 6.90 12.20 ,, ,, ,,
April ,, 6.10 6.50 6.90 12.10 ,, ,, ,,
May ,, 6.30 6.60 7.10 12.00 ,, ,, ,,
June 10.00 6.50 6.70 7.10 12.00 ,, ,, ,,
July ,, 6.60 6.80 7.20 12.20 ,, ,, 9.25August 11.00 6.80 7.00 7.30 12.30 ,, ,, ,,
September 11.50 6.90 7.10 7.40 12.40 ,, ,, ,,
October ,, 7.20 7.40 7.80 12.40 ,, ,, ,,
November ,, 7.30 7.50 7.90 12.50 ,, ,, ,,
December ,, 7.40 7.70 8.20 12.50 ,, ,, ,,
January 2009 ,, 7.30 7.60 8.30 12.60 ,, ,, ,,
February 10.50 7.30 7.60 8.30 12.60 ,, ,, ,,
March 10.00 7.10 7.50 8.30 12.40 ,, ,, ,,
April ,, 7.00 7.30 8.20 12.30 ,, ,, ,,
May 9.50 6.70 7.10 7.90 12.30 ,, ,, ,,
June 9.00 6.50 7.00 7.80 12.10 ,, ,, ,,
July ,, 6.20 6.90 7.50 12.10 ,, ,, 9.00August 8.50 6.10 6.60 7.30 12.00 ,, ,, ,,
September ,, 6.00 6.50 7.10 11.60 9.50 9.00 ,,
October ,, 5.90 6.40 6.90 11.40 ,, ,, ,,
November ,, 5.90 6.30 6.80 11.30 ,, ,, ,,
December ,, 5.90 6.30 6.70 11.00 ,, ,, ,,
Source: Central Bank of Egypt and the Egyptian National Post Authority
* Up till June 2008, the deposits remaining for more than one year earned an additional 0.25% interest rate, but this was abolished as of July 2008.
(2/5/1) Discount and Interest Rates on Deposits and Loans
End of Discount Rate
- 170 -
(% Annually)
Interest rate on Post Office
Saving Deposits*
Average Interest Rate in Banks Interest Rate on Investment Certificates
in Egyptian Pound
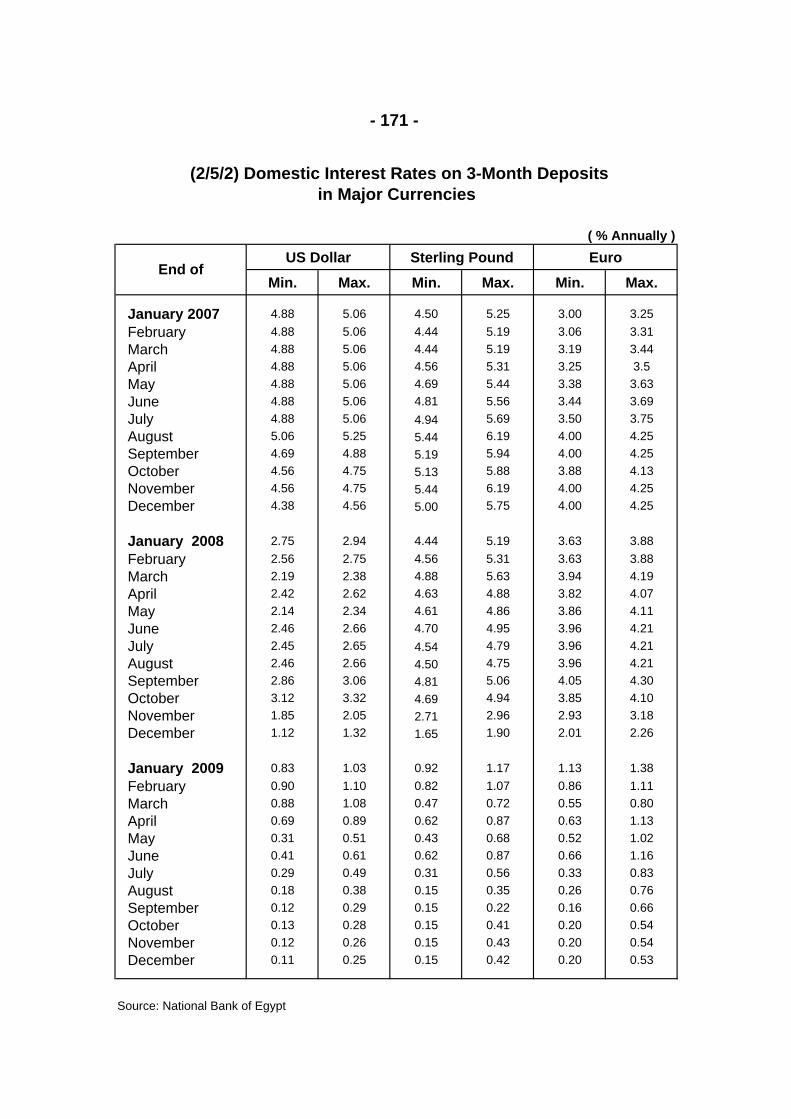
US Dollar Sterling Pound Euro
Min. Max. Min. Max. Min. Max.
January 2007 4.88 5.06 4.50 5.25 3.00 3.25February 4.88 5.06 4.44 5.19 3.06 3.31March 4.88 5.06 4.44 5.19 3.19 3.44April 4.88 5.06 4.56 5.31 3.25 3.5May 4.88 5.06 4.69 5.44 3.38 3.63June 4.88 5.06 4.81 5.56 3.44 3.69July 4.88 5.06 4.94 5.69 3.50 3.75August 5.06 5.25 5.44 6.19 4.00 4.25September 4.69 4.88 5.19 5.94 4.00 4.25October 4.56 4.75 5.13 5.88 3.88 4.13November 4.56 4.75 5.44 6.19 4.00 4.25December 4.38 4.56 5.00 5.75 4.00 4.25
January 2008 2.75 2.94 4.44 5.19 3.63 3.88February 2.56 2.75 4.56 5.31 3.63 3.88March 2.19 2.38 4.88 5.63 3.94 4.19April 2.42 2.62 4.63 4.88 3.82 4.07May 2.14 2.34 4.61 4.86 3.86 4.11June 2.46 2.66 4.70 4.95 3.96 4.21July 2.45 2.65 4.54 4.79 3.96 4.21August 2.46 2.66 4.50 4.75 3.96 4.21September 2.86 3.06 4.81 5.06 4.05 4.30October 3.12 3.32 4.69 4.94 3.85 4.10November 1.85 2.05 2.71 2.96 2.93 3.18December 1.12 1.32 1.65 1.90 2.01 2.26
January 2009 0.83 1.03 0.92 1.17 1.13 1.38February 0.90 1.10 0.82 1.07 0.86 1.11March 0.88 1.08 0.47 0.72 0.55 0.80April 0.69 0.89 0.62 0.87 0.63 1.13May 0.31 0.51 0.43 0.68 0.52 1.02June 0.41 0.61 0.62 0.87 0.66 1.16July 0.29 0.49 0.31 0.56 0.33 0.83August 0.18 0.38 0.15 0.35 0.26 0.76September 0.12 0.29 0.15 0.22 0.16 0.66October 0.13 0.28 0.15 0.41 0.20 0.54November 0.12 0.26 0.15 0.43 0.20 0.54December 0.11 0.25 0.15 0.42 0.20 0.53
Source: National Bank of Egypt
End of
- 171 -
(2/5/2) Domestic Interest Rates on 3-Month Depositsin Major Currencies
( % Annually )
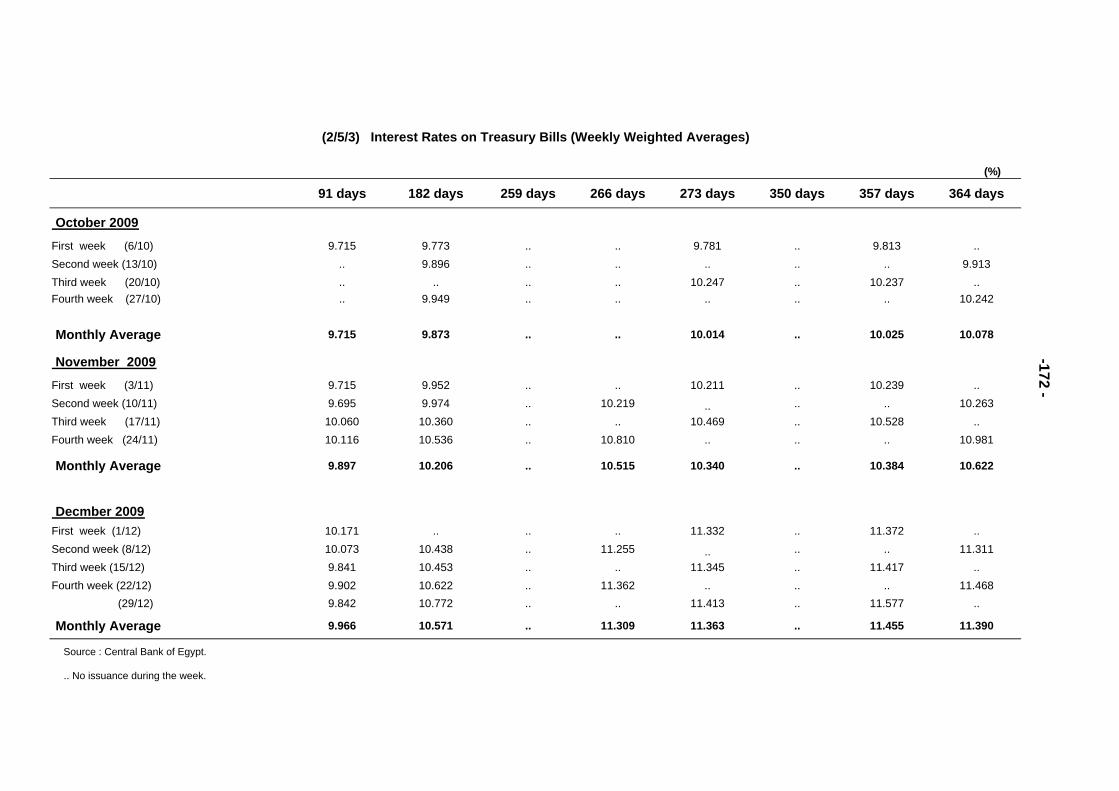
(%)
91 days 182 days 259 days 266 days 273 days 350 days 357 days 364 days
October 2009First week (6/10) 9.715 9.773 .. .. 9.781 .. 9.813 ..Second week (13/10) .. 9.896 .. .. .. .. .. 9.913Third week (20/10) .. .. .. .. 10.247 .. 10.237 ..Fourth week (27/10) .. 9.949 .. .. .. .. .. 10.242
Monthly Average 9.715 9.873 .. .. 10.014 .. 10.025 10.078
November 2009First week (3/11) 9.715 9.952 .. .. 10.211 .. 10.239 ..Second week (10/11) 9.695 9.974 .. 10.219 .. .. .. 10.263Third week (17/11) 10.060 10.360 .. .. 10.469 .. 10.528 ..Fourth week (24/11) 10.116 10.536 .. 10.810 .. .. .. 10.981
Monthly Average 9.897 10.206 .. 10.515 10.340 .. 10.384 10.622
Decmber 2009First week (1/12) 10.171 .. .. .. 11.332 .. 11.372 ..Second week (8/12) 10.073 10.438 .. 11.255 .. .. .. 11.311Third week (15/12) 9.841 10.453 .. .. 11.345 .. 11.417 ..Fourth week (22/12) 9.902 10.622 .. 11.362 .. .. .. 11.468
(29/12) 9.842 10.772 .. .. 11.413 .. 11.577 ..
Monthly Average 9.966 10.571 .. 11.309 11.363 .. 11.455 11.390
Source : Central Bank of Egypt.
.. No issuance during the week.
(2/5/3) Interest Rates on Treasury Bills (Weekly Weighted Averages)
-172 -
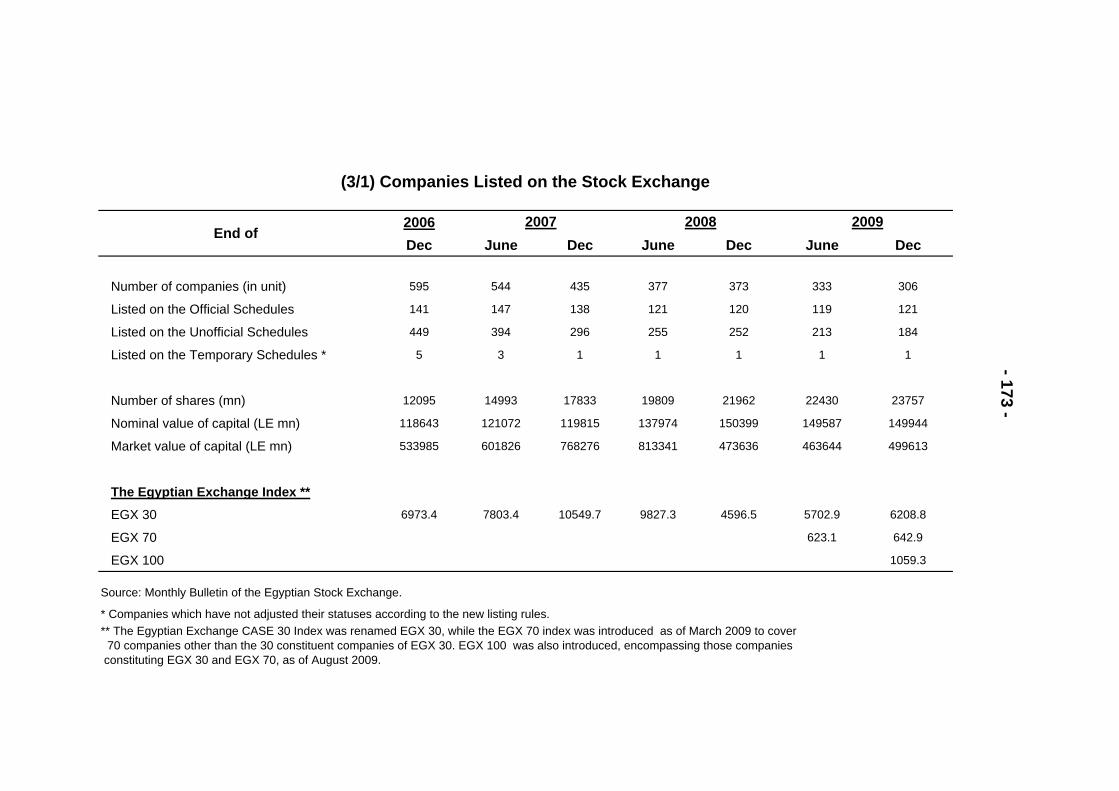
2006Dec June Dec June Dec June Dec
Number of companies (in unit) 595 544 435 377 373 333 306
Listed on the Official Schedules 141 147 138 121 120 119 121
Listed on the Unofficial Schedules 449 394 296 255 252 213 184
Listed on the Temporary Schedules * 5 3 1 1 1 1 1
Number of shares (mn) 12095 14993 17833 19809 21962 22430 23757
Nominal value of capital (LE mn) 118643 121072 119815 137974 150399 149587 149944
Market value of capital (LE mn) 533985 601826 768276 813341 473636 463644 499613
The Egyptian Exchange Index **EGX 30 6973.4 7803.4 10549.7 9827.3 4596.5 5702.9 6208.8
EGX 70 623.1 642.9
EGX 100 1059.3
Source: Monthly Bulletin of the Egyptian Stock Exchange.
* Companies which have not adjusted their statuses according to the new listing rules.** The Egyptian Exchange CASE 30 Index was renamed EGX 30, while the EGX 70 index was introduced as of March 2009 to cover 70 companies other than the 30 constituent companies of EGX 30. EGX 100 was also introduced, encompassing those companies constituting EGX 30 and EGX 70, as of August 2009.
- 173 -
2007 2008End of
2009
(3/1) Companies Listed on the Stock Exchange
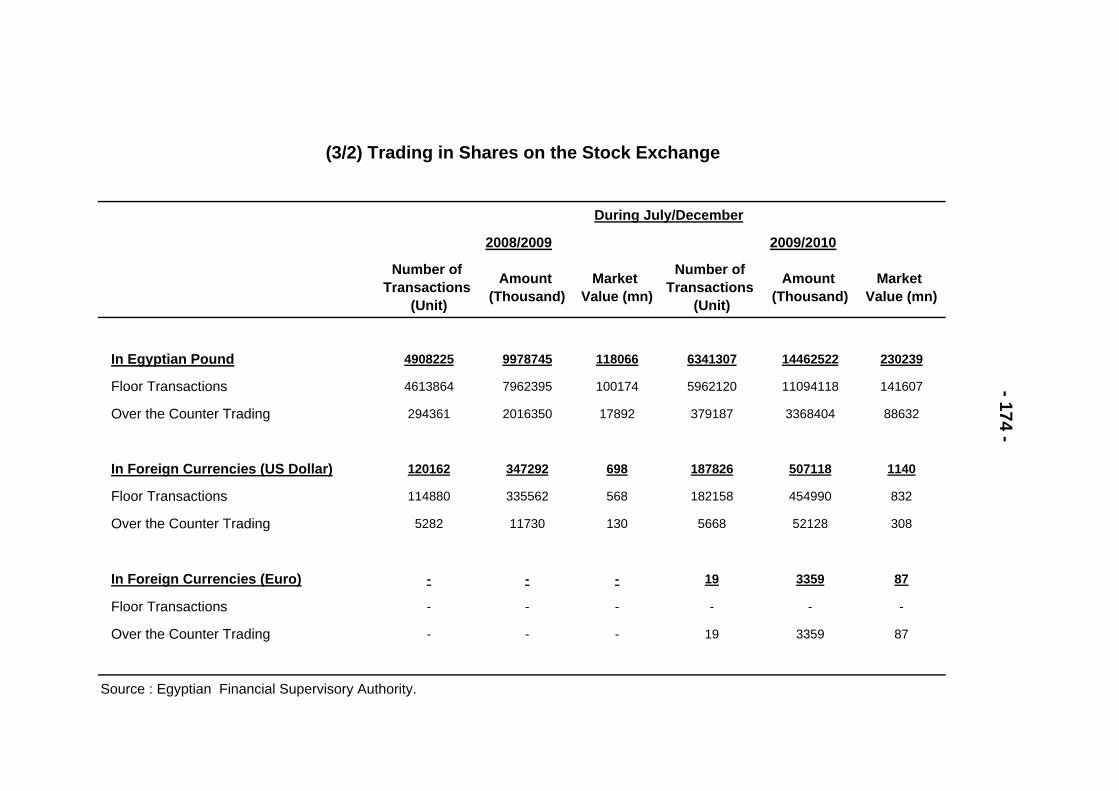
Number of Transactions
(Unit)
Amount (Thousand)
Market Value (mn)
Number of Transactions
(Unit)
Amount (Thousand)
Market Value (mn)
In Egyptian Pound 4908225 9978745 118066 6341307 14462522 230239
Floor Transactions 4613864 7962395 100174 5962120 11094118 141607
Over the Counter Trading 294361 2016350 17892 379187 3368404 88632
In Foreign Currencies (US Dollar) 120162 347292 698 187826 507118 1140
Floor Transactions 114880 335562 568 182158 454990 832
Over the Counter Trading 5282 11730 130 5668 52128 308
In Foreign Currencies (Euro) - - - 19 3359 87
Floor Transactions - - - - - -
Over the Counter Trading - - - 19 3359 87
Source : Egyptian Financial Supervisory Authority.
- 174 -
2009/20102008/2009
During July/December
(3/2) Trading in Shares on the Stock Exchange
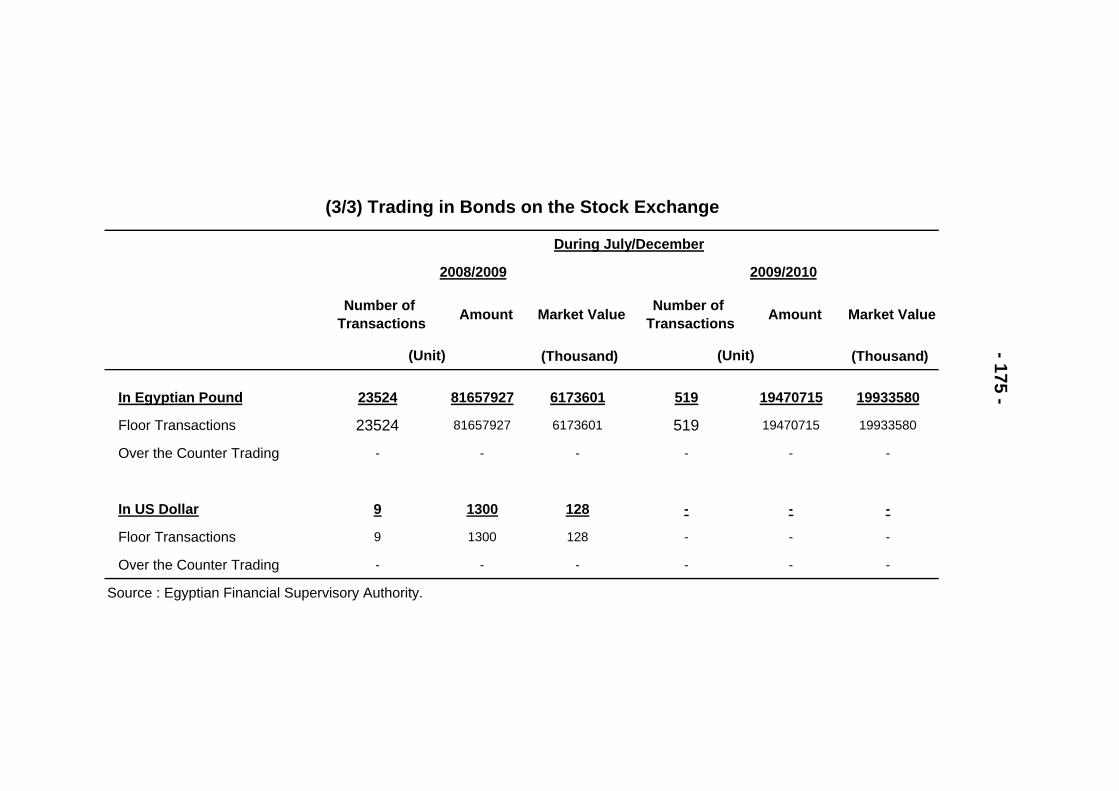
Number of Transactions Amount Market Value Number of
Transactions Amount Market Value
(Thousand) (Thousand)
In Egyptian Pound 23524 81657927 6173601 519 19470715 19933580
Floor Transactions 23524 81657927 6173601 519 19470715 19933580
Over the Counter Trading - - - - - -
In US Dollar 9 1300 128 - - -
Floor Transactions 9 1300 128 - - -
Over the Counter Trading - - - - - -
Source : Egyptian Financial Supervisory Authority.
(Unit) - 175 -
2008/2009 2009/2010
(Unit)
During July/December
(3/3) Trading in Bonds on the Stock Exchange
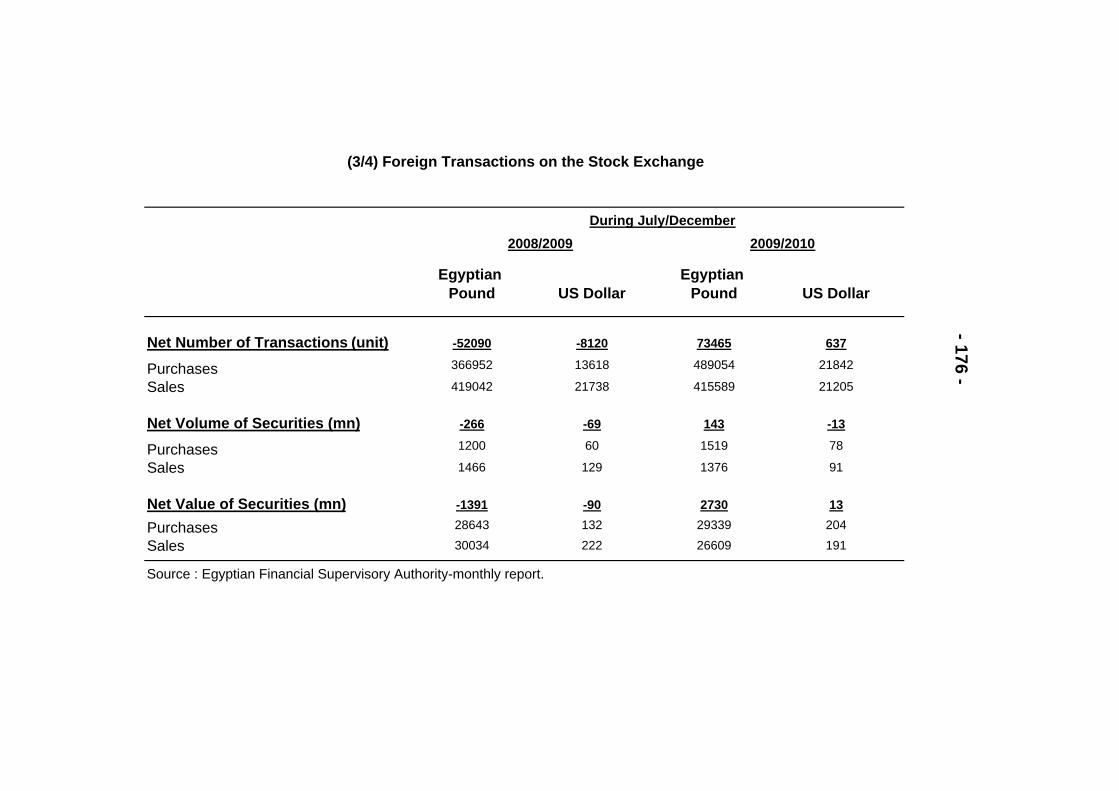
Egyptian Pound US Dollar
Egyptian Pound US Dollar
Net Number of Transactions (unit) -52090 -8120 73465 637
Purchases 366952 13618 489054 21842
Sales 419042 21738 415589 21205
Net Volume of Securities (mn) -266 -69 143 -13
Purchases 1200 60 1519 78
Sales 1466 129 1376 91
Net Value of Securities (mn) -1391 -90 2730 13
Purchases 28643 132 29339 204
Sales 30034 222 26609 191
Source : Egyptian Financial Supervisory Authority-monthly report.
- 176 -
2009/2010During July/December
2008/2009
(3/4) Foreign Transactions on the Stock Exchange
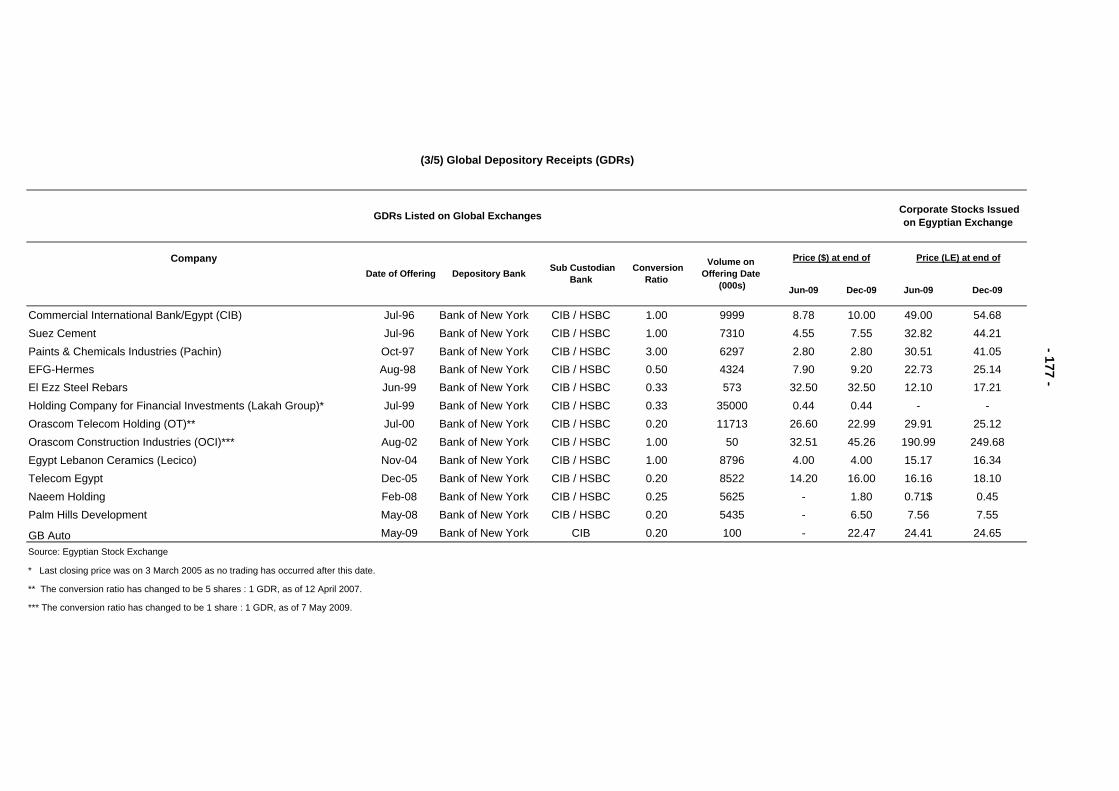
Company
Jun-09 Dec-09 Jun-09 Dec-09
Commercial International Bank/Egypt (CIB) Jul-96 Bank of New York CIB / HSBC 1.00 9999 8.78 10.00 49.00 54.68Suez Cement Jul-96 Bank of New York CIB / HSBC 1.00 7310 4.55 7.55 32.82 44.21Paints & Chemicals Industries (Pachin) Oct-97 Bank of New York CIB / HSBC 3.00 6297 2.80 2.80 30.51 41.05EFG-Hermes Aug-98 Bank of New York CIB / HSBC 0.50 4324 7.90 9.20 22.73 25.14El Ezz Steel Rebars Jun-99 Bank of New York CIB / HSBC 0.33 573 32.50 32.50 12.10 17.21Holding Company for Financial Investments (Lakah Group)* Jul-99 Bank of New York CIB / HSBC 0.33 35000 0.44 0.44 - -Orascom Telecom Holding (OT)** Jul-00 Bank of New York CIB / HSBC 0.20 11713 26.60 22.99 29.91 25.12Orascom Construction Industries (OCI)*** Aug-02 Bank of New York CIB / HSBC 1.00 50 32.51 45.26 190.99 249.68Egypt Lebanon Ceramics (Lecico) Nov-04 Bank of New York CIB / HSBC 1.00 8796 4.00 4.00 15.17 16.34Telecom Egypt Dec-05 Bank of New York CIB / HSBC 0.20 8522 14.20 16.00 16.16 18.10Naeem Holding Feb-08 Bank of New York CIB / HSBC 0.25 5625 - 1.80 0.71$ 0.45Palm Hills Development May-08 Bank of New York CIB / HSBC 0.20 5435 - 6.50 7.56 7.55
GB Auto May-09 Bank of New York CIB 0.20 100 - 22.47 24.41 24.65Source: Egyptian Stock Exchange
* Last closing price was on 3 March 2005 as no trading has occurred after this date.
** The conversion ratio has changed to be 5 shares : 1 GDR, as of 12 April 2007. *** The conversion ratio has changed to be 1 share : 1 GDR, as of 7 May 2009.
- 177 -
GDRs Listed on Global Exchanges
Price ($) at end of Price (LE) at end ofVolume on Offering Date
(000s)
Corporate Stocks Issuedon Egyptian Exchange
Date of Offering Depository Bank Sub CustodianBank
ConversionRatio
(3/5) Global Depository Receipts (GDRs)
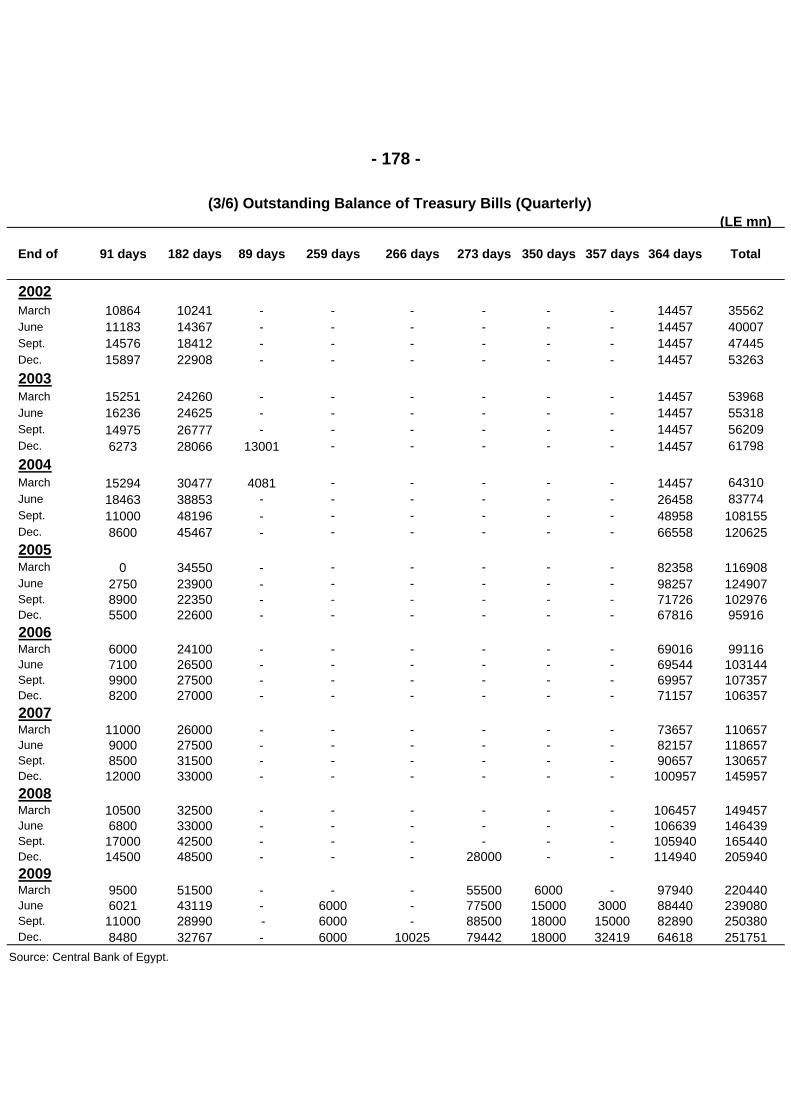
(LE mn)
End of 91 days 182 days 89 days 259 days 266 days 273 days 350 days 357 days 364 days Total
2002March 10864 10241 - - - - - - 14457 35562June 11183 14367 - - - - - - 14457 40007Sept. 14576 18412 - - - - - - 14457 47445Dec. 15897 22908 - - - - - - 14457 532632003March 15251 24260 - - - - - - 14457 53968June 16236 24625 - - - - - - 14457 55318Sept. 14975 26777 - - - - - - 14457 56209Dec. 6273 28066 13001 - - - - - 14457 617982004March 15294 30477 4081 - - - - - 14457 64310June 18463 38853 - - - - - - 26458 83774Sept. 11000 48196 - - - - - - 48958 108155Dec. 8600 45467 - - - - - - 66558 1206252005March 0 34550 - - - - - - 82358 116908June 2750 23900 - - - - - - 98257 124907Sept. 8900 22350 - - - - - - 71726 102976Dec. 5500 22600 - - - - - - 67816 959162006March 6000 24100 - - - - - - 69016 99116June 7100 26500 - - - - - - 69544 103144Sept. 9900 27500 - - - - - - 69957 107357Dec. 8200 27000 - - - - - - 71157 1063572007March 11000 26000 - - - - - - 73657 110657June 9000 27500 - - - - - - 82157 118657Sept. 8500 31500 - - - - - - 90657 130657Dec. 12000 33000 - - - - - - 100957 1459572008March 10500 32500 - - - - - - 106457 149457June 6800 33000 - - - - - - 106639 146439Sept. 17000 42500 - - - - - - 105940 165440Dec. 14500 48500 - - - 28000 - - 114940 2059402009March 9500 51500 - - - 55500 6000 - 97940 220440June 6021 43119 - 6000 - 77500 15000 3000 88440 239080Sept. 11000 28990 - 6000 - 88500 18000 15000 82890 250380Dec. 8480 32767 - 6000 10025 79442 18000 32419 64618 251751
Source: Central Bank of Egypt.
(3/6) Outstanding Balance of Treasury Bills (Quarterly)
- 178 -
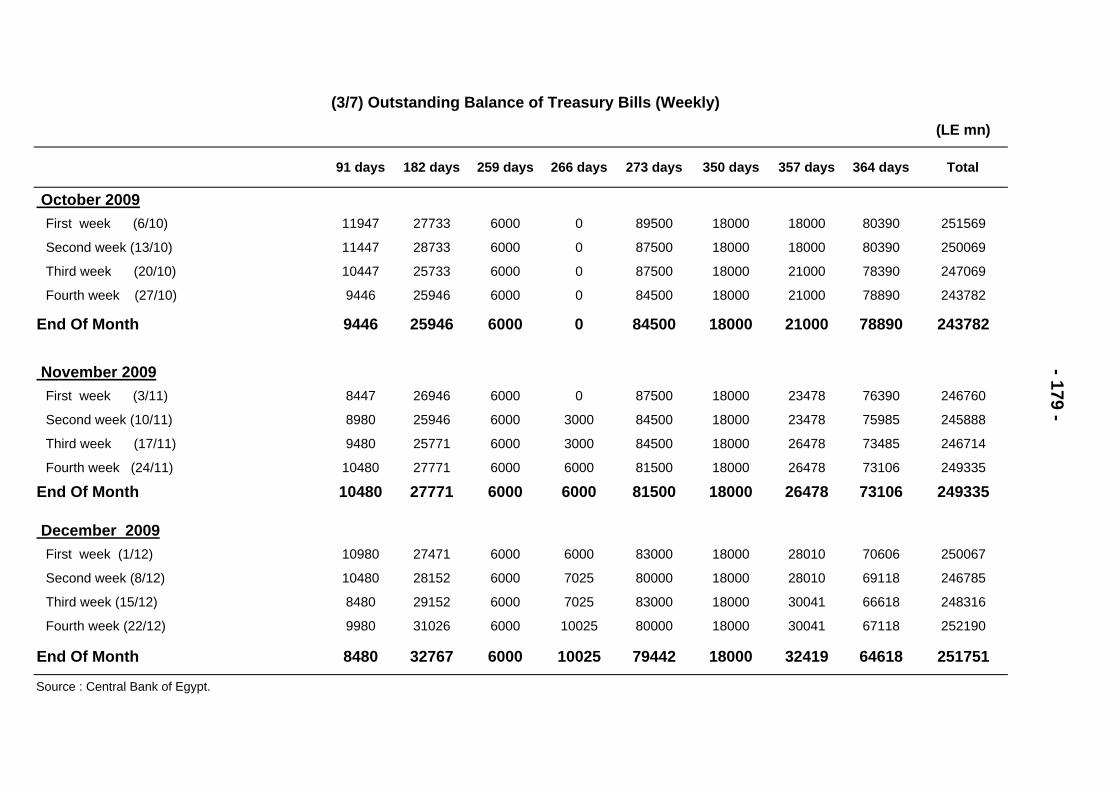
(LE mn)
91 days 182 days 259 days 266 days 273 days 350 days 357 days 364 days Total
October 2009First week (6/10) 11947 27733 6000 0 89500 18000 18000 80390 251569
Second week (13/10) 11447 28733 6000 0 87500 18000 18000 80390 250069
Third week (20/10) 10447 25733 6000 0 87500 18000 21000 78390 247069
Fourth week (27/10) 9446 25946 6000 0 84500 18000 21000 78890 243782
End Of Month 9446 25946 6000 0 84500 18000 21000 78890 243782
November 2009First week (3/11) 8447 26946 6000 0 87500 18000 23478 76390 246760
Second week (10/11) 8980 25946 6000 3000 84500 18000 23478 75985 245888
Third week (17/11) 9480 25771 6000 3000 84500 18000 26478 73485 246714
Fourth week (24/11) 10480 27771 6000 6000 81500 18000 26478 73106 249335
End Of Month 10480 27771 6000 6000 81500 18000 26478 73106 249335
December 2009First week (1/12) 10980 27471 6000 6000 83000 18000 28010 70606 250067
Second week (8/12) 10480 28152 6000 7025 80000 18000 28010 69118 246785
Third week (15/12) 8480 29152 6000 7025 83000 18000 30041 66618 248316
Fourth week (22/12) 9980 31026 6000 10025 80000 18000 30041 67118 252190
End Of Month 8480 32767 6000 10025 79442 18000 32419 64618 251751
Source : Central Bank of Egypt.
(3/7) Outstanding Balance of Treasury Bills (Weekly)
- 179 -
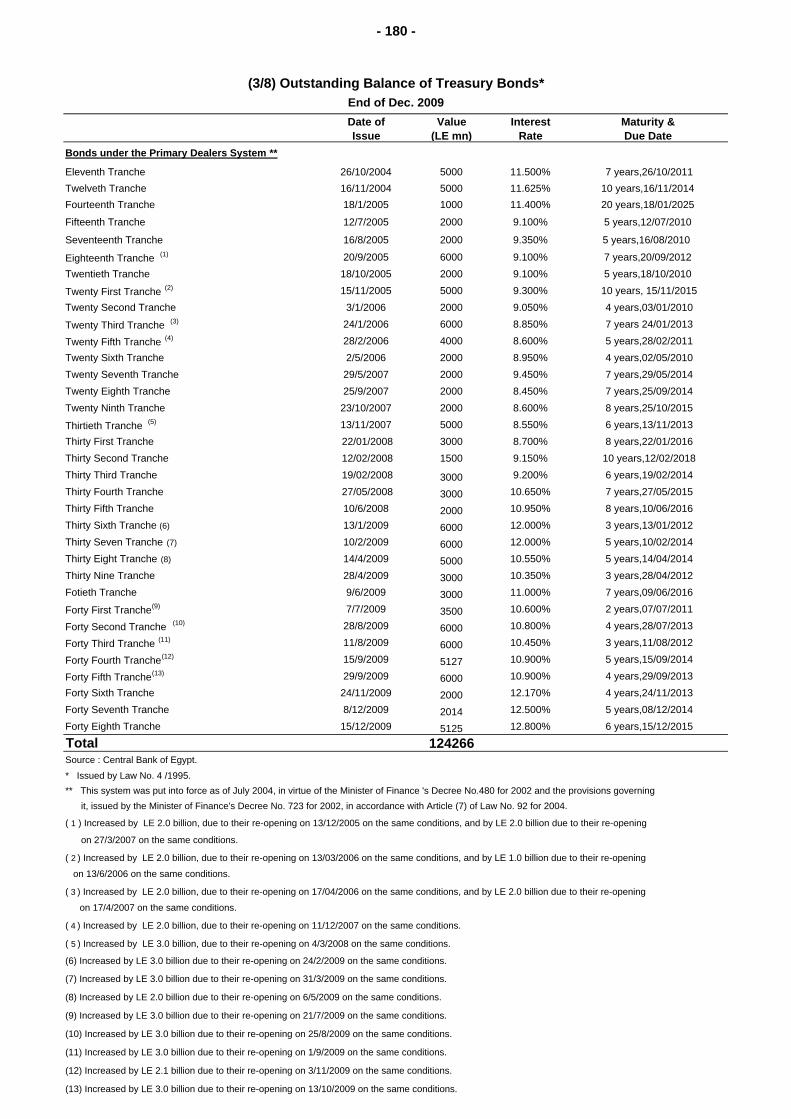
Date of Value Interest Maturity & Issue (LE mn) Rate Due Date
Bonds under the Primary Dealers System **
Eleventh Tranche 26/10/2004 5000 11.500% 7 years,26/10/2011Twelveth Tranche 16/11/2004 5000 11.625% 10 years,16/11/2014 Fourteenth Tranche 18/1/2005 1000 11.400% 20 years,18/01/2025
Fifteenth Tranche 12/7/2005 2000 9.100% 5 years,12/07/2010
Seventeenth Tranche 16/8/2005 2000 9.350% 5 years,16/08/2010
Eighteenth Tranche (1) 20/9/2005 6000 9.100% 7 years,20/09/2012 Twentieth Tranche 18/10/2005 2000 9.100% 5 years,18/10/2010
Twenty First Tranche (2) 15/11/2005 5000 9.300% 10 years, 15/11/2015Twenty Second Tranche 3/1/2006 2000 9.050% 4 years,03/01/2010
Twenty Third Tranche (3) 24/1/2006 6000 8.850% 7 years 24/01/2013
Twenty Fifth Tranche (4) 28/2/2006 4000 8.600% 5 years,28/02/2011Twenty Sixth Tranche 2/5/2006 2000 8.950% 4 years,02/05/2010Twenty Seventh Tranche 29/5/2007 2000 9.450% 7 years,29/05/2014Twenty Eighth Tranche 25/9/2007 2000 8.450% 7 years,25/09/2014Twenty Ninth Tranche 23/10/2007 2000 8.600% 8 years,25/10/2015
Thirtieth Tranche (5) 13/11/2007 5000 8.550% 6 years,13/11/2013Thirty First Tranche 22/01/2008 3000 8.700% 8 years,22/01/2016Thirty Second Tranche 12/02/2008 1500 9.150% 10 years,12/02/2018Thirty Third Tranche 19/02/2008 3000 9.200% 6 years,19/02/2014Thirty Fourth Tranche 27/05/2008 3000 10.650% 7 years,27/05/2015Thirty Fifth Tranche 10/6/2008 2000 10.950% 8 years,10/06/2016Thirty Sixth Tranche (6) 13/1/2009 6000 12.000% 3 years,13/01/2012Thirty Seven Tranche (7) 10/2/2009 6000 12.000% 5 years,10/02/2014Thirty Eight Tranche (8) 14/4/2009 5000 10.550% 5 years,14/04/2014Thirty Nine Tranche 28/4/2009 3000 10.350% 3 years,28/04/2012Fotieth Tranche 9/6/2009 3000 11.000% 7 years,09/06/2016
Forty First Tranche(9) 7/7/2009 3500 10.600% 2 years,07/07/2011
Forty Second Tranche (10) 28/8/2009 6000 10.800% 4 years,28/07/2013
Forty Third Tranche (11) 11/8/2009 6000 10.450% 3 years,11/08/2012
Forty Fourth Tranche(12) 15/9/2009 5127 10.900% 5 years,15/09/2014
Forty Fifth Tranche(13) 29/9/2009 6000 10.900% 4 years,29/09/2013Forty Sixth Tranche 24/11/2009 2000 12.170% 4 years,24/11/2013Forty Seventh Tranche 8/12/2009 2014 12.500% 5 years,08/12/2014Forty Eighth Tranche 15/12/2009 5125 12.800% 6 years,15/12/2015
Total 124266Source : Central Bank of Egypt.
* Issued by Law No. 4 /1995.** This system was put into force as of July 2004, in virtue of the Minister of Finance 's Decree No.480 for 2002 and the provisions governing it, issued by the Minister of Finance's Decree No. 723 for 2002, in accordance with Article (7) of Law No. 92 for 2004.
( 1 ) Increased by LE 2.0 billion, due to their re-opening on 13/12/2005 on the same conditions, and by LE 2.0 billion due to their re-opening
on 27/3/2007 on the same conditions.
( 2 ) Increased by LE 2.0 billion, due to their re-opening on 13/03/2006 on the same conditions, and by LE 1.0 billion due to their re-opening
on 13/6/2006 on the same conditions.
( 3 ) Increased by LE 2.0 billion, due to their re-opening on 17/04/2006 on the same conditions, and by LE 2.0 billion due to their re-opening
on 17/4/2007 on the same conditions.
( 4 ) Increased by LE 2.0 billion, due to their re-opening on 11/12/2007 on the same conditions.
( 5 ) Increased by LE 3.0 billion, due to their re-opening on 4/3/2008 on the same conditions.
(6) Increased by LE 3.0 billion due to their re-opening on 24/2/2009 on the same conditions.
(7) Increased by LE 3.0 billion due to their re-opening on 31/3/2009 on the same conditions.
(8) Increased by LE 2.0 billion due to their re-opening on 6/5/2009 on the same conditions.
(9) Increased by LE 3.0 billion due to their re-opening on 21/7/2009 on the same conditions.
(10) Increased by LE 3.0 billion due to their re-opening on 25/8/2009 on the same conditions.
(11) Increased by LE 3.0 billion due to their re-opening on 1/9/2009 on the same conditions.
(12) Increased by LE 2.1 billion due to their re-opening on 3/11/2009 on the same conditions.
(13) Increased by LE 3.0 billion due to their re-opening on 13/10/2009 on the same conditions.
(3/8) Outstanding Balance of Treasury Bonds*End of Dec. 2009
- 180 -
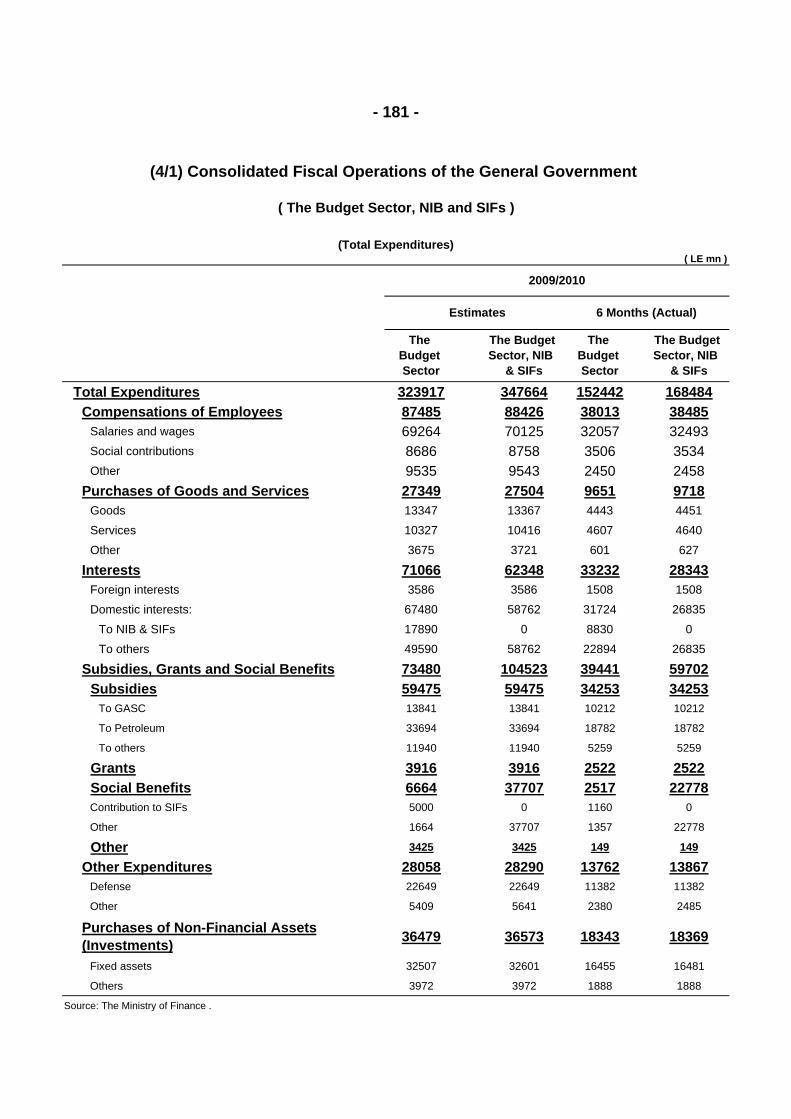
( LE mn )
Total Expenditures 323917 347664 152442 168484Compensations of Employees 87485 88426 38013 38485
Salaries and wages 69264 70125 32057 32493Social contributions 8686 8758 3506 3534Other 9535 9543 2450 2458
Purchases of Goods and Services 27349 27504 9651 9718Goods 13347 13367 4443 4451Services 10327 10416 4607 4640Other 3675 3721 601 627
Interests 71066 62348 33232 28343Foreign interests 3586 3586 1508 1508Domestic interests: 67480 58762 31724 26835
To NIB & SIFs 17890 0 8830 0To others 49590 58762 22894 26835
Subsidies, Grants and Social Benefits 73480 104523 39441 59702Subsidies 59475 59475 34253 34253
To GASC 13841 13841 10212 10212
To Petroleum 33694 33694 18782 18782
To others 11940 11940 5259 5259
Grants 3916 3916 2522 2522Social Benefits 6664 37707 2517 22778Contribution to SIFs 5000 0 1160 0
Other 1664 37707 1357 22778
Other 3425 3425 149 149
Other Expenditures 28058 28290 13762 13867Defense 22649 22649 11382 11382
Other 5409 5641 2380 2485
Purchases of Non-Financial Assets(Investments) 36479 36573 18343 18369
Fixed assets 32507 32601 16455 16481
Others 3972 3972 1888 1888
Source: The Ministry of Finance .
- 181 -
The Budget Sector
The Budget Sector, NIB
& SIFs
The Budget Sector
The Budget Sector, NIB
& SIFs
(4/1) Consolidated Fiscal Operations of the General Government
( The Budget Sector, NIB and SIFs )
6 Months (Actual)
(Total Expenditures)
Estimates
2009/2010
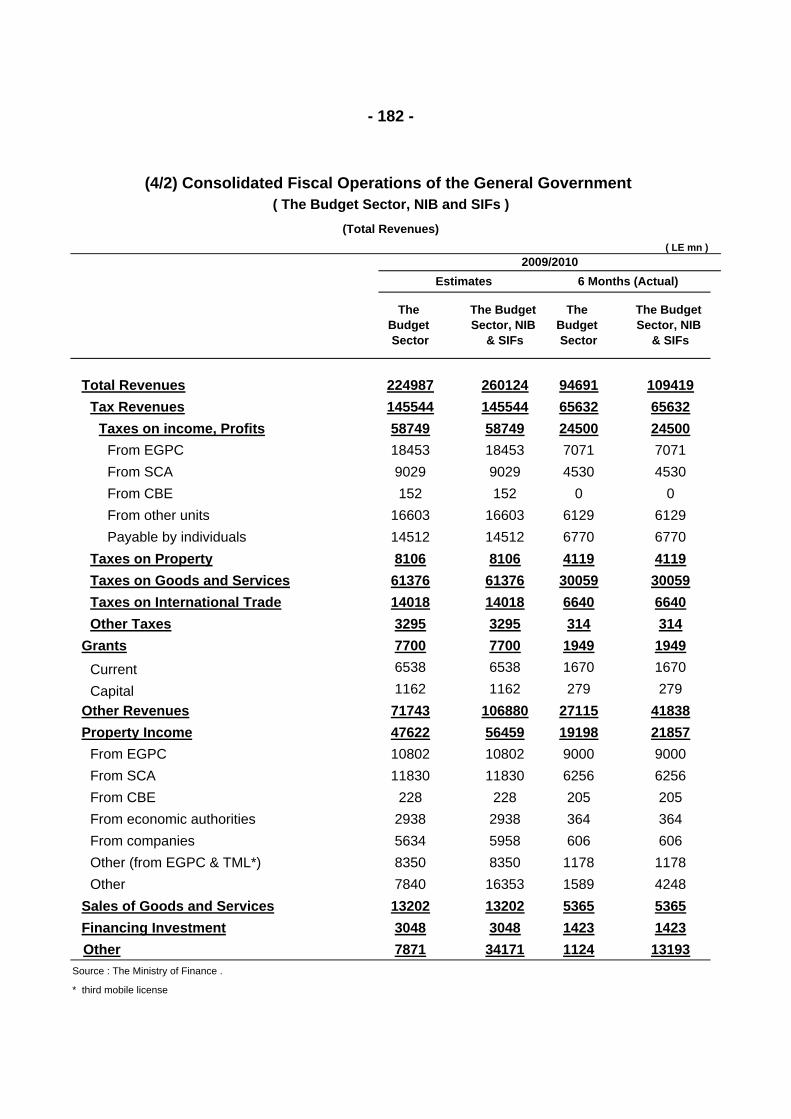
( LE mn )
Total Revenues 224987 260124 94691 109419Tax Revenues 145544 145544 65632 65632
Taxes on income, Profits 58749 58749 24500 24500From EGPC 18453 18453 7071 7071From SCA 9029 9029 4530 4530From CBE 152 152 0 0From other units 16603 16603 6129 6129Payable by individuals 14512 14512 6770 6770
Taxes on Property 8106 8106 4119 4119Taxes on Goods and Services 61376 61376 30059 30059Taxes on International Trade 14018 14018 6640 6640Other Taxes 3295 3295 314 314
Grants 7700 7700 1949 1949Current 6538 6538 1670 1670
Capital 1162 1162 279 279Other Revenues 71743 106880 27115 41838Property Income 47622 56459 19198 21857
From EGPC 10802 10802 9000 9000From SCA 11830 11830 6256 6256From CBE 228 228 205 205From economic authorities 2938 2938 364 364From companies 5634 5958 606 606Other (from EGPC & TML*) 8350 8350 1178 1178Other 7840 16353 1589 4248
Sales of Goods and Services 13202 13202 5365 5365Financing Investment 3048 3048 1423 1423
Other 7871 34171 1124 13193Source : The Ministry of Finance .
* third mobile license
- 182 -
The Budget Sector, NIB
& SIFs
The Budget Sector
Estimates
(4/2) Consolidated Fiscal Operations of the General Government ( The Budget Sector, NIB and SIFs )
6 Months (Actual)
(Total Revenues)
2009/2010
The Budget Sector, NIB
& SIFs
The Budget Sector
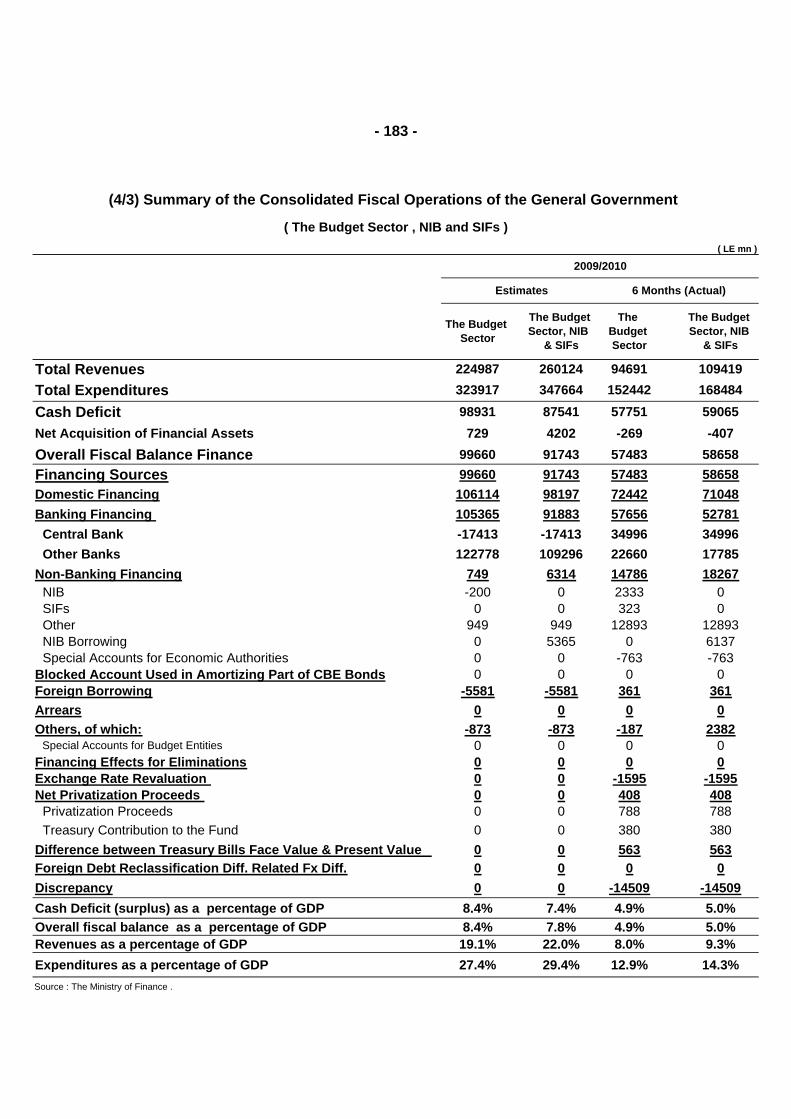
( LE mn )
Total Revenues 224987 260124 94691 109419Total Expenditures 323917 347664 152442 168484Cash Deficit 98931 87541 57751 59065Net Acquisition of Financial Assets 729 4202 -269 -407Overall Fiscal Balance Finance 99660 91743 57483 58658Financing Sources 99660 91743 57483 58658Domestic Financing 106114 98197 72442 71048Banking Financing 105365 91883 57656 52781
Central Bank -17413 -17413 34996 34996Other Banks 122778 109296 22660 17785
Non-Banking Financing 749 6314 14786 18267NIB -200 0 2333 0SIFs 0 0 323 0Other 949 949 12893 12893NIB Borrowing 0 5365 0 6137Special Accounts for Economic Authorities 0 0 -763 -763
Blocked Account Used in Amortizing Part of CBE Bonds 0 0 0 0Foreign Borrowing -5581 -5581 361 361Arrears 0 0 0 0Others, of which: -873 -873 -187 2382
Special Accounts for Budget Entities 0 0 0 0Financing Effects for Eliminations 0 0 0 0Exchange Rate Revaluation 0 0 -1595 -1595Net Privatization Proceeds 0 0 408 408
Privatization Proceeds 0 0 788 788Treasury Contribution to the Fund 0 0 380 380
Difference between Treasury Bills Face Value & Present Value 0 0 563 563Foreign Debt Reclassification Diff. Related Fx Diff. 0 0 0 0Discrepancy 0 0 -14509 -14509Cash Deficit (surplus) as a percentage of GDP 8.4% 7.4% 4.9% 5.0%Overall fiscal balance as a percentage of GDP 8.4% 7.8% 4.9% 5.0%Revenues as a percentage of GDP 19.1% 22.0% 8.0% 9.3%Expenditures as a percentage of GDP 27.4% 29.4% 12.9% 14.3%Source : The Ministry of Finance .
- 183 -
(4/3) Summary of the Consolidated Fiscal Operations of the General Government
( The Budget Sector , NIB and SIFs )
6 Months (Actual)
2009/2010
Estimates
The Budget Sector, NIB
& SIFs
The Budget Sector
The Budget Sector, NIB
& SIFs
The Budget Sector
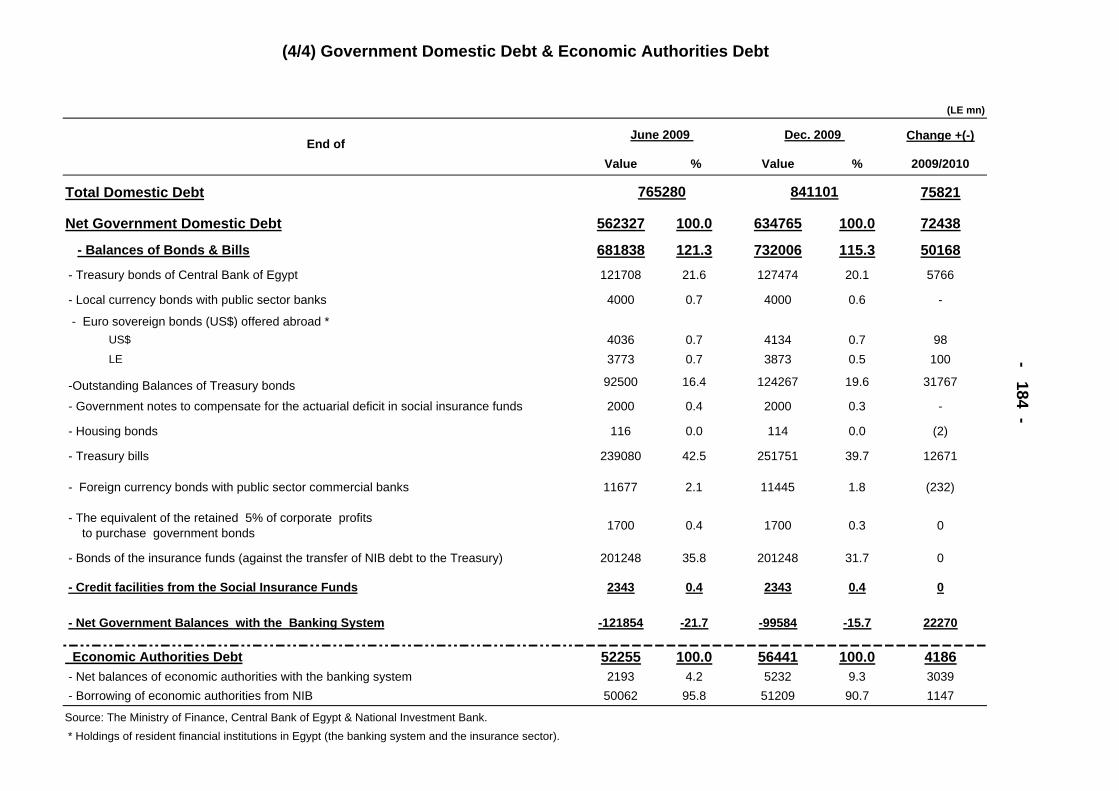
(LE mn)
End ofChange +(-)
Value % Value % 2009/2010
Total Domestic Debt 75821
Net Government Domestic Debt 562327 100.0 634765 100.0 72438
- Balances of Bonds & Bills 681838 121.3 732006 115.3 50168 - Treasury bonds of Central Bank of Egypt 121708 21.6 127474 20.1 5766
- Local currency bonds with public sector banks 4000 0.7 4000 0.6 -
- Euro sovereign bonds (US$) offered abroad * US$ 4036 0.7 4134 0.7 98 LE 3773 0.7 3873 0.5 100
-Outstanding Balances of Treasury bonds 92500 16.4 124267 19.6 31767
- Government notes to compensate for the actuarial deficit in social insurance funds 2000 0.4 2000 0.3 -
- Housing bonds 116 0.0 114 0.0 (2)
- Treasury bills 239080 42.5 251751 39.7 12671
- Foreign currency bonds with public sector commercial banks 11677 2.1 11445 1.8 (232)
- The equivalent of the retained 5% of corporate profits to purchase government bonds 1700 0.4 1700 0.3 0
- Bonds of the insurance funds (against the transfer of NIB debt to the Treasury) 201248 35.8 201248 31.7 0
- Credit facilities from the Social Insurance Funds 2343 0.4 2343 0.4 0
- Net Government Balances with the Banking System -121854 -21.7 -99584 -15.7 22270
Economic Authorities Debt 52255 100.0 56441 100.0 4186 - Net balances of economic authorities with the banking system 2193 4.2 5232 9.3 3039 - Borrowing of economic authorities from NIB 50062 95.8 51209 90.7 1147
Source: The Ministry of Finance, Central Bank of Egypt & National Investment Bank. * Holdings of resident financial institutions in Egypt (the banking system and the insurance sector).
765280 841101
(4/4) Government Domestic Debt & Economic Authorities Debt
- 184 -
June 2009 Dec. 2009
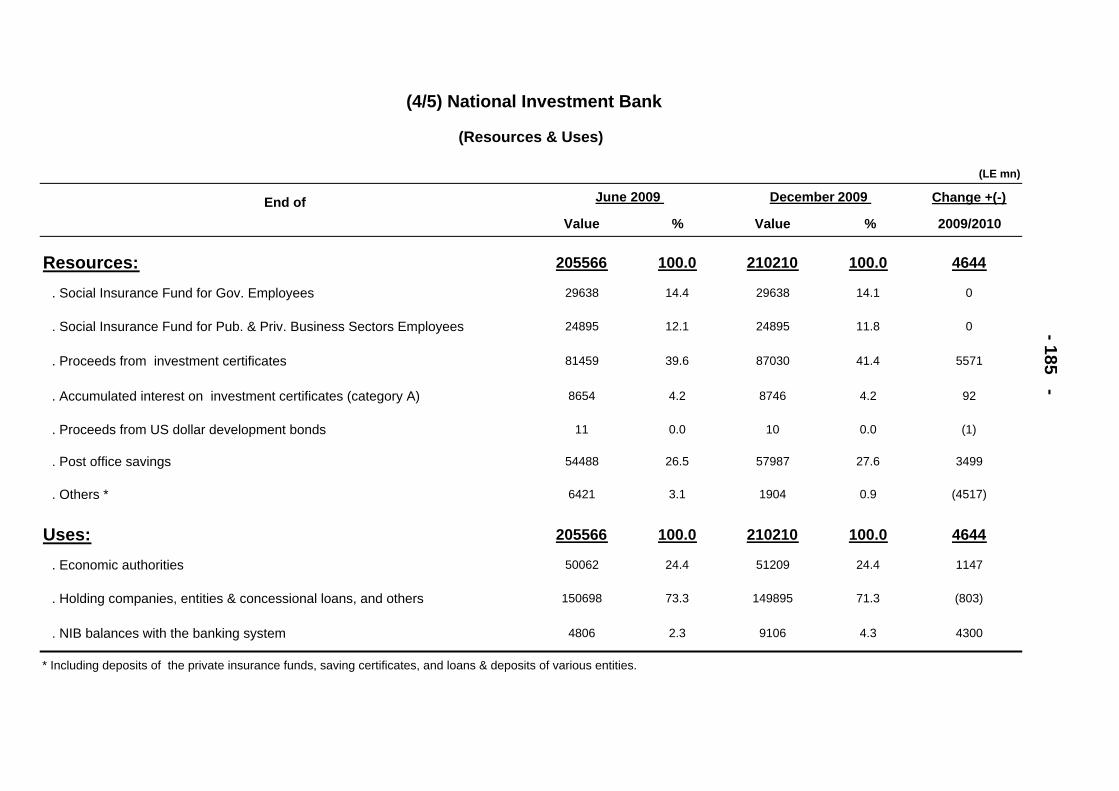
(LE mn)
End of Change +(-)
Value % Value % 2009/2010
Resources: 205566 100.0 210210 100.0 4644
. Social Insurance Fund for Gov. Employees 29638 14.4 29638 14.1 0
. Social Insurance Fund for Pub. & Priv. Business Sectors Employees 24895 12.1 24895 11.8 0
. Proceeds from investment certificates 81459 39.6 87030 41.4 5571
. Accumulated interest on investment certificates (category A) 8654 4.2 8746 4.2 92
. Proceeds from US dollar development bonds 11 0.0 10 0.0 (1)
. Post office savings 54488 26.5 57987 27.6 3499
. Others * 6421 3.1 1904 0.9 (4517)
Uses: 205566 100.0 210210 100.0 4644
. Economic authorities 50062 24.4 51209 24.4 1147
. Holding companies, entities & concessional loans, and others 150698 73.3 149895 71.3 (803)
. NIB balances with the banking system 4806 2.3 9106 4.3 4300
* Including deposits of the private insurance funds, saving certificates, and loans & deposits of various entities.
- 185 -
June 2009 December 2009
(4/5) National Investment Bank
(Resources & Uses)
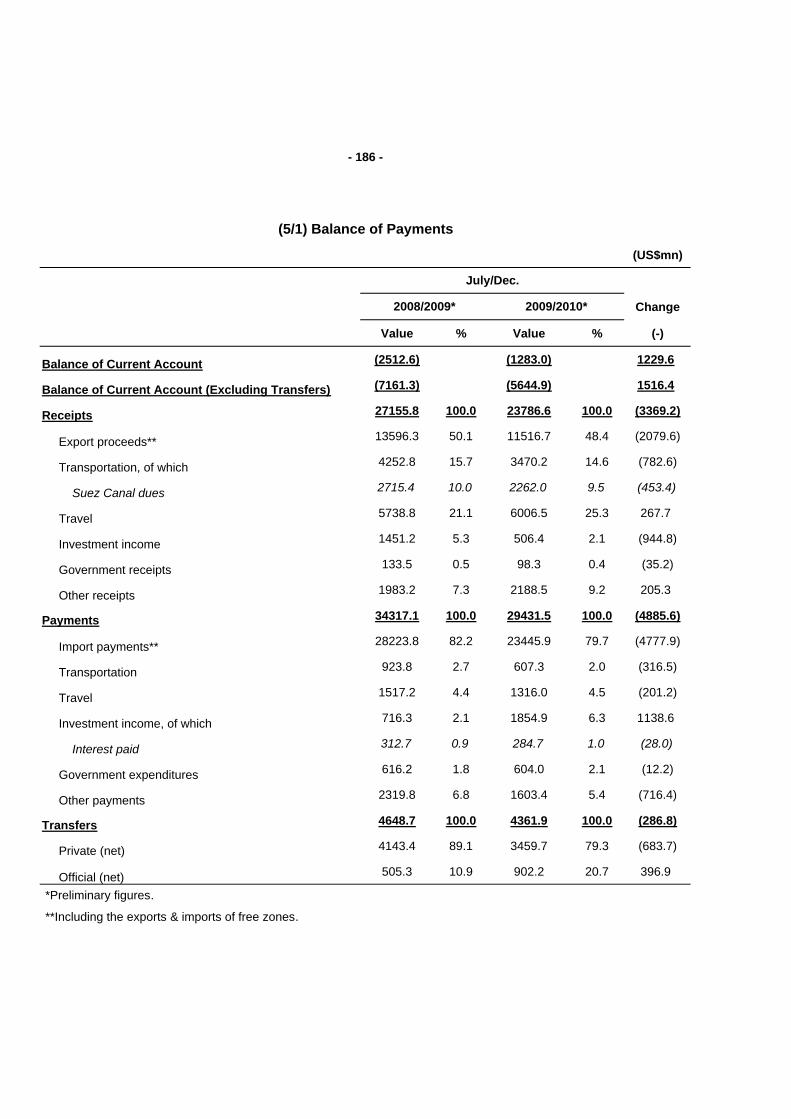
(US$mn)
Change
Value % Value % (-)
Balance of Current Account (2512.6) (1283.0) 1229.6
Balance of Current Account (Excluding Transfers) (7161.3) (5644.9) 1516.4
Receipts 27155.8 100.0 23786.6 100.0 (3369.2)
Export proceeds** 13596.3 50.1 11516.7 48.4 (2079.6)
Transportation, of which 4252.8 15.7 3470.2 14.6 (782.6)
Suez Canal dues 2715.4 10.0 2262.0 9.5 (453.4)
Travel 5738.8 21.1 6006.5 25.3 267.7
Investment income 1451.2 5.3 506.4 2.1 (944.8)
Government receipts 133.5 0.5 98.3 0.4 (35.2)
Other receipts 1983.2 7.3 2188.5 9.2 205.3
Payments 34317.1 100.0 29431.5 100.0 (4885.6)
Import payments** 28223.8 82.2 23445.9 79.7 (4777.9)
Transportation 923.8 2.7 607.3 2.0 (316.5)
Travel 1517.2 4.4 1316.0 4.5 (201.2)
Investment income, of which 716.3 2.1 1854.9 6.3 1138.6
Interest paid 312.7 0.9 284.7 1.0 (28.0)
Government expenditures 616.2 1.8 604.0 2.1 (12.2)
Other payments 2319.8 6.8 1603.4 5.4 (716.4)
Transfers 4648.7 100.0 4361.9 100.0 (286.8)
Private (net) 4143.4 89.1 3459.7 79.3 (683.7)
Official (net) 505.3 10.9 902.2 20.7 396.9
*Preliminary figures.
**Including the exports & imports of free zones.
- 186 -
(5/1) Balance of Payments
2008/2009* 2009/2010*
July/Dec.
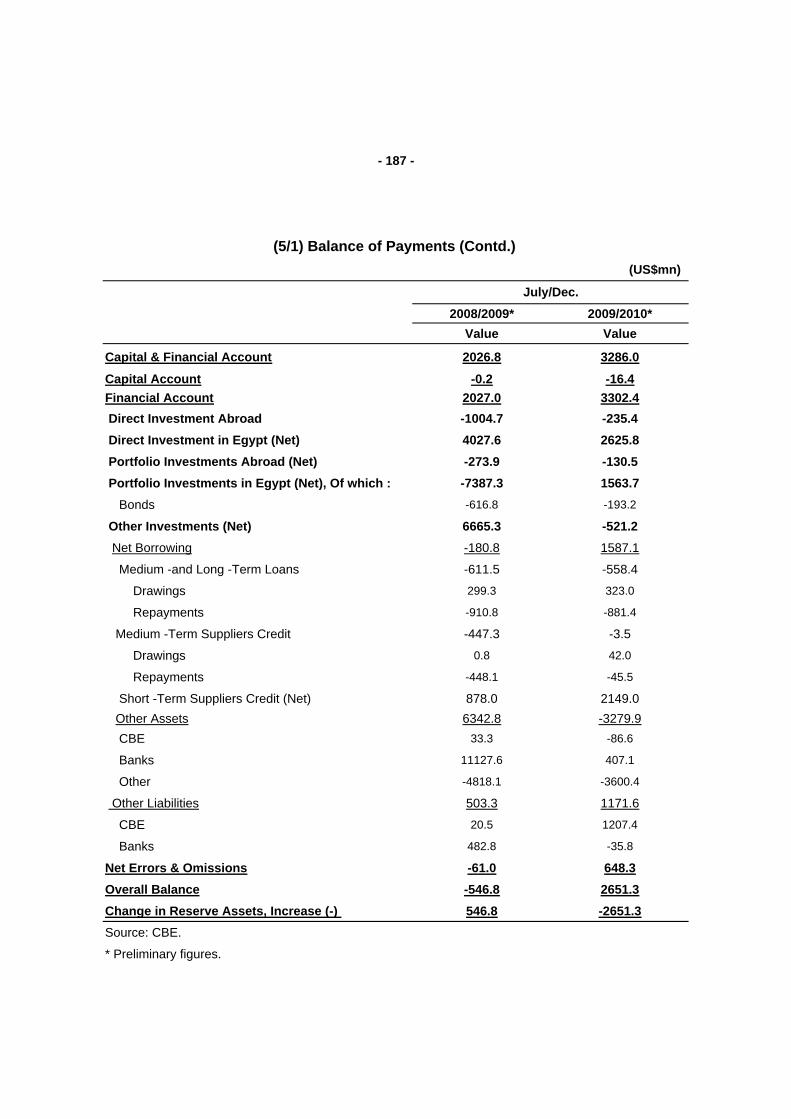
(US$mn)
2008/2009* 2009/2010*Value Value
Capital & Financial Account 2026.8 3286.0
Capital Account -0.2 -16.4Financial Account 2027.0 3302.4 Direct Investment Abroad -1004.7 -235.4 Direct Investment in Egypt (Net) 4027.6 2625.8 Portfolio Investments Abroad (Net) -273.9 -130.5 Portfolio Investments in Egypt (Net), Of which : -7387.3 1563.7 Bonds -616.8 -193.2
Other Investments (Net) 6665.3 -521.2 Net Borrowing -180.8 1587.1
Medium -and Long -Term Loans -611.5 -558.4
Drawings 299.3 323.0
Repayments -910.8 -881.4
Medium -Term Suppliers Credit -447.3 -3.5
Drawings 0.8 42.0
Repayments -448.1 -45.5
Short -Term Suppliers Credit (Net) 878.0 2149.0 Other Assets 6342.8 -3279.9 CBE 33.3 -86.6
Banks 11127.6 407.1
Other -4818.1 -3600.4
Other Liabilities 503.3 1171.6
CBE 20.5 1207.4
Banks 482.8 -35.8
Net Errors & Omissions -61.0 648.3Overall Balance -546.8 2651.3Change in Reserve Assets, Increase (-) 546.8 -2651.3Source: CBE.
* Preliminary figures.
- 187 -
(5/1) Balance of Payments (Contd.)
July/Dec.
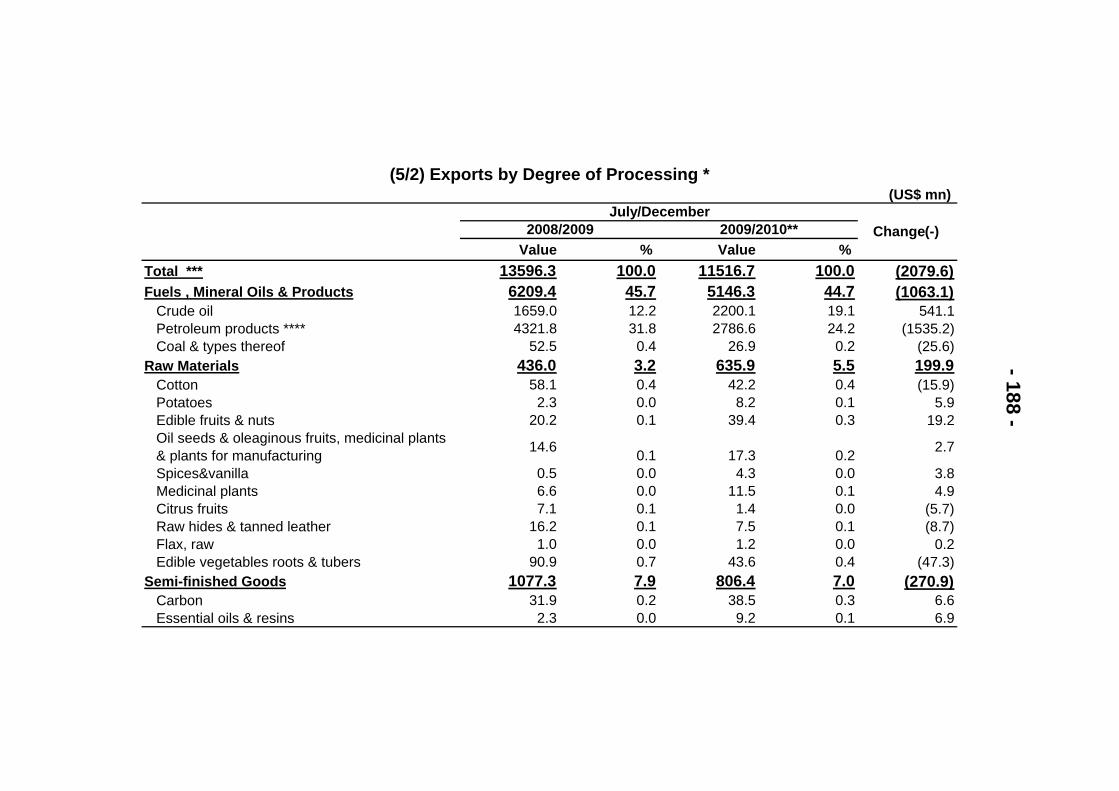
(US$ mn)
Value % Value % Total *** 13596.3 100.0 11516.7 100.0 (2079.6)Fuels , Mineral Oils & Products 6209.4 45.7 5146.3 44.7 (1063.1)
Crude oil 1659.0 12.2 2200.1 19.1 541.1Petroleum products **** 4321.8 31.8 2786.6 24.2 (1535.2)Coal & types thereof 52.5 0.4 26.9 0.2 (25.6)
Raw Materials 436.0 3.2 635.9 5.5 199.9Cotton 58.1 0.4 42.2 0.4 (15.9)Potatoes 2.3 0.0 8.2 0.1 5.9Edible fruits & nuts 20.2 0.1 39.4 0.3 19.2Oil seeds & oleaginous fruits, medicinal plants & plants for manufacturing 14.6 0.1 17.3 0.2 2.7
Spices&vanilla 0.5 0.0 4.3 0.0 3.8Medicinal plants 6.6 0.0 11.5 0.1 4.9Citrus fruits 7.1 0.1 1.4 0.0 (5.7)Raw hides & tanned leather 16.2 0.1 7.5 0.1 (8.7)Flax, raw 1.0 0.0 1.2 0.0 0.2Edible vegetables roots & tubers 90.9 0.7 43.6 0.4 (47.3)
Semi-finished Goods 1077.3 7.9 806.4 7.0 (270.9)Carbon 31.9 0.2 38.5 0.3 6.6Essential oils & resins 2.3 0.0 9.2 0.1 6.9
- 188 -
Change(-)
(5/2) Exports by Degree of Processing *
July/December2008/2009 2009/2010**
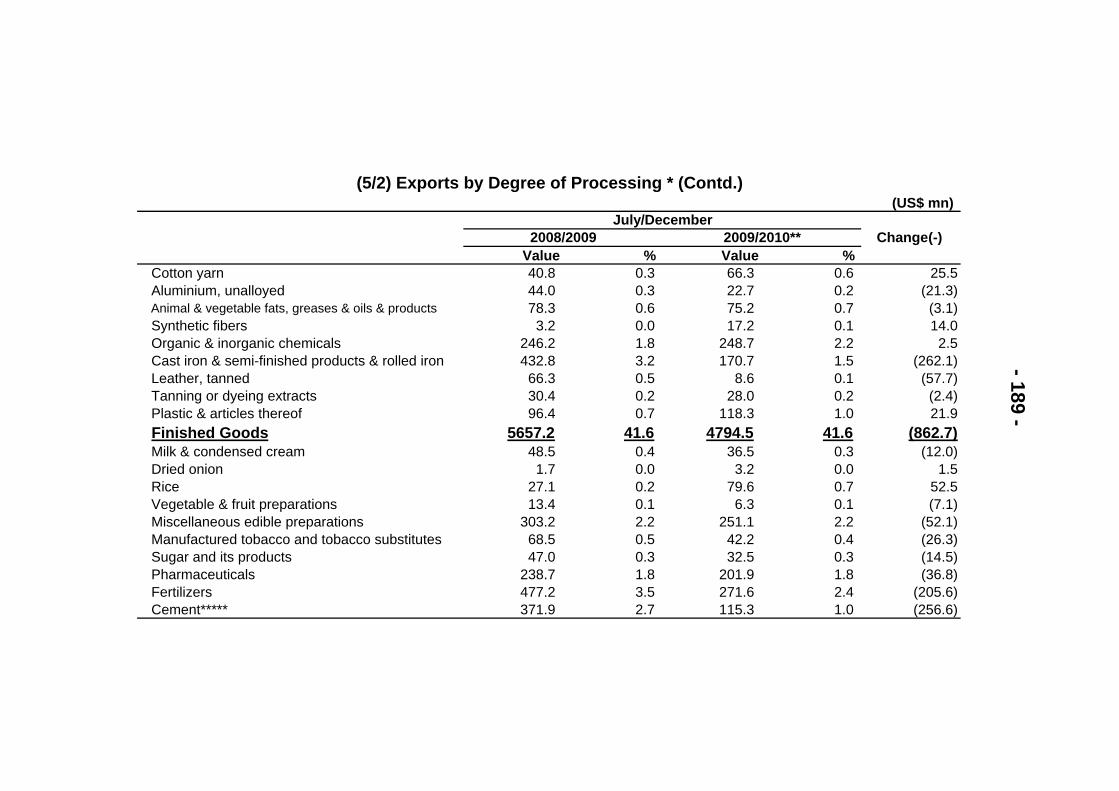
(US$ mn)
Value % Value % Cotton yarn 40.8 0.3 66.3 0.6 25.5Aluminium, unalloyed 44.0 0.3 22.7 0.2 (21.3)Animal & vegetable fats, greases & oils & products 78.3 0.6 75.2 0.7 (3.1)Synthetic fibers 3.2 0.0 17.2 0.1 14.0Organic & inorganic chemicals 246.2 1.8 248.7 2.2 2.5Cast iron & semi-finished products & rolled iron 432.8 3.2 170.7 1.5 (262.1)Leather, tanned 66.3 0.5 8.6 0.1 (57.7)Tanning or dyeing extracts 30.4 0.2 28.0 0.2 (2.4)Plastic & articles thereof 96.4 0.7 118.3 1.0 21.9Finished Goods 5657.2 41.6 4794.5 41.6 (862.7)Milk & condensed cream 48.5 0.4 36.5 0.3 (12.0)Dried onion 1.7 0.0 3.2 0.0 1.5Rice 27.1 0.2 79.6 0.7 52.5Vegetable & fruit preparations 13.4 0.1 6.3 0.1 (7.1)Miscellaneous edible preparations 303.2 2.2 251.1 2.2 (52.1)Manufactured tobacco and tobacco substitutes 68.5 0.5 42.2 0.4 (26.3)Sugar and its products 47.0 0.3 32.5 0.3 (14.5)Pharmaceuticals 238.7 1.8 201.9 1.8 (36.8)Fertilizers 477.2 3.5 271.6 2.4 (205.6)Cement***** 371.9 2.7 115.3 1.0 (256.6)
- 189 -
(5/2) Exports by Degree of Processing * (Contd.)
July/DecemberChange(-) 2008/2009 2009/2010**
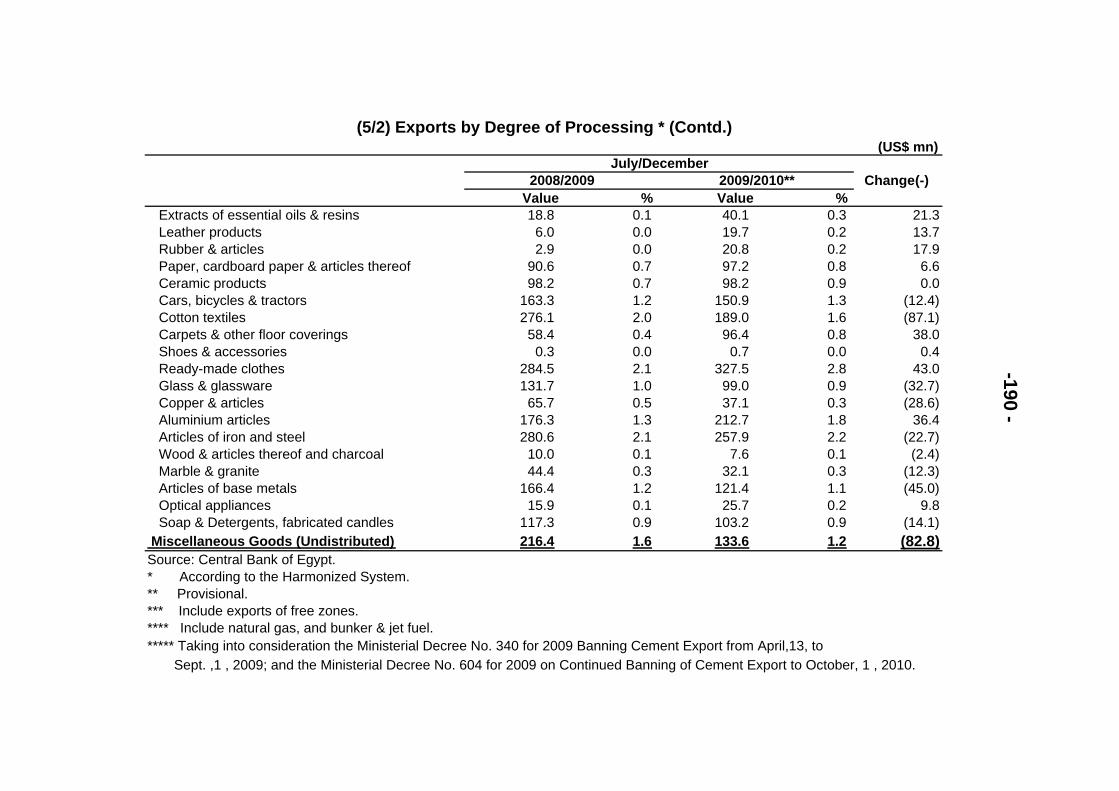
(US$ mn)
Value % Value % Extracts of essential oils & resins 18.8 0.1 40.1 0.3 21.3Leather products 6.0 0.0 19.7 0.2 13.7Rubber & articles 2.9 0.0 20.8 0.2 17.9Paper, cardboard paper & articles thereof 90.6 0.7 97.2 0.8 6.6Ceramic products 98.2 0.7 98.2 0.9 0.0Cars, bicycles & tractors 163.3 1.2 150.9 1.3 (12.4)Cotton textiles 276.1 2.0 189.0 1.6 (87.1)Carpets & other floor coverings 58.4 0.4 96.4 0.8 38.0Shoes & accessories 0.3 0.0 0.7 0.0 0.4Ready-made clothes 284.5 2.1 327.5 2.8 43.0Glass & glassware 131.7 1.0 99.0 0.9 (32.7)Copper & articles 65.7 0.5 37.1 0.3 (28.6)Aluminium articles 176.3 1.3 212.7 1.8 36.4Articles of iron and steel 280.6 2.1 257.9 2.2 (22.7)Wood & articles thereof and charcoal 10.0 0.1 7.6 0.1 (2.4)Marble & granite 44.4 0.3 32.1 0.3 (12.3)Articles of base metals 166.4 1.2 121.4 1.1 (45.0)Optical appliances 15.9 0.1 25.7 0.2 9.8Soap & Detergents, fabricated candles 117.3 0.9 103.2 0.9 (14.1)
Miscellaneous Goods (Undistributed) 216.4 1.6 133.6 1.2 (82.8)Source: Central Bank of Egypt.* According to the Harmonized System.** Provisional.*** Include exports of free zones. **** Include natural gas, and bunker & jet fuel.
Sept. ,1 , 2009; and the Ministerial Decree No. 604 for 2009 on Continued Banning of Cement Export to October, 1 , 2010.
-190 -
***** Taking into consideration the Ministerial Decree No. 340 for 2009 Banning Cement Export from April,13, to
(5/2) Exports by Degree of Processing * (Contd.)
July/DecemberChange(-) 2008/2009 2009/2010**
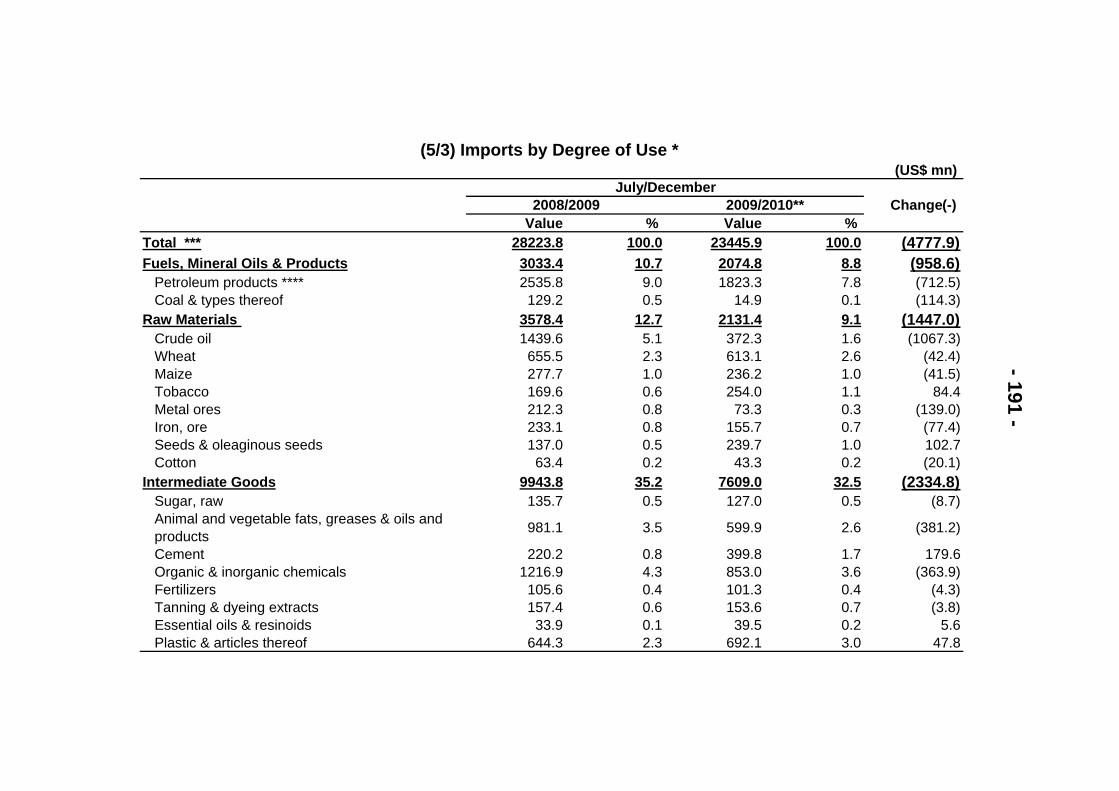
(US$ mn)
Value % Value % Total *** 28223.8 100.0 23445.9 100.0 (4777.9)Fuels, Mineral Oils & Products 3033.4 10.7 2074.8 8.8 (958.6)
Petroleum products **** 2535.8 9.0 1823.3 7.8 (712.5)Coal & types thereof 129.2 0.5 14.9 0.1 (114.3)
Raw Materials 3578.4 12.7 2131.4 9.1 (1447.0)Crude oil 1439.6 5.1 372.3 1.6 (1067.3)Wheat 655.5 2.3 613.1 2.6 (42.4)Maize 277.7 1.0 236.2 1.0 (41.5)Tobacco 169.6 0.6 254.0 1.1 84.4Metal ores 212.3 0.8 73.3 0.3 (139.0)Iron, ore 233.1 0.8 155.7 0.7 (77.4)Seeds & oleaginous seeds 137.0 0.5 239.7 1.0 102.7Cotton 63.4 0.2 43.3 0.2 (20.1)
Intermediate Goods 9943.8 35.2 7609.0 32.5 (2334.8)Sugar, raw 135.7 0.5 127.0 0.5 (8.7)Animal and vegetable fats, greases & oils and products 981.1 3.5 599.9 2.6 (381.2)
Cement 220.2 0.8 399.8 1.7 179.6Organic & inorganic chemicals 1216.9 4.3 853.0 3.6 (363.9)Fertilizers 105.6 0.4 101.3 0.4 (4.3)Tanning & dyeing extracts 157.4 0.6 153.6 0.7 (3.8)Essential oils & resinoids 33.9 0.1 39.5 0.2 5.6Plastic & articles thereof 644.3 2.3 692.1 3.0 47.8
(5/3) Imports by Degree of Use *
- 191 -
July/DecemberChange(-) 2008/2009 2009/2010**
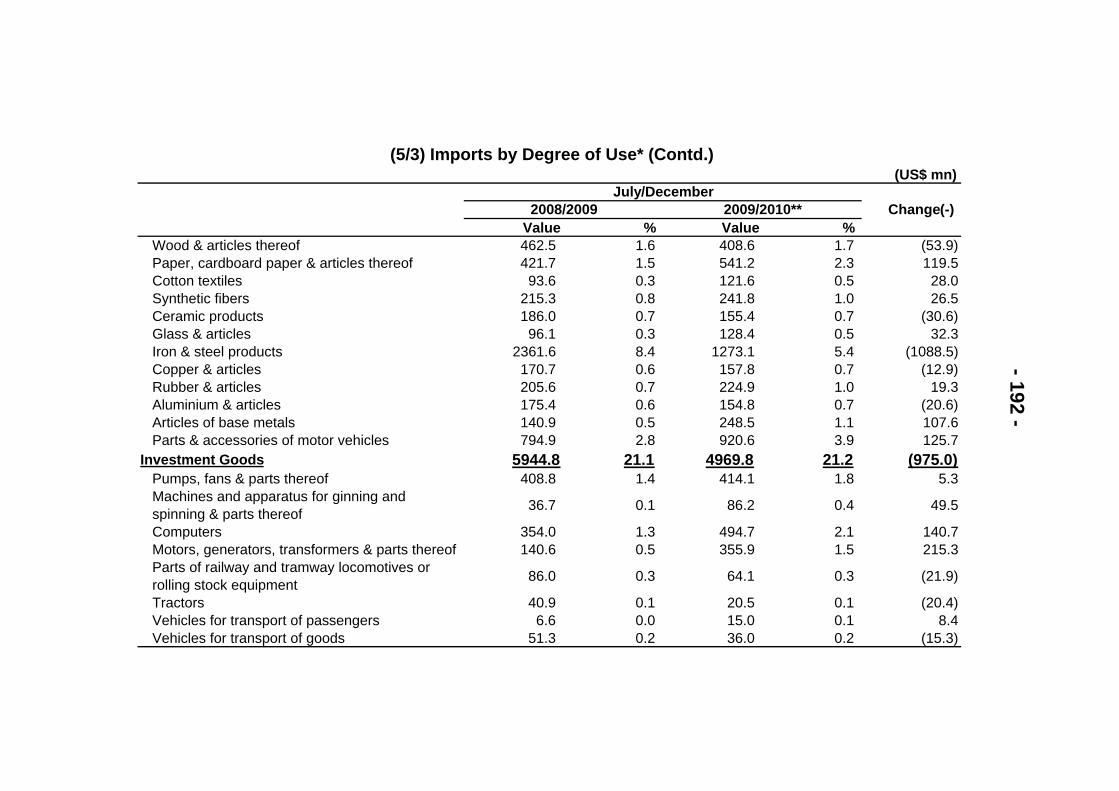
(US$ mn)
Value % Value % Wood & articles thereof 462.5 1.6 408.6 1.7 (53.9)Paper, cardboard paper & articles thereof 421.7 1.5 541.2 2.3 119.5Cotton textiles 93.6 0.3 121.6 0.5 28.0Synthetic fibers 215.3 0.8 241.8 1.0 26.5Ceramic products 186.0 0.7 155.4 0.7 (30.6)Glass & articles 96.1 0.3 128.4 0.5 32.3Iron & steel products 2361.6 8.4 1273.1 5.4 (1088.5)Copper & articles 170.7 0.6 157.8 0.7 (12.9)Rubber & articles 205.6 0.7 224.9 1.0 19.3Aluminium & articles 175.4 0.6 154.8 0.7 (20.6)Articles of base metals 140.9 0.5 248.5 1.1 107.6Parts & accessories of motor vehicles 794.9 2.8 920.6 3.9 125.7
Investment Goods 5944.8 21.1 4969.8 21.2 (975.0)Pumps, fans & parts thereof 408.8 1.4 414.1 1.8 5.3Machines and apparatus for ginning and spinning & parts thereof 36.7 0.1 86.2 0.4 49.5
Computers 354.0 1.3 494.7 2.1 140.7Motors, generators, transformers & parts thereof 140.6 0.5 355.9 1.5 215.3Parts of railway and tramway locomotives or rolling stock equipment 86.0 0.3 64.1 0.3 (21.9)
Tractors 40.9 0.1 20.5 0.1 (20.4)Vehicles for transport of passengers 6.6 0.0 15.0 0.1 8.4Vehicles for transport of goods 51.3 0.2 36.0 0.2 (15.3)
(5/3) Imports by Degree of Use* (Contd.)
- 192 -
July/DecemberChange(-) 2008/2009 2009/2010**

(US$ mn)
Value % Value % Tools, implements, cuttery & spoons 95.4 0.3 139.3 0.6 43.9Air conditioners 133.5 0.5 69.2 0.3 (64.3)Cranes and bulldozers & parts thereof 748.4 2.7 567.3 2.4 (181.1)Agricultural machinery 131.2 0.5 47.9 0.2 (83.3)Printing machinery & parts 37.5 0.1 44.6 0.2 7.1Electric appliances for telephones & telegraph 497.3 1.8 422.9 1.8 (74.4)Optical appliances 211.3 0.7 263.8 1.1 52.5
Consumer Goods 4778.0 17.0 5918.6 25.2 1140.6A - Durable Goods 1061.9 3.8 1456.0 6.2 394.1
Household refrigerators & electric freezers 79.7 0.3 107.1 0.5 27.4Televisions & parts thereof 23.3 0.1 33.2 0.1 9.9Vehicles for transport of persons 560.1 2.0 569.1 2.4 9.0Household electric-motor appliances 172.5 0.6 278.5 1.2 106.0
B - Non-durable Goods 3716.1 13.2 4462.6 19.0 746.5Meat and edible offals 289.1 1.0 308.5 1.3 19.4Fish, crustaceans, molluscs and others 97.5 0.3 125.4 0.5 27.9Dairy products, eggs, poultry and honey 203.2 0.7 194.7 0.8 (8.5)Edible vegetables roots & tubers 102.6 0.4 123.0 0.5 20.4Tea 90.4 0.3 69.6 0.3 (20.8)
(5/3) Imports by Degree of Use* (Contd.)
- 193 -
July/DecemberChange(-) 2008/2009 2009/2010**
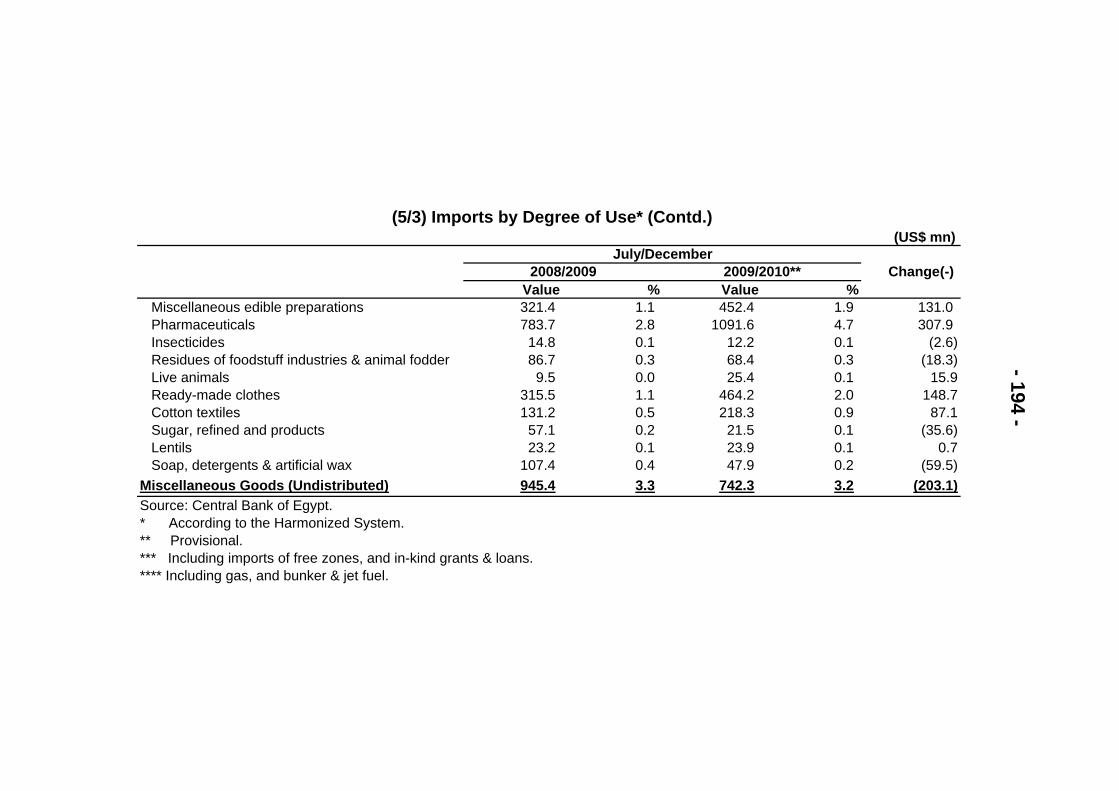
(US$ mn)
Value % Value %Miscellaneous edible preparations 321.4 1.1 452.4 1.9 131.0Pharmaceuticals 783.7 2.8 1091.6 4.7 307.9Insecticides 14.8 0.1 12.2 0.1 (2.6)Residues of foodstuff industries & animal fodder 86.7 0.3 68.4 0.3 (18.3)Live animals 9.5 0.0 25.4 0.1 15.9Ready-made clothes 315.5 1.1 464.2 2.0 148.7Cotton textiles 131.2 0.5 218.3 0.9 87.1Sugar, refined and products 57.1 0.2 21.5 0.1 (35.6)Lentils 23.2 0.1 23.9 0.1 0.7Soap, detergents & artificial wax 107.4 0.4 47.9 0.2 (59.5)
Miscellaneous Goods (Undistributed) 945.4 3.3 742.3 3.2 (203.1)Source: Central Bank of Egypt.* According to the Harmonized System.** Provisional.*** Including imports of free zones, and in-kind grants & loans.**** Including gas, and bunker & jet fuel.
- 194 -
(5/3) Imports by Degree of Use* (Contd.)
July/DecemberChange(-) 2008/2009 2009/2010**
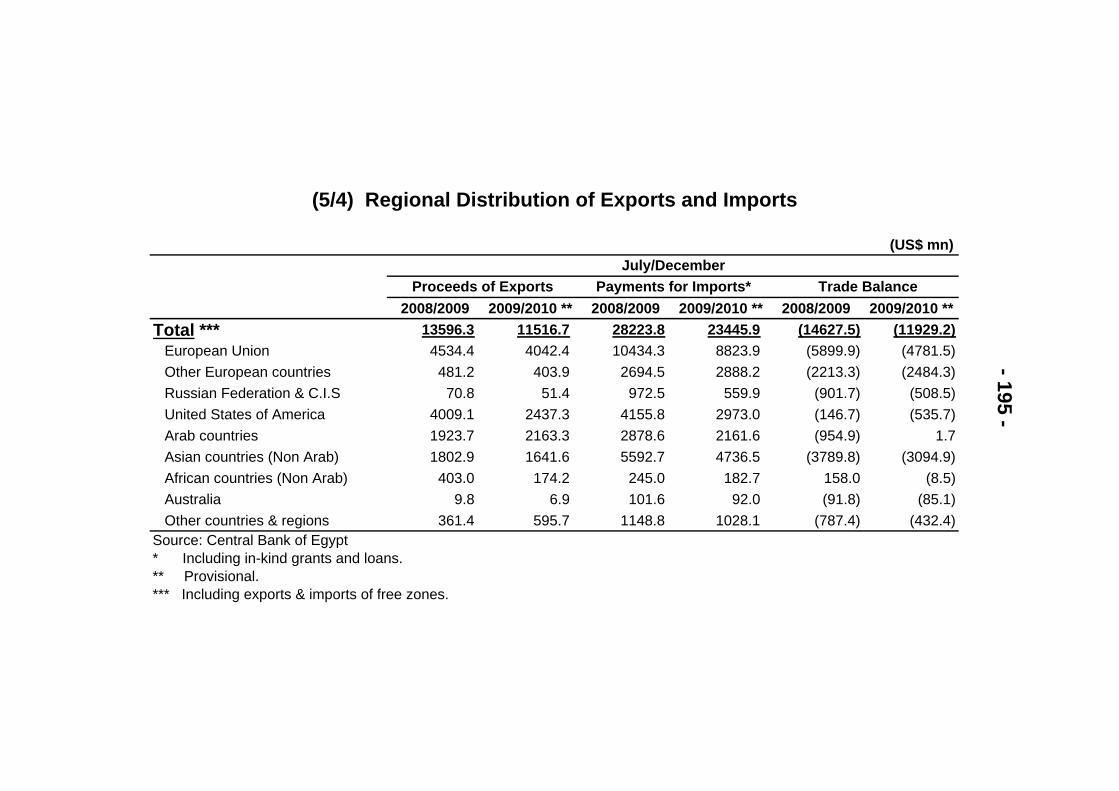
(US$ mn)
2008/2009 2009/2010 ** 2008/2009 2009/2010 ** 2008/2009 2009/2010 **Total *** 13596.3 11516.7 28223.8 23445.9 (14627.5) (11929.2)
European Union 4534.4 4042.4 10434.3 8823.9 (5899.9) (4781.5)Other European countries 481.2 403.9 2694.5 2888.2 (2213.3) (2484.3)Russian Federation & C.I.S 70.8 51.4 972.5 559.9 (901.7) (508.5)United States of America 4009.1 2437.3 4155.8 2973.0 (146.7) (535.7)Arab countries 1923.7 2163.3 2878.6 2161.6 (954.9) 1.7Asian countries (Non Arab) 1802.9 1641.6 5592.7 4736.5 (3789.8) (3094.9)African countries (Non Arab) 403.0 174.2 245.0 182.7 158.0 (8.5)Australia 9.8 6.9 101.6 92.0 (91.8) (85.1)Other countries & regions 361.4 595.7 1148.8 1028.1 (787.4) (432.4)
Source: Central Bank of Egypt* Including in-kind grants and loans.** Provisional.*** Including exports & imports of free zones.
- 195 -
(5/4) Regional Distribution of Exports and Imports
July/DecemberProceeds of Exports Payments for Imports* Trade Balance
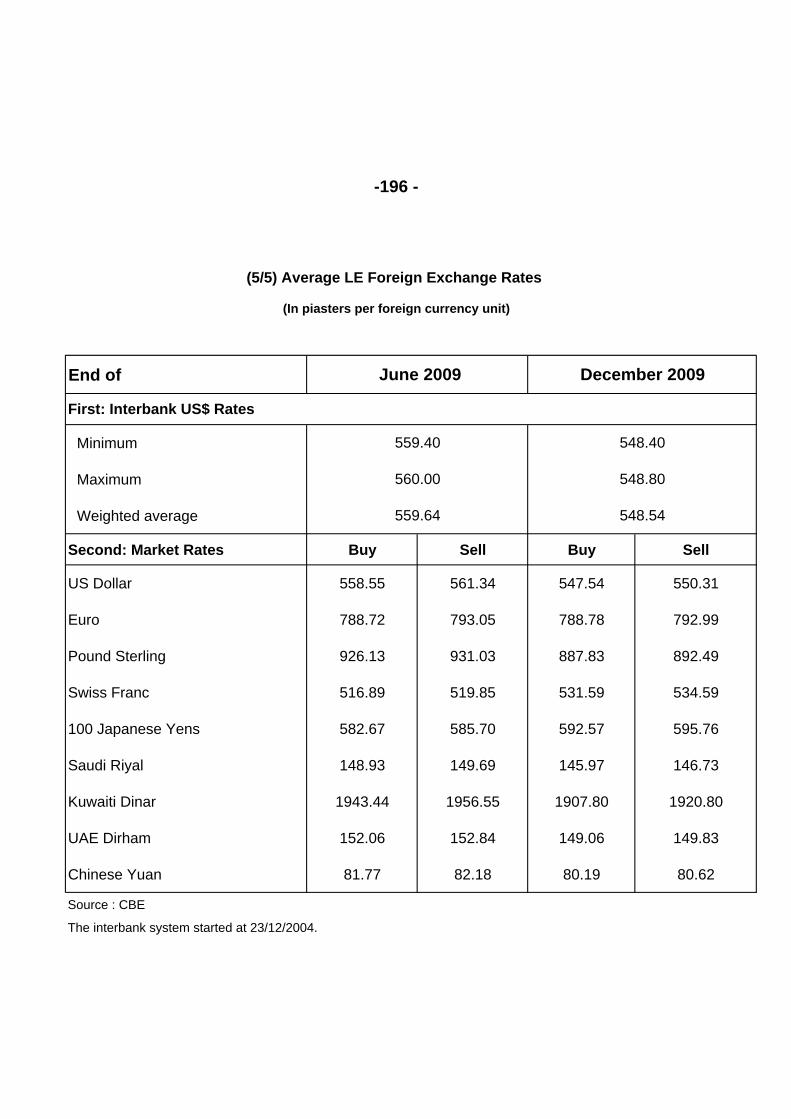
End of
Minimum
Maximum
Weighted average
Second: Market Rates Buy Sell Buy Sell
US Dollar 558.55 561.34 547.54 550.31
Euro 788.72 793.05 788.78 792.99
Pound Sterling 926.13 931.03 887.83 892.49
Swiss Franc 516.89 519.85 531.59 534.59
100 Japanese Yens 582.67 585.70 592.57 595.76
Saudi Riyal 148.93 149.69 145.97 146.73
Kuwaiti Dinar 1943.44 1956.55 1907.80 1920.80
UAE Dirham 152.06 152.84 149.06 149.83
Chinese Yuan 81.77 82.18 80.19 80.62
Source : CBE
The interbank system started at 23/12/2004.
560.00
559.64
June 2009 December 2009
559.40 548.40
548.80
548.54
First: Interbank US$ Rates
(In piasters per foreign currency unit)
(5/5) Average LE Foreign Exchange Rates
-196 -
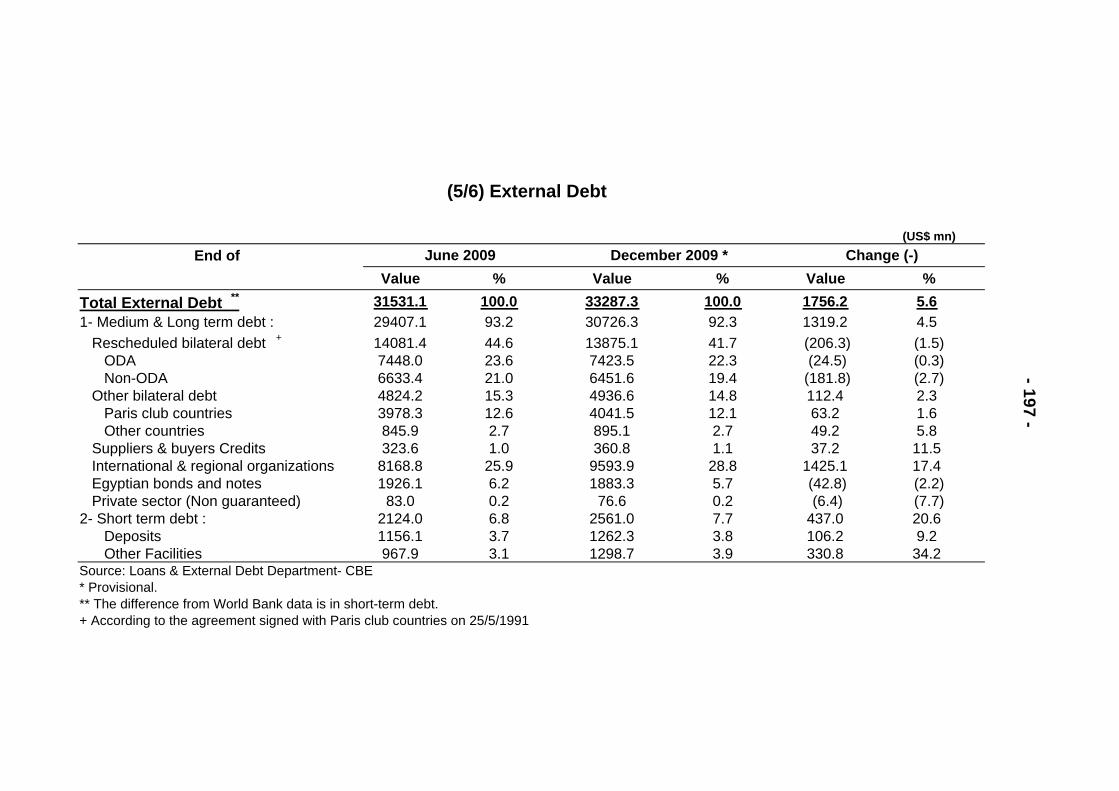
(US$ mn)End of
%Value %Value%Value5.61756.2100.033287.3100.031531.1Total External Debt **4.51319.292.330726.393.229407.11- Medium & Long term debt :(1.5)(206.3)41.713875.144.614081.4 Rescheduled bilateral debt +
(0.3)(24.5)22.37423.523.67448.0 ODA(2.7)(181.8)19.46451.621.06633.4 Non-ODA2.3112.414.84936.615.34824.2 Other bilateral debt1.663.212.14041.512.63978.3 Paris club countries5.849.22.7895.12.7845.9 Other countries
11.537.21.1360.81.0323.6 Suppliers & buyers Credits17.41425.128.89593.925.98168.8 International & regional organizations(2.2)(42.8)5.71883.36.21926.1 Egyptian bonds and notes(7.7)(6.4)0.276.60.283.0 Private sector (Non guaranteed)20.6437.07.72561.06.82124.02- Short term debt :9.2106.23.81262.33.71156.1 Deposits
34.2330.83.91298.73.1967.9 Other FacilitiesSource: Loans & External Debt Department- CBE* Provisional.** The difference from World Bank data is in short-term debt.+ According to the agreement signed with Paris club countries on 25/5/1991
December 2009 *June 2009 Change (-)
- 197 -
(5/6) External Debt

(5/7) Distribution of External Debt by Main Currencies
(US$ mn)ChangeEnd of
(-)%Value%Value1756.2100.033287.3100.031531.1Total(241.8)37.312428.340.212670.1US dollar **
9.00.4149.00.4140.0Canadian dollar5.00.3119.00.4114.0Australian dollar46.01.8587.01.7541.0Swiss franc14.00.7221.00.7207.0Sterling pound67.012.14016.012.53949.0Japanese yen(1.0)0.4136.00.4137.0Danish krone0.00.05.00.05.0Norwegian krone1.00.129.00.128.0Swedish krona
157.05.71888.05.51731.0Kuwaiti dinar6.00.134.00.128.0Saudi riyal(1.0)0.132.00.133.0UAE dirham
260.031.510477.032.410217.0Euro286.02.1710.01.4424.0Egyptain Pound1149.07.42456.04.11307.0SDRs
Source: Loans & External Debt Department- CBE* Provisional.** Including other liabilities due in US dollar
- 198 -
December 2009 *June 2009


