Page 1
1
CENTRAL TRANSFERS TO STATES IN INDIA
REWARDING PERFORMANCE WHILE ENSURING EQUITY
(Final Report of a Study Submitted to NITI Aayog)
M. Govinda Rao
The study was sponsored with financial support of NITI Aayog, Government of India and
conducted by National Institute of Public Finance and Policy, New Delhi.
Page 2
2
Disclaimer
The National Institute of Public Finance and Policy, New Delhi has received
the grant under the Research Scheme of NITI Aayog, 2015 to produce this
document. However, NITI Aayog shall not be held responsible for findings
and opinions expressed in the document prepared. This responsibility rests
with the National Institute of Public Finance and Policy, New Delhi and more
particularly with Dr. M. Govinda Rao, the author of the report.
Page 3
3
ACKNOWLEDGEMENTS
Designing and implementing an equitable and yet, incentive compatible transfer system
has been a challenge in most federations. The challenge is even more serious in India with the
States having large and diverging differences in the standards in physical and social
infrastructures. Growth and stability of Indian federation critically depends on the convergence
of incomes across the States and this can be achieved only when there is a balanced spread of
physical infrastructure and human development across the country. To achieve this, it is
important to design and implement the transfer system that offsets the revenue and cost
disabilities of the states and ensures a required minimum standards of meritorious public
services with significant externalities so that people irrespective of their location are able to
access these services. This study attempts to review the prevailing system of transfers and
attempts to identify reform areas.
The request for the study was made by Dr. Arvind Panagariya, the Vice Chairman of
the NITI Aayog. The study was sponsored with the financial; support of NITI Aayog,
Government of India. I have also had the benefit of insightful discussions with him. I am
grateful to him for sparing the time. Mr. Vikram Singh Gaur, Joint Secretary, NITI Aayog
coordinated the administration of the study and I had the benefit of detailed discussions on the
Centrally Sponsored Schemes. He also organised a meeting of officers from different
Ministries. The officials attending the meeting included Dr. Nagesh Singh, Additional
Secretary, Ministry of Rural Development, Ms. Kavita Singh, Joint Secretary, Ministry of
Health and Family Welfare, Mr. Manjeet Kumar, Ministry of Human Resource Development,
Dr. Rajesh Kumar, Joint Secretary, Ministry of Women and Child Welfare, Mr. V. S. Yedla,
Director, Ministry of Human Resource Development, Dr. B. Venkatesh Kumar, Professor, Tata
Institute of Social Sciences, and Mr. J. K. Goswamy and Mr. Ramesh Ranjan of NITI Aayog.
Mr. Vikram Singh Gaur organised a meeting with relevant officials of NITIO Aayog after the
Interim Report was submitted and this was Chaired by Mr. Anil Srivastava, Additional
Secretary, NITI Aayog. The NITI Aayog officials attending the meeting included Mr. Vikram
Singh Gaur, Joint Secretary, Mr. Yogesh Suri, Adviser, Mr. Ashutosh Jain, DDG, M. Mary B.
Barla, Director, Mr. Anand Trivedi, Consultant and Mr. Kaushik Kumar Bhadra, Research
Analyst. I am grateful to all these officials for useful comments and suggestions.
I have also had the benefit of discussions with Mr. Ajay Seth, Principal Secretary
School Education, Government of Karnataka, Mr. Jitendra Kumar Srivastava, Secretary
Education, Government of Bihar, Mr. Arvind Kumar Chaudhury, and Secretary, Rural
Development, Government of Bihar. My grateful thanks to all of them.
I would also like to thank Dr. Rathin Roy, Director NIPFP, New Delhi, who agreed to
host the study. Thanks are also due to Mr. Vikram Singh Chauhan and Mr Darshan Singh
Panwar of NIPFP who helped in administering the study.
M. Govinda Rao
Page 4
4
Central Transfers to States in India: Rewarding Performance While
Ensuring Equity
M. Govinda Rao
I. Introduction:
Mismatch between revenue capacity and expenditure need of subnational governments
is an inherent feature of all federations. The assignment of revenues and expenditures
according to the principle of comparative advantage results in the Central governments having
access to most broad based taxes and subnational governments having responsibilities to
provide most of economic and social services but inadequate revenue handles to provide them
Furthermore, there are wide differences among the States in the capacity to raise revenues as
the size of the tax base varies widely. The variations in the tax base among the States results
variations in the standards of public services delivered even when the States make uniform
effort at raising revenues. Variations in public services can also arise when there are significant
differences in the unit cost of providing them. These variations violate the principle of
“horizontal equity” or “equal treatment of equals” (Buchanan, 1950, Boadway and Flatters,
1982). These vertical and horizontal fiscal imbalances will have to be resolved through a
system of intergovernmental transfers from the Centre to the States.
While intergovernmental transfers are inevitable in all federations, it is important to
understand that they soften the budget constraint by loosening the link between revenue raising
and expenditure decisions. Efficiency considerations require that public services should be
paid for by the people who benefit from them and there should be a strong linkage between
revenue raising and expenditure decisions. Intergovernmental transfers tend to soften the
budget constraints of the States and adversely impact on efficiency. While the Central transfers
to States are inevitable in federations, it is important to design the transfer system carefully to
ensure that they do not have adverse effects on incentives in and lead to laxity in tax effort and
expenditure economy. Ensuring incentive compatibility is at the heart of designing an efficient
transfer system.
In India, the Constitution recognises the problem of fiscal imbalances. It provides for
the appointment of the Finance Commission by the President of India every five years to
resolve them by making recommendations on tax devolution and grants in aid of revenues. The
Commission’s recommendations are placed in the Parliament along with the Action Taken
Report by the Ministry of Finance. By and large, the recommendations of the Commission are
Page 5
5
in the nature of general purpose unconditional transfers though some of the Commissions have
made some specific purpose non-matching transfers for activities such as education, healthcare,
police and judiciary. Specific purpose grants are mostly given through centrally sponsored
schemes administered by various central ministries.
In the literature, the objectives of general and specific purpose transfers are clearly
stated. The rationale for general purpose transfers is to enable all the states to provide
comparable levels of public services at comparable tax rates (Rao and Singh, 2005). The
emphasis is on enabling the States and therefore, the transfers are supposed to be unconditional.
The objective of specific purpose transfers, on the other hand is to ensure minimum standards
of public services. The focus in these is ensuring minimum standards. This implies that the
transfers are required to be conditional and they should equalise the expenditure levels of the
states to achieve the minimum standards in respect of specified services.
The objective of this study is to analyse the design and implementation aspects of both
general and specific purpose transfers in India. The recommendation of the Fourteenth Finance
Commission (FFC) and even more importantly, the abolition of the Planning Commission have
brought about a measure of conceptual clarity in the landscape of intergovernmental transfers.
The FFC, unlike the past Commissions, has covered the entire revenue account requirements
of the States, both plan and non-plan, in its recommendations. Thus, the entire general purpose
transfers are given on the recommendation of the FFC and all specific purpose transfer are
given by the concerned Central Ministries.
This study attempts to undertake an empirical analysis of the transfers system in India.
The report covers discussion on the theoretical rationale for the transfer system and analysis of
the structure of policies and institutions in India dealing with the transfer system. The report
also makes a broad analysis of general and specific purpose transfers in the Indian context to
identify the shortcomings. It also undertakes empirical analysis of the three major centrally
sponsored schemes namely, the National Health Mission (NHM), Sarva Shiksha Abhiyan
(SSA) and Mahatma Gandhi national Rural Employment Guarantee Act (MGNREGA).
The report is organized into five sections. Section 2 summarises the theoretical
rationale for general and specific purpose transfers. Section 3 describes the transfer system in
India. Section 4 analyses the equity and efficiency issues relating to general purpose transfers.
Section 5 examines important issues relating to specific purpose transfers namely, centrally
Page 6
6
sponsored schemes. The concluding remarks are presented in Section 6. Detailed discussion
on the three schemes is presented in the Appendix.
II. The Rationale for Intergovernmental Transfers:
Indian economic growth has shown a steady acceleration from just about 3.5 per cent
per year during the period, 1950-80 to 5.8 per cent during 1980-2000 and further to 7.4 per cent
since 2001-02. Although it decelerated after the global financial crisis in 2008, India is one of
the countries which turned around fast and is presently one of the fast growing emerging
economies. Most observers consider even this to be well below the potential and further
reforms to liberalise the economy would help to reach the potential. Nevertheless, the
performance seen in recent times shrugs the image of the country as a laggard.
Despite the impressive growth performance, its regional spread has been uneven, and
even as some of the low income States have been trying to catch up with their more advanced
counterparts, inter-state disparities have shown an increase, particularly after the market based
reforms were initiated in 1991. The States with better physical and social infrastructure and
market friendly governance were able to grow faster (Panagariya, Chakraborty and Rao, 2015).
This has led to significant divergence of incomes among the States with coefficient of variation
in per capita incomes increasing from 0.33 in 1991-92 to 0.47 in 2000-01 and marginally
reducing to 0.40 in 2014-15. Ironically, most of the low income States are natural resource
rich which implies that physical and social infrastructure has been a binding constraint in their
development (Rao and Mandal, 2009).
It is important to accelerate growth and development in the low income States for
reasons of both inclusiveness and stability in Indian federation for a variety of reasons.
Overwhelming proportion of the poor are concentrated in low income States and therefore,
accelerating growth in these States is an important pre-requisite for creating income earning
opportunities to them. The working age population (15-64 years) in India is presently 63.4 per
cent and given the staggering demographic profile in low income States, the high proportion
of working age population will continue for a longer period as the fertility rate in these states
remains high.
While in developed federations, high mobility of population can take surplus labour to
capital rich jurisdictions to overcome adverse effects of uneven development, in countries like
India the restrictions on mobility caused by linguistic, cultural and other institutional factors
makes it important to ensure an even spread of physical and social infrastructures.
Page 7
7
Furthermore, acute inter-State inequalities in the levels of living can be a source of instability
and unrest.
Regional differences in social and infrastructures can be mitigated either through
regional policies or through intergovernmental transfers. In a small country, the Central
government can identify the diverse needs for public services and accordingly allocate
resources to achieve the required balance. In a large, diverse federation, this has to be mainly
achieved through intergovernmental transfers as the lower level jurisdictions are better placed
to provide public services according to the diversified preferences of the people. In almost all
the federations, therefore, the policy of intergovernmental transfers plays and important role in
ensuring equitable access to public services (Ahmad, 1997) even as they tend to soften the
budget constraints at subnational levels.
The rationale for intergovernmental transfers is to offset the fiscal disabilities of
subnational jurisdictions. For reasons of redistribution and stabilisation which is
predominantly (not exclusively) a Central function, all broad-based and redistributive taxes,
money supply function and borrowing powers are exclusively or predominantly assigned to the
Centre. At the same time, most expenditure functions are assigned to the States due to their
comparative advantage in providing public services according to the diversified preferences of
the people in different jurisdictions. In this scheme, vertical imbalance is unavoidable and
intergovernmental transfer system has to resolve the imbalance. At the same time, it is
important to match the revenue and expenditure decisions at the margin for subnational
governments for reasons of efficiency and accountability. The efficient system of tax
assignment envisages that tax powers should be assigned to subnational levels up to the point
where the marginal efficiency loss due to tax disharmony is matched with marginal efficiency
gain from fiscal autonomy. Even with such an assignment system, vertical imbalance is a
feature seen in all federations.
In addition to the vertical fiscal imbalances, horizontal imbalances arise from
differences in the ability to raise revenues and unit cost of providing public services. Horizontal
equity is violated when there are differences in revenue and cost disabilities across States
(Buchanan, 1950). The problem is exacerbated when there are origin based taxes and similar
other factors alter the net fiscal benefits in different subnational jurisdictions (Boadway and
Flatters, 1982). If there is perfect mobility of people across jurisdictions, fiscal differentials
tend to be equalized as people migrate from places where the net fiscal benefits are lower to
those where they are higher. Even when there is no perfect mobility, if the property market is
Page 8
8
reasonably well developed fiscal differentials will be capitalized into property values (Oates,
1969). In developing countries like India, there is neither perfect mobility nor a developed
property market and the only way left is to offset these fiscal disabilities arising from low
revenue capacity and high unit cost of providing public services through intergovernmental
transfers. Such transfers have to be unconditional – to enable every State to provide a standard
level of public service at a normative tax rate.
There is also a case for transfers to ensure that people, irrespective of the jurisdiction
they live in receive prescribed minimum standards of meritorious public services or those with
high degree of spillovers such as elementary education, basic healthcare, water supply and
sanitation and anti-poverty interventions. Such transfers have to be purpose specific, but linked
to providing the specified minimum standards. The States may be asked to make matching
contributions to avoid substituting these transfers to own expenditures. Given the varied levels
of service provision prevailing in different states, it is possible to design the transfer system
with varying matching requirements (Feldstein,1975).
III. Indian Fiscal federalism:
(i) The Federal Fiscal System and Institutions:
India is a large and diverse developing country. The Constitution describes India as a
“Union of States” and a “Sovereign, Secular, Socialist, Democratic Republic”. It is the largest
democratic federal republic, inhabited by 1.3 billion people spread over 29 States and 7 Union
Territories covering an area of 3.29 million square kilometres. The country has a three-tier federal
structure with governments at Union, States and Local levels. There are twenty-nine States and
seven centrally administered territories – two with their own legislatures (Delhi and Pondicherry).
Below the State governments, in urban areas there are 96 municipal corporations, 1,494
municipalities, and 2,092 smaller municipalities (called Nagar Panchayats). There are 247,033
rural local bodies or panchayats, of which 515 are at the district level, 5,930 at the block level,
and 240,588 at the village level. However, the devolution of powers to the third level is uneven
among States and their participation in public service delivery is negligible.
There are wide variations in the size and economic structure among the States. In 2011,
Uttar Pradesh, at 200 million people was the largest State, and Sikkim, with 0.6 million, was the
smallest. The per capita Gross State Domestic Product (GSDP) among the general category States
in 2014-15 was the highest in Haryana at Rs.165728 (excluding the small State of Goa which had
the per capita GSDP of Rs.304666) and the lowest in Bihar, at Rs.33954.
Page 9
9
The Seventh Schedule to the Constitution specifies legislative, executive, and judicial
functions in terms of Union,1 State, and concurrent lists. Most of the broad based taxes are
assigned to the Union government and States are given the predominant responsibility of
providing social services such as education, healthcare, water supply and sanitation and urban
development and co-equal responsibility of providing economic services. Thus assignment
system results in a significant vertical fiscal imbalance. The Founding fathers of the Constitution
were aware of the problem and provided for the sharing of central taxes with the States and giving
grants to them from the consolidated fund of the Centre. To determine the transfer system, they
provided for the appointment of an independent Finance Commission by the President every five
years. The task of the Commission includes recommending the devolution of Central taxes to the
States, laying down the principles of distribution and shares of individual States. The Commission
is also required to give grants and address any other matters entrusted to it in the interest of sound
finance in the Presidential Terms of Reference2.
In this report, the focus is on the transfer system in large States which are called the non-
special category states. These States cover over 90 per cent of the country. The reasons for
confining the analysis to the non-special category states is that predominant proportions of
economic activity in these states are determined by government expenditures and overwhelming
proportion of these are financed by Central transfers as their revenue base is small. The revenue
bases of special category States are small and they have to depend upon Central transfers even to
service their loans. For this reason, these States are called upon to make a matching contribution
of just 20 per cent for the Centrally Sponsored Schemes.
Table 1 presents the shares of the Central and State governments in raising revenues and
implementing expenditures. It is seen that total revenue collected in the country is about 20.5 per
cent of GDP and of this, 37.5 per cent is raised by the States. The States, however incur over 60
per cent of the total public expenditures amounting to 27 per cent GDP. Thus, the States’ total
expenditure 18.3 per cent of GDP of which they raise about 8 per cent of GDP from own sources
and receive transfers amounting to about 7 per cent of GDP. The remaining expenditure is
financed from borrowing.
1 The terms “Union” and “Centre” are used interchangeably in this paper. 2 The Commission is also required to recommend measures to assist the augment the consolidated funds of the
States to supplement the resources of the third level government.
Page 10
10
Table 1: States’ Share in Revenues and Expenditure
Years Total
Revenue
(Union+
States)
Total
Expendi
ture
(Union+
States)
States’ Share in Revenues (Per
Cent)
States' Share in Expenditures
(Per Cent)
Per cent
of GDP
Per cent
of GDP
Tax
Revenue
Non-
Tax
Revenue
Total
Revenue
Current
Expendi
ture
Capital
Expendi
ture
Total
Expendi
ture
1990-91 17.4 26.7 34.4 44.9 35.9 55.2 44.5 53.6
2000-01 16.7 25.8 38.2 40.8 39.1 56.0 57.0 56.5
2005-06 18.9 24.9 37.7 34.7 36.8 55.2 59.4 56.7
2007-08 20.2 24.4 31.9 38.5 32.9 53.5 53.1 54.7
2008-09 18.7 25.7 33.9 40.5 34.7 49.3 64.2 53.8
2009-10 18.2 27.2 37.6 39.6 37.5 51.2 61.5 54.3
2010-11 19.9 26.4 37.6 23.8 35.0 51.3 53.7 53.1
2011-12 18.4 26.8 38.9 38.3 34.0 53.7 60.9 55.8
2012-13 19.1 26.1 39.2 40.8 39.0 54.9 59.6 54.9
2013-14 20.4 27.6 40.3 35.7 37.3 56.0 62.4 56.9
2014-15 20.5 27.3 39.0 37.3 37.3 62.2 56.9 60.7 Source: Indian Public Finance Statistics, Ministry of Finance, Government of India.
Graph 1: Per Capita Revenues and Expenditures of the States According to Per Capita GSDP
0
5000
10000
15000
20000
25000
30000
0 50000 100000 150000 200000
Own Revenues
Total Exp
Dev. Exp
Expon. (Own Revenues)
Expon. (Total Exp)
Expon. (Dev. Exp)
Expon. (Dev. Exp)
Page 11
11
Table 2: Differences in Per Capita Income and Fiscal Variables Among States (2014-15)
States Per
Capita
GSDP
Per
Capita
Revenue
Tax-
GSDP
Ratio
Central
Transfers
General
Purpose
Transfer
Specific
Purpose
Total
Transfers
Total
Expendi-
ture
Dev.
Expendi-
ture
Rupees Rupees Rupees Rupees Rupees Rupees Rupees Rupees
Andhra
Pradesh
106263 10687 8.00 5376 2017 7393 24410 18588
Bihar 33954 2026 5.55 3872 1223 5095 8136 5579
Chhattisgarh 87354 7629 6.65 4830 1584 6414 17005 13202
Gujarat 141405 11187 6.85 2067 1263 3329 17446 12486
Goa
Haryana 165728 12095 6.25 1836 1371 3207 20030 13579
Jharkhand 62091 4199 4.77 3343 1484 4827 10903 7772
Karnataka 144869 11788 7.63 2488 2121 4609 19482 13987
Kerala 155005 12512 6.69 2942 1600 4542 22549 11376
Madhya
Pradesh
63323 6135 7.55 3732 1718 5450 13073 9564
Maharashtra 152853 10887 6.42 1795 1426 3221 16822 11383
Odisha 71184 6411 6.40 4392 2295 6686 14356 10740
Punjab 126606 9787 6.95 2371 1266 3637 17153 8932
Rajasthan 84837 7193 6.32 5251 213 5463 15291 11355
Tamil Nadu 146503 11668 7.20 2839 1910 4749 20062 12995
Telangana 141979 9719 5.61 2752 1411 4163 16461 12469
Uttar Pradesh 49450 4460 7.11 3557 1150 4707 5802 4667
West Bengal 94711 4853 4.92 3385 1993 5378 13465 8290
All Gen. Cat
States
95802 7895 6.63 3498 1531 5030 14082 9807
Spe.Cat.
States
Arunachal
Pradesh
110217 6185.6 2.82 30159.6 25094.3 55253.8 34257 58102
Assam 60621 3630.2 4.77 5325.3 2728.7 8054.0 7700 13156
Himachal
Pradesh
147330 11323.6 1.59 11189.5 2675.3 13864.8 17186 31423
Jammu &
Kashmir
77559 6278.4 2.68 12231.7 3348.4 15580.2 13060 26032
Manipur 58442 2269.2 1.13 18021.7 5616.2 23637.8 13087 27855
Meghalaya 75156 4005.2 0.10 11587.6 4482.9 16070.5 13211 23018
Mizoram 93136 4297.2 0.06 30945.2 11331.7 42276.9 32982 55607
Nagaland 89607 3207.8 0.37 15122.5 18900.5 34023.0 32907 37886
Sikkim 240274 19361.1 0.51 40251.8 10876.0 51127.9 33186 74434
Tripura 77358 3572.1 0.54 13905.4 6615.7 20521.1 11961 26793
Uttarakhand 153076 8929.2 0.91 7408.8 2795.0 10203.8 12361 24667
All Spl.Cat
States
84572 5604.4 0.97 9836.3 4243.8 14080.1 12449 22738
All States 95802 7419 6.58 3757.99 1641.16 5399.15 9977 14637
Source: Finance Accounts of the State Governments, Comptroller and Auditor General, Government of India
Page 12
12
There is considerable variation among the States on their fiscal dependence on the Union
government. There are seventeen relatively homogenous general-category States, but even these
have wide differences in size, revenue-raising capacities and efforts, per capita developmental and
total expenditure levels, and fiscal dependence on the Union government (Table 2). Per capita
own revenues of the States closely follow variations in per capita GSDP with the correlation
coefficient of 0.940 broadly reflecting their revenue capacities (Graph 1). Per capita expenditures
of the States – both developmental expenditures (expenditures on social and economic services)
and total expenditures also have a positive and significant correlation with per capita GSDP (0.
786 and 0.614). This shows that even after the Central transfers, low income states with low
revenue capacity spend significant lower per capita expenditures on social and economic services.
Some important features of the State finances may be summarised here. First, inter-State
disparities in per capita incomes (GSDP) are not only high but also have been increasing over the
years. In 2014-15, among the General Category States, at Rs. 165728, Haryana the State with the
highest per capita income (leaving out a small state of Goa) had five times the per capita income
in Bihar, the lowest per capita income State. As mentioned earlier, the coefficient of per capita
incomes in the States has steadily increase from 0.30 on 1981-82 to 0.35 in 1991-92 and further
to 0.40 in 2014-15 (Panagariya, Chakraborty and Rao, 2015). Second, not surprisingly, per capita
revenues vary with per capita incomes predominantly due to variations in revenue capacity. The
tax-GSDP ratios do not show a clear trend and therefore, the variations in tax-GSDP ratios are
due to both variations in taxable capacity and effort. Third, although per capita transfers are higher
in the States with lower per capita incomes, it fails to offset the revenue disabilities of the poorer
states fully and more affluent States end up spending significantly higher per capita expenditures
than those with their poorer counterparts (Graph 1). It is not surprising that the low income states
with poorer infrastructure deficits are unable to catch up with their more affluent counterparts.
IV. The Transfer System in India: General Purpose Transfers:
As mentioned above, the Constitution envisages the appointment of an independent
Finance Commission by the President of India every five years to make recommendations on
the devolution of Union taxes and grants to be given to the States. Article 280 of the
Constitution mandates the President to appoint a Finance Commission every five years. The
Commission has a Chairman and four other members whose qualification for appointment is
laid down in the Finance Commissions (Miscellaneous Provisions) Act, 1951. The terms of
reference (TOR) of the Commission are (i) the distribution of the net proceeds of Union taxes
between the Union and States and among the States inter-se; (ii) grant in aid of revenues to be
Page 13
13
given to the States; (iii) measures to augment the consolidated funds of the States to supplement
the resources of rural and urban local governments in the States based on the recommendations
of the State Finance Commissions and (iv) Any other matter referred to the Commission by the
President in the interest of sound finance. Under the last item, a number of tasks have been
assigned to the Commission in the past such as setting the fiscal rules and targets for the Union
and States, measures to be taken for sustainable development and the protection of ecology and
environment, rescheduling and writing off of States’ loans, examination of public expenditure
management systems, review disaster management systems, strategic approach to public
enterprise reform and incentivizing the States to undertake tax reforms. So far 14 Finance
Commissions have submitted their reports. Their recommendations have been well regarded
and mostly accepted and implemented by the Governments.
The role of the Finance Commission as envisaged in the Constitution was curtailed
when the Planning Commission was appointed though a Cabinet Resolution in 1950. The
Planning Commission took over the powers to make grants for plan purposes. The scope of
the Finance Commissions’ review was confined to assessing the non-plan requirements of the
States and making tax devolution and grants to meet these requirements. However, the
Fourteenth Finance Commission’s TOR did not restrict its scope to assessing merely the non-
plan side of the States’ budgets and the Commission made recommendations to cover the entire
revenue account. Thus, when the Planning Commission itself was abolished in August 2014,
it did not create any discontinuity. However, even as the Finance Commission is empowered
by the Constitution to give all transfers –general or specific, or revenue and capital given its
temporary nature, the Fourteenth Finance Commission decided that it will stay away from
giving specific purpose transfers which required continuous monitoring.
After the Fourteenth Finance Commission made the recommendations, the entire
architecture of the transfer system has changed. A clear distinction has emerged in respect of
general purpose and specific purpose transfers in Indian fiscal federalism after the report of the
14th Finance Commission was implemented. All general purpose transfers are now
recommended by the Finance Commission and all specific purpose transfers are given by the
respective Central ministries. Although the 14th Finance Commission made a recommendation
that the design and implementation of specific purpose transfers should be decided by a
Committee comprising of the representatives of Central and State governments as well as
domain experts (India, 2014, Chapter 12), the Central government has continued the practice
of taking decisions on these transfers at the relevant Central ministry level.
Page 14
14
The 14th Finance Commission was also concerned with the intrusion of the Central
government in States’ domain through the proliferation of specific purpose transfers through
Central sector and Centrally Sponsored Schemes. Its analysis showed that between 2005 and
2012, the Central government’s spending on State subjects increased from 14 to 20 per cent
and its spending on Concurrent Subjects increased from 13 to 17 per cent. Taking into account
the need to cover plan revenue expenditure requirements and to provide the fiscal space to the
states to cover the expenditures under the State List to reduce the Central governments intrusion
into State subjects, the Commission increased the share of the States in the divisible pool of
taxes3 from 32 per cent recommended during the 13th Finance Commission to 42 per cent.
Thus, according to the Commission’s reasoning, the increase was partly on account of the
inclusion of plan expenditure requirements of the States which was given by the Planning
Commission based on the Gadgil formula and partly to provide greater flexibility to the States
by giving them untied transfers. The Commission adopted a formula for distribution
comprising of a mix of variables representing revenue and cost disabilities. It gave 50 per cent
weightage to deviation from the highest per capita income, 27.5 per cent weightage to
population, 15 per cent weightage to the area and 7.5 per cent weightage to the forest area.
Table 3 : Trends in General and Specific Purpose Current Transfers
Years Gen
Purpose
Transfers
Specific
Purpose
Transfers
Total
Current
Transfers
Share of General
Purpose in Total
Current Transfers
2011-12 3.63 1.97 5.60 64.78
2012-13 3.61 1.63 5.24 68.89
2013-14 3.48 1.76 5.24 66.39
2014-15 3.41 2.74 6.15 55.49
2015-16 4.32 1.74 6.06 71.23
2016-17 RE 4.69 1.84 6.53 71.81
2017-18BE 4.61 1.80 6.41 71.93
Source: Budget Documents of the Union Government.
The 14th Finance Commission’s recommendations have substantially altered the
landscape of federal fiscal transfers. While there was a no significant change in the total
transfers to the State in 2015-16 over 2014-15 in the first year of the award, the share of general
purpose transfers rose significantly from 55.5 per cent to 71 per cent. In other words, the sharp
increase in tax devolution by the 14th Finance Commission resulted in the share of general
3 Divisible pool of taxes comprises of total central taxes (excluding the revenue from earmarked taxes) minus
the revenue from cesses and surcharges and cost of collecting the taxes.
Page 15
15
purpose transfers going up significantly, but this was countered by the Central government
reducing the specific purpose transfers (Chakraborty and Gupta, 2016). Thus, about one
percentage point increase in general purpose transfer was countered by equivalent reduction in
allocation to Central Schemes.
Graph 2: Share of General Purpose and Specific Purpose Transfers
V. Specific Purpose Transfers:
In addition to the tax devolution and grants given to the States based on the
recommendations of the Finance Commissions, the Central government gives specific purpose
grants for various purposes through the respective ministries. The objective of specific purpose
transfers, as mentioned earlier, is to ensure minimum standards of services in respect of those
services that are considered meritorious or those services with significant inter-state spillovers.
However, in Indian context, this has been used as a patronizing instrument to serve political
objectives of the ruling parties at the Centre to woo the States and the electorate by expanding
its reach to spend on the State subjects.
In 2012, there were 147 such schemes initiated by various Central ministries and many
of them were directly implemented by numerous implementing agencies specifically created
for the purpose and the grants were given to them directly bypassing the States. In 2013, these
schemes were consolidated into 66 and in 2014, based on the recommendation of the Expert
Committee on Efficient Management of Public Expenditure the Central Government channeled
all the grants through the State governments (India, 2911). After the 14th Finance Commission
made the recommendation to increase the tax devolution to 42 per cent of the divisible pool,
the Central government appointed a Committee of selected Chief Ministers of the States with
the Chief Minister of Madhya Pradesh as the Convener to further consolidate and rationalise
0.00
20.00
40.00
60.00
80.00
100.00
120.00
Genral
Specific
Total
Page 16
16
the schemes. The Committee consolidated the schemes into 28 and classified them into “Core
of the core”, “Core” and “Optional” with matching requirements from the States stipulated at
30 per cent, 40 per cent and 50 per cent respectively.
There are six “core of the core” schemes including the MGNREGA and 22 “core”
schemes. In addition to these, there are 45 Central Sector schemes implemented in States to
for specified purposes. The total amount of funds spent on all Central Sector and Centrally
Sponsored Schemes in 2016-17 amounted to 1.8 per cent of GDP constituting about 28 per
cent of total transfers. Of these, only 5 schemes– National Rural Employment Guarantee,
National Health Mission, Elementary Education, Rural Roads and Housing schemes
constituted 66 per cent of specific purpose transfers.
Graph 3: Progressivity of the Transfer System
Note: The vertical axis represents index of own revenues and total revenues with the States’ average set at 100.
The differences in the slopes represent the extent of equalization in the transfer system
The analysis of the various components of transfers shows that the general purpose
transfers are most equalizing with the elasticity coefficient of (-) 0. 452 (significant at 1% level)
and the specific purpose transfers are the least equalizing with the elasticity coefficient of 0.162
which is not significant. The overall transfer system is equalizing with the elasticity coefficient
of (-) 0.267. This is shown in Graph 3. The index of own revenues of the States (with all-state
average specified at 100) increases steeply with per capita incomes. The index of total revenues
(including transfers) too shows a positive slope with per capita incomes, but is flatter than the
former reflecting the extent of equalization. Thus, it is seen that the (i) Finance Commission
0.00
20.00
40.00
60.00
80.00
100.00
120.00
140.00
160.00
180.00
200.00
0 50000 100000 150000 200000
Index of Own Revenues
Index of Total Revenues
Expon. (Index of OwnRevenues)
Expon. (Index of TotalRevenues)
Page 17
17
transfers are equalizing but offset the fiscal disabilities of the States only partially; (ii) the
Central schemes are not equalizing at all and (iii) Even after the fiscal transfers are considered,
per capita revenues accruing to the States are positively correlated with per capita incomes of
the States. The resources in low income States enable them to incur much lower levels of
spending than their richer counterparts.
The lower levels of per capita expenditures in States with lower per capita incomes is
clearly brought out in Table 4, where per capita expenditures under various categories are
regressed on per capita incomes in the States for the year 2014-15 in a double-log function. It
is seen that total as well as almost all expenditure categories except capital expenditures show
a positive and significant relationship. In the case of total state expenditures, per capita
expenditures are higher by 0.65 per cent when per capita incomes are higher by one per cent.
The relevant elasticity is 0.69 in the case of current expenditures. 0.65, in the case of
expenditures on social services and 0.43 in the case of economic services. Within social
services, the elasticity is 0.64 in the case of education and 0.72 in the case of healthcare.
The analysis shows that despite equalising transfers, public expenditures are higher in
more developed States. This trend leads to increasing inequalities in infrastructure levels and
human development causing divergence of incomes across Indian States. The matter is
particularly concerning in the case of education and healthcare where the elasticities are high
and given the staggered demographic profile in poorer States, the requirement for public
spending in these states is much higher, but these states continue to spend lower per capita
expenditures due to their lower taxable capacity and inability of the transfer system to offset
their fiscal disabilities. While these Graphs confirm the fact that the transfer system could
offset the fiscal disabilities of poorer States only partially and inequalities in per capita
expenditure on social and economic services continue to persist.
Page 18
18
Table 4:
Elasticities of Per Capita Expenditures with Respect to Per capita Incomes in the States
Expenditure Category Constant
(a)
Regression
Coefficient (b)
Adj. R2
1. Revenue Expenditures 1.5486
(1.2189)
0.6906
(6.2535)*
0.70
2. Capital Expenditures 2.6142
(0.8169)
0.4248
(1.5202)
0.077
3. Expenditures on Economic and
Social Services
2.9471
(2.0104)
0.5488
(4.3063)*
0.52
4. Expenditure on Social Services 1.1281
(0.8551)
0.6511
(5.6781)*
0.66
5. Expenditure on Economic
Services
3.5793
(1.8422)
0.4274
(2.5307)*
0.25
6. Expenditures on Education 0.4324
(0.2499
0.6420
4.2681)*
0.52
7. Expenditures on Public Health -1.6654
-(1.0743)
0.7185
(5.3322)*
0.63
8. Total Expenditures 2.0866
(1.6440)
0.6562
(5.9465)*
0.68
Estimated Equation is: Per Capita Expenditure = Log a + b log Per Capita income + ∈
Note: * denotes significant at 1 per cent level.
Considering the wide variations in per capita GSDP among the States with the richest
State having more than five times the per capita GSDP of the poorest, completely offsetting
the fiscal disabilities to enable the low income States to equalize their per capita expenditures
may simply not be politically feasible in India. First, presently the Union government does not
have fiscal space to meet its own obligations and cannot be expected to make any significant
increase in the transfers. Second, there are significant deficiencies in the standards of physical
and social infrast5ructures provided even by high income States and they too need to spend
large amounts on the developmental heads. Therefore, there is a clamour for higher transfers
from all the States. Third, there are arguments that equitable transfers may reduce the overall
growth of the economy which, in the long run may prove inimical to the interests of the poorer
States themselves. Therefore, the general purpose transfers, which are supposed to enable all
the States to provide comparable levels of public services at a comparable tax rates can do so
only to a limited extent.
It is in this context that the role of specific purpose transfers becomes critical. In
particular, equalization in specific meritorious services such as education and healthcare, rural
roads and anti-poverty interventions can help in augmenting the services in these areas.
However, as pointed out above, in Indian context, the central government has adopted 28
Page 19
19
schemes under Centrally Sponsored Schemes and another 45 Central Sector schemes
competing for assistance. With too many schemes for equalization and with limited fiscal
space available for giving grants this has meant thin spread of resources without much impact
on service levels. Most of these schemes are in the areas specified in the State List and truly
belong to the domain of the States and if the latter are not able to provide these services
adequately, they should be enabled to provide them through general purpose transfers rather
than through conditional transfers. Of course, specific purpose grants should be given to
augmenting services with high degree of inter-state externalities or those which are considered
highly meritorious, but these will have to be a few to make a difference in the service levels.
In terms of assistance, as mentioned earlier, of the many, the grants for 5 schemes
constitute 66 per cent of total grants under central schemes and it is useful to examine in some
detail the design and implementation of these schemes. A case study of schemes for rural
employment, elementary education and healthcare schemes reveal out some important
shortcomings in both the design and implementation mechanisms.
Graph 4: Per capita Development and Total Expenditures in States According to Per capita
Incomes
0.00
5000.00
10000.00
15000.00
20000.00
Per Capita Dev. Expenditure in States According to Per Capit
GSDP
0
5000
10000
15000
20000
25000
30000
Per Capita Total Expenditures Arranged According to Per Capita
GSDP
Page 20
20
Graph 5: Pattern of Per Capita Expenditures on Social and Economic Services in states
According to their Per Capita Incomes
Graph 6: Per Capita Expenditures on Education and Healthcare in States Arranged
According to their Per capita Incomes
A close examination of the grants for these schemes brings out some revealing aspects.
In the case of elementary education, for example, each State is required to prepare the action
plan for 42 different interventions including teachers’ salary, textbooks, teachers’ training
uniforms, transport, residential schools and libraries. (Appendix – 1B) The work plan for the
0.0
2000.0
4000.0
6000.0
8000.0
10000.0
Per Capita Expenditure on Social Services in States Arranged
According to Per Capita Incomes
0.0
2000.0
4000.0
6000.0
8000.0
10000.0
12000.0
Per Capita Expenditures in Economic Services in States Arranged
According to Per Capita Incomes
0.00
500.00
1000.00
1500.00
2000.00
2500.00
3000.00
3500.00
4000.00
4500.00
Per Capita Expenditures in Education in States Arranged
According to Per Capita Incomes
0.00
200.00
400.00
600.00
800.00
1000.00
1200.00
1400.00
Pert Capita Expenditures on Health in States Arrnged according to Per
Capita Incomes
Page 21
21
year after consolidation for all States is approved by a Committee chaired by the Union
Education Secretary. The first instalment is given after the budget is approved and the second
tranche is given only after fulfilling the formalities on spending including the furnishing of
“utilization certificates”. Invariably, by the time, they have to release the second instalment
there are budget cuts or new developments would have taken place requiring additional
allocation to some other sectors or the government was not able to raise the budgeted volume
of revenues. In the event, often, the final grant given is significantly lower than the originally
approved amount. The detailed analysis of national Health Mission and MGNREGA presented
in the Appendix-1A and 1C too suffer from the same malice.
The above brief description brings out a number of shortcomings in the schemes. First,
there are too many schemes and within each scheme, too many sub-schemes with different
objectives to be financed. This results in the thin spread of resources and it is not possible to
clearly specify the target in terms minimum standards of services to be achieved.
Second, the grants for the schemes are not determined on the basis of the shortfall in
the prescribed standard of services. Both the total and individual State allocations are based
on incremental plans prepared by the respective State governments and approved by the
Committee. Inability to link the transfers with service levels makes it difficult to judge them
based on achieving minimum standards. The focus is on spending money rather than ensuring
services.
Third, designing the grants not linked to meet the shortfall in services from the
prescribed levels results in significant misallocation. It is not necessarily the educationally
backward State or the State with poor health indicators that gets more education or health
grants. The telling case is of rural employment guarantee. The volume of grants depends on
the ability of the bureaucracy in preparing the plans and fulfilling the formalities including
furnishing of the utilization certificate. As may be seen from Graph 7, the per capita spending
on rural poor is lower in States with higher rural poverty ratio!
Fourth, the uniform matching ratio across States makes it difficult for the low income
States to utilize the grants allocated to them fully. In a situation in which the general purpose
transfers are not able to offset the fiscal disabilities of the low income States satisfactorily, they
will not have the fiscal space to provide matching requirements. In the event, Kerala, one of
the most advanced States in elementary education and healthcare comparable to many
advanced economies also avails the grant by making the same matching contribution while
Page 22
22
Bihar which is educationally the most backward State does not get adequate grants as it finds
hard to contribute the same matching ratio. Introduction of varying matching ratio depending
on the shortfall in services levels could improve the design of the grant system.
Fifth, there is considerable difference between the approved allocation and actual grants
given. In 2014-15 for example, only 71 per cent of the allocated funds were disbursed in the
case of rural employment guarantee scheme and the extent of difference varied between 38 per
cent in Bihar, the poorest state and 91 per cent in West Bengal, a middle income state. This
creates uncertainty in implementing schemes and invariably the States with greater shortfall in
services levels suffer the most. A careful analysis shows that the shortfall from the approved
is generally higher in the States with lower incomes.
0
2000
4000
6000
8000
10000
12000
0 10 20 30 40 50
Graph 7 : Rural Poverty Expenditure per poor According to Rural
Poverty Ratio
Expenditure per poor
Expon. (Expenditure perpoor)
0.000
10.000
20.000
30.000
40.000
50.000
60.000
70.000
80.000
90.000
100.000
0 50000 100000 150000 200000
Graph 8: Release as Per Cent of Allocation in States According
to Per Capita Incomes
Release as a per cent ofAllocation
Expon. (Release as a percent of Allocation)
Expon. (Release as a percent of Allocation)
Page 23
23
Sixth, the analysis of grants for healthcare shows that the states are able to substitute
grants to their own spending so that the incremental spending on the services is much less than
the grant amount. In the case of healthcare for example, econometric analysis relating to
changes in health expenditures with changes in own revenues, general purpose transfers and
specific purpose transfers shows a significant substitution of expenditures on account of
specific purpose grants. (Rao and Choudhury,2012; Srinath et.al, 2017).
Seventh, approval of the schemes with various components and requirement to adhere
to the originally approved composition often leads to micromanagement, proliferation of
bureaucracy and inefficiency. In the case of education, for example, the States have the prepare
budget and the Centre has to monitor in terms of 28 different interventions. In the case of
healthcare, the Action Agenda report of the NITI Aayog referred to 2000 budget heads in which
the grants are given. Although after the consolidation of the schemes, the volume of flexi funds
has been increased to 10 per cent of the grant in some cases, most schemes suffer from
micromanagement, inadequate allocation to different activities and wastage therefrom.
This foregoing analysis indicates that the design and implementation of both general
and specific purpose transfers need to be analysed in detail. This will help in making
recommendations to enhance effectiveness in equitable and incentive compatible provision of
public services by the states. A detailed analysis of general purpose transfers in the form of
tax devolution and Article 275 grants recommended by the Finance Commission and three
important specific purpose transfers namely, SSA, NHM and MGNREGA will be undertaken
in the final report to make specific recommendations on improving their effectiveness. The
Finance Commission transfers are decided by the Finance Commission and the government
itself does not have a say in changing the formula. However, the analysis can help in providing
guidelines to the Commission while drafting its terms of reference to incorporate improvement
in the formula. As regards, Centrally Sponsored Schemes are concerned, the analysis will help
in improving the design and implementation of the schemes. This will also help in analysing
other important schemes to ensure equalisation with incentives.
Page 24
24
VI. Concluding Remarks:
Fiscal transfers from the Centre to States are critical in India. Unlike in many developed
federations when the tax base differentials are not very significant, India has large and growing
horizontal fiscal imbalances besides a high degree of vertical imbalances arising from the
assignment of tax powers and expenditure responsibilities in the Constitution. Therefore,
design and implementation of general and specific purpose transfers is critical in Indian
federation from the viewpoint of not only ensuring horizontal equity, balanced regional
development and overall stability and integrity of the federation. This becomes even more
important when the fact that there are significant hindrances to mobility of population and
therefore, it is necessary to take capital to the people and not wait for the people to move
towards capital.
Analytically, general purpose transfers are given to offset fiscal disabilities of the States
so that all the States are enabled to provide comparable levels of public services at comparable
tax rates. However, given the large variations in fiscal disabilities in Indian States with per
capita income in the highest income state is five times that of the lowest income State, it
becomes difficult to design the general purpose transfers to fully offset the revenue and cost
disabilities. Even the richest state suffers from physical and social infrastructure deficits and
therefore clamours for transfers and this poses constraints on the extent of targeting and
equalization through instruments like tax devolution. This brings in the importance of specific
purpose transfer to ensure minimum standards of services considered meritorious or those with
significant inter-state externalities.
In India, after the recent changes in the institutional architecture, all general purpose
transfers are given on the recommendations of the Finance Commission. The latest is the
Fourteenth Finance commission whose recommendations have been implemented since 2015-
16. The second source of grants is from various Central ministries which are scheme based.
There are at present 28 Centrally Sponsored Schemes and another 45 central Sector schemes
for which grants are given by various Central Ministries.
The analysis of intergovernmental transfers shows that that the tax devolution and
grants given on the recommendations of the Finance Commission have a strong equalizing
element whereas, those given by various Central Ministries do not. Even the former is able to
offset the revenue disabilities of low income states only partially. The consequence of this is
that the higher income States are able to incur significantly lager per capita expenditures on all
Page 25
25
major social and economic services as well as in the aggregate. This tends to accentuate
inequalities in social and economic infrastructures among the States leading to increasing
divergence in developmental outcomes.
There are a number of problems with the design and implementation of specific purpose
transfers. First, there are too many schemes, often each with multiple objectives resulting in
the thin spread of resources and inability to design the transfer system to achieve minimum
standards of specified services. Second, these are not linked to service level outcomes but tend
to be incremental. Thus, the transfers are not designed to achieve the basic purpose of ensuring
minimum standards of services. Third, the large number of specific purpose transfer schemes
taken up for equalization results in the thin spread of resources with hardly any impact on
service levels. Fourth, the grants are not linked to improving service levels and it is not
necessarily the States with larger shortfall in services receiving higher grants. Thus,
educationally backward states do not get larger grants for education and states with lowest
health standards of not get higher per capita grants for health. The analysis shows that the
states with higher concentration of the rural poor get lower per poor grants for rural
employment. Fifth, there is considerable difference between the originally approved allocation
and final release of funds under various schemes. In the case of rural employment the shortfall
was 20 per cent in 2014-15. The variation between allocation and release are different in
different states and generally, the difference is larger in the case of low income states. The
inability of the centre to provide the funds allocated in the beginning of the year creates
considerable uncertainty in the use of funds. Sixth, a part of the reason for the grater shortfall
in low income States is perhaps the uniform matching requirements. The low fiscal space
available in these states makes it difficult to provide the matching contributions to fully utilize
the funds allocated to them. Seventh, requirement to seek grants under several different
interventions within a scheme, results in lack of flexibility to the recipient in the use of funds.
Finally, in some schemes like healthcare, the States were able to substitute grants for their own
spending with the result that there has not been a commensurate increase in spending on
healthcare after the grants are received.
The Central government may not be able to influence much as far as the Finance
Commission’s recommendations are concerned as this is an independent body making
assessments of Union and state finances and recommending tax devolution and grants.
However, while providing guidelines to the Commission in the Terms of Reference, it can
specify the need to design the devolution system to incentivise, tax effort, and expenditure
Page 26
26
efficiency in its recommendations. However, the Centre can certainly do well to rationalise
the centrally sponsoring schemes. In the case of specific purpose transfers, the Centre has to
determine the design itself. Here, it is important to limit the number of schemes and fund them
adequately to make a difference to service level. It is important to link them to shortfall in
specified services so that the overall objective of ensuring minimum standards is achieved. The
design should result in increased outlay on the aided services. There is certainly a case for
having differential matching requirements with states contribution increasing as the shortfall
in services reduces. The Fourteenth Finance Commission has made the recommendation that
the number of transfers should be minimised and the design and implementation mechanism
for each scheme should be decided by a committee comprising of Union and State government
representatives and domain experts.
Page 27
27
References:
1. Ahmad, Ehtisham (1997), “Intergovernmental Transfers – An International Perspective”, in
Ehtisham Ahmad (Ed), Financing Decentralized Expenditures: An International Comparison
of Grants, Edward Elgar Publishers, Cheltenham, U.K
2. Boadway, Robin and Frank Flatters (1982), Equalization in a Federal State: An Economic
Analysis, Economic Council of Canada, Canadian government Publishing House.
3. Buchanan, James M (1950) Federalism and Fiscal Equity, American Economic Review, Vol
40. No. 4; pp. 583-99.
4. Chakraborty, Pinaki and Manish Gupta (2016), “Evolving Centre-State Financial Relations”,
Economic and Political Weekly, Vol L1, No. 16.
5. India (2015), Report of the Fourteenth Finance Commission, Ministry of Finance,
Government of India.
6. India (2011), Expert Committee Report on Efficient Management of Public Expenditures,
(Chairman: C. Rangarajan), Planning Commission, Government of India.
6. Oates, Wallace, E (1969), “Effect of Property Taxes and Local Public Spending on Property
Value: An Empirical Study of Tax capitalization and Tiebout Hypothesis”, Journal of Political
Economy, Vol. 77 pp. 957-971
7. Panagariya Arvind, Pinaki Chakraborty and M.Govinda Rao (2015), Growth and
Development of States in India, Oxford University Press, New York.
8. Rao, M. Govinda (2002), “Poverty Alleviation under Fiscal Decentralisation” in M. Govinda
Rao (Ed), Development, Poverty and Fiscal Policy, Oxford University Press, pp. 278-298.
9. Rao, M. Govinda and A. Das-Gupta (1995), “Intergovernmental Transfers and Poverty
Alleviation”, Environment
8. M. Govinda Rao and Mita Choudhury, (2012), “Healthcare financing Reform in India’s
Decentralized Healthcare system” in Benedict Clements, David Cody and Sanjeev Gupta (Eds)
The Economics of Public Health Care Reform in Advanced and Emerging Economies,
International Monetary Fund,
9. M. Govinda Rao and Subrata Mandal (2009), “Resource Endowment, Fiscal Flows and
Regional Equity in Indian Federation” in M. Govinda Rao and Anwar Shah (Eds), States’
Page 28
28
10. M. Govinda Rao and Nirvikar Singh (2011), Political Economy of Federalism in India,
(paperback), Oxford University Press, New Delhi
11. Pavan Srinath, Pranay Kotasthane, Devika Kher, and Aashish Chhajer (2017), “Publlic
Expenditure on Health in India 2005-06 to 2014-15”, Report Submitted to Publci Health
Foundation, New Delhi.
Page 29
29
APPENDIX
A1. National Health Mission
Objectives and Design:
The National Health Mission (NHM) is a specific purpose grants given to the States
and Union Territories to augment their healthcare system to provide “accessible, affordable,
accountable, effective and qualitative” healthcare. Initially started as the National Rural Health
Mission (NRHM) by consolidating various programmes on health in 2006, the programme was
expanded to address health concerns of the urban poor living in listed and unlisted slums in
2013. The chapter on health in the 12th Plan document provides a broad framework for
implementation of the programme during 2012-17 and beyond.
The objective of the programme is to provide assistance to the States to ensure universal
access to equitable, affordable and quality healthcare services, accountable and responsive to
people’s needs with effective inter-sectoral convergent action to address wider social
determinants of health. The core values of the programme are to (i) safeguard the health of the
poor, vulnerable and disadvantaged persons; (ii) strengthen public health systems as a basis for
universal access and social protection against rising costs (iii) Build the environment of trust
between the people and health service providers (iv) Empower the communities to become
active participants in attaining the highest possible levels of health ad (v) improve efficiency
and optimise the use of resources. These are supposed to be achieved by building integrated
network of primary, secondary and a substantial part of tertiary healthcare facilities and achieve
inter-sectoral coordination to address food security, nutrition, access to safe drinking water and
sanitation, education of female children, occupational and environmental health determinants
such as women’s rights and employment, and different forms of marginalization and
vulnerability. The programme proposes to incentivise the States and Union territories to
undertake health sector reforms to achieve greater efficiency and equity. It also proposes to
prioritise services to address the health of women and children, and the prevention and control
of communicable and non-communicable diseases. Finally, it proposes to reduce the out of
pocket expenditure of the households on healthcare.
The NHM support to States/UTs has five key components. (i) The National Rural
Health Mission – Reproductive and Child Health (NRHM-RCH) Flexible Pool extends
financial assistance to two components namely (a) Reproductive, Maternal, New-born, Child
and Adolescent Services (RMNCH+A) which is a continuum care approach covering all stages
Page 30
30
of life and (b) health System Strengthening under NRHM which is meant to augment
infrastructure, human resources, programme management and patient transport services. (ii)
National Urban Health Mission (NUHM) provides financial assistance to effectively address
the health concerns of the urban poor living in listed and unlisted slums. (iii) Control of
Communicable Diseases includes programme assistance to control communicable diseases
such as Tuberculosis, Vector Borne Diseases, and Leprosy in addition to Integrated Disease
Surveillance Project. (iv) Control of non-communicable diseases provides financial assistance
to States to meet the challenges of controlling non-communicable diseases such as Cancer,
Diabetes, Cardiovascular Diseases and Stroke, National programme for Control of Blindness,
National mental Health Programme, National Tobacco Control programme, and national
programme for Health Care of Elderly. (v) Infrastructure maintenance is the assistance given
to states to meet the salary on Family Welfare Schemes.
Financing Issues:
When the NRHM programme was initiated, it was entirely funded by the Central
government. However during the 11th Plan period (2007-08 to 2011-12), the Central
contribution was 85 per cent and the States were required to contribute 15 per cent. Later,
during the three years of the 12th Plan (2012-13 to 2014-15), the ratio of Central and State
contributions to the programme was 75:25 for the general category States and 90:10 for the
Special category States. However, after the 14th Finance Commission increased the tax
devolution to 42 per cent (as against 32 per cent by the previous Commission) of the divisible
pool, the funding pattern was changed based on the recommendation of the NITI Aayog’s
Committee of Chief Ministers convened by the Chief Minister of Madhya Pradesh to 60:40 in
the case of general category States and 90:10 in the case of Special Category States.
For allocating funds to individual States, the Union Ministry of Health and Family
Welfare works out the resource envelops for the year and conveys it. Envelops are determined
on the basis area and population weighted by and the socio-economic backwardness and health
lag in the States. Ten per cent of the funds is given to the state that demonstrates that it is able
to efficiently absorb the funds provided as seen from the progress in key areas of institutional
reform identified in the MOU. For the NRHM –RCH Flexible pool, population weights for
States are predetermined. The large Empowered Action Group (EAG) States (Madhya
Pradesh, Bihar, Rajasthan and Odisha) are assigned the wright of 1.3, the two EAG States of
Jharkhand and Chhattisgarh are assigned the weight of 1.5, the eight north-eastern states
including Sikkim are assigned the weight of 3.2 and the small Union Territories (excluding
Page 31
31
Delhi and Pondicherry) are assigned the weight of 3 and the remaining states are given the
weight of 1. The allocation for NUHM is done on the basis of urban population and slum
population by giving 50 per cent weightage to each of the two factors.
Based on the resource envelop communicated to them the states are required to prepare
their annual Programme Implementation Plans (PIPs) based on the State’s context and felt
needs. These are appraised and approved by the National programme Coordination Committee
(NPCC) chaired by the Secretary , Ministry of Health and Family Welfare and the States are
required to implement the plan as approved plan.
Analysis of Transfers under NHM:
As mentioned earlier, the basic purpose of specific purpose transfers is to ensure
minimum standards of healthcare throughout the country. This requires the government to
define the minimum standard, work out the cost of providing this in different states and design
the transfer system to ensure that every State spends the prescribed expenditures to achieve the
minimum standard. However, it must be recognised that there are a number of social
determinants of health and the government can only ensure expenditures. Equalising health
expenditures in a state is only a necessary condition to ensuring minimum standards of
healthcare for, there are a number of social determinants of health and some of them may even
be outside the control of the governments. The analysis of the design and implementation of
the schemes bring out a number of policy issues which need to be revisited of the programme
has to be made effective. These are discussed in the following.
(i) Designing the transfer system to achieve the objective of equalising expenditures is
extremely important. As mentioned above, it is important to define the standards and cost
them. This implies that there should be clarity in the objectives. It is impossible to judge the
effectiveness of the programme when multiple objectives are specified. Specifying too many
objectives spreads the resources thinly across many activities besides increasing the difficulties
in monitoring. In a shared cost programme it is important that the implementing level of
government should be allowed to plan and implement the programme and allocating resources
across several activities within the health sector will increase bureaucratic role without
ensuring efficient resource allocation. Such a micromanagement of the programme betrays the
lack of trust with the States. As reported in the Action Agenda document of the NITI Aayog,
there are as many as 2000 budget heads. It would be useful to set the targets in terms of
infrastructure created such as the number of health centres and sub-centres, the number of
Page 32
32
health professionals and availability of medicines as per the norms and institute an
accountability system where the health system is made accountable to the people. Specifying
the targets in terms of the above and providing expenditures to these would help to link the
outlays to the creation of health facilities making it easy to fix accountability.
(ii) At present, the resource envelop is worked out and communicated to each State
government. As pointed out above, the envelope is determined for 5 different components and
a predominant part of this is determined on the basis of population weighted according to health
lags and area. It is not clear how the weights indicating the health lags are determined.
However, the weights assigned to the EAG states at 1.3 or 1.5 and for North-eastern and
Himalayan Hill states at 3.2 as compared to the other States at 1 indicate that these are based
on broad judgements rather than the actual position on health lags. In other words, it is hard to
find significant and positive correlation between the grants given and the health status in the
States. Kerala, the State with the best IMR gets the third highest grant allocation as well as
release. This is clearly seen from Table 1 (Graph 1) where the per capita NHM grant allocation
as well as release to states is shown against Infant Mortality Rate according to NFHS IV.
Similarly, Uttar Pradesh, grants allocated as well as released to state with the highest IMR is
much lower than many States with much lower IMR. Thus, both the allocation and release of
funds to the States are not to ensure minimum standards of services.
(iii) The analysis of actual release of funds shows that the actual release of funds was lower
than the original allocation in all the States. The largest shortfall was in Jharkhand followed
by Andhra Pradesh and Telangana the new States. Among the low income States, besides
Jharkhand, the shortfall was more than 15 per cent in Chhattisgarh and Uttar Pradesh.
(iv) The fact that there was shortfall in the actual release from the original allocation implies
that this was substantially due to the budget cut. This is revealed by the fact that the actual
expenditure on NHM in 2014-15 was lower than the budget estimate by 20 per cent. Cutting
the expenditure arbitrarily defeats the purpose of ensuring minimum levels of expenditure.
(v) It has been mentioned that one of the reasons for the shortfall in the actual release of
expenditures from the original allocation is the inability to provide the utilisation certificates
and fulfil other compliances in time. At the same time, as the Union Ministry of Health and
Family Welfare wants to utilise the funds, the funds allocated to those states which do not fulfil
the compliances are distributed to those that fulfil them. This defeats the purpose of
equalisation. The issue must be addressed by building capacity in non-complying states and
Page 33
33
perhaps, introducing multi-year budgeting so that these States avail the funds and use them in
an efficient manner to get the desired outcomes.
Table A1: Grants Allocation and Release
States IMR Allocation Release Release as a
ratio of
Allocation
Andhra Pradesh 35 147.52 111.81 75.8
Bihar 48 129.50 117.69 90.9
Chattisgarh 54 227.77 189.33 83.1
Gujarat 34 165.88 148.39 89.5
Haryana 33 147.48 124.25 84.3
Jharkhand 44 165.91 109.85 66.2
Karnataka 28 146.29 126.57 86.5
Kerala 6 176.30 158.18 89.7
Madhya Pradesh 51 176.00 157.36 89.4
Maharashtra 24 140.68 125.57 89.3
Odisha 40 177.53 158.00 89.0
Punjab 29 150.06 134.55 89.7
Rajasthan 41 177.06 161.93 91.5
Tamil Nadu 21 158.21 141.00 89.1
Telengana 28 139.24 106.55 76.5
Uttar Pradesh 64 148.23 125.91 84.9
West Bengal 27 151.39 131.95 87.2
Graph A1-1: Distribution of Central Grants According to Infant Mortality Ratio
(vi) The important objective of requiring the states to make matching contributions is to ensure
that the funds given by the Central government for augmenting health services add to the
overall health expenditures and that the states do not substitute these funds to their own
0.00
50.00
100.00
150.00
200.00
250.00
0 10 20 30 40 50 60 70
Release
Allocation
Linear (Release)
Linear (Allocation)
Page 34
34
spending. However, an econometric analysis of carried out in a recent study by regressing
changes in expenditures on changes in NHM transfers, own revenues, general purpose transfers
and priority assigned to the health sector (as shown is the share of health expenditure in total
expenditure) in a fixed effects model for the period 20013-15 shows that specific purpose
transfers showed that every rupee of per capita specific purpose transfers reduces the spending
by the State by 0.36 paise when the impact of own revenues and general purpose transfers are
accounted for (Table 2). While this is definitely an improvement over the previous estimate
by Rao and Choudhury (2012), it still shows that the States do substitute some portion of
transfers by cutting down non-aided portion of health expenditures and this needs to be
corrected to additionality in expenditures.
Table - Regression Results – Dependent Variable: Changes in States’ Own Expenditure on Health
(Dep Variable: Changes in Per capita expenditure on health- NHM )
# Independent Variable
Coefficient of Variation
(and Standard Error)
Rao and Choudhury (2012) New Analysis
1991-2007
(Model I)
1991-2000
(Model II)
2001-2007
(Model III)
2012-2015
(Model IV)
1
Changes Specific Purpose Transfers from
Union Government on Health
Δ (PC_CGH) it = { (PC_CGH) it - (PC_CGH)
it-1 }
-0.952***
(0.074)
-0.777***
(0.114)
-1.059***
(0.109) -0.360***
(0.137)
2
Changes State's Own Revenues
Δ (PC_SOR) it = { (PC_SOR) it - (PC_SOR)
it-1 }
0.012***
(0.003)
0.015***
(0.004)
0.1545***
(0.006) 0.012
(0.020)
3
Changes State's Priority for Health (as % of
spending)
Δ (SPH) it = { (G hi /G bi)t - (G hi /G bi) t-1 }
17.649***
(1.828)
15.03***
(2.038)
19.487***
(4.231) 38.644***
(12.069)
4
Changes in General Purpose Transfers
(Unconditional) from Union Government
Δ (PC_GPGC) it
0.019***
(0.007)
0.014
(0.011)
0.013
(0.01) 0.017**
(0.008)
5 Constant 18.252***
(3.561)
17.17***
(3.885)
3.552
(5.035) 58.204***
(17.542)
6 State Specific Fixed-effects Yes Yes Yes Yes
7 Time Specific Fixed-effects Yes Yes Yes Yes
8 Number of States 14 14 14 11
9 Number of Observations 224 126 84 55
10 R-square 0.69 0.62 0.77 0.29
Estimated equation is: Δ (PC_OHE)it = α + β Δ (PC_CGH)it + γ Δ (PC_SOR)it + ψ Δ
(SPH)it + τ Δ(PC_GPGC)it + υ (State Dummies) + σ (Year Dummies) + εit
Source: Pavan Srinath et.al (2017), Public Expenditure on Health in India 2005-06 to 2015-16, Takshashila
Institution, Bangalore.
Page 35
35
Reform Issues:
The foregoing analysis shows that the scheme has been less than optimal in achieving the
objectives it has set forth. The basic objective of ensuring a prescribed minimum stand of
health services cannot be achieved with the present design and implementation mechanism.
Therefore, the scheme needs to be revisited make it more effective. Important reform issues to
make the scheme more effective are discussed in the following:
(i) As mentioned earlier, it is necessary to define the objective of the scheme clearly. This
implies that it is necessary to avoid multiple objectives and focus on a single objective of
ensuring minimum levels of health infrastructure across the country. It is necessary to avoid
multiple objectives and linking transfers to several interventions. The objective should be to
ensure a prescribed minimum health infrastructure for primary and secondary healthcare
including physical infrastructure, health professionals and drugs. A significant portion of the
tertiary healthcare and some portion of secondary healthcare must be provided by the States
themselves.
(ii) Once the focus shifts to ensuring minimum standards of services, it is not necessary to
have multiple interventions and give grants under a large number of budget heads. The NITI
Aayog document states that there are as many as 2000 budget heads for NHM transfers. Such
micromanagement and minute division of transfers hugely enhances the transaction cost and
spreads the resources thinly across several interventions which will prevent making appreciable
impact on the health infrastructure. When the nature of the intervention is decided by the States
themselves, it is important to trust them and provide them flexibility to ensure the type of
infrastructure and strengthening of services they intend to provide. According to the
Constitution, Public Health is a State subject and it is appropriate to trust them and empower
them to provide a mix of infrastructure as perceived them to be appropriate.
(iii) The resource envelop allocation to the states should be made purely on the basis of
shortfalls in infrastructure as per the specified norms. The present system of allocating funds
on the basis of area and population weighted according to health lags to a considerable extent
arbitrary and does not allocate resources according to varying standards of health infrastructure.
As the objective of any specific purpose transfer is to ensure minimum standards of services,
it is necessary to define what is the minimum standard sought to be equalised and make
allocations accordingly.
Page 36
36
(iv) The difference between original allocation and ultimate release creates difficulties in
implementing the planned activities by the recipients of the grants. The difference largely
arises on account of cuts in the Central budget for the schemes or inability of the recipient state
governments to fulfil the compliances including the timely provision of utilisation certificates.
Simplification of the transfers in the lines indicated in (ii) above should considerably reduce
the compliance requirements by the States. In addition, as some infrastructure facilities in the
health sector may require longer time period to complete, multi-year budgeting may be thought
of as a solution.
(v) Creation of infrastructure facilities by itself may not improve the health outcomes. It
is important to institute a system of incentives and accountability. This does not fall in the
realm of design of the transfer system but implementation. To a considerable extent this has
to do with the system of governance in the State.
(vi) The matching requirements from the states fort NHM has been changed after the NITI
Aayog Committee of Chief Ministers convened by the Chief Minister of Madhya Pradesh
recommended the marching ratio between the Centre and states at 60:40 for the General
Category States (GCS) and 90:10 for the Special category States. Given the large number of
schemes and significant inter-state variations in the health infrastructure including human
resources between the States and the need to bring up the states lagging in the services to the
minimum level, it may be appropriate to design the scheme requiring varying matching
requirements. The GCS may be grouped into three categories depending on their taxable
capacity as high, moderate and low capacity states and the matching ratio for the states may be
fixed at 50%, 40% and 30%. This way, low capacity states will find it easier to contribute their
marching requirements and avail the Central transfers.
(vii) It is important to ensure that the grants given to the States add to the expenditure on
healthcare and the States are not allowed to substitute their own spending by transfers. This
would require adding a condition to availing the grants. This could be done either by stipulating
that the expenditure excluding the transfers on health does not fall short of the projected health
expenditures excluding the transfer for the year or by stipulating that the share of health
expenditure in total budgetary expenditure increases by the volume of grants received.
Page 37
37
Appendix A2: Sarva Shiksha Abhiyan
Sarva Shksha Abhiyan (SSA) is a Centrally Sponsored Scheme implemented in
partnership with the States to achieve universalization in elementary education in the country.
The scheme was conceptualised and introduced based on the experience gained from the
erstwhile programmes namely, Operation Black Board (OBB), Shiksha Karmi Project (SKP)
and District Primary Education Programme (DPEP). The National Mission for SSA was
initiated in January 2001 The objectives of the scheme are to ensure universal access and
retention, inclusiveness by bridging gender and social category gaps in education, enhancement
in the learning levels of children. These are sought to be achieved through as many as 42
interventions such as opening of new schools, construction of schools and additional
classrooms, toilets and drinking water, provisioning of teachers, periodic teacher training and
academic resource support and textbooks and support for learning achievement.
The enactment of the Right of Children for free and Compulsory Education (RTE) Act
in 2009 and consequent insertion of Article 21A in the Constitution states that, “the State shall
provide free and compulsory education to all children in such a manner as the Stare may, by
law, determine”. Thus, the Act mandates that every child in the 6-14 age group in entitled to
have free and compulsory education in a neighbourhood school till the completion of
elementary education. The framework for implementation of SSA has accordingly been
amended in September 2010 to align with the provisions of the RTE Act. An important
provision of the Act is the requirement of admitting 25 per cent of the seats in private schools
for the children belonging to the weaker sections and disadvantaged groups in class 1 or pre-
primary class with the government required to reimburse the fees of these children. The Act
also prescribes inter alia, (i) provision for a non-admitted child to be admitted to an age
appropriate class, (ii) specifies the responsibilities of different levels of government in
implementation, (iii) lays down the norms and standards relating to pupil-teacher ratio,
buildings, infrastructure, school-working days and teacher working hours, (iv) rational
deployment of teachers to maintain the pupil-teacher ratio in every school and not just the block
or the district as a whole, (v) the norms are set for pupil-teacher ratios, buildings and
infrastructure, physical punishment and mental harassment of students are prohibited,
prescribes screening procedure for admission of children and prohibits charging capitation fees,
private tuition by teachers and running of schools without recognition, (vii) development of
curriculum in consonance with the values enshrined in the Constitution and (viii) provides for
25 per cent admission of children belonging to weaker sections and disadvantaged groups in
Page 38
38
class 1 or pre-primary class and reimbursement of fees to states towards expenditure incurred
by them for admission of economically weaker section (EWS) of students in private unaided
schools with effect from 2014-15.
The objectives of the programme of universalising elementary education, closing the
gender and social groups’ gaps, and improving the quality of education is sought to be achieved
through 42 interventions grouped under 8 different components. These include, access and
retention, quality, gender, equity, Section 12 (1) (C) of RTE Act reimbursement of expenditure
for 25 per cent of admissions in private schools), infrastructure development, programme
management and other issues. This is a shared cost programme between the Central and state
governments. During the period 2010-14, the sharing ratio between the centre and States was
65:35 for general category States and 90:10 for Special Category States. After 2015-16 this
was changed to 60:40 in the case of general category States and 90:10 in the case of Special
category States has continued.
The shares of different States and Union Territories in total grants are determined on
the basis of the approved Annual Work Plan and Budget (AWP&B). Each State and Union
Territory submits it AWP&B to the Project Appraisal Board Chaired by the Secretary in the
Ministry of Human Resource Development as per the financial norms of the scheme, which
includes the shares of the centre and states. The Central share is released in three instalments
– an ad-hoc instalment, balance of 1st instalment and 2nd instalment. The release is done subject
to the submission of provisional/audited utilisation certificate, state share statement,
outstanding advances and pace of defraying expenditure. The release is done to the States and
Union Territories on a lump sum basis for further release to State Implementing Societies.
The share of the Central government is released in three instalments in different months
– ad-hoc, first and second instalments to ensure uniform flow of funds. The release is done
after the required documents such as provisional/audited utilisation certificate, state share
statement, outstanding advances and pace of expenditure implementation. The Central share
is released to the States and the latter in turn release the funds to State Implementing Societies
(SIS). The Central share is divided into General and Capital heads from which the SC, ST and
General components are segregated. SISs function under the supervision of the respective State
governments. They release the funds received by them to Government schools, Government
aided schools and private schools identified by the State government for giving grants.
Page 39
39
Analysis of Grants:
As mentioned earlier, there are as many as 42 interventions within the SSA with
multiple objectives and the States have to prepare their plans for each of the interventions.
Multiple objectives makes defining the minimum standards difficult. For example, while
enrolment ratio can be defined, it is not possible to clearly define and set minimum standards
for the quality of education to be achieved through the transfer system. The focus then shifts
to inputs such as teacher – student ratio or physical infrastructures provided rather than learning
outcomes. At the end, the Right to Education ends up with attendance at schools rather than
educating the young.
There are a number of issues of both design and implementation of the scheme. As
may be seen from Graph A2-1, the expenditure per child in the school going age (6-13) in the
States are positively related to per capita GSDP with a correlation coefficient of 0.688. This
shows that SSA has not had a significant impact on equalising per child expenditures and the
States with low revenue capacity continue to suffer from poor educational standards as
comparted to their more affluent counterparts. In addition to lower expenditures, the poor
implementation results in lower teacher-student ratio, employment of untrained teachers,
absenteeism of teachers and inability to provide teaching accessories. Thus, the basic objective
of equalising standards of elementary education gets defeated.
As mentioned earlier, the preparation of plans for SSA is done on incremental basis and
not on the basis of the shortfall in standards of elementary education. In the event, the grants
are given not necessarily on the basis of the deficiency in the standards of elementary education,
but on the basis of the ability of the State to prepare its plans. The spread of grant per child in
the age group 6-13 in the States arranged according to per capita GSDP shows virtually no
relationship between the two variables (Graph A2-3). This shows that distribution of grants
has not been according to the deficiency in the standards or revenue disabilities of the States.
This is a matter of concern as in low income –highly populated states with higher proportion
of the children in the school going age, the low per child expenditures will accentuate
educational inequality.
Page 40
40
AP
BR
CH GJ HR
JH
KAKE
MP
MH
OD
PU
RJ
TN
TE
UP WB
0
2000
4000
6000
8000
10000
12000
14000
16000
0 20000 40000 60000 80000 100000 120000 140000 160000 180000
Graph A2:1 Elementary Education Expenditure Per Child in the Age
Group 6-13 in States Arranged According to Per Capita GSDP
AP
BR
CH
GJ
HR
JR
KA
KE
MP
MH
ODPBRJ
TN
TL
UP
0.00
1000.00
2000.00
3000.00
4000.00
5000.00
Graph A2:2 Per Capita Expenditures in Education in States Arranged
According to Per Capita Incomes
AP
BH
CG
GJ HRJHKA
KL
MP
MH
OD PJ
RJ
TN
TL
UP
WB
0
500
1000
1500
2000
2500
3000
3500
4000
0 50000 100000 150000 200000
Graph A2:3 Grant /Child According to Pet Capita GSDP in States
Grant /child
Linear (Grant /child)
Page 41
41
The shortcoming in the design of the grants under SSA is reinforced when we look at
Graphs A2:4 and A2:5. In the first graph, the SSA grant in 2014-15 in the States are shown
against the ratio of out of school children taken from the Statistics on School Education 2011-
12 published by the Ministry of Human Resource Development. If out of school is taken as a
measure of educational standard, the graph shows that there is hardly any relationship between
the grants given and educational standards in the States (Correlation coefficient: 0.112).
Similarly, per child grant to States according to dropout ratio too shows virtually no
relationship between the two variables with a correlation coefficient of (-) 0.0698. (Graph A2-
5).
AP
BH
CG
GJHR JHKA
KL
MP
MH
OD PJ
RJ
TN
TL
UP
WB
0
500
1000
1500
2000
2500
3000
3500
4000
0 1 2 3 4 5 6
Graph A2:4 Grant /Child According to Ratio of Children Out of School to
Total Children
Grant /child
Linear (Grant /child)
AP
BH
CG
GJHRJHKA
KL
MP
MH
ODPJ
RJ
TN
TL
UP
WB
0
500
1000
1500
2000
2500
3000
3500
4000
0 0.5 1 1.5 2 2.5 3 3.5 4
Graph A2:5 - Grant /child According to Dropout Ratio
Grant /child
Linear (Grant /child)
Page 42
42
The lack of equalization in the SSA grants is not only because of the shortcomings in
the design of the grant system but also due to implementation problems. The low income
States have been lagging in fulfilling the conditionalities and availing the grants allocated to
them to the full. The positive relationship between the ratio of grants release to allocation with
per capita GSDP shows that the higher income States are able to implement the scheme better
than the less affluent States. In other words, the low income States not only are allocated lower
per child grants, but also they are unable to utilise the grants allocated to them. Inability to
utilise the grants results in their grants being distributed to those States which fully utilise, thus
compounding the inequity. The variations in the utilization rates could be due to their inability
to implement the schemes expeditiously, or inability to fulfil the conditions like timely auditing
off the accounts, compilation of information on the utilization from the village level or simply,
inability to provide matching resources as required in the scheme. This implies that there must
be concerted efforts at building capacity to implement the schemes, have to re-examine the
reporting requirements.
Considering the importance of the scheme, it may also be useful to think in terms of
multi-year implementation plans to avoid losing the grants. As regards matching ratios are
concerned, to encourage educationally backward states, the Central government could
introduce varying matching ratio requirements depending on the extent of educational
backwardness or the revenue disability. The Special category States in any case have to make
lower matching contributions. Even among the general category states, it may be appropriate
to classify them into three categories in terms of educational backwardness/revenue disability
and have a matching ratio of 30%, 40% and 50% for the most backward, middle category and
least backword category States.
AP
BH
CGGJ
HRJH
KA KL
MPMH
ODPJ
RJ
TN
TL
UP
WB
0
20
40
60
80
100
0 50000 100000 150000 200000
Graph A2:6 -Grant Release/Grant Allocation in States According to Per
Capita GSDP
Release/Allocation
Linear (Release/Allocation)
Page 43
43
After the enactment of RTE, a provision has been made to provide 25 per cent seats in
private schools disadvantaged children on reimbursement of the fees by the government. While
this can be a gateway to these children to avail elite education, it can also create some social
problems. First only a miniscule minority of the students can get a chance to get admitted in
private schools. This provides an alibi for not improving the quality of government schools.
Second, given that the social background of the disadvantaged students admitted under RTE
are very different from the regular students, there can be a feeling of segregation and
discrimination. Furthermore, given the varying family backgrounds with the general students
having access to parental guidance or paid tuitions after the school, the RTE students may find
it hard to compete with the regular students. It is important that the States should work towards
improving the standards in government schools by having adequate number of trained teachers,
constant upgradation of their skills, enforcing their attendance and regular teaching in schools
and access to teaching materials and aids.
The important issue in SSA should be to reduce educational inequalities among the
States so that children are provided with access to education irrespective of the place of their
residence and economic and social background. The focus will have to be not on enrolments
but on learning. This requires improvements in design and implementation of the scheme and
the capacity and willingness by the states to enforce compliance by the teachers. In particular,
there is a need to build capacity in the lagging States. Multiple interventions with minute
conditionalities only adds to the problems of implementation and bureaucratic interference. It
is necessary to trust the states, handhold them where necessary, help them to build capacity to
implement and provide greater flexibility in the use of funds rather than distribute funds across
several interventions.
Page 44
44
Appendix A3: Mahatma Gandhi National Rural Employment Guarantee
Salient Features of the Scheme
According to the World Bank report, Mahatma Gandhi National Rural Employment
(MGNREGA) is the world’s largest public works programme. This is a programme designed
to ensure livelihood security by providing 100 days of guaranteed wage employment in a
financial year for an adult member of every household that volunteers to undertake manual
work. The programme was introduced by merging and expanding the erstwhile Sampoorna
Grameena Rozgar Yojana (SGRY). It was started in 200 districts of the country in 2006 and
the coverage was expanded to additional 130 districts in 2007 and the entire country in 2008.
The National Rural Employment Guarantee Act of 2005 provides the framework for
the design and implementation of the scheme. The job seekers are required to obtain the job
cards by applying for registration. The job card holders have to be provided with employment
within 15 days from the date of application for the job failing which they are entitled to receive
unemployment allowance. Contractors are not supposed to execute the works and unskilled
wage should constitute 60 per cent of the work plan and the remaining 40 per cent should be
incurred for material cost and skilled wages. The entire scheme has to be implemented by the
Panchayats and the share of village panchayats should be at least 50 per cent. Priority in the
works should be assigned to those involving natural resource regeneration and improving
agricultural productivity, drought proofing and flood protection. Payment to the workers have
to be made directly to their bank or post office accounts.
The salient features of the scheme are (i) this is a rights based scheme for adult members
willing to do manual labour; (ii) the employment must be provided to the job card holders
within 15 days of their application failing which they are entitled to receive unemployment
allowance; (iii) Job card holders can receive employment entitlement is up to 100 days in a
financial year depending upon their demand; (iv) the works chosen must be labour intensive
with unskilled wages constituting 60 per cent of the cost; (v) Implementation of the scheme is
done at decentralized levels with village panchayats required to implement 50 per cent. The
entire work plan is supposed to be identified and recommended by the Gram Sabha. The
Panchayat Raj Institutions have been given the primacy in planning, implementing and
monitoring the scheme; (vi) The facilities such as crèche, drinking water, first aid and shade
should be provided at the work sites; (vii) women beneficiaries must constitute one-third of the
employment provided; (viii) There must be proactive disclosures through social audit,
Page 45
45
grievance redressal mechanisms to ensure transparency and accountability and (ix) the States
are responsible for implementation and ensure that work as demanded for up to 100 days is
ensured.
Under the MGNREGA the work plan is supposed to be decided on the basis on a
participatory planning exercise. The responsibility for preparing the labour budget for the next
financial year along with the details of unskilled labour requirement is assigned to the District
Programme Coordinator and this task has to be completed by December. The entire exercise
leading up to the estimation of the labour budget and identification of the work plans is done
in a decentralized planning exercise. The Gram Sabhas are supposed to identify the work plan
and the Gam Panchayat-wise identification of the shelf of works and estimation of employment
demand is aggregated at the block level and thereafter at the district and State levels. These
estimates scrutinised by the State Government are submitted to the Empowered Committee
chaired by the Secretary, Rural Development of the Central government. After taking account
these inputs, the Empowered Committee finalises the labour budget based on the performance
of the State in terms of the employment created during the preceding four years, the planning
process adopted to finalise the labour budget in the State, an appraisal of the initiatives and
strategies of the State to improve delivery mechanism and assessment of the requirement of the
State in terms of magnitude and intensity of rural poverty as reflected in the Socio-economic
Caste Census, 2011 (SECC) estimates and frequency of the occurrence of natural calamities.
The labour budget thus finalised is only indicative and not a ceiling. The states are required to
cater to the actual demand for work during implementation.
The funds to the States are released normally in two tranches and there can be more
than one instalment in a tranche. The amount in a tranche depends upon the approved labour
budget, opening balance, pending liabilities of the previous year and overall performance.
After the approval by the Empowered Committee and adoption in the budget, the State
government is required to prepare district-wise, month-wise projections of labour demand.
Based on this fund requirement is estimated by the NREGA Soft. The first tranche is estimated
on the basis of the funds required for first six months of the financial year or 50 per cent of the
labour budget of the State, whichever is lower. The first tranche is released in April and the
amount is calculated on the basis of labour demand projected for the first 3 months, adjustment
of unspent balances and pending liability.
The release of the first tranche is subject to the submission of (i) a certificate to the
effect that accounts of all the district of the State for the financial before 2014 have been settled;
Page 46
46
(ii) a certificate on the settlement of all audit paras under the MGNREGA; (iii) a detailed action
taken report on the complaints forwarded to the State; (iv) a certificate indicating satisfactory
compliance of Ministry’s clarifications/suggestions/guidelines and observations from time to
time; (v) a certificate to the effect that there hasn’t been any mutualisation and misappropriation
of funds.
The second tranche is released subject to the fulfilment of the prescribed conditions and
on submission of the proposal in the prescribed format by the State. The proposal can be
submitted only after the district/State utilises of 60 per cent of the available funds. If the second
tranche proposal is submitted after 1st October, it is necessary to submit the audit report of the
previous year. The quantum of funds released in the second tranche depends on the
performance in the utilisation of the funds available.
Analysis of the Scheme
Governmental intervention in redistribution is necessary because markets do not bring
about the desired state distribution of income and wealth. It is also important that while funding
for such redistribution has to come predominantly from the Central government,
implementation of anti-poverty intervention has to be at local levels for reasons of comparative
advantage (Rao and Das-Gupta1995, Rao, 2002). There are general questions as to whether
such targeted interventions are better, or assuring basic minimum levels of income to the
targeted groups of population is more desirable. In this report, these issues have not gone into
as the objective is to analyse the design and implementation issues in this important specific
purpose transfer.
This is undoubtedly an important anti-poverty intervention. The self-selection through
manual unskilled work in the scheme makes targeting the benefits of the scheme to the poor
automatic. Indeed, there are challenges in implementation and possibilities of misappropriation
at the grass-roots level in feudal oligarchic power structure in rural areas. There are also
administrative costs and bureaucracy at various stages with potential power to seek rent. These
issues of implementation have to be addressed by evolving and strengthening the systems of
checks and balances including an effective social audit.
The focus of this study is design and implementation of the specific purpose transfer
for generating wage employment in rural areas to minimise the hardship arising from rural
poverty. Although there are multiple objectives in the scheme, the principal focus is to mitigate
the distress caused by rural poverty. This would mean that the spending on MGNREGA should
Page 47
47
spread across the States such that the State with higher concentration of poverty should receive
larger amounts. The analysis of per poor spending on MGNREGA across different States
shows that in 2014-15, per rural poor expenditure was negatively correlated (-0.572) with the
rural poverty ratio according to the Tendulkar measure (Graph 7). This shows shortcomings in
the targeting of MGNREGA.
The above finding is reinforced by the pattern of person days of employment generated
through MGNREGA in different States relative to their rural poverty ratio (Tendulkar measure)
in 2014-15. Graph 8 which presents the analysis shows no particular pattern. It is seen that
Tamil Nadu had the highest number of person days employed even though the rural poverty
ratio in the state was just 15.8 per cent. In contrast, Bihar, Chhattisgarh and Jharkhand and
Madhya Pradesh which had the highest rural poverty ratios had much lower person days of
employment.
The above result is not surprising as, despite being a demand driven programme, the
labour budget is finalised on the basis of factors such as performance of the State in creating
employment during the preceding four years, the planning process adopted to finalise the
labour budget, the initiatives and strategies of the State to improve delivery mechanism and
assessment of the requirement of the State in terms of magnitude and intensity of rural poverty
as reflected in the Socio-economic Caste Census estimates and frequency of the occurrence of
natural calamities. In this list of factors, SECC poverty measure is the only factor that targets
the spending on rural poverty. Besides being largely incremental, there is considerable
discretion by the Empowered Committee and consequently, it is not necessarily the States with
largest poverty concentration that get the highest MGNREGA grant.
AP
BH
CGGJ HRJH
KA
KL
MPMH OD
PJ
RJ
TN
TL
UP
WB
0
2000
4000
6000
8000
10000
12000
0 10 20 30 40 50
Graph A2:7 Rural Poverty Expenditure per poor According to Rural
Poverty Ratio
Expenditure per poor
Expenditure per poor
Expon. (Expenditure per poor)
Page 48
48
A comparison of originally estimated cost of the programme with the final release of
funds under MGNREGA in 2014-15 shows interesting results. First, although the funding for
MGNREGA is claimed to be open ended, the actual release of funds in 2014-15 for the scheme
were lower than the originally estimated expenditures in every State by varying magnitudes
(Graph 9). This is understandable as the originally estimated cost could include the matching
contribution from the States. However, the wide variations in the ratio of original cost estimate
to the release shows that there could be significant difference between originally approved
grants and the final grants.
The graph plotting the difference between the original cost estimate and final release of
expenditures arranged according to per capita GSDP in the States brings out an interesting
pattern. The ratio of grant releases by the Centre to the States with very low per capita GSDP
are the lowest. The ratio increases as per capita GSDP increases and then declines at very high
per capita GSDP levels. The States with low per capita GSDP have the concentration of rural
poverty and the programme is much more important to them than more affluent States. At very
high income levels where the rural poverty ratio is low, the States themselves may not attach
much importance to the programme and utilise the funds.
APBH
CG
GJHR
JHKA
KL
MP
MH OD
PJ
RJ
TN
TL
UP
WB
0.0
500.0
1000.0
1500.0
2000.0
2500.0
3000.0
3500.0
0 5 10 15 20 25 30 35 40 45 50
Graph A2:8 Person Days Employed (in Lac) According to Rural Poverty
Ratio
Page 49
49
The important point is that as MGNAREGA is a programme of giving wage
employment to the poor, it is desirable to design the grant system based on single factor of rural
poverty rather than bring in other considerations. If indeed the States do not have the capacity
to design the works and implement the programme, the solution lies in developing their
capacity through handholding so that the overall objective on providing assured wage
employment to the rural poor is met.
One of the reasons for the low ratio of actual release of grants to the original expenditure
estimate in the States with low per capita GSDP may be due to their inability to provide
matching contributions. Although MGNREGA is considered as a “core of the core”
programme, the States are required to make a matching contribution of 30 per cent to the
Central contribution. The contribution is uniform across the general category States. As
suggested in the case of NHM and SSA, it may be desirable to devise a varying system of
matching ratios depending on the revenue raising capacities of the States. This would help the
States with low per capita GSDP which also are those with high concentration of rural poverty
to utilise the grants better.
AP
BH
CGGJ
HRJH
KA
KL
MP
MH
OD
PJRJ
TN
TLUP
WB
0.000
10.000
20.000
30.000
40.000
50.000
60.000
70.000
80.000
90.000
100.000
0 20000 40000 60000 80000 100000 120000 140000 160000 180000
Graph A2:9 Percent of Release to Original Cost Estimate


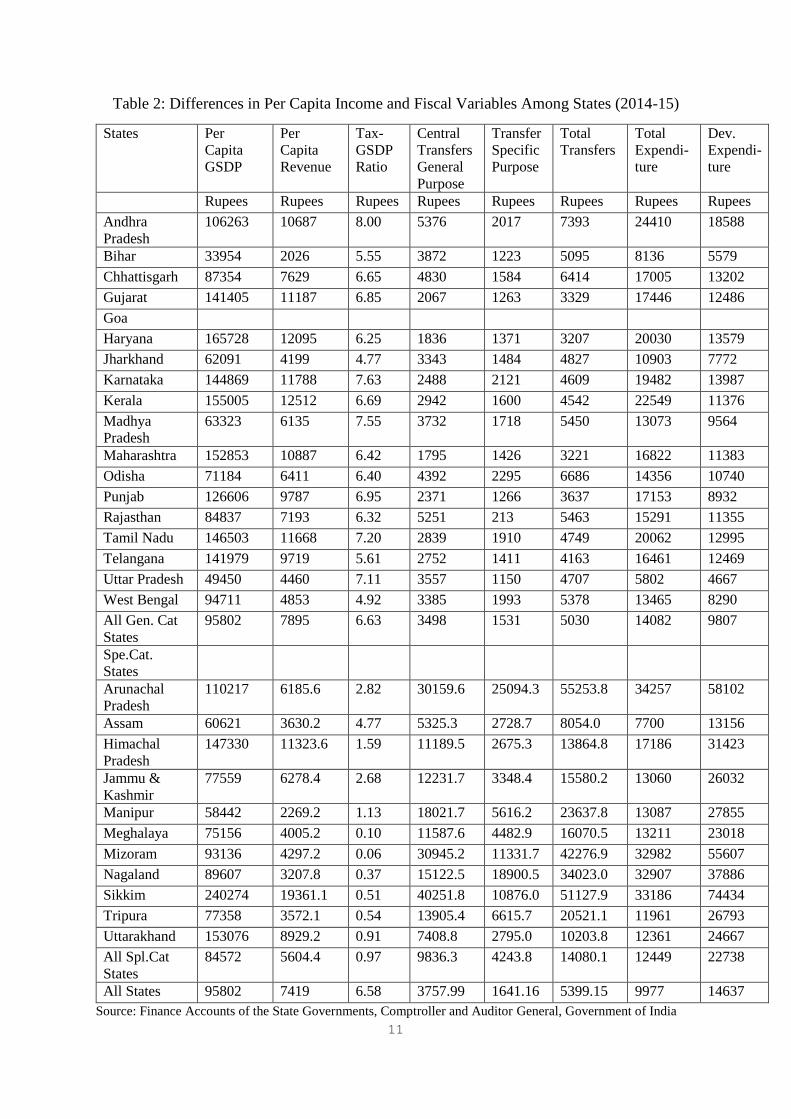

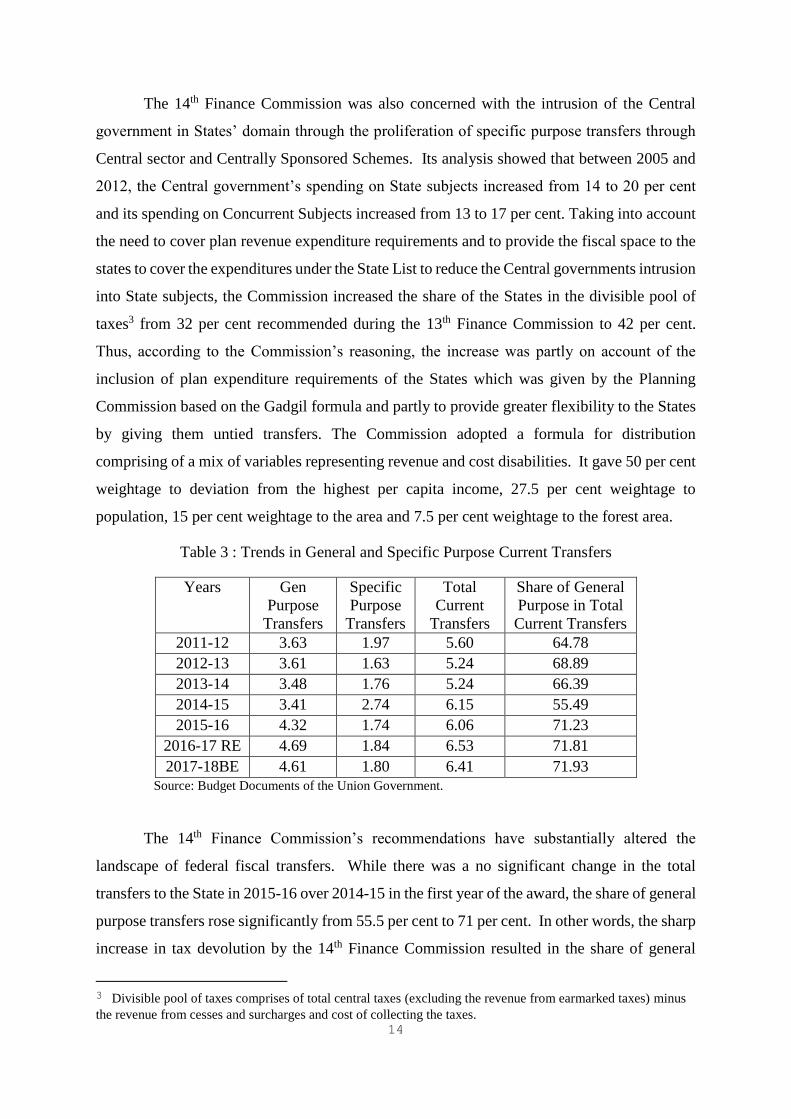

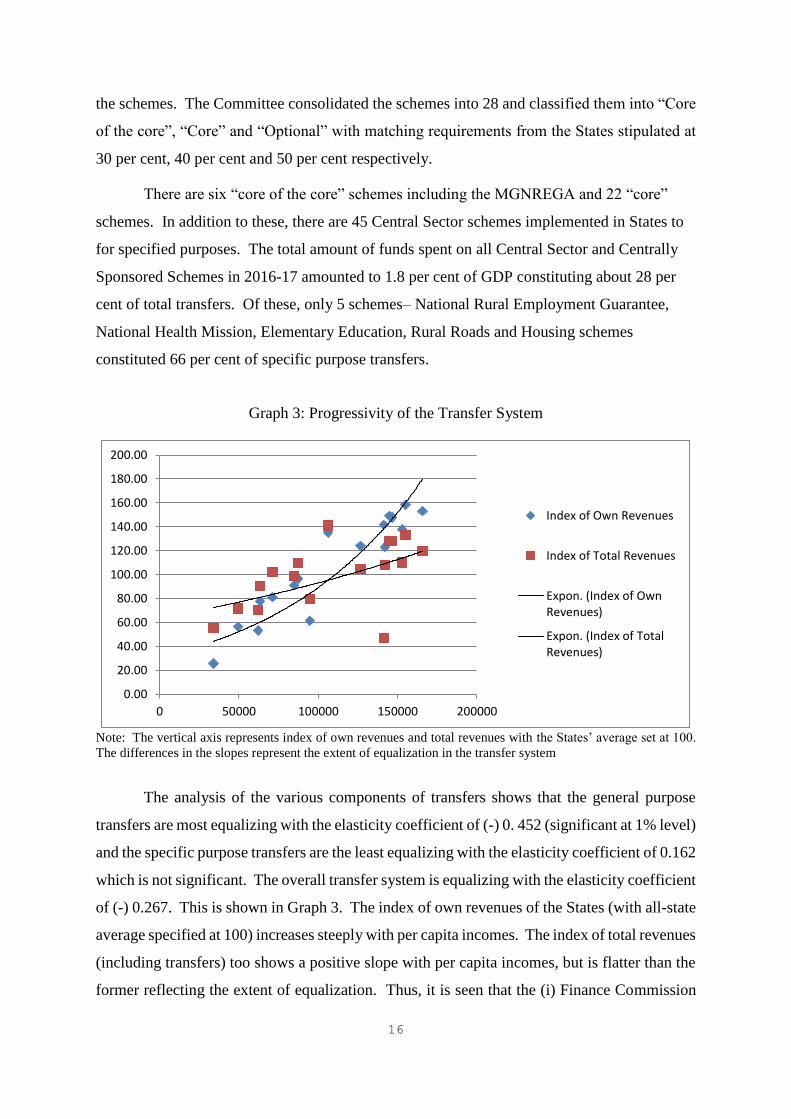

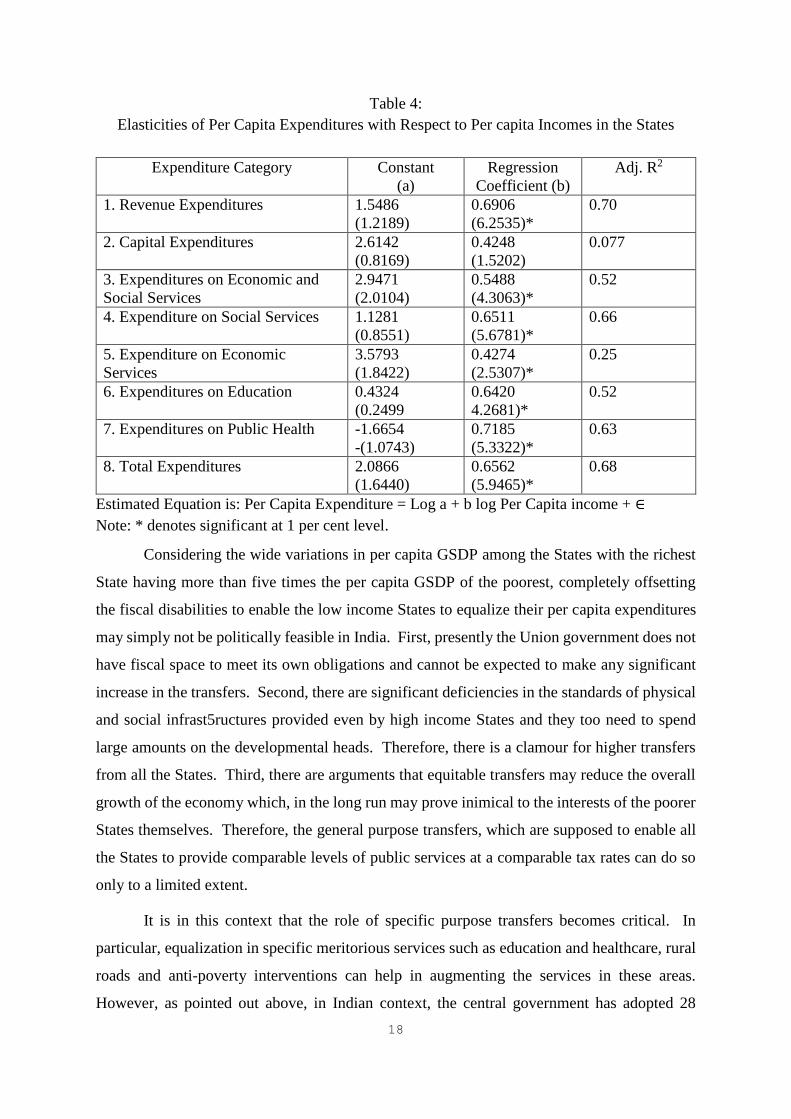
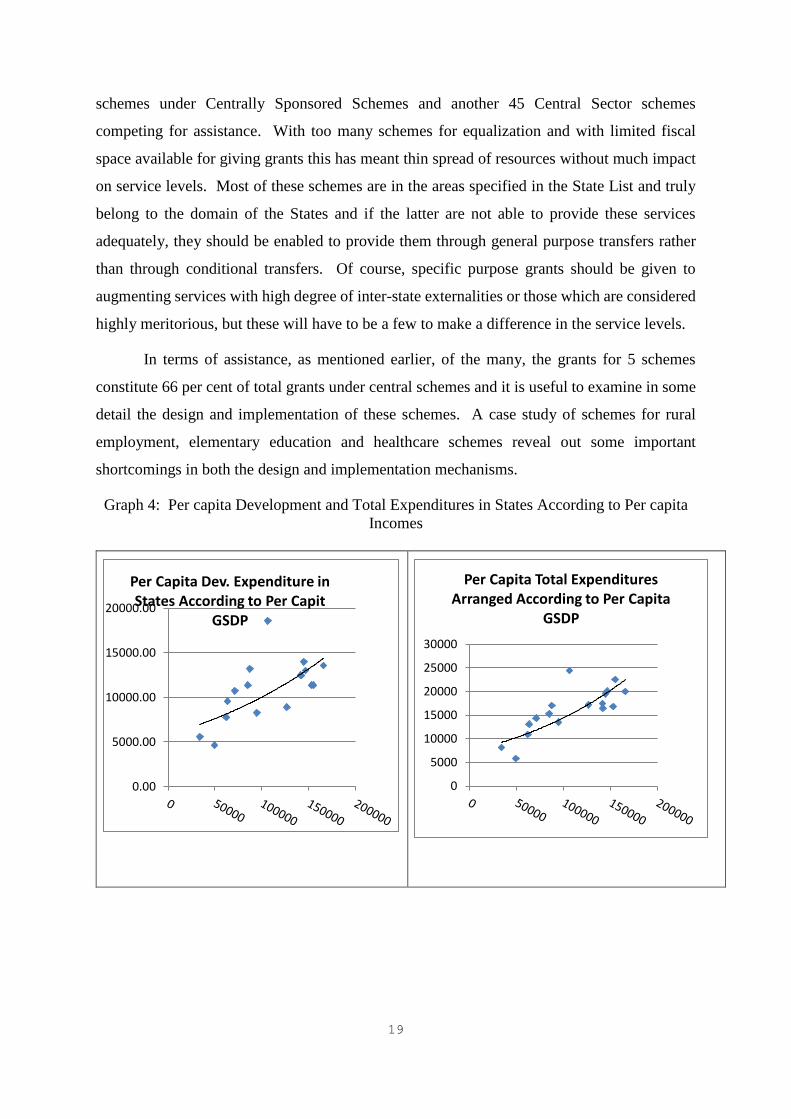
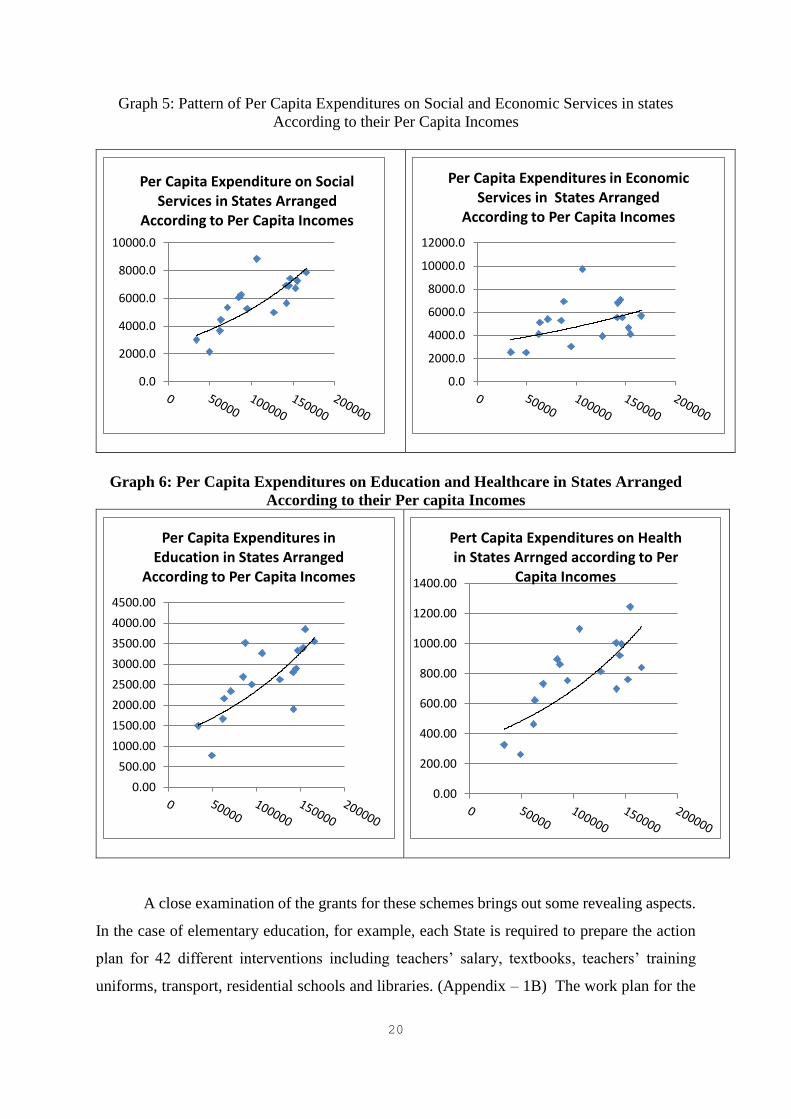
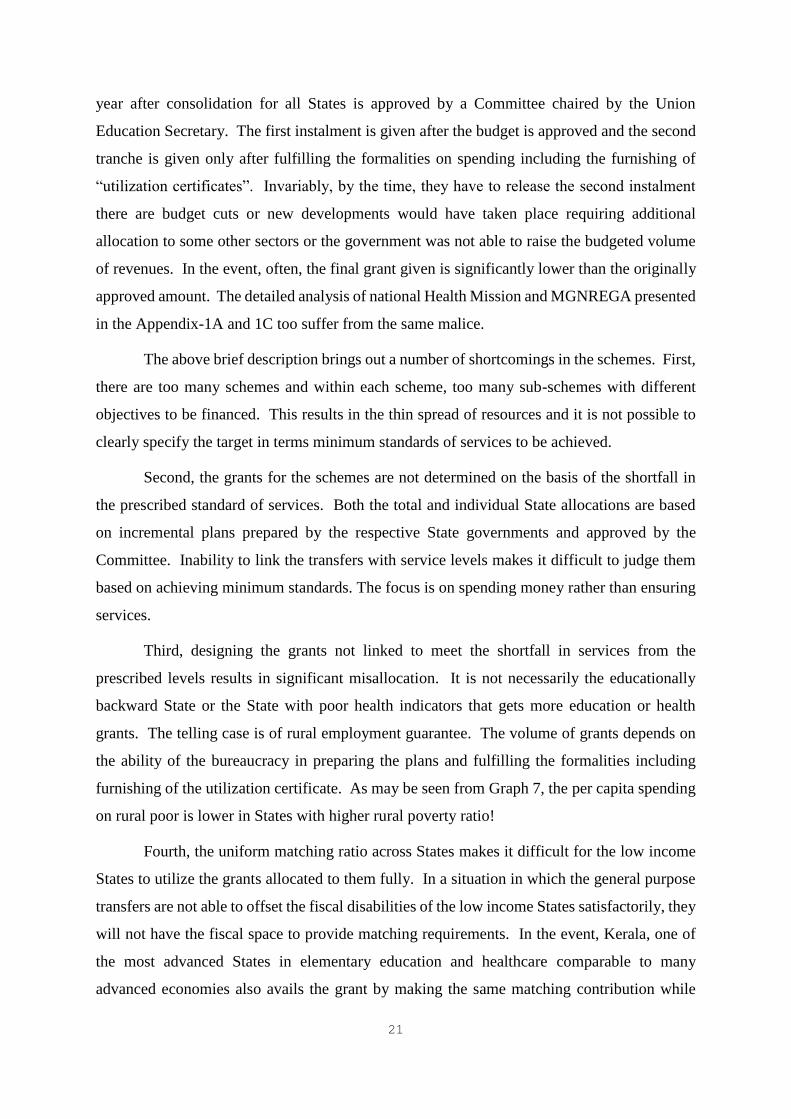
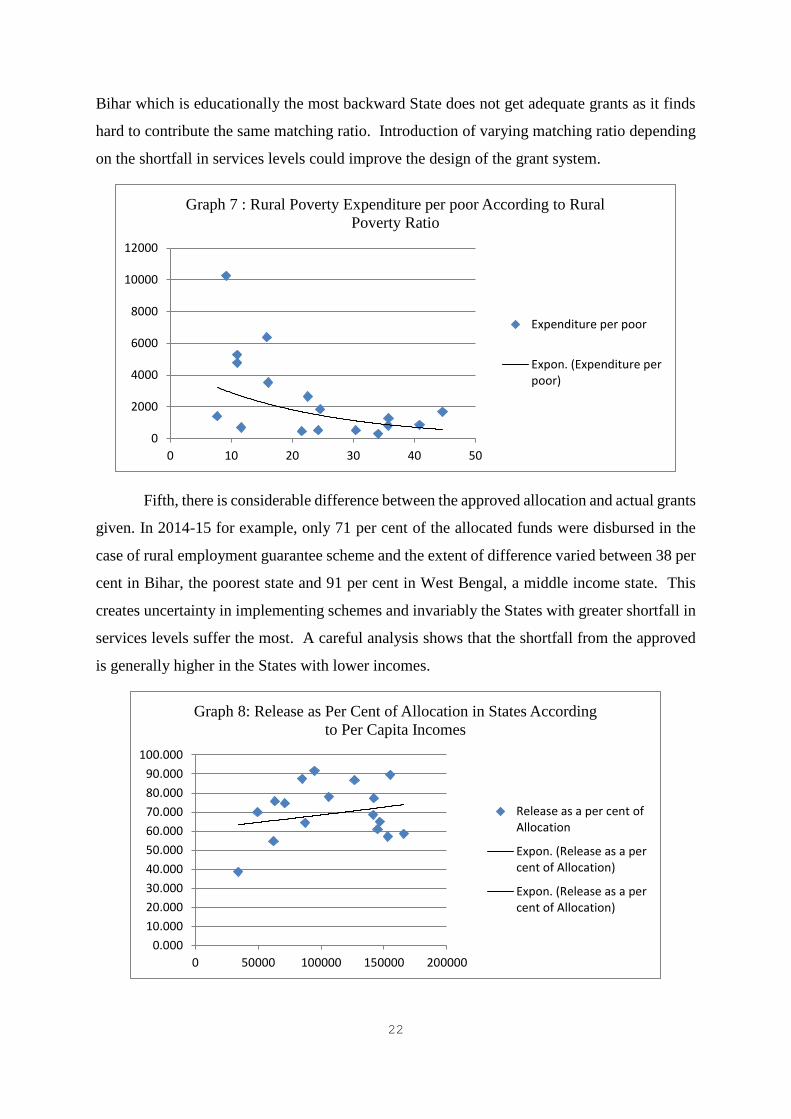
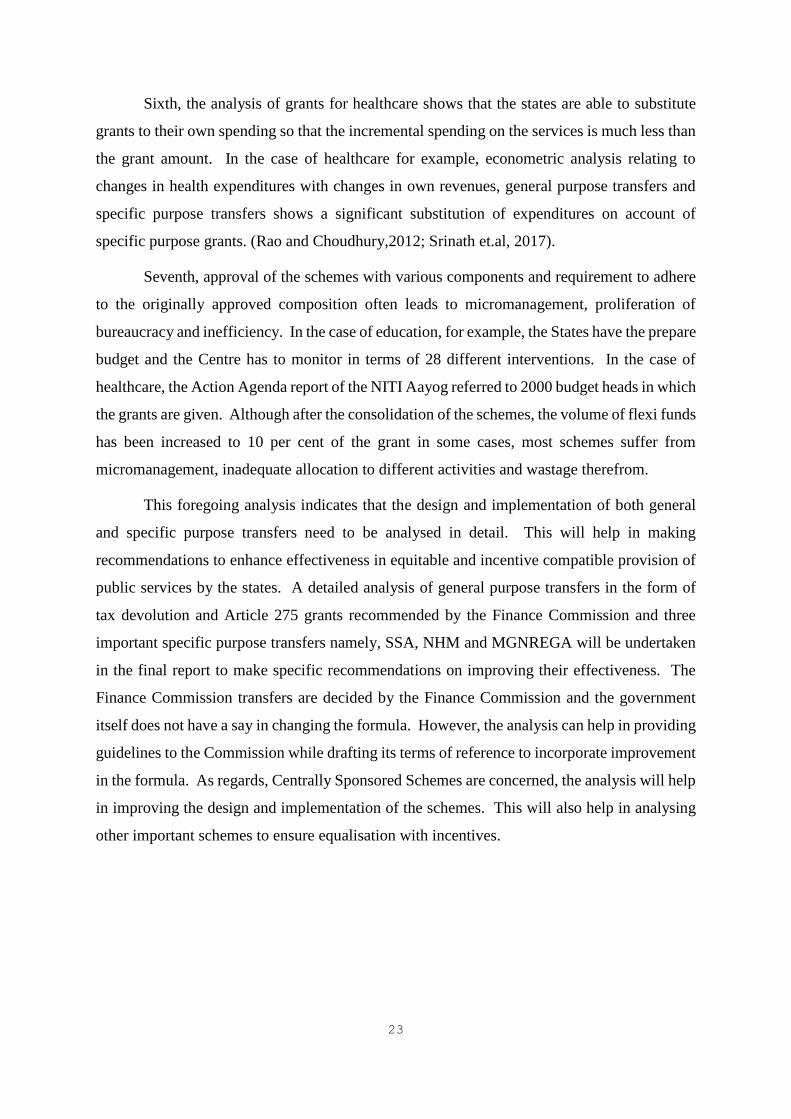


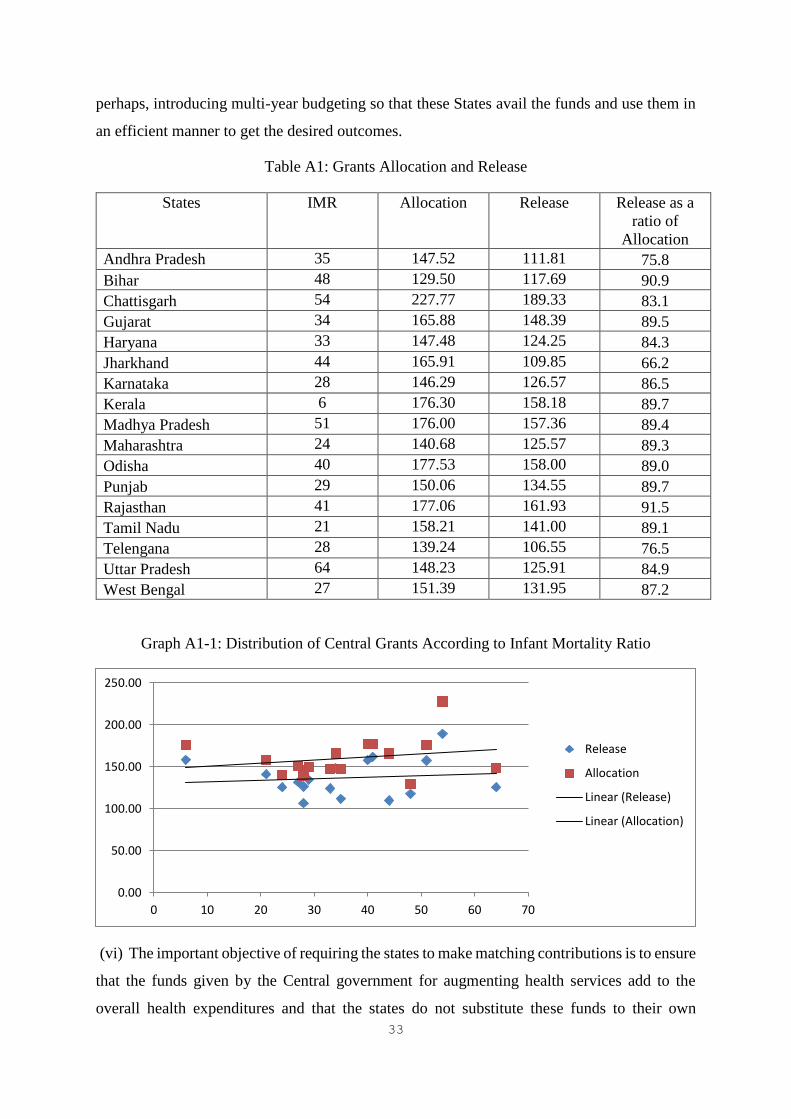
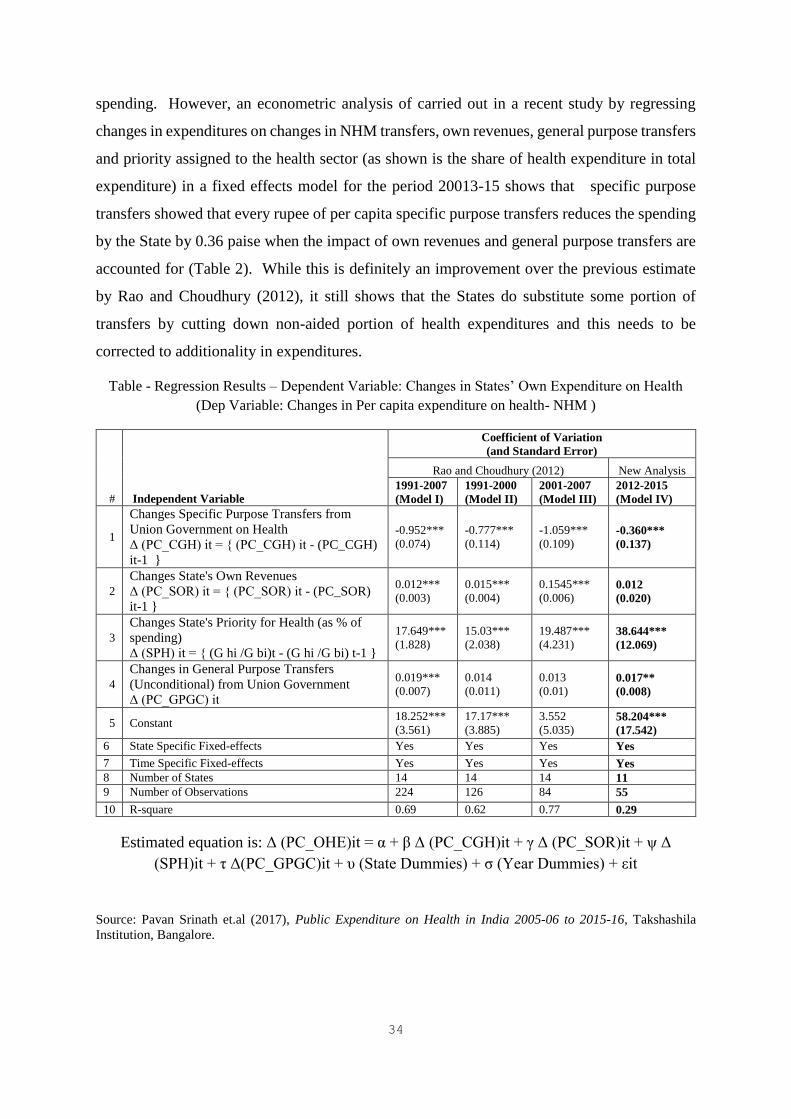

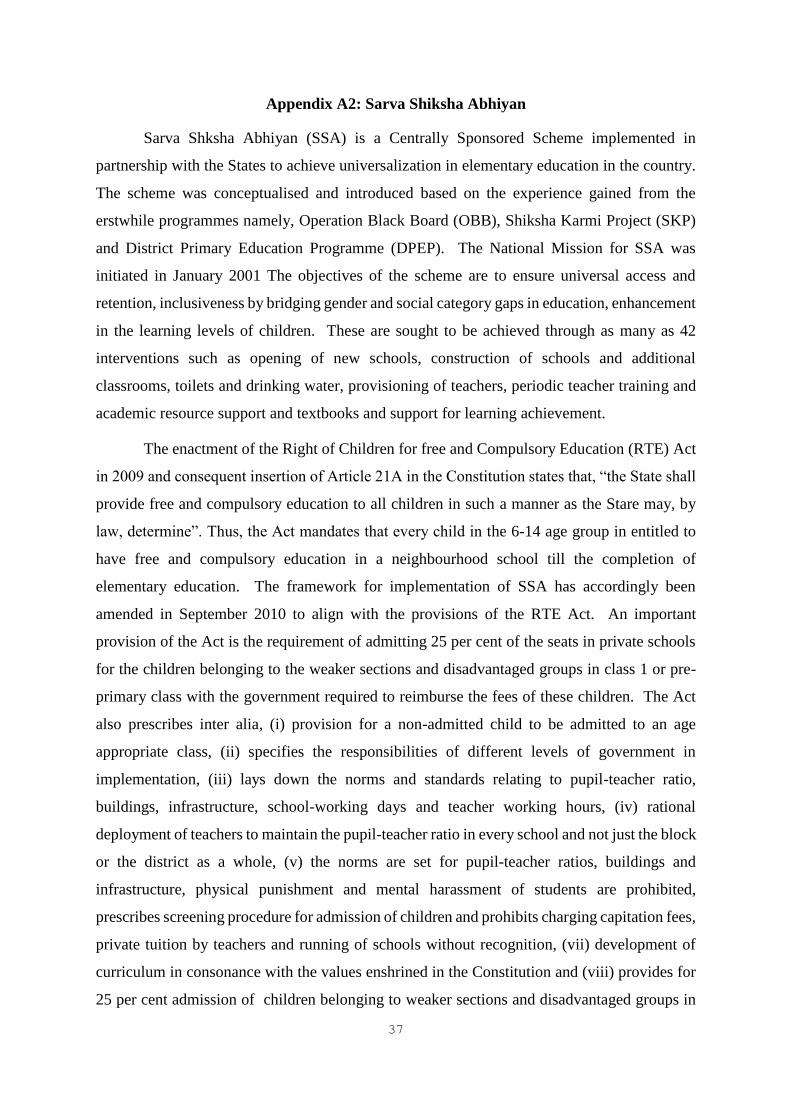


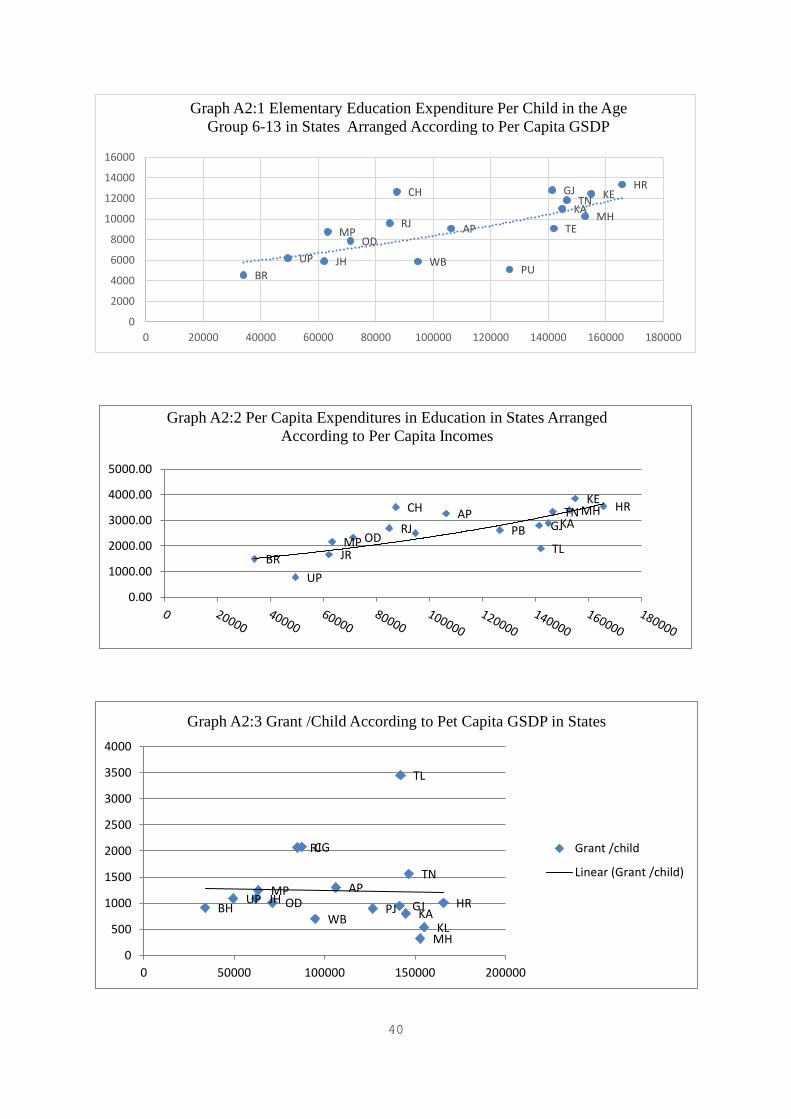
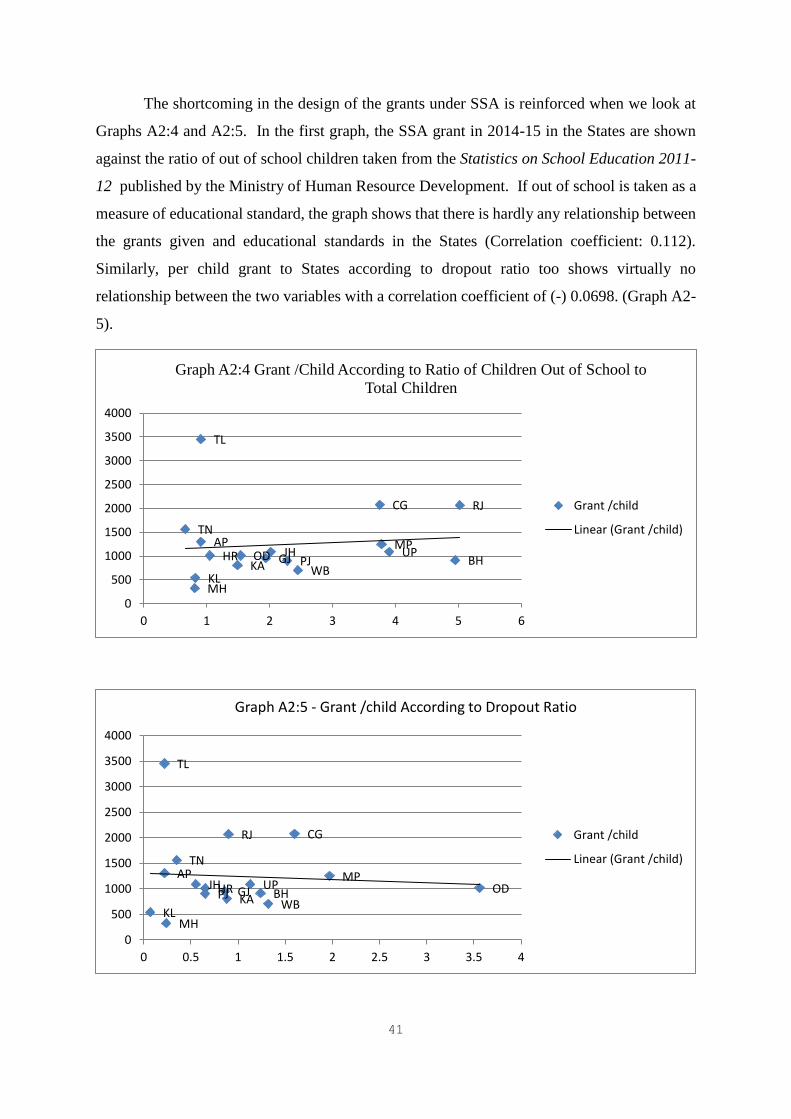


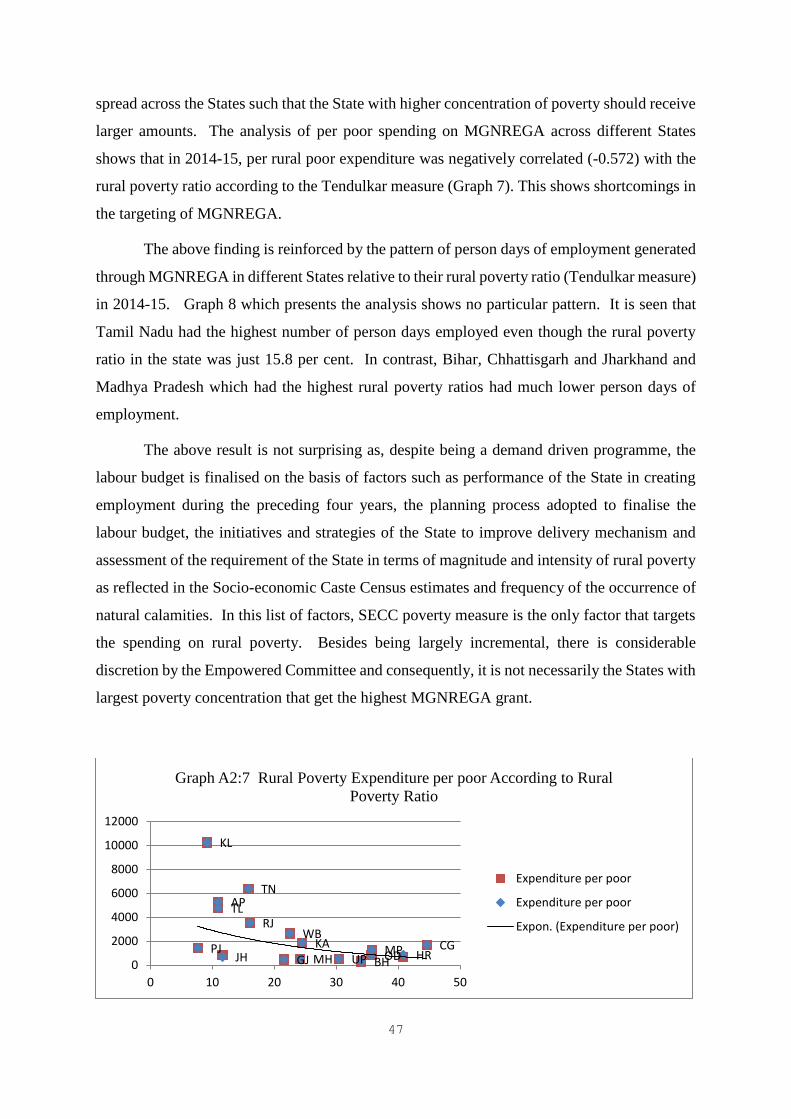

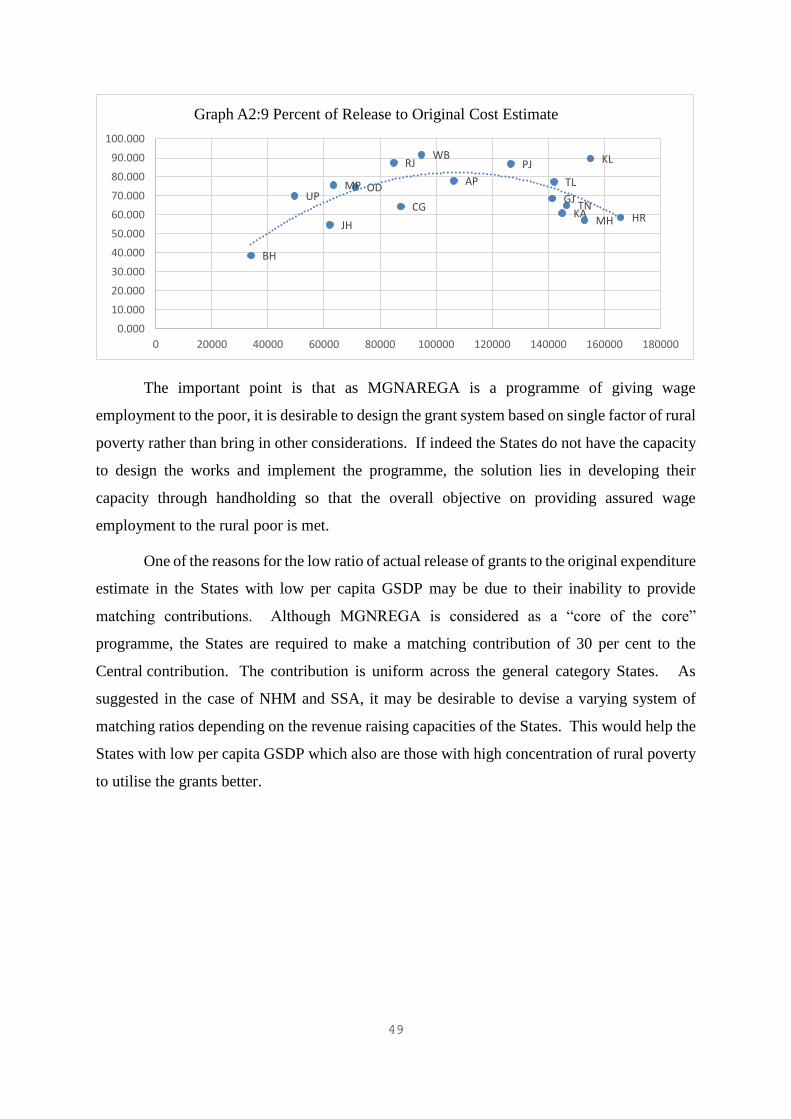


![INDEX [niti.gov.in]niti.gov.in/writereaddata/files/document_publication...INDEX 1 NITI AAYOG - AN OVERVIEW Organization Structure 2 Objectives & Functions 4 2 COOPERATIVE FEDERALISM](https://static.documents.pub/doc/80x56/5e857e6f2179c6609233d8cc/index-nitigovinnitigovinwritereaddatafilesdocumentpublication-index.jpg)


