Team ArthNITI Abhishek Mukherjee, Ajit Pai, Drashti Shah, Gaurav Sharma, Himani Sachdeva, Indrani Dasgupta, Ranbir Singh, Ranveer Nagaich, Tanushree Chandra, and Anna Roy and Alpna Jain (Edition Contributors) VOLUME EIGHT | 5 NOVEMBER 2021 SPECIAL FEATURE | NATIONAL MONETISATION PIPELINE
Transcript
1
Team ArthNITIAbhishek Mukherjee, Ajit Pai, Drashti Shah, Gaurav Sharma, Himani Sachdeva, Indrani Dasgupta, Ranbir Singh, Ranveer Nagaich, Tanushree Chandra, and Anna Roy and Alpna Jain (Edition Contributors)
VOLUME EIGHT | 5 NOVEMBER 2021
SPECIAL FEATURE | NATIONAL MONETISATION PIPELINE
3
fell to 4.3% in September 2021, lowest since April 2021. Sharply decelerating food prices have eased headline inflation closer to the midpoint of RBI’s inflation target.India sustained its pace of economic recovery in September 2021 as reflected by acceleration in manufacturing PMI at 53.7 (52.3 in August 2021) offset by a modest deceleration in services PMI at 55.2 (56.7 in August 2021). Other key high frequency indicators—power consumption, railway freight, GST collections, e-way bills, etc.—also show continued pickup in economic activity. Index of Industrial Production (IIP) witnessed growth of 11.9% y/y in August 2021 with core sector output growth of 11.6% y/y reflecting strong activity in industrial and infrastructure sectors.Trade growth is rebounding strongly, with much stronger imports than exports, reflecting India’s robust economic recovery. Higher than expected revenue trends driven by both direct and indirect taxes have provided the much-needed fiscal space for required policy action.We expect India’s real GDP growth in FY22 to exceed 10% supported by a record kharif crop and bright rabi prospects. This will boost rural demand and spur the revival in the manufacturing sector with improving capacity utilisation. Significant increase in exports will also boost economic growth and employment generation. Gradual pickup in contact-intensive services sector is further likely to support the growth momentum. India achieved the landmark milestone of administering 1 billion Covid-19 vaccine doses on 21 October. The rapid vaccination drive across the country will ensure that the risk of future wave is minimised.This edition of ArthNITI has a special feature on National Monetisation Pipeline (NMP). The pipeline has been developed by NITI Aayog, in consultation with infrastructure line ministries, with estimated aggregate monetisation potential of Rs 6.0 lakh crore of core Central government assets over a four-year period (FY22 to FY25). The strategic objective of the programme is to unlock the value of investments in brownfield public sector assets by tapping institutional and long-term patient capital, which can thereafter be leveraged for further public investments.I look forward to your feedback on this edition.
FROM THE VICE CHAIRMAN’S DESKThe global economy is on the recovery path with projected growth of 5.9% in 2021, as per latest projections by the International Monetary Fund (October 2021). The real GDP of advanced economies is projected to expand by 5.2% whereas emerging market and developing economies are expected to grow by 6.4%. The US and China are expected to grow 6.0% and 8.0% respectively in 2021 with downward revision of 1.0 and 0.1 percentage points vis-à-vis July forecast. Notably, India’s GDP growth projection at 9.5% for FY22 was unchanged reflecting a sustained pace of recovery. My hope is that the Indian economic growth in FY22 will beat this estimate.Revival in growth is diverging across countries due to variation in pandemic-induced disruptions and the extent of policy support. As a result of fiscal response to Covid-19, global debt jumped to a new high of USD 226 trillion in 2020, with annual increase of USD 27 trillion (largest annual increase on record). Advanced economies and China contributed more than 90% to the accumulation of worldwide debt in 2020.Global economic recovery continued in the September 2021 quarter with indicators suggesting sustained but modest improvement in the pace of recovery. Global Purchasing Managers’ Index (PMI) composite at 53.0 recorded faster expansion in September 2021 (vs 52.5 in August 2021) with manufacturing PMI holding steady at 54.1 and services PMI rising to 53.4 (vs 52.8 in August 2021). Global trade is rebounding faster than global economic growth despite constraints in shipping and logistics. World trade of goods and services (in volume terms) is expected to grow 9.7% in 2021 and will be higher in value terms due to elevated commodity prices.Inflation is emerging as a key risk to sustainable global economic recovery with supply chain constraints and rising energy prices. Crude oil (brent) price at above USD 85 per barrel (October 2021) has risen over 60% in 2021 despite the decision by OPEC plus (July 2021 21) to boost output till April 2022. The World Bank (October 2021) forecasts that energy prices are expected to average more than 80% higher in 2021 y/y and will remain elevated in 2022, adding to global inflationary pressure and potentially shifting economic growth to energy-exporting countries from energy-importing ones.As regards the Indian economy, real GDP growth accelerated to 20.1% in Q1FY22 y/y. The RBI in its monetary policy review (October 2021) kept India’s growth projection for FY22 unchanged at 9.5% (7.9% in Q2FY22; 6.8% in Q3FY22 and 6.1% in Q4FY22). Retail inflation based on Consumer Price Index (CPI)
Dr Rajiv Kumar,November 2021,
New Delhi
4
Data as of 30th Sep 2021Commodity Price ($) Price (INR)
Source: $ Prices from World Bank Commodity Prices Pink Sheet. London Metal Exchange. Rs. Prices from MCX, CEIC. ^NMDC/CIL Price (excl taxes etc).
Source: Yahoo Finance. % change from last year in brackets.
G20: The Macro SceneReal Sector
% Share of World GDP, 2020
GDP Per Capita ($), 2020
Quarterly GDP Growth (%)*
Inflation (y/y, %)*
Industrial Output Growth (y/y, %)*
Manufacturing (%) of GDP^, 2020
Manufacturing PMI*
United States 24.7 63,544 12.6 Jun 5.3 Sep 4.5 Aug 10.9 60.7 SepChina 17.4 10,500 4 Jun 0.7 Sep 5.3 Aug 26.2 50.0 SepJapan 5.8 40,113 7.1 Jun 0.2 Sep 8.8 Aug 20.7 51.5 SepGermany 4.5 45,724 9.8 Jun 4.1 Sep 5.4 Aug 17.8 58.4 SepUnited Kingdom 3.2 40,285 22.5 Jun 3.1 Sep 6.7 Aug 8.4 57.1 SepIndia 3.1 1,901 20.1 Jun 4.4 Sep 11.9 Aug 13.0 53.7 SepFrance 3.1 38,625 19.1 Jun 2.2 Sep 7.8 Aug 9.3 55.0 SepItaly 2.2 31,676 18.0 Jun 2.5 Sep 3.1 Aug 14.9 59.7 SepCanada 1.9 43,242 11.6 Jun 4.4 Sep - 10.6 57.0 SepKorea 1.9 31,489 6.0 Jun 2.5 Sep 9.6 Aug 24.9 52.4 SepRussia 1.8 10,127 10.5 Jun 7.4 Sep 4.7 Aug 13.3 49.8 SepBrazil 1.7 6,797 12.4 Jun 10.3 Sep -0.6 Aug 9.8 54.4 SepAustralia 1.6 51,812 9.7 Jun 3.8 Jun 0.8 Jun 5.7 56.8 SepMexico 1.3 8,347 19.6 Jun 6.0 Sep 5.5 Aug 17.2 48.6 SepIndonesia 1.2 3,870 7.2 Jun 1.6 Sep - 19.9 52.2 SepTurkey 0.9 8,538 21.7 Jun 19.6 Sep 19.9 Aug 18.8 52.5 SepSaudi Arabia 0.8 20,110 1.8 Jun 0.6 Sep 5.6 Aug 13.0 58.6 SepArgentina 0.5 8,442 17.9 Jun 52.5 Sep 13.8 Aug 13.9 -South Africa 0.4 5,091 19.2 Jun 5.0 Sep 1.8 Aug 11.5 50.7 SepEuropean Union 17.9 33,928 14.0 Jun 3.6 Sep 5.3 Aug 13.9 58.3 SepSource: CEIC, World Bank, * Calendar Year 2021. ^Japan (2018) & US (2019) values. PMI below 50: contraction; above 50: expansion. For KSA & RSA, PMI reported for whole economy. No new industrial production releases from Indonesia & Canada since March 2020.
Financial and External SectorsInterest Rates External Sector^
10Y Bond
Bank Lending Rate
(% of GDP, 2020)LCU/$* (%,y/y)
Current Account Trade Exports Imports Inward Revenue
MarketsFuelled by successful vaccine rollouts, major fiscal support, huge accumulated savings and pent-up demand waiting to be released, global financial markets got off to a strong start in the third quarter of 2021. However, continued concerns about persistent inflation, supply chain disruptions, an unfolding global energy crisis and potential fiscal policy changes caused a turbulent September, potentially offsetting the gains made in July and August and setting a low base for October.
India Nifty 50 128.6 US S&P 500 112.9
Germany DAX 112.7 Japan TOPIX 500 111.5
UK FTSE 100 109.4 China HIS 300 94.7
Source: CEIC
After a long stretch of gains for the US stock market in 2021, mounting investor anxiety finally came to a head in September, forcing all three major indices lower. The S&P 500 tumbled to 4.8% in September, its largest monthly decline since March 2020, when the Covid-19 pandemic spurred a selloff. The Dow Jones Industrial Average slid 4.3% for September, while the Nasdaq fell 5.3%. Falling sentiment was driven by the Fed’s signal that tapering of bond purchases could begin this year and rate hikes may begin in 2022 earlier than had been previously predicted. The negative sentiment was also headlined by systemic risk from China’s Evergrande crisis and its potential impact on the broader real estate market. Evergrande—China’s largest real estate developer—had over $300 billion of total debt exposure. The Chinese government has also
T H E B I G P I C T U R E1been reinforcing state power through broad regulatory reforms, raising concerns that it may lead to wider economic damage. Additionally, China is facing a power crunch that is impacting factories and homes. The shortage is darkening economic growth forecasts and roiling global commodity markets. US stocks regained momentum in October as strong corporate earnings, a rally in technology stocks, and a Senate agreement to temporarily extend the debt ceiling bolstered the mood on Wall Street. In contrast, the UK’s FTSE 100 slipped in October while stock markets in France, Italy and Spain fell further as investors trimmed their holdings of luxury goods businesses that benefit from Chinese demand.Chinese equities struggled throughout September and dragged emerging market equities down over the quarter, despite some markets, such as India, continuing to perform well. In the third week of October, tech stocks climbed in Asia, following US peers, while Chinese property stocks rallied following a surprise interest payment by the Evergrande Group. At the other end, energy shares were the biggest drag on indices from Tokyo and Sydney to Hong Kong and Shanghai. Chinese coal prices continued to dive after the government said it would intervene to cool prices to help electricity producers out of a widespread power crunch.Following the Fed’s indication of monetary policy tightening at the Federal Open Market Committee (FOMC) meeting, the dollar index strengthened and skyrocketed to a one-year high towards the end of September 2021. The index measures the US currency’s strength or weakness against a basket of six major currencies. Global uncertainty, fading growth momentum and rising US bond yields are some of the other factors behind the dollar’s strength. It is important to note that a strengthened dollar could weigh on emerging market currencies by triggering massive outflows. In line with this, in the first week of October, the RBI signalled the beginning of the normalisation process, causing the benchmark 10-year government bond yield to rise to the highest in over a year (6.3%), while the rupee fell to a six-month low (breaching the 75 mark against the dollar). Other factors contributing to the rise in bond yields in India are the rising oil prices and US treasury yields.Supply shortages have caused a rapid surge in commodity prices. Brent crude, the international oil benchmark, has risen almost 40% since the beginning of January while copper, iron ore, palladium and timber have all hit record highs this year. According to the Food and Agriculture Organisation, food prices are at
6
almost a decade high. Key agricultural commodities, including grains, oilseeds, sugar and dairy, have also seen a jump in prices—and, with them, the prices of related exchange traded funds.
Global Economy Recovers at Weakened Momentum Following a sharp contraction of 3.1% in 2020, the global economy is expected to grow at 5.9% in 2021 and 4.9% in 2022 as per the October 2021 World Economic Outlook by the International Monetary Fund (IMF). Compared to the IMF’s July forecast, the global growth projection for 2021 has been revised down marginally; however, it veils large downgrades for some countries. The forecast for the low-income developing country group has weakened considerably due to deteriorating pandemic dynamics while supply disruptions have darkened near-term prospects for the advanced economy group. This has been partially offset by improved projections for some commodity exporters on the back of rising commodity prices.
Figure 1: GDP Growth Projections
Source: IMF
The IMF also highlighted that economic prospects for countries continue to exhibit a sharp divergence, driven by the “great vaccine divide” and large disparities in policy support. Almost 60% of the population in advanced economies are fully vaccinated and some are now receiving booster shots, while about 96% of the population in low-income countries remain unvaccinated. In addition, several emerging markets
and developing economies are withdrawing policy support despite larger shortfalls in output in the face of tighter financing conditions and a greater risk of de-anchoring inflation expectations.In October 2021, the total number of Covid-19 deaths worldwide rose close to the grim milestone of 5 million. In most countries, pandemic-driven disruptions to contact-intensive sectors have caused the labour market recovery to significantly lag the output recovery. According to the International Labour Organisation (ILO), following the loss of 114 million jobs in 2020, global employment is projected to increase by 100 million in 2021 and a further 80 million in 2022. However, the catch-up in employment growth would still be insufficient to match the growth of the working-age population between 2019 and 2022. Relative to 2019, the pandemic-induced global shortfall in jobs is estimated at 75 million for 2021 and 23 million in 2022.Energy prices soared in the third quarter of 2021 and are expected to remain elevated in 2022, according to the World Bank’s October Commodity Markets Outlook. This would add to global inflationary pressures and potentially shift economic growth to energy-exporting countries from energy-importing ones. From $70.0 per barrel in August 2021, the price of brent crude increased by 6.5% to $74.6 per barrel in September 2021. Elevated natural gas and coal prices are impacting the production of other commodities and pose an upside risk to price forecasts. The production of some metals such as aluminium and zinc has been reduced due to high energy costs as well, thereby pushing their price upwards.
Figure 2: Global Commodity Prices
Source: World Bank
The global economy expanded for the fifteenth straight month in September 2021, as indicated by the JPMorgan Global PMI. The rate of expansion improved slightly
T H E B I G P I C T U R E1
7
from August and saw the first uptick in four months, but remained the second lowest since January 2021. Both manufacturing and service sectors contributed to the slight improvement, although output growth for the manufacturing sector remained the second weakest since recovery commenced in July 2020. Persisting Covid-19 Delta variant issues continued to affect demand, particularly in the service sector. Meanwhile, supply bottlenecks, across both input and labour, were exacerbated by the latest Delta wave.
Figure 3: Global PMI
Source: IHS Markit
The resurgence of global economic activity in the first half of 2021 lifted merchandise trade above its pre-pandemic peak. The World Trade Organisation (WTO), in its October 2021 update, forecasts global merchandise trade volume growth of 10.8% in 2021—up from 8.0% forecasted in March—followed by a 4.7% rise in 2022. The WTO also pointed out that supply-side issues such as semiconductor scarcity and port backlogs may strain supply chains and weigh on trade in particular areas, but are unlikely to have large impact on global aggregates.According to the IMF’s October 2021 Fiscal Monitor, global general government fiscal deficit in 2021 continues to be large by pre-pandemic standards (at 7.9% of GDP), although it has begun to decline and is expected to contract more in 2022 (5.2% of GDP). Global government debt has stabilized at just below 100% of GDP; however, there is significant variation underneath the aggregate figures in fiscal and economic developments across countries, both in recent months and in terms of the expectation over
the next few years. This divergence depends on local vaccination rates, the stage of the pandemic, and the ability of governments to access low-cost borrowing.The sharp difference across countries in the projected scarring from the pandemic is likely to impact income inequality and poverty, making it more difficult for countries to achieve their UN Sustainable Development Goals. Income inequality is likely to rise sharply in emerging markets and low-income developing countries, whereas in most advanced economies the increase is expected to be scaled back, albeit not fully. According to the IMF, global poverty is expected to decline in 2021, partly offsetting the large increase in 2020, but the number of people in poverty is still projected to be 65–75 million higher than pre-pandemic trends. Akin to the pandemic, climate change is another major global concern that threatens to exacerbate the economic divergences among the world’s economies. Stronger, concrete commitments are needed at the ongoing United Nations Climate Change Conference (COP26).The IMF predicts that if Covid-19 were to have a prolonged impact on the medium term, it could reduce global GDP by a cumulative $5.3 trillion over the next five years relative to the current projection. It is imperative for the global community to step up efforts to ensure equitable vaccine access for every country, sustain policy support and secure better economic prospects for all.
Indian MacroDomestic economic activity has been picking up after the Covid second wave, with the ramp up of vaccination drives, improved consumer confidence and increase in mobility across the country. Positive signs that will support India’s recovery are visible from the record kharif agricultural production and bright rabi prospects, revival in manufacturing sector with improving capacity utilisation, and robust increase in exports. Gradual pickup in the contact-intensive services sector, together with strong performance of the technology driven sectors, are likely to support the momentum.According to the release of the National Statistical Office (NSO) on 31 August 2021, real GDP in June 2021 quarter (Q1FY22) grew 20.1% y/y driven by a low base (real GDP in June 2020 quarter (Q1FY21) declined 24.4% y/y). In nominal terms, GDP grew
T H E B I G P I C T U R E1
8
T H E B I G P I C T U R E131.7% y/y in the June 2021 quarter (Q1FY22). The momentum exhibits resilience of the Indian economy in the face of the severe Covid second wave.
Purchasing Managers’ Index (PMI) depicts a 3-6-month forward trend. Manufacturing PMI (53.7 in September 2021 vs 52.3 in August 2021) reflected recovery in manufacturing sector, marking the third straight month of expansion. However, rising fuel, raw material and transportation prices have pushed up input costs. Services PMI (55.2 in September 2021 vs 56.7 in August 2021) moderated but latest reading remained above its long-term average. Loosening of Covid-19 restrictions led to greater footfall boosting sales and output.
Source: IHS Markit
According to NSO, retail inflation based on Consumer Price Index (CPI) fell to 4.3% in September 2021 from 5.3% in August 2021. It is the lowest retail inflation recorded since April 2021. Sharply decelerating food inflation helped ease headline inflation closer to the midpoint of RBI’s inflation target (4[+/-2%]). Within food prices, vegetables and cereals declined 22.5% y/y and 0.6% y/y respectively for September 2021. However, edible oil price continued to surge rising 34.1% y/y in September 2021, after an increase of 33.0% y/y in August 2021. Inflation in the fuel and light category remained elevated at 13.6% for September 2021. Core inflation (CPI inflation excluding food and fuel) moderated from a peak of 6.4% in May 2021 to 5.8% in September 2021 but still remains high.Inflation as measured by the Wholesale Price Index (WPI) stood at 10.7% y/y in September 2021, declining from a record high of 13.1% y/y in May 2021. The high rate of inflation is due to the low base effect and soaring prices of crude oil and manufactured goods. Inflation in
manufactured products, the largest component of the index rose 11.4% and fuel and power index rose 24.8% in Sept 2021 compared to a year ago. A considerable high WPI is primarily due to an increase in prices of mineral oils (51.7% y/y), crude petroleum and natural gas (43.9% y/y), non-food articles (29.3% y/y), basic metals (26.7% y/y), textiles (16.7% y/y) and chemicals and chemical products (13.1% y/y) as compared to a year ago.
Source: CSO, CEIC
Source: Ministry of Commerce and Industry, CEIC
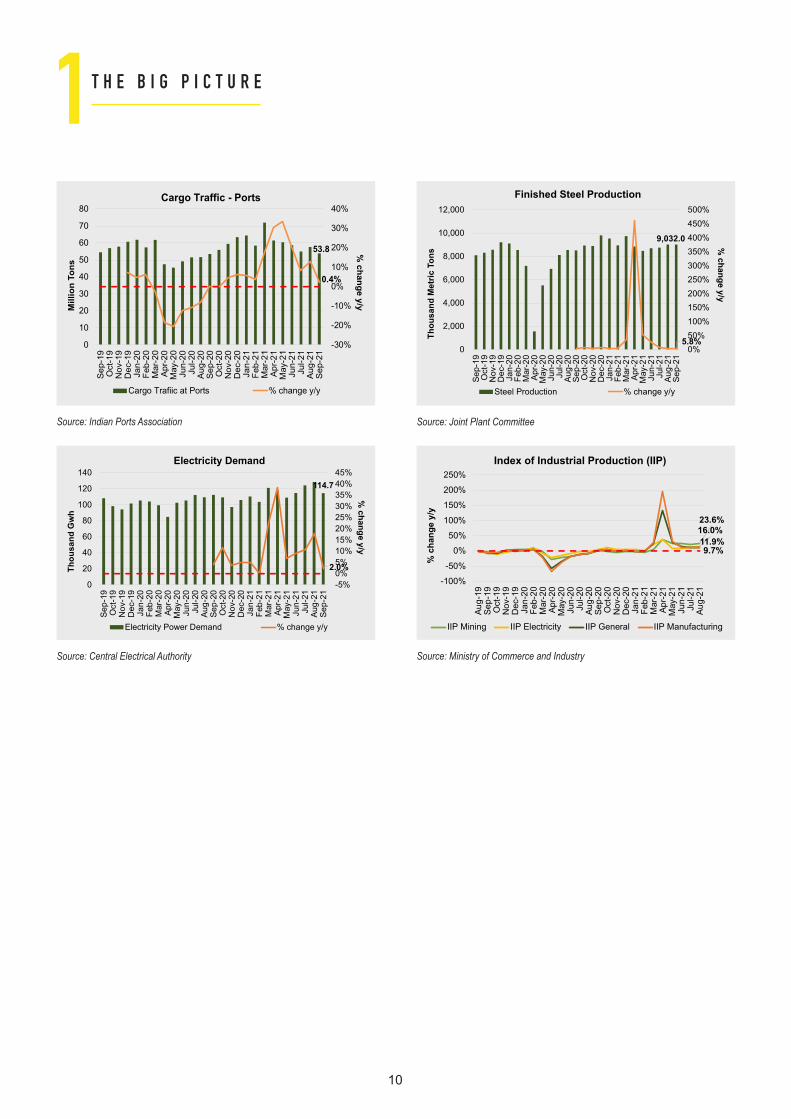
Index of Industrial Production (IIP) witnessed a growth of 11.9% y/y in August 2021. IIP growth in August 2021 was 3.9% higher as compared to the pre-pandemic level of August 2019. Mining output climbed 23.6% y/y while electricity rose 16.1 y/y in August 2021. Consumer durables output witnessed 8.0% y/y growth in August 2021, compared to a contraction of 10.2% y/y in August 2020. Consumer non-durables output rose 5.2% y/y in August 2021, compared to a contraction of 3.0% y/y in August 2020. Core sector output (IIP Core) for August
9
T H E B I G P I C T U R E12021 grew 11.6% y/y compared to 9.9% y/y in July 2021, aided by the base effect. It recorded an increase of 3.8% from the pre-covid level of August 2019. Barring fertilizers (-3.1% y/y) and crude oil (-2.3% y/y), all the other core industries reported growth in output.Even though a few high frequency indicators of economic activity have slowed down in September and early October 2021, the step up in vaccination and slump in new cases and mortality rates has rebuilt confidence. High frequency indicators like electricity demand (2.0% y/y), steel production (5.8% y/y) and railway freight (3.6% y/y) are showing a positive trend for September 2021. Other indicators like vehicle registration, passenger vehicle and two-wheeler sales showed mixed results for August and September 2021. Passenger vehicle and two-wheeler sales declined 41.2% y/y and 17.4% y/y for September 2021. Anecdotal evidence suggests that output has been impacted due to shortage of semi-conductors. Tractor sales that help to gauge rural demand recorded a decline of 9.5% y/y for September 2021. The decline comes on the back of high base of last year and a wilting pent-up demand. While tractor exports hit a historic high, domestic sales have declined. Price hikes by tractor manufacturers seem to have affected the demand. Goods and Services Tax (GST) rose 22.5% in September 2021 as compared to a year ago. Anti-evasion activities against fake billers have contributed to the enhanced GST collections. The average monthly gross GST collection for the second quarter of FY22 has been Rs 1.15 lakh crore, which is 2.5% higher than the average monthly collection of Rs 1.10 lakh crore in the first quarter of the year suggesting a recovery in the Indian economy. India has undertaken significant structural reforms to turn the crisis into an opportunity and emerge stronger. Among the most notable reforms, PLI schemes to boost manufacturing, and National Infrastructure Pipeline complemented by the National Monetisation Pipeline and PM Gati Shakti would help enhance India’s global competitiveness and set a strong foundation for sustaining India’s post Covid economic growth.However, impact of elevated commodity prices, power and coal shortage, global shipping crisis and high logistics cost, potential global financial markets volatility, and a resurgence in Covid-19 infections impart downside risks to the global growth outlook. Overall, India’s recovery has been robust and resilient with government’s efforts focused on having economic growth that is sustainable.
India’s High Frequency Indicators
Source: Society of Indian Automobile Manufacturers
Source: Society of Indian Automobile Manufacturers
Source: Tractor Manufacturer Association
Source: Ministry of Railways
10
T H E B I G P I C T U R E1
Source: Indian Ports Association
Source: Central Electrical Authority
Source: Joint Plant Committee
Source: Ministry of Commerce and Industry
11
C R E D I T2
12
C R E D I T2
13
Maharashtra
Source: MoSPI
Source: MoSPI, FY-20
Source: Census-2011
Source: MoSPI, FY-20
Source: Census, 2011 Source: Indian State of Forest Report, 2019
in R
s.
Rs.
Cro
re
Maharashtra is the third largest state of the country in geographical spread and second largest in terms of population as per 2011 Census. Flanked by a 720-km-long coastline along the Arabian Sea and Sahyadri and Satpura mountain ranges, it has a diverse natural terrain. There are 36 districts and six revenue divisions. It is one of the highly urbanized states of India.
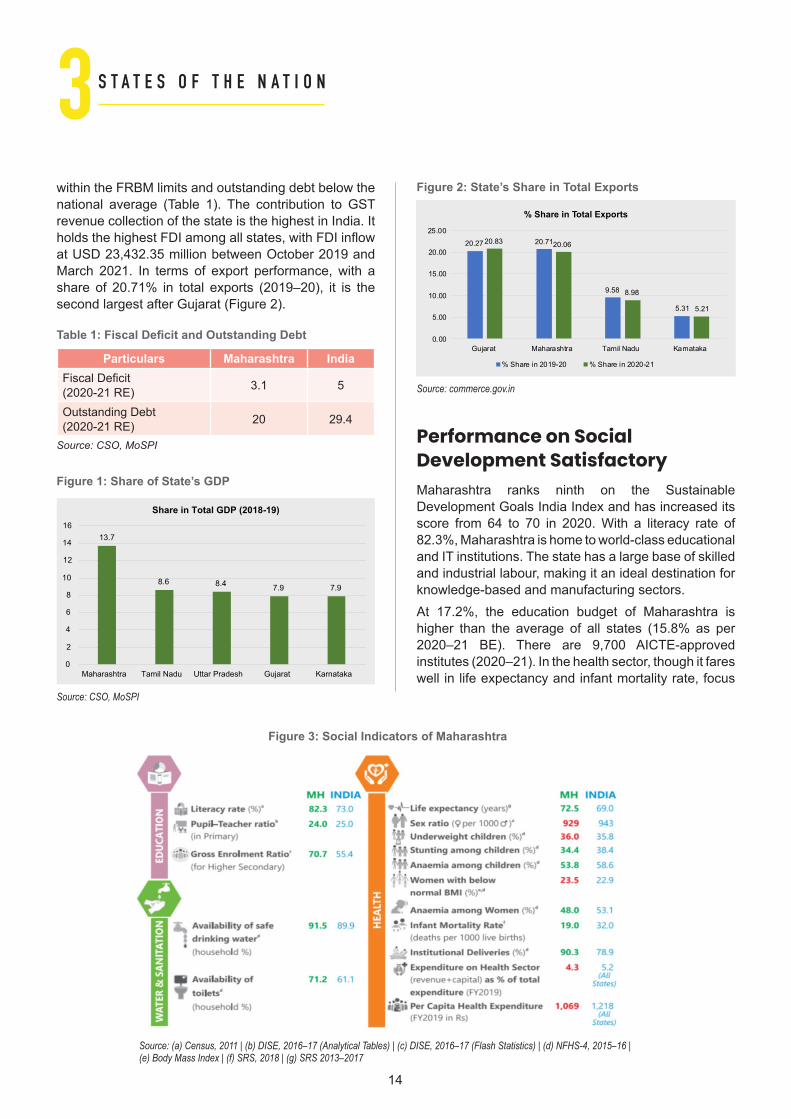
The Economic PowerhouseMaharashtra accounts for the highest share in the total GDP of India—13.7%, as shown in Figure 1. While the service sector accounts for 60% of the GSVA (2019–20), the agriculture sector continues to support 48% of the workforce. Maharashtra’s fiscal deficit is well
S T A T E S O F T H E N A T I O N3
14
within the FRBM limits and outstanding debt below the national average (Table 1). The contribution to GST revenue collection of the state is the highest in India. It holds the highest FDI among all states, with FDI inflow at USD 23,432.35 million between October 2019 and March 2021. In terms of export performance, with a share of 20.71% in total exports (2019–20), it is the second largest after Gujarat (Figure 2).
Performance on Social Development SatisfactoryMaharashtra ranks ninth on the Sustainable Development Goals India Index and has increased its score from 64 to 70 in 2020. With a literacy rate of 82.3%, Maharashtra is home to world-class educational and IT institutions. The state has a large base of skilled and industrial labour, making it an ideal destination for knowledge-based and manufacturing sectors.At 17.2%, the education budget of Maharashtra is higher than the average of all states (15.8% as per 2020–21 BE). There are 9,700 AICTE-approved institutes (2020–21). In the health sector, though it fares well in life expectancy and infant mortality rate, focus
needs to be on improving child nutrition and combating anaemia in women and children. The health sector can be strengthened by increasing expenditure and filling up the shortfall in the workforce. The social indicators of the state in comparison with India is shown in Figure 3. Maharashtra performed better than India in almost all the indicators, except ‘Underweight’, ‘Stunting’ and ‘Health Expenditure’.
Agriculture and Allied Activities Need FocusAlthough Maharashtra is a highly industrialized state, agriculture continues to be the main source of livelihood for a major section of the population. Since most of the cultivable land is still rain-fed, the southwest monsoon season between June and September is critical to food sufficiency and the quality of life in the state. Principal crops grown are rice, jowar, bajra, wheat, tur, mung, urad, gram and other pulses. The state is a major producer of oilseeds: groundnut, sunflower, and soybean. The important cash crops are cotton, sugarcane and turmeric. Maharashtra is a pioneer in onion production and is emerging as an important horticultural hub of the country.However, the performance of agriculture in the last decade has been below the national average and shows fluctuating growth, as shown in Figure 4. It fairs poorly on various agriculture parameters when compared to an all-India level (Table 2). It also shows lower land and labour productivity (Table 3). Cropping pattern has also witnessed a change and there is a lot of scope for capitalizing on millets. Across districts, it has been found that there is difference in agriculture productivity as the inter-district disparity is 1:7.There is a need for a multipronged strategy centred around water management and the use of modern technology.
Particulars Maharashtra India
Average Land holding size (2015-16) in ha 1.35 1.08
Source: LUS, Directory of Directorate of Economics and Statistics
Figure 4: Economy and Agriculture Growth Rates
Source: CSO, MoSPI
Table 3: Agriculture Land and Labour Productivity
Particulars Maharashtra IndiaAgri Land Productivity (Growth % from 2011-12 to 2018-19)
2.52 3.31
Agri Labour Productivity (Growth % from 2011-12 to 2018-19)
3.18 4.90
Source: LUS, Directory of Directorate of Economics and Statistics
S T A T E S O F T H E N A T I O N3
16
IndustryMaharashtra has maintained its position as the most industrialized state of India. It has been a pioneer in small scale industries and boasts of the largest number of special export promotion zones. The state maintained a higher growth rate for years; however, the 0.2 growth rate in 2019–20, which is pre-pandemic, is a matter of concern (Figure 5). The important industries in the state are cotton textiles, chemicals, machinery, electricals, transport, and metallurgy. Maharashtra contributes about 10.4% to India’s textiles and apparels output and about 25% to India’s cotton production. The textile industry is the largest employer in Maharashtra and contributes around 28% to India’s total exports. With initiatives like Magnetic Maharashtra 2.0 and reforms such as Plug and Play Infrastructure, Maha Jobs, Maha Parwana, Investor First Programme and Dedicated Country Desks, Maharashtra is poised to attract more investments in the state. Maharashtra Industrial Development Corporation (MIDC) has been at the forefront of driving policy interventions to improve the manufacturing space in the state. Maha Parwana—a mega single-permission system—is used to fast-track industrial permissions as quickly as 48 hours, and Maha Jobs—a portal to connect job seekers with entrepreneurs—is another initiative in this regard.Maharashtra has taken a proactive initiative towards green development by unveiling a progressive and comprehensive policy in 2021 to accelerate both the adoption of electric vehicles (EVs) in the state as well as making Maharashtra a leading manufacturing and investment hub for the EV ecosystem globally. The overarching aim is for EVs to contribute to 10% of new vehicle registrations—or 3,00,000 EVs—a year by 2025.Since Maharashtra has the highest number of registered MSMEs (Figure 6), it can develop a targeted plan to promote market access, trade facilitation, technology upgradation and credit facilitation. To further leapfrog in the manufacturing sector, Maharashtra can leverage the Production-Linked Incentive (PLI) scheme by identifying the beneficiaries of PLI, hand-hold them with ease of regulations, speedy approvals, providing electricity and other factors of production at competitive rates.Over the years, Maharashtra has fallen in the ease of doing business index, from the eight position in 2013 to the thirteenth position in 2019. Currently, it features in the list of states with the most complex compliance regimes for businesses—top 10 in filing requirements,
topmost in compliances required and top 5 in complex Acts and Rules. There is a need to streamline the compliance regime and reduce the burden through a detailed action plan.
Fig 5: Industry growth rates
Fig 6: Number of MSMEs registered
Source: CSO, MoSPI Source: Udyam Registration Data
Financial Hub of IndiaThe state’s capital Mumbai is the commercial capital of India and has evolved into a global financial hub. The city is home to several global banking and financial service providers. Mumbai houses a majority of headquarters of large corporate and financial institutions in the country. In addition, major stock exchanges, commodity exchanges and capital markets of India are located in Mumbai. The number of
S T A T E S O F T H E N A T I O N3
17
companies listed on the NSE has increased from 135 in 1995 to 1,913 by December 2020.The market capitalisation of the BSE increased from USD 1173.17 billion in FY13 to USD 2814.55 billion in FY21, and for NSE it increased from USD 1271.43 billion in FY13 to 1986.87 billion in FY21. The government has completed the master planning of the Delhi–Mumbai Industrial Corridor (DMIC) and the preliminary engineering of Phase-I has been undertaken. Aurangabad Industrial City (AURIC) is being developed on a 10,000-acre land as a well-planned and greenfield smart industrial city, and as a part of DMIC. Preliminary work is in progress for the Mumbai Trans-Harbour link and Multi-Modal Corridor from Virar to Alibaug.
Major Tourist DestinationWith a diverse geographical terrain, rich heritage and economic advancements, Maharashtra has emerged as a major trade and tourist destination of India. It is the fourth most visited state of India. There are many temples in Maharashtra, some of them being hundreds of years old, constructed in a fusion of architectural styles borrowed from north and south India. The state is home to Bollywood, which produces the largest number of films globally. Maharashtra has a score of pilgrimage destinations, ranging from the ones that revolve around mythology (e.g., Nasik, Warkar and Pune) to those celebrating the achievements of religious leaders and reformers (Shirdi, Haji Ali shrine)
S T A T E S O F T H E N A T I O N3to new-age pilgrimage destinations such as the Osho Commune at Pune. The Government of Maharashtra introduced an agro-tourism policy in 2020, which is aimed at empowering farmers. Through this policy, it aims at improving rural employment, especially for the women and youth. The policy will also give the required boost to folk and traditional arts, as it will allow tourists to experience rural environs up close.
Facilitating InfrastructureThe state has well-developed social, physical and industrial infrastructure. Apart from two international and eight domestic airports, the state has two major and 48 minor ports. It also has a well-developed power supply grid. Maharashtra’s infrastructure sector has grown significantly over the last decade, with a substantial rise in the number of industrial clusters and Public Private Partnership (PPP) projects. However, PPP projects are lacking in social infrastructure. Maharashtra can aggressively identify new PPP projects in the social sectors, including the health sector, and effectively leverage the revamped Viability Gap Funding (VGF) scheme of GoI. The Government of India has recently launched the National Monetisation Pipeline as a guidebook and roadmap for monetisation. The state may take advantage of this by setting up a dedicated Asset Monetisation Cell and create a three-to-four-year-long monetisation pipeline of assets for increasing investments in infrastructure.
18
P O L I C Y A N D P R O G R A M M E4National Monetisation PipelineInfrastructure: An enabler of growthInfrastructure is inextricably linked to growth by its inherent ability to support livelihoods, drive businesses, generate employment and, in effect, determine the quality of life. Investment in infrastructure is hence pivotal for accelerated and inclusive socio-economic development of a country.
Figure 1: Infrastructure Vision 2025 (NIP)
To bridge the existing infrastructure gap and cater to the future potential, India’s National Infrastructure Pipeline (‘NIP’) envisages an investment of Rs 111 lakh crore over a five-year period (FY 2020-25).Investment into creating world-class infrastructure hinges on availability of long-term capital at scale. Financing of infrastructure investments at the scale envisaged under NIP necessitates a re-imagined approach, and looking beyond the traditional sources or models of financing. This is why NIP emphasized on innovative mechanisms–such as asset monetisation–for generating additional capital. A sizeable inventory of infrastructure assets has been created over the past decade through public investments, which can now be leveraged for tapping private sector investment and efficiencies. The need for adoption of such alternative mechanisms has only been further pronounced in the wake of Covid-19.
Asset Monetisation: The ConceptAsset monetisation, also commonly referred to as asset or capital recycling, is globally a widely used
business practice. It consists of limited period transfer of performing assets (or disposing of non-strategic / underperforming assets) to unlock “idle” capital and reinvesting it in other assets or projects that deliver improved or additional benefits. Governments and public-sector organizations, which own and operate such assets and are primarily responsible for delivering infrastructure services, can adopt this concept to meet the ever-increasing needs of the population for improved quality of public assets and services.Asset monetisation can be undertaken through a range of instruments/tools broadly categorized into two approaches: (i) Direct Contractual Approach such as PPP Concessions, and (ii) Structured Financing models such as Infrastructure Investment Trust (InvIT), Real Estate Investment Trust (REIT).
Asset Monetisation mandate under the Union Budget 2021-22Union Budget 2021-22 laid out a three-pronged strategy for enhanced and sustainable infrastructure financing in the country, entailing, i) creation of institutional structures; ii) thrust on monetisation of assets, and iii) enhanced share of capital expenditure in Central and state budgets.Para 47 of the Union Budget 2021-22 laid out the ‘Asset Monetisation’ programme and recognised it as an important financing option for new infrastructure creation. The Union Budget mandate helped in providing a significant impetus and direction to the programme by identifying asset classes, ministries and CPSEs and by giving a mandate for a dashboard and a National Monetisation Pipeline (NMP) focusing exclusively on ‘brownfield infrastructure assets’.Pursuant to the mandate, active engagement in this whole of government exercise was carried out, involving key infrastructure ministries, NITI Aayog and Ministry of Finance to prepare a realistic roadmap for the programme.
Figure 2: Asset Monetisation mandate in Union Budget 2021-22
19
P O L I C Y A N D P R O G R A M M E4Objectives of the Monetisation ProgrammeThe overarching objective of the programme is to bring about a paradigm shift in the way infrastructure is created, operated, and funded in this country. Asset monetisation, in fact, is an overall strategy for (i) efficiencies in infrastructure O&M and augmentation (ii) creation of infrastructure investment alternatives for institutional investors, such as insurance funds, pension funds, sovereign wealth funds (iii) enabling retail investors to invest in specialised infrastructure assets through instruments, such as InvIT, etc.
Figure 3: Core Infrastructure asset classes under NMP
Monetisation will enable accelerated infrastructure creation and modernisation of services for a multiplier impact on the economy. Impact on the economy will be towards improved productivity and efficiencies due to higher utilisation of assets, synergies and economies of scale and new infrastructure creation. This in turn will spur growth on account of fulfilment of existing demand as well as incremental economic activity induced through such investment. In terms of employment creation, this will create avenues for skilled as well as unskilled labour in O&M of assets, construction of assets, etc.
Figure 4: Asset Monetisation impact on economy
It is pertinent to note that asset monetisation does not lead to reduction of asset base in the public sector. In fact, it leads to multi-fold infrastructure investment while reallocating the resources of the public and private sectors on the basis of respective strengths. The private sector taps and invests into commercially self-sustainable assets while the public sector focuses on the government’s core objectives, priority sectors, such as health, education, and sustainable development.
Figure 5: The virtuous cycle of Infrastructure
Figure 6: Core Asset Monetisation framework in NMP
NMP will prima-facie help in evolving a common framework for monetisation of core assets. It will critically clarify its distinction from privatisation, eventually helping to create a virtuous cycle of ‘develop, commission, monetise and invest’.The report on the National Monetisation Pipeline has been structured as a (i) guidance book for asset monetisation (volume i) and (ii) medium-term roadmap including the pipeline of assets (volume ii) of central government line ministries and CPSEs in infrastructure sectors with high monetisation potential.
20
Figure 7: NMP Reports (accessible at NITI Aayog web-site)
Approach to NMPA bottom-up approach was adopted wherein the existing core infrastructure asset base managed under central sector agencies was identified and mapped. The core infrastructure assets covered include roads, ports, airports, telecom, railways, warehousing, energy pipelines, power generation, power transmission, hospitality and sports stadium. Monetization through disinvestment and monetization of non-core assets (such as land, building, and pure play real estate assets) were not included in the NMP.
Monetisation value in the NMP is only an indicative high level estimate based on thumbrule estimates. Various approaches have been adopted to determine the indicative value of asset pipeline. The actual monetisation value will be determined based on detailed valuation or feasibility studies (as may be applicable) at the stage of transaction structuring.
National Monetization Pipeline: SummaryThe total indicative value of NMP for core assets of the Central government has been estimated at Rs 6.0 lakh crore over the four-year period, FY 2022-25 . The breakup of the overall pipeline for FY 2022-25 and the sectoral share is provided in the figure 8:
In terms of annual phasing by value, 15% of assets with an indicative value of Rs 0.88 lakh crore are envisaged to be rolled out in the current financial year, i.e. FY 21-22.
Figure 8: Sector-wise NMP summary over FY 2022-25 (Rs crore)
The top three sectors (by estimated value) are roads (27%) followed by railways (25%) and power (15%). The share of sectors, in terms of indicative monetisation value, in NMP is given below.
Figure 9: Sector-wise NMP value break-up
Roads27%
Railways25%
Power Transmission
8%
Power Generation7%
Telecom6%
Warehousing5%
Mining5%
Gas Pipelines4%
Other Pipelines & other assets
4%
Aviation3%
Urban Real Estate2%
Ports2%
Sports Stadiums2%
The assets and transactions identified under the NMP are expected to be rolled out through a range of instruments. The choice of instrument is determined by the sector, nature of asset, timing of transactions (including market considerations), target investor profile and the level of operational and/or investment control envisaged to be retained by the asset owner.
Asset Monetisation and StatesGiven their critical role in India’s infrastructure story, states too present a significant potential for leveraging assets such as tolled state highways, transmission towers, discoms, bus terminals, sports stadiums and
P O L I C Y A N D P R O G R A M M E4
21
state warehouses to mobilize capital for infrastructure investment, which can have multiplier effects on the state economies.
Figure 10: Incentive Scheme for States
Recognising the criticality of enhanced capital expenditure, the ‘Scheme for Special Assistance to States for Capital Expenditure’ to boost capital expenditure by state governments reeling under the financial impact of Covid is a pathbreaking measure. Under the scheme, incentive is provided to the states in the form of 50-year interest free loan.
Asset Monetisation Global Experience‘Asset recycling or monetisation’ has been adopted by several developed and emerging economies viz. Australia, Indonesia, etc., to fund their infrastructure needs. Globally, it is recognised as a potential tool for funding new infrastructure creation, through private sector participation.There is already an established track record of investment by institutional investors and funds in mature economic infrastructure projects such as toll roads, ports and airports in North America, Europe and Australia. More recently, such investments have been seen in Asia-Pacific region as well.The concept of asset recycling was widely implemented in Australia through the Asset Recycling Initiative (ARI) of the federal government. The Asset Recycling Initiative (ARI, 2014) was aimed at encouraging states to recycle assets and utilise the sale proceeds into new productivity-enhancing infrastructure by encouraging private companies to fund and run public infrastructure. The ARI provided monetary incentive for states to engage in asset recycling to boost infrastructure development.
There have been many other notable transactions globally involving limited period handover andor leasing of public Infrastructure assets in various sectors such as ports, pipelines, telecom, toll roads, energy infrastructure for upfront or periodic consideration.
Key ImperativesInfrastructure assets entail a clear need for the government to retain a degree of oversight and control by way of either contractual mechanisms or regulations. This necessitates detailed due diligence, legal and contractual agreements that clearly set forth the risks, rewards and obligations of various participants. There are a few key considerations in order to effectively roll out a successful asset monetisation programme.
Figure 11: Key imperatives
Robust MCAs have been developed in roads, ports and airports and investors have received these agreements well—through increased investor participation in projects from these sectors. There is a need to develop model PPP concession frameworks for various other brownfield asset classes identified under the NMP for quicker adoption by public asset owners.The institutional backbone for scaling up asset monetisation may be anchored at the level of the relevant ministries. With the National Monetisation Pipeline (NMP), each ministry may establish suitably empowered working groups with the sole mandate to identify assets, method of monetisation and handhold in the transactions/ procurement process.Contract management is a critical element in the monetisation jigsaw. Effective mechanisms for contract management, arbitration and conciliation are important to ensure success of monetisation. In order to boost investor confidence, it is crucial to maintain sanctity of contracts.
P O L I C Y A N D P R O G R A M M E4
22
Implementation of NMPImplementation is a critical aspect under NMP given the imperative for optimal structuring, time required towards approvals and clearances, as also in aspects such as ensuring the timing of transactions, etc. Successful implementation of NMP, hence, hinges on an effective governance framework with escalation matrix for real-time monitoring of progress. This requires streamlining of frameworks and modalities in a manner that can be readily operationalised, adopted and replicated.Monitoring of programme will be ensured through the asset monetisation dashboard, as envisaged under the Union Budget 2021-22. Further, the government, as part of a multi-layer institutional mechanism has constituted an empowered Core Group of Secretaries on Asset
Monetization (CGAM) for overall implementation and monitoring of the programme.
Figure 13: Implementation plan
P O L I C Y A N D P R O G R A M M E4
23
G L O B A L N E W S5Global Recovery Continues Amid UncertaintyThe global economy is projected to grow 5.9% in 2021 and 4.9% in 2022, 0.1 percentage point lower for 2021 than in the July forecast. The revision for 2021 reflects a downgrade for advanced economies—in part due to supply disruptions—and for low-income developing countries—due to worsening pandemic dynamics. This is partially offset by stronger near-term prospects among some commodity-exporting emerging market and developing economies.
Employment Growth Expected to Lag Output RecoveryAll advanced economies are expected to regain pre-Covid output levels by the end of 2022, but only two-thirds are projected to regain their earlier employment. Emerging market and developing economies show a similar pattern (Figure 1). This differential between projected output and employment recoveries suggests that Covid–related structural shifts may cause an increase in inequality and social tension. It reflects possible lingering health concerns, replacement income under furlough schemes or unemployment benefits cushioning income loss, and accelerated shift to automation.
Figure 1: Share of Economies Projected to Regain Pre-Pandemic Employment and Output Levels by 2022 (Percent)
Global Trade Rebound Beats Expectations but Marked by Regional DivergencesThe WTO has revised its projection for global merchandise trade volume growth to 10.8% in 2021—up from 8.0% forecasted in March. Growth in 2022 is projected at 4.7% and expected to moderate as merchandise trade approaches its pre-pandemic long-run trend. Supply-side issues such as semiconductor scarcity and port backlogs may strain supply chains and weigh on trade in particular areas, but they are unlikely to have a large impact on global aggregates. The biggest downside risks come from the pandemic itself. Behind the strong overall trade increase, however, there is significant divergence across countries, with some developing regions falling well short of the global average.
Global Debt Jumps to New High in 2020Due to Covid-19 and policies put in place to respond to it, global debt has jumped to a new high of USD 226 trillion in 2020, according to the IMF Fiscal Monitor (October 2021). This marks an increase in the debt of governments, households and non-financial corporations of USD 27 trillion over 2019. The increase is the largest on record. Advanced economies and China contributed more than 90% to the accumulation of worldwide debt in 2020. The remaining emerging economies and low-income developing countries contributed only around 7%.
International Community Strikes Ground-breaking Tax DealMembers of the OECD/G20 Inclusive Framework on BEPS have agreed to the “Statement on the Two-Pillar Solution to Address the Tax Challenges Arising from the Digitalisation of the Economy”. The solution
24
will ensure that multinational enterprises (MNEs) are subject to a minimum tax rate of 15%. The landmark deal was agreed to by 136 countries and jurisdictions and represents more than 90% of the global GDP. It will also reallocate more than USD 125 billion of profits from around 100 of the world’s largest and most profitable MNEs to countries worldwide.
Global Investment Flows Rebound in First Half of 2021Global foreign direct investment (FDI) flows in the first half of 2021 reached an estimated USD 852 billion, showing stronger than expected rebound momentum, according to UNCTAD’s Investment Trends Monitor released on 18 October. High-income countries more than doubled quarterly FDI inflows from rock bottom 2020 levels, middle-income economies saw a 30% increase, and low-income economies a further 9% decline (Figure). The rapid FDI recovery and the optimistic outlook mask the growing divergence in FDI flows between developed and developing economies, as well as the lag in a broad-based recovery of the greenfield investment in productive capacity.
Figure: Uneven FDI rebound (Quarterly growth rates 2021 H1 vs. 2020 for FDI, first three quarters for projects)
Inflation Surges Worldwide as Covid-19 Lockdowns EndRising inflation is triggering anxiety around the world as a surge in demand following the easing of Covid-19 lockdowns has been confronted by supply bottlenecks and rising prices of energy and raw materials. Price
rises began to accelerate worldwide in March, taking inflation rates higher than most central bankers had expected. By August, the annual rate of inflation in the G20 economies had risen to a decade high. The sharpest consumer-price increases in years in many countries have evoked different responses from central banks. More than a dozen has raised interest rates but two that haven’t are those that loom largest over the global economy: the Federal Reserve and the European Central Bank. Of the 38 central banks tracked by the Bank for International Settlements, 13 have raised their key rate at least once.
Time for Fed to Taper Bond Purchases but Not to Raise RatesThe Fed has signalled it will likely begin November 2021 to taper its USD 120 billion in monthly purchases of Treasury bonds and mortgage-backed securities. The Fed has promised to keep its benchmark overnight interest rate at the current near-zero level until the economy has returned to full employment and inflation has reached the central bank’s 2% goal and is on track to stay moderately above that level for some time.
OPEC+ Sticks to Plan for Gradual Oil Output HikeOPEC+ has said it would stick to an existing pact for a gradual increase in oil output, sending crude prices to three-year highs and adding to inflationary pressures that consuming nations fear will derail an economic recovery from the pandemic. OPEC+ reconfirmed the production adjustment plan, the group said in a statement issued after online ministerial talks, referring to a previously agreed deal under which 400,000 barrels per day (bpd) would be added in November.
India Crosses 1 Billion Vaccination DosesIndia administered 1 billion doses of Covid-19 vaccines in about nine months since the drive began. It took just 19 days to reach the one billion mark from 900 million. Around 75% of the adult population has been given at least 1 dose and 30% are fully vaccinated. The government aims to fully vaccinate the adult population by the end of 2021.
Air India Acquired by TatasAfter nearly two decades of continuous efforts, 100% equity stake of Air India, along with equity share holding of Air India in AIXL and AISATS, will be sold off to Tata Sons SPV M/s. Talace Pvt. Limited. The winning bid amounted to Rs 18,000 crore as Enterprise Valuation consideration for Air India. This has been a historic decision and highlights progress on its reform agenda as the government’s top priority.
Read More:ht tps: / /www.wsj .com/ar t ic les/new-delh i - ta ta-nationalization-airlines-business-modi-privatization-air-india-11634242660
Taxation Laws (Amendment) Bill, 2021, IntroducedIn a significant move, retrospective taxation law has been repealed. The Taxation Laws (Amendment) Bill, 2021 will effect in withdrawal of tax demands made using a 2012 retrospective legislation on indirect transfer of Indian assets prior to 28 May 2012. All tax demands made on companies like Cairn Energy and Vodafone using a 2012 legislation on indirect transfer of Indian assets prior to 28 May 2012 will be withdrawn.
Unicorn Surge in IndiaIn the quarter ending September 2021, India added close to 10 unicorns. India is now home to more than 60 unicorns–startups that are valued at USD 1 billion or more. In 2021 alone, 33 unicorns have come up in India, which is well above China’s figure of 19.
PM Gati Shakti LaunchedThe Union Government has approved the PM Gati Shakti National Master Plan, aimed at bringing down the logistics costs in the country by integrating the policymaking in the infrastructure space. The Rs-100-lakh-crore plan envisages a centralized portal comprising all existing and planned infrastructure initiatives for integrated planning and coordinated implementation of infra connectivity projects.
OFB Corporatization Signals Shift in Defense ProductionThe government has corporatized 41 factories of the Ordnance Factory Boards into seven Defence Public Sector Undertakings with the objective to improve efficiency in defense production. All seven DPSUS will function as corporate entities with 100% ownership lying with the government.
Economy Bounces back from SlumpThe World Bank has projected economic growth of 8.3% for India, saying that rise in vaccinations has led to a stable outlook for the current year. It flagged higher than expected inflation and slow recovery of the informal sector as the main risks to consumer spending. The Production-Linked Incentive Scheme is expected to further boost manufacturing. Planned increase in public investment is also expected to support domestic demand.
Trade Deficit with China Continues to RiseWhile bilateral trade is on track to hit a record-high of $100 billion, New Delhi’s trade deficit with Beijing rose to $46.55 billion in the first nine months of this calendar year. This is higher than the full-year figure in the last fiscal — and is expected to rise further by the end of 2021, according to latest data from China’s General Administration of Customs (GACC).
FDI Inflow Continues to Rise to Record LevelsFDI equity inflows grew by 168% in the first three months of FY 2021-22 with inflows reaching USD 17.57 Billion. The automobile sector garnered 27% of the share in total inflow followed by computer software and hardware (17%) and services sector (11%), respectively.
BSE Sensex and NSE Nifty 50 Power to All-Time HighsIndian equity markets have witnessed a dream run this year. The S&P BSE Sensex rose above 60,000 for the first time as investors remain optimistic. NSE Nifty 50 also hit record levels of nearly 18,500 on 18 October 2021. Major drivers behind the stellar stock market run this year are gains in banking, metal and IT stocks.
India’s Renewable Energy Capacity Crosses 100GWIndia has installed 100 GW of renewable energy capacity cumulatively by August 2021. The country targets to achieve 175GW installation by 2022-23. This will require a substantial ramp up in pace of capacity addition for the next 1.5 years.
India’s EV Market on Cusp of Shakeout StageIndia’s EV market is projected to reach USD 206 billion by 2030. Foxconn and Tesla have expressed interest in setting up manufacturing plants in India. Domestic players such as Tata, Ola, Hero, and Mahindra have ramped up investment into EV R&D. According to a report by JMK Research & Analytics, overall EV sales surged in September to 34,316 units, signifying a month-on-month increase of 18.7% and a year-on-year jump of 222%. This was the first time ever that monthly EV sales crossed the 30,000-unit mark.
S T A T E N E W S7Hyderabad Tagged ‘Water Plus’ CityHyderabad has been declared as a ‘Water Plus’ city by the Home Ministry. This certification is given to cities that achieve safe and sustainable sanitation by making sure no untreated wastewater is discharged into waterbodies, thereby ensuring adequate capacity of sewage treatment facilities.
Karnataka to Implement NEP in 10 YearsThe Karnataka government plans to implement new National Education Policy (NEP) within the next 10 years. Around 10,000 teachers would be trained on NEP by next year. Authorities have also launched a web portal for NEP in the state, which creates awareness about the policy through social media platforms and helpline number.
Nellore, East Godavari Districts Excel in PMAGY implementationAndhra Pradesh’s Nellore and East Godavari districts have been ranked second and third, respectively, across the country for implementation of the Pradhan Mantri Adarsh Gram Yojana (PMAGY).
Six UP Hosps Top Performers in NITI ReportIn an assessment undertaken by NITI Aayog of over 700 government hospitals across the country, six district hospitals in UP have been ranked top performers. Meanwhile, in the surgical productivity index, the Tej
Bahadur Sapru Hospital in Prayagraj was ranked the best in the country.
Gujarat, Kerala, Tamil Nadu Top Food Safety Index RankingsOn 20 September 2021, the food regulator released the third state food safety index rankings, which was led by Gujarat, Kerala and Tamil Nadu. On the other hand, Goa grabbed the first spot.
Gujarat Launches Portal for Drug Manufacturing LicenseThe Gujarat government has launched an online portal for drug manufacturing licenses, named ‘Ayudmla for Ayurvedic Medicines’. With this, Gujarat has become the first state in India to offer such facilities for the ayurvedic industry.
Now, Clean Tapwater in Every Rural Household in HaryanaHaryana has become the third state in the country to get clean tap water in every rural household under the Jal Jeevan Mission (JJM). Goa and Telangana have already achieved this milestone. Andaman and Nicobar, Puducherry, Daman and Diu and Dadra and Nagar Haveli have also achieved 100% under the ‘Har Ghar Jal’ Mission.
S T A T E N E W S7Telangana Develops First e-voting FacilityThe Telangana government has established the country’s first-of-its-kind smartphone-based e-voting facility.
Government to Set Up 7 Textile ParksThe government has issued a notification for setting up seven mega textile parks under the PM-MITRA scheme. These will entail an investment of Rs 44.45 billion. Each park is likely to generate about one lakh direct and two lakh indirect jobs. Several states such as
Tamil Nadu, Punjab, Odisha, Andhra Pradesh, Gujarat, Rajasthan, Assam, Karnataka, Madhya Pradesh and Telangana have expressed interest
Free Education in Haryana to Those with Income below Rs 1.8LThe Haryana government will provide free education to those whose verified family income is less than Rs 1,80,000 per annum. The move aims to ensure that no student belonging to a poor family remains uneducated.
N I T I N E W S8Finance Minister Launches National Monetisation Pipeline
Union Minister for Finance and Corporate Affairs, Smt Nirmala Sitharaman, today launched the asset monetisation pipeline of Central ministries and public sector entities: ‘National Monetisation Pipeline (NMP Volumes 1 & 2)’. The pipeline has been developed by NITI Aayog, in consultation with infrastructure line ministries, based on the mandate for ‘Asset Monetisation’ under Union Budget 2021-22. NMP estimates aggregate monetisation potential of Rs 6.0 lakh crores through core assets of the Central Government, over a four-year period, from FY 2022 to FY 2025.
NITI, CISCO Team Up to Foster Women EntrepreneursBuilding on their shared commitment to empower women entrepreneurs across India, NITI Aayog, the Government’s public policy think tank, and Cisco launched the next phase of the Women Entrepreneurship Platform (WEP). Titled “WEP Nxt”, this next phase of NITI Aayog’s flagship platform will leverage Cisco’s technology and experience working with India's startup ecosystem to enable more women-owned businesses across the country.
NITI Releases NE SDG Index & DashboardA milestone towards localising the SDGs was achieved with the release of the first edition of the North Eastern Region District SDG Index Report and Dashboard 2021–22 by NITI Aayog and Ministry of Development of North Eastern Region (M/DoNER). The index &
dashboard is the first of its kind in the country as it focuses on the North Eastern Region, which is of critical significance to the country’s development trajectory.
India scores 46th rank in the Global Innovation Index 2021India has climbed 2 spots and has been ranked 46th by the World Intellectual Property Organization in the Global Innovation Index 2021 rankings. India has been on a rising trajectory, over the past several years in the Global Innovation Index (GII), from a rank of 81 in 2015 to 46 in 2021. Innovation has been at the forefront of our battle against the unprecedented crisis created by the pandemic, and will be pivotal in driving the country’s resilience and self-reliance, as enshrined in the Prime Ministers’ clarion call on Aatmanirbhar Bharat.
NITI Aayog Launches Report on Reforms in Urban Planning
NITI Aayog today launched a report on measures to ramp up urban planning capacity in India. India is home to 11% of the total global urban population. By 2027, India will surpass China as the most populous country in the world. Unplanned urbanization, however, exerts great strain on our cities. In fact, the Covid-19 pandemic has revealed the dire need for the planning
30
N I T I N E W S8and management of our cities. The report makes several recommendations that can unblock bottlenecks in the value chain of urban planning capacity in India.
NITI, RMI Launch Shoonya Campaign
NITI Aayog, with RMI and RMI India’s support, today launched Shoonya—an initiative to promote zero-pollution delivery vehicles by working with consumers and industry. The campaign aims to accelerate adoption of electric vehicles (EVs) in the urban deliveries segment and create consumer awareness about the benefits of zero-pollution delivery. As part of the campaign, a corporate branding and certification programme is being launched to recognise and promote industry’s efforts towards transitioning to EVs for final-mile deliveries.
AIM, ISRO, CBSE Launch Space ChallengeAIM in collaboration with ISRO and CBSE successfully launched the ATL Space Challenge 2021. The challenge has been designed for all the school students, mentors and teachers across the country who are not only associated with schools having ATL labs but also those with non-ATL schools. This is to ensure that students of classes 6 to 12 are given an open platform where they can innovate and enable themselves to solve digital age space technology problems.
NITI Releases Geospatial Energy Map of IndiaNITI Aayog in collaboration with ISRO has developed a comprehensive Geographic Information System (GIS) Energy Map of India with the support of Energy Ministries of Government of India. The GIS map provides a holistic picture of all energy resources of the country which enables visualisation of energy installations such as conventional power plants, oil and gas wells, petroleum refineries, coal fields and coal blocks, district-wise data on renewable energy power plants and renewable energy resource potential, etc., through 27 thematic layers.
31
P R E V I O U S E D I T I O N S
VOLUME SEVEN | 31 AUGUST 2021SPECIAL FEATURE | DEVELOPMENT MONITORING AND EVALUATION OFFICE
VOLUME FIVE | 30 SEPTEMBER 2020SPECIAL FEATURE | INDIAN AGRICULTURE
VOLUME SIX | 10 MARCH 2021SPECIAL FEATURE | ASPIRATIONAL DISTRICTS PROGRAMME
VOLUME FOUR | 31 JULY 2020SPECIAL FEATURE | WOMEN ENTREPRENEURSHIP PLATFORM