CEO Incentives and Firm Productivity * September 2007 Laarni Bulan Paroma Sanyal Zhipeng Yan Abstract This paper investigates the relationship between firm productivity and CEO performance incentives in a sample of 917 U.S. manufacturing firms during the period 1992-2003. We first find that CEO equity ownership enhances firm productivity and that firm productivity enhances corporate financial performance. We then find that the relationship between CEO performance incentives and productivity is quite complex. There is an inverse U-shaped relationship between productivity and the sensitivity of CEO wealth to share value (delta), which suggests that the high CEO portfolio risk associated with high delta discourages CEOs from undertaking risky positive-NPV, productivity-enhancing projects. We also find that greater sensitivity of CEO option wealth to stock return volatility (vega) generally increases firm productivity, consistent with stock option grants making CEOs less concerned with risk due to the down-side protection it offers. However, for a range of delta values, higher vega may actually reduce productivity, a result that has not been previously documented empirically. This suggests that stock options may not always achieve their intended effect of making CEOs less risk-averse. These results highlight the importance of careful structuring of CEO compensation contracts. Encouragingly, we find that CEO performance incentives positively impact productivity for the vast majority of the firms in our sample. JEL codes: G32, G30, L2, O3 Keywords: CEO Incentives, Executive Compensation, Pay-Performance Sensitivity, Managerial Ownership, Productivity, Tobin’s Q * We are extremely grateful to Susan Athey, Susanto Basu, Audra Boone, Johannes Biesebroeck, Ravi Jain, Hong Li, Rachel McCulloch, Carol Osler, Carsten Pohl, Narayanan Subramanian, three anonymous referees and seminar participants at Brandeis University, the NBER productivity group, the NBER Productivity Summer Workshop, the FMA 2006 Annual Meeting, the IIOC 2007 Annual Meeting and the MFA 2007 Annual Meeting for helpful comments. All errors and omissions are our responsibility.
Transcript
CEO Incentives and Firm Productivity*
September 2007
Laarni Bulan
Paroma Sanyal
Zhipeng Yan
Abstract
This paper investigates the relationship between firm productivity and CEO
performance incentives in a sample of 917 U.S. manufacturing firms during the period 1992-2003. We first find that CEO equity ownership enhances firm productivity and that firm productivity enhances corporate financial performance. We then find that the relationship between CEO performance incentives and productivity is quite complex. There is an inverse U-shaped relationship between productivity and the sensitivity of CEO wealth to share value (delta), which suggests that the high CEO portfolio risk associated with high delta discourages CEOs from undertaking risky positive-NPV, productivity-enhancing projects. We also find that greater sensitivity of CEO option wealth to stock return volatility (vega) generally increases firm productivity, consistent with stock option grants making CEOs less concerned with risk due to the down-side protection it offers. However, for a range of delta values, higher vega may actually reduce productivity, a result that has not been previously documented empirically. This suggests that stock options may not always achieve their intended effect of making CEOs less risk-averse. These results highlight the importance of careful structuring of CEO compensation contracts. Encouragingly, we find that CEO performance incentives positively impact productivity for the vast majority of the firms in our sample.
* We are extremely grateful to Susan Athey, Susanto Basu, Audra Boone, Johannes Biesebroeck, Ravi Jain, Hong Li, Rachel McCulloch, Carol Osler, Carsten Pohl, Narayanan Subramanian, three anonymous referees and seminar participants at Brandeis University, the NBER productivity group, the NBER Productivity Summer Workshop, the FMA 2006 Annual Meeting, the IIOC 2007 Annual Meeting and the MFA 2007 Annual Meeting for helpful comments. All errors and omissions are our responsibility.
Introduction
This paper investigates the relationship between firm productivity and CEO
performance incentives. The existing theoretical literature suggests that CEO ownership,
or specifically the share of a corporation owned by the CEO, has multiple influences on
firm performance.1 On the positive side, when CEOs own more shares of their firm, they
benefit more from value-maximizing decisions since these result in share-price increases.
However, when CEOs own a large fraction of corporate shares they can become
“entrenched,” i.e. independently powerful and difficult to dislodge. In this case, he may
attempt to benefit himself at the expense of less powerful shareholders. This could create
an inverse U-shaped relationship between CEO ownership and corporate performance. In
addition, when CEOs own a large absolute amount of corporate shares they become more
exposed to share-price volatility directly and indirectly, insofar as their portfolios become
less diversified. This will concern risk-averse CEOs who may forgo risky yet value-
enhancing projects.
Given these ambiguities, it is not surprising that the empirical literature has not
reached a consensus regarding the relationship between managerial ownership and
corporate performance, which is typically measured as Tobin’s q. The earliest papers
that have linked managerial ownership to Tobin’s q found that the relationship is non-
linear and essentially has an inverse U-shape (Morck, Shleifer and Vishny (1988),
McConnell and Servaes (1990)). These studies suffer, however, from the potential
endogeneity of ownership (Himmelberg, Hubbard and Palia (1999), Palia (2001)). More
recent studies attempt to address the endogeneity problem by using instruments for
ownership or by using simultaneous equation estimation. The results from these studies 1 Berle and Means (1935), Jensen and Meckling (1976), Demsetz (1983), Fama and Jensen (1983), Smith and Stulz (1985) and Morck, Shleifer and Vishny (1988).
2
are mixed: some find that managerial ownership affects Tobin’s q and that this
relationship is non-monotonic, while others find no relation at all.2
In this paper, we focus on the real side of firm performance, namely productivity.
It is well known that productivity growth accelerated during the 1990s and this growth
has been attributed to technology improvements (Basu, Fernald, and Shapiro (2001)). It is
also well known that CEO incentive contracts shifted towards stock and stock option
grants beginning in the 1980s (Murphy (1999), Perry and Zenner (2000)). In particular,
Hall and Liebman (1998) show that stock option grants have dramatically increased both
the level of CEO compensation and the sensitivity of CEO compensation to firm
performance in the 1990s compared to the 1980s. Our results suggest that the shift in
compensation strategies may have contributed to the relatively rapid productivity growth
of the 1990s, as seen in Figure 1. Moreover, not only did the growth in productivity and
CEO compensation coincide, but also in 2001-2002, both productivity and CEO
compensation declined, suggestive of a systematic relationship between firm productivity
and CEO compensation incentives.
Furthermore, our focus on productivity is driven by three important observations.
First, it is critical to come to understand not just whether managerial incentives influence
firm financial performance but also how they exert this influence. If the theories are
correct such that managerial incentives do indeed influence financial performance by
affecting firm fundamentals, then there ought to be a corresponding relationship between
managerial incentives and the real side of firm performance, i.e. productivity should be a
channel through which incentives work to influence financial performance. Second, in a
2 Hermalin and Weisbach (1991), Loderer and Martin (1997), Cho (1998), Himmelberg, Hubbard and Palia (1999), Holderness, Kroszner, and Sheehan (1999), Demsetz and Villalonga (2001), Palia (2001), Claessens, Djankov, Fan and Lang (2002), Cui and Mak (2002), Coles, Lemmon and Meschke (2007), and Brick, Palia and Wang (2005).
3
perfect world, financial performance would be a good indicator of underlying firm
productivity. However in the presence of information asymmetries, the relationship
between productivity and financial performance may be weak. For example, the
relationship between managerial incentives and financial performance can reflect
management’s ability to manipulate accounting statements. In such a situation, a
fraudulently inflated stock price may not reflect improvements in firm fundamentals. A
third and related point, is that of crowding out. With a short tenure clock and multiple
demands on a CEO’s time, efforts at improving stock prices per se (especially since
compensation contracts are tied to it) may crowd out efforts at productivity improvement
as such improvements are largely unobservable to shareholders in the short-run.3
Focusing on the real side of firm performance allows us to avoid these potential
complications.
Thus, our analysis of the relationship between managerial incentives and firm
productivity permits us simultaneously to sort out the ambiguity in the empirical evidence
and to examine in greater depth the mechanism through which managerial incentives
influence firm financial performance. After all, we expect improvements in productivity
to have more permanent and lasting effects on firm financial performance.
We measure the real side of firm performance as total factor productivity (TFP).
We follow Olley and Pakes (1996) to obtain consistent estimates of TFP, with labor and
capital as inputs to production. This widely-accepted methodology corrects for
endogeneity of the capital stock, unobserved heterogeneity and sample selection bias in
3 This is not to argue that the two strategies of improving share performance and increasing firm productivity are incompatible. In our sample, a one percent increase in the firm’s stock price increases mean CEO wealth by half a million dollars. Increases in productivity are largely unobservable and unless they translate into one-for-one stock price increases, the returns to managers from exerting effort to increase the stock price independently of increasing productivity may be greater than those directed at productivity improvement.
4
the estimation of the production function. Our data covers 917 U.S. manufacturing firms
from Compustat and ExecuComp during the period 1992-2003.
To determine the relationship between productivity and CEO performance
incentives, we face two estimation issues. First, is the endogeneity of CEO incentives,
and second, is the persistence of productivity shocks. The endogeneity problem has been
widely recognized and is generally attributed to unobservable firm heterogeneity or
differences in the firm’s contracting environment (Himmelberg, Hubbard and Palia
(1999), Palia (2001)). For example, firms with a superior technology, ceteris paribus, are
more productive. At the same time, however, having the superior technology also means
that a lower level of incentives is required to ensure that this firm’s CEO will pursue
productivity-enhancing endeavors. Hence, optimal compensation contracts are
determined endogenously and are affected by (unobservable) firm characteristics that also
affect firm performance.4
If we appropriately address this endogeneity problem, it can be argued that if
value-maximizing contracts are awarded to CEOs then we should not observe a
systematic relationship between productivity and CEO incentives since both productivity
and CEO contracts are determined by firm-specific factors in the firm’s environment. On
the other hand, if transaction costs inhibit optimal contracting5 then we would observe a
systematic relationship between CEO incentives and productivity.6 Our findings support
the latter view. Moreover, contracting on productivity is practically impossible in the
sense that a specific firm’s TFP is not readily observable by the shareholders. Setting
financial performance targets (such as the share price) are more easily implemented than 4 Earlier studies such as Demsetz (1983) and Jensen and Warner (1988) have also recognized that managerial ownership is endogenous to the value-maximization problem of firms. 5 Tirole (1999) reviews the incomplete contracting literature and categorizes transaction costs into 1) unforeseen contingencies, 2) the cost of writing contracts and 3) the cost of enforcing contracts. 6 See Agrawal and Knoeber (1996) and Palia (2001).
5
setting productivity targets. At best, we observe TFP measures at the aggregate level.7
Thus, we can infer from the relationship between CEO incentives and firm productivity
whether CEO contracts are able to provide adequate incentives for improving firm
fundamentals that consequently increase shareholder value. Moreover, our findings also
show that certain types of contracts are clearly sub-optimal since they are related to lower
productivity.
To address the two estimation issues mentioned above, we use the difference-
GMM (generalized method of moments) methodology of Arellano and Bond (1991).
With the appropriate instruments, GMM corrects for endogeneity. Furthermore,
difference-GMM exploits the dynamic nature of panel data sets by utilizing the moment
conditions with lagged values of covariates. These moment conditions imply that
instruments for endogenous variables need only be predetermined (weakly exogenous)
and not strictly exogenous to the empirical model. Additionally, this procedure allows us
to account for the persistence of productivity over time by including lagged productivity
as a regressor. In contrast, traditional instrumental variable-fixed effects estimation
requires strict exogeneity of instruments and would yield inconsistent coefficient
estimates with a lagged dependent variable.
We first find a significant positive relationship between CEO ownership and total
factor productivity, and an even stronger positive relationship between TFP and Tobin’s
q. This corroborates the literature’s broad theoretical conclusion that stock ownership
can help align the incentives of CEOs with those of shareholders (i.e. shareholder wealth
maximization). We find that this relationship between CEO ownership and TFP is
7 Reported quarterly by the Bureau of Labor and Statistics, for example.
6
monotonic, rather than inverse U-shaped, which suggests that the “entrenchment” effect
is not strong.
Equity ownership, however, is an incomplete measure of the CEO’s equity-based
incentives. It does not reflect option contracts and does not capture the sensitivity of
CEO wealth, per se, to stock price performance. In this paper, we focus on two measures
of equity-based incentives. The first measure is “delta,” the sensitivity of CEO wealth to
percent changes in his firm’s stock price. This depends on the amount of shares he owns,
the number of options he owns, and various properties of the options such as maturity and
strike prices. The second measure is “vega,” the sensitivity of CEO wealth to percent
changes in stock return volatility. This depends primarily on the option component of
CEO wealth, and reflects the positive influence of volatility on option value. A CEO’s
expected return will depend on both delta and vega; his expected risk will depend
primarily on delta. The way in which corporate directors divide compensation between
stocks and options will clearly influence delta and vega.8
We enhance our analysis of the relationship between incentives and productivity
by replacing ownership with these two more nuanced measures, an approach that has not
previously been undertaken to our knowledge. We find that productivity has an inverted
U-shape relationship with the sensitivity of CEO wealth to changes in share value (delta).
This suggests that the high CEO portfolio risk associated with high delta discourages
CEOs from undertaking risky positive-NPV, productivity-enhancing projects. This result
underscores the importance of CEO risk aversion, which could be particularly relevant to
us in the case of risky R&D (research and development) investments, for example, since
prior work has shown that R&D positively impacts productivity.
8 Palia (2001), Coles, Lemmon and Meschke (2007) and Brick, Palia and Wang (2005) use similar measures for CEO pay-performance sensitivity.
7
Next, we find that greater sensitivity of CEO option wealth to stock return
volatility (vega) generally increases firm productivity, as expected. This is because stock
options offer down-side protection that makes CEOs less concerned with risk. However,
for a range of delta values higher vega may actually reduce productivity, a result that has
not been previously documented empirically. This finding implies that a more convex
compensation contract (e.g. one with more stock option grants) can make CEOs more
risk-averse, contrary to what is normally expected. Ross (2004) illustrates the conditions
under which this can actually occur.
Our findings highlight the complexity of the relationship between CEO
performance incentives and corporate performance, underlining the importance of careful
structuring of CEO compensation contracts. Encouragingly, we find that CEO incentives
positively impact productivity for the vast majority of the firms in our sample.
Very few studies have looked at the relationship between productivity and
managerial incentives. The paper closest in spirit to ours is Palia and Lichtenberg (1999).
They estimate the production function with managerial ownership as a third factor input,
in addition to labor and capital. To address endogeneity concerns, they employ a fixed
effects methodology and use lagged values of all factor inputs. From a randomly selected
sample of 255 US manufacturing firms over the period 1982-1993, they find that changes
in the equity holdings of managers are positively correlated with changes in productivity,
consistent with our findings for CEO ownership.9 While Palia and Lichtenberg look
solely at managerial ownership, in this paper, we focus on the CEO’s delta and vega.
9 Barth, Gulbrandsen and Schøne (2005) examine a sample of Norwegian firms and find that family ownership and family management have a negative impact on productivity. Perez-Gonzales (2004) investigates the impact of multinational ownership on the productivity of Mexican manufacturing plants and finds that ownership by a multinational corporation is positively related to productivity. Additionally, Nickell, Nicolitsas and Dryden (1997) and Köke and Renneboog (2003) find that the existence of a dominant outside shareholder has a positive impact on productivity growth.
8
Another closely related paper is Coles, Daniel and Naveen (2006). This paper
examines the relationship between managerial incentives and specific firm policies on
capital expenditures, research and development (R&D) and leverage. Their main finding
is that higher CEO vega results in riskier firm policies (lower capital expenditures, higher
R&D and higher leverage). While they show that CEO compensation in the form of
stock options induces risk-taking behavior, our results show that when we look at over-all
firm performance in terms of productivity, awarding stock options may not always
achieve their intended effect of making CEOs less risk-averse.
The remainder of the paper is organized as follows: Section I describes our data
and our empirical methodologies. Section II shows that CEO ownership enhances
productivity and productivity enhances Tobin’s q. Section III shows that two dimensions
of managerial incentives are important for the influence of compensation on productivity,
and that the influence is complex and nonlinear. Section IV concludes.
I. Data and Methodology
A. Sample Selection and Variable Construction
We gather data from two main sources. We obtain annual CEO compensation
data from ExecuComp for the period 1992-2003. Our sample begins in 1992, when
ExecuComp came into existence, and extends to 2003. We obtain firm characteristics
from Compustat. We focus exclusively on manufacturing firms, for which our
productivity estimation is likely to be most reliable. Our sample thus comprises all 917 of
the manufacturing firms represented in both ExecuComp and Compustat with no missing
observations for certain key variables.10 Because ExecuComp focuses on major firms,
10 These variables are productivity, lagged productivity, total assets, firm age and CEO share holdings.
9
such as the S&P 500, our sample is dominated by large firms.11 Our primary sample
consists of 6,636 firm-year observations.
1. Measuring CEO Incentives
We measure CEO incentives in three ways. As a benchmark for comparison to
previous work, we first construct CEO holdings using the standard definition of the
fraction of equity shares held by the CEO to total shares outstanding. We measure delta,
the CEO’s wealth sensitivity to changes in the firm’s stock price, as the dollar change in
the CEO’s equity and option holdings in response to a one-percent change in the firm’s
stock price. We measure vega, the CEO’s wealth sensitivity to changes in the volatility of
the firm’s stock return, as the dollar change in the CEO’s option holdings for a one-
percent change in the firm’s stock return volatility. Our measures are exactly those used
in Core and Guay (2002), which are further described in the appendix. The vega of option
holdings has been shown by Guay (1999) to be of an order of magnitude larger than the
vega of stock holdings. Thus, we approximate the CEO’s vega to be the vega from
option holdings.12
2. Measuring Total Factor Productivity
Total factor productivity or TFP is the conventional measure of firm-level
productivity. TFP is defined as the change in output that cannot be explained by a
corresponding change in factor inputs. The two most commonly identified sources of
11 In a recent paper, Cadman, Klasa and Matsunaga (2006) document some systematic differences between ExecuComp and non-ExecuComp firms. They find that increasing the heterogeneity of the sample by including non-ExecuComp firms “uncover(s) previously hidden conditional or nonlinear relations.” We acknowledge that our use of ExecuComp firms may weaken the generality of our findings. On the other hand, our results already indicate a non-linear relation between firm productivity and CEO performance incentives, so that the “biases” that these authors document may not be as severe for this study. 12 Coles, Daniel and Naveen (2006), also make the same approximation.
10
productivity gains are changes in technology and unobserved efficiency increases. Early
work has used ordinary least squares to estimate firm-level production functions.
However, this method suffers from some serious flaws. The main problems are that of
endogeneity of inputs, unobserved heterogeneity across firms and selection bias. Olley
and Pakes (1996) developed a methodology that addresses these problems. We follow
this procedure and obtain consistent estimates of TFP for each firm.13 Since the
underlying production function parameters may be different across industries, we
estimate the production function separately for each industry group following the Fama-
French 49 industry classification. TFP is then calculated as the residual between the
predicted and actual output. The appendix describes this estimation procedure in greater
detail.
To make the TFP estimates comparable across industries, we compute a
productivity index (Pavcnik (2002), Aw, et. al (2001)) as follows: We consider 1992 to
be the base year for which we calculate the mean TFP estimate by industry group. We
then subtract this 1992 industry mean from firm-level TFP to obtain the productivity
index: pindxit=prodv_estit – prodv_estj,1992, where j is the industry group of firm i and t
denotes the current year. In the regression analysis that follows, we use this productivity
index as the dependent variable. Table A2 provides descriptive statistics for this index.
3. Measuring Firm Characteristics
To evaluate the contribution of CEO incentives to productivity, it is important to
control for other important factors. Following previous work, we require the following
13 Another advantage of this methodology is that it yields productivity estimates that are robust to a variety of estimation issues. Its shortcoming is that these estimates can be quite sensitive to measurement error in investment (Biesebroeck (2004)). In this paper, investment is measured as capital expenditures (in property, plant and equipment). Since this is a flow variable that is reported by firms each year, we believe measurement problems are not that severe.
11
additional factors in our analysis: firm size (total assets), firm age, industry concentration
(Herfindahl index), Tobin’s q, sales, tangible assets, capital expenditures, book leverage,
stock return volatility, research and development, advertising, and CEO tenure. Further
details on the measurement and construction of these variables are outlined in the
appendix.
Table 1A reports descriptive statistics for our estimation sample. For a majority
of the observations, CEOs own less than 0.5 percent of their firm’s stock. However, this
distribution is heavily skewed since the mean equity stake is 2.81 percent. The patterns
for delta are similar to that of equity holdings. A one percent increase in the firm’s stock
price results in a median increase in CEO wealth of $180,000, while the mean increase is
$540,000. With regards to vega, a one percent increase in the volatility of a firm’s stock
return corresponds to a median (mean) increase in CEO wealth of $30,000 ($80,000). In
Table 1B, we report the correlation matrix for our variable set.
B. Estimating the Productivity-Incentives Relationship
Next, we estimate the following empirical model relating CEO performance
liberalization and exports (Keller and Yeaple (2003), Ozler and Yilmaz (2001), Keller
(1997)), use of better technology, specifically computers (Lehr and Lichtenberg (1997)),
changing workplace organization (Black and Lynch (2003)) and managerial efficiency
(Bartelsman and Doms (2000)).
Based on this literature, the basic control variables for productivity that we use are
firm age, firm size, industry concentration and R&D.14 Among the additional factors that
these studies have shown to affect productivity, managerial effort (or efficiency) is the
main focus in this paper. Furthermore, for our analysis, the firm’s level of technology is
an unobservable factor and is a likely source of endogeneity. Consider, for example, two
identical firms except one has the superior technology. Given the same factor inputs, the
superior technology firm would be more productive. At the same time, however, having
the superior technology also means that a lower level of incentives (i.e. less incentive
14 To preserve sample size, we follow Himmelberg, Hubbard and Palia (1999) and include a dummy variable to account for missing values of R&D. This dummy variable equals 1 if R&D is non-missing. Missing values of R&D are replaced with zeros.
13
alignment with shareholder goals or a compensation contract with a flatter slope) is
required for this firm’s CEO to pursue productivity-enhancing endeavors.15
With the appropriate instruments, the Arellano and Bond (1991) methodology
addresses this endogeneity issue. Moreover, this efficient-GMM estimator does not
require the strict exogeneity of instruments, only that they are predetermined (weakly
exogenous). The firm fixed effect is eliminated by first-differencing equation (1). The
set of valid instruments follows from the moment conditions with lagged variables.
Thus, all lagged values of the covariates, which include twice-lagged lagged productivity,
can be used as instruments for the first-differenced covariates. Hence, an added
advantage of this methodology is that it allows past productivity levels to affect CEO
incentives. Over-all, the Arellano-Bond methodology corrects for the two estimation
issues we face, i.e. the endogeneity of CEO compensation and the persistence of
productivity shocks. These issues cannot both be addressed by the standard instrumental
variables – fixed effects techniques used in prior work.
Previous studies have shown that the following factors affect CEO incentives:
firm size, firm age, CEO tenure, stock return volatility, advertising, and book leverage.
The first two factors are also control variables and hence, their lagged values are part of
the instrument set. We use the lagged values of the latter four factors as additional
instruments for CEO incentives. The justifications for these instruments are well-
articulated by Core and Guay (1999), Himmelberg, Hubbard and Palia (1999) and Palia
(2001). We summarize these arguments as follows: 1) Firm size is related to agency
costs since larger firms are more difficult to monitor. Moreover, larger firms require
15 Prior studies have acknowledged that managerial ownership and firm value are endogenously determined by exogenous factors in the firm’s contracting environment (Jensen and Warner (1988), Himmelberg, Hubbard and Palia (1999), Palia (2001)). Moreover, these factors are to a large extent unobservable.
14
highly skilled managers who demand greater compensation and are thus wealthier. Thus
larger firms would need higher levels of CEO incentives (greater incentive-alignment or a
steeper slope of the compensation contract). On the other hand, rating agencies and top
management may benefit from monitoring economies of scale in larger firms. This
would predict that larger firms require lower incentive levels. 2) Firm age would affect
CEO incentives for similar reasons as firm size, but would also affect the composition of
compensation packages. Younger firms are more likely to use options and restricted
stock grants for CEO pay. 3) CEO tenure is the number of years the executive has been
the CEO of the company, constructed from ExecuComp. CEO experience is a proxy for
CEO wealth. To a certain extent, it also captures the CEOs proximity to retirement. To
avoid short horizon concerns, higher incentives levels would be necessary. Thus, higher
tenures would be related to higher incentive levels. 4) Stock return volatility is a proxy
for CEO risk aversion. High stock return volatility may distort the performance
incentives of equity ownership in a firm due to the CEO’s inability to diversify his
portfolio. To mitigate this effect, CEOs of firms with high stock return volatility are
normally given more convex compensation contracts (e.g. stock option grants) to induce
more risk-taking behavior. 5) Advertising is a measure of discretionary spending.
Discretionary expenses are more difficult to monitor and would thus require a higher
level of incentives. Similar to R&D, we include a dummy variable that equals 1 if
advertising is non-missing. Missing values of advertising are replaced with zeros in order
to preserve sample size. 6) Finally, we include book leverage to control for agency costs
according to Jensen’s (1986) free cash flow theory. Higher leverage mitigates these
agency costs and reduces the need for high CEO incentive levels.16
16 Additionally, Guay (1999) shows that stock return volatility is positively related to CEO vega while
15
We calculate robust standard errors with a finite-sample correction to the two-step
covariance matrix according to Windmeijer (2005). We report two specification tests to
ensure the validity of our instruments: 1) the Hansen J test for over-identifying
restrictions; and 2) the Arellano-Bond m2 test for lack of serial correlation in the error
term μit.17 For both tests, p-values of less than 10 % would mean a rejection of the
validity of the instruments at conventional levels of significance.
II. CEO Ownership and Corporate Performance
Prior work has not reached a consensus on the effect of managerial ownership on
firm financial performance, measured by Tobin’s q. This is an important empirical
question since the stated objective of a CEO is to maximize shareholder value. However,
Tobin’s q is a fairly short-run performance indicator as opposed to productivity which is
a more long-term performance measure for a firm. Increase in advertising, obtaining
patents, new investment announcements may all raise stock market prices and thus
Tobin’s q without necessarily changing the underlying productivity of a firm. However,
without fundamental changes to underlying productivity, sustained improvements in
financial performance will not be possible. In order to connect these short-term and long-
term performance measures, we begin our analysis by documenting how productivity and
a firm’s financial performance are related and then relate CEO ownership to productivity.
We first show that higher productivity is associated with a higher Tobin’s q and that
greater CEO ownership is also associated with higher productivity. Thus, by looking at
Coles, Daniel and Naveen (2006) show that riskier firm policies (high R&D and high leverage) result in lower CEO delta and higher CEO vega. 17 The latter test is implemented by testing for the absence of second-order serial correlation in the first-differenced errors. The absence of second-order serial correlation in first-differences implies the absence of serial correlation in levels.
16
the real-side of firm performance, we illustrate that CEO ownership does indeed enhance
firm financial performance. Equivalently, we show that greater CEO ownership enhances
firm value by way of enhancing total factor productivity.
A. Long-Run and Short-Run Measures of Firm Performance
We first estimate the determinants of productivity excluding CEO incentives and
then investigate how changes in productivity change the short-term financial performance
of a firm, as captured by Tobin’s q. Results are presented in Table 2 and are consistent
with those found in earlier studies. For the productivity regression (column 1), the
coefficient on lagged productivity is positive, highly significant and stable, justifying our
use of the dynamic panel estimator18. We also find that older and larger firms have higher
productivity. Unlike earlier studies, we do not find any significant relationship between
industry concentration and productivity or between R&D and productivity. We believe
this is because there is not a lot of time variation in the concentration measure and our
estimation in first differences removes industry fixed effects. The lack of the R&D effect
may reflect the relative unimportance of R&D for many of the traditional manufacturing
firms in our sample, which is not surprising since our sample consists mostly of firms
whose R&D costs are minor.19 Moreover, for these traditional manufacturing firms,
R&D is likely to be more related to product development than basic research.
Next, we investigate how these productivity changes are reflected in a firm’s
financial performance. Figure 1 shows that the productivity surge of the 1990s coincided
with the large increase in CEO pay. Moreover, it is also the case that the stock market 18 The Arellano-Bond m2 test for autocorrelation in the first-differenced errors are consistent with the model assumptions, i.e. there is no serial correlation in the error term. However, the Hansen J test of over-identifying restrictions clearly rejects the validity of the instruments. This suggests that we may have omitted a critical variable, which could well be managerial effort. In these base specifications, the instruments used are lagged values and differences of the explanatory variables. 19 Median R&D is 16 % of net property, plant and equipment and is 3.8 % of total assets.
17
reached unprecedented heights over this same time period. This begs the question of
whether these productivity gains translate into enhanced corporate value. Arguably, many
factors such as advertising, leverage and volatility can affect firm valuation. CEO actions
can alter these factors and hence impact a firm’s financial performance. However, we
argue that productivity is another important, and often overlooked, channel through
which a firm’s financial performance is affected. Ultimately, a CEO’s motivation for
increasing firm productivity is to increase shareholder value. This in an important link to
establish, since one may argue that with a relatively short average tenure, CEOs may not
be interested in investing resources to increase productivity, which is typically difficult to
measure and may not be immediately reflected in stock prices. However, if productivity
is valued correctly and reflected in the market valuation of the firm, then irrespective of
their expected tenure horizons, CEOs would have an incentive to invest in long-term
productivity enhancements and not just short-term fixes to increase Tobin’s Q since such
changes alter their net worth. Thus if we observe a direct link between productivity and
financial performance, we should also expect to see a link between CEO incentives and
productivity.
Following previous work, we use Tobin’s q as a market-based measure of the
firm’s financial performance. We measure productivity here as the estimated productivity
residual from the production function (equation (2) in the Appendix), rather than the
productivity index that we have used as a dependent variable. This is because we want to
relate the firm’s actual measure of TFP, which is the residual, to its market valuation.
Our results are unchanged if we use the productivity index instead of the residual. We
control for the influence of various additional determinants of Tobin’s q that have been
identified by prior studies (Himmelberg, Hubbard and Palia (1999)) such as firm size,
18
tangible assets, investment, industry concentration, R&D, advertising, leverage and stock
return volatility. We use a firm fixed effects methodology to estimate this empirical
specification. The results in Table 2 (column 2) show that productivity has a highly
significant, positive impact on Tobin’s q even after controlling for these other
influences.20 These results suggest that our findings on the relationship between
productivity and CEO ownership should carry over to Tobin’s q. Thus, a CEO’s
incentives for maximizing shareholder wealth are manifested in the relationship between
firm productivity and CEO ownership. Productivity is an important mechanism through
which CEO incentives affect firm financial performance.
B. CEO Ownership and Productivity
Next, we study the link between productivity and CEO incentives in detail. In
Table 3, we add CEO ownership (holdings) to our empirical model21 and investigate the
nature of the productivity-ownership linkage. Theory suggests that ownership may have a
non-linear relationship with firm performance, thus we add not only CEO ownership
itself but also its square and its cube. The results, shown in Table 3, show that higher
CEO ownership results in higher total factor productivity, consistent with Palia and
Lichtenberg’s (1999) findings for managerial ownership. In addition, it appears that the
linear specification is sufficient in our sample. That is, it appears that productivity is not
undermined when CEOs own larger and larger shares of a corporation, suggesting that
the “entrenchment effect” is not economically large. Importantly, the Arellano-Bond test
20 Palia and Lichtenberg (1999) also find that Tobin’s q is positively related to productivity. 21 Since industry concentration and R&D were found to have no additional effect on productivity in Table 2, we exclude these variables from the main regressions that follow. Although we no longer use R&D as a control variable, we retain lagged values of R&D as instruments in all the remaining analyses. Similar to advertising, R&D is a measure of discretionary spending that is difficult to monitor. Thus R&D-intensive firms will require higher CEO incentive levels.
19
remains consistent with the model assumptions and the Hansen J tests no longer suggest
specification problems such as the exclusion of important productivity determinants.
This supports our decision to analyze the influence of CEO incentives on productivity.22
III. A Closer Look at CEO Incentives
Having established that greater CEO ownership enhances firm value by enhancing
productivity, we now take a closer look at the incentive structure of CEO pay and its
impact on productivity. Stock ownership is just one component of CEO compensation.
Ownership does not reflect option contracts and does not capture the sensitivity of CEO
wealth, per se, to share performance. The CEO’s wealth sensitivity to changes in the
stock price and stock return volatility are more indicative of CEO incentives than just
equity ownership since the former are more closely tied to firm performance. Thus, we
use two measures of CEO incentives that are widely used in the literature, but have not
previously been linked to productivity. These are the delta, the sensitivity of CEO wealth
to percent changes in the firm’s share price, and the vega, the sensitivity of CEO wealth
to percent changes in stock return volatility. A CEO’s expected return will depend on
both delta and vega; his expected risk will depend primarily on delta. This section shows
that delta and vega are positively related to productivity for the vast majority of our
firms, but that the relationship is nonlinear and can be different at certain levels of delta.
Thus, appropriate combinations of delta and vega must be chosen in order to enhance
productivity, which will consequently enhance firm value.
22Note that in Tables 2-7, the number of observations used in the estimation vary from the primary sample reported in Table 1A. This is because the estimation is in first-differences and missing years for some variables reduces the sample size. All our results continue to hold if we use the restricted sample with non-missing observations for all first-differenced explanatory variables.
20
A. CEO Delta
We first extend the regressions used to evaluate the influence of CEO ownership
on productivity in Table 3 by including CEO delta. The results, shown in Table 4,
column 1, indicate that both holdings and delta are insignificant. This is expected because
delta is partly a function of equity holdings, and the two are strongly correlated. When
we allow the relationship between delta and productivity to be nonlinear, as suggested by
theory, we find that delta becomes significant while ownership – which is included
without nonlinear terms based on the results in Table 3 – remains insignificant (columns
2 and 3). This is not surprising since delta is a more comprehensive measure of the
sensitivity of CEO wealth to share price than ownership. Henceforth, we focus on delta
rather than ownership.
Overall, we find that there is a significant relationship between productivity and
delta that is non-monotonic. The linear term has a positive coefficient, the squared term
has a negative coefficient, and the cubic term has a positive coefficient. The overall
relationship is portrayed in Figures 2 and 3. These show that productivity initially
increases with delta, consistent with the incentive-alignment effect, i.e. CEO incentives
are aligned with those of shareholders. Then, for larger values of delta, productivity
decreases, but the rate of decrease slows to almost zero at the highest levels of delta. The
negative effect on productivity for higher values for delta is more consistent with the
risk-aversion hypothesis. Managers, whose personal wealth is closely tied to the financial
performance of the firm, become averse to investing in risky, but productivity-enhancing
projects. This conclusion is also consistent with evidence presented in Coles, Daniel and
Naveen (2006) that looks at the empirical relationship between CEO delta and specific
21
firm policies. They find that high delta induces CEOs to take less risky decisions, such as
more capital expenditures and less R&D.
Recall from table 1A that the distribution of CEO delta is heavily skewed with a
median of $180,000 and a mean of $540,000. Five percent of the observations have
deltas greater than $2.26 million. Three percent of the observations have deltas greater
than $3.34 million. Thus, it is not surprising that in Figure 3 where we have the cubic
specification, the 95 % confidence interval widens considerably beyond the $3 million
mark. Although the cubic model yields a statistically significant third order coefficient
for delta, this appears to be driven by the upper tail of the distribution where the 95
percent confidence interval is rather large.
An alternative to these higher-ordered polynomial functions is to estimate piece-
wise linear functions of delta, similar to Morck, Shleifer and Vishny’s (1988) piece-wise
linear specification for managerial ownership. For this specification, we allow the slope
to change at various threshold points that coincide with the top percentiles of the delta
distribution. Our choice of threshold points are motivated by our findings from the
previous table.23 The results, shown in Table 5, confirm our findings from the quadratic
and cubic models: there is a statistically significant inverted-U relationship between
productivity and CEO delta. This initially positive relationship becomes negative at high
levels of delta. Although Tables 4 and 5 show that this relationship becomes positive
once more at delta levels greater than $8 M, this evidence is weak. Hence, for the
remainder of the paper, we focus on the quadratic specification for delta.
Our findings on productivity and CEO delta are not only statistically significant,
but economically significant as well. The average annual increase in the level of the
23 The local maximum and minimum from figures 2 and 3 occur at the top 5th percentile of the delta distribution.
22
productivity index is 0.04 (see Table A2). For values of delta less than $4.34 million
(Table 5, column 2), a one standard deviation ($1.17 M) increase in delta is more than
sufficient to achieve this average annual increase in productivity. If CEO delta merely
doubles from its median value of $180,000, the result is an increase in the productivity
index of 0.0068 -- which is 17 % of the average annual productivity gain. On the other
hand, for values of delta greater than $4.34 million, a one standard deviation increase in
delta will reduce the productivity index by 0.3, which is 75 % of the average annual
productivity gain.
B. CEO Vega
It appears that when delta is high the alignment of shareholder interests with CEO
interests becomes less well aligned. This has been one motivation for providing CEOs
with option contracts. If higher risk can increase expected option values even while
creating uncertainty, CEOs might be less hesitant to undertake risky projects.
Equivalently, CEOs might be less concerned with risk when they have option wealth,
which of course has downside protection.
In Table 6, we add CEO vega to our empirical specification. Recall that we
measure vega as the sensitivity of CEO option wealth to stock return volatility. The
coefficient on vega is not statistically significant, while the results for delta remain
unchanged (column 1). This result is surprising because Coles, Daniel and Naveen (2006)
find that high vega implements riskier firm policy choices.
We conjecture that the influence of vega might be most apparent at high levels of
delta, when CEO risk aversion effects would be most severe. To test this hypothesis, we
interact delta with vega. For simplicity of interpretation, we adopt the piece-wise linear
23
specification for delta instead of the quadratic model. We use various percentile threshold
points for the piece-wise linear function and obtain similar results. In columns 2 and 3,
we provide the estimates when the slope changes at the 98th percentile of delta. We use
the 98th percentile for delta because it is the closest to the predicted maximum point from
the quadratic model in column 1.
When interacted with delta, we find that vega does indeed tend to increase
productivity. The coefficient on the linear vega term of 0.174 implies economically
significant effects. As we anticipated, this effect is particularly intense at high levels of
delta, since the interaction term between vega and high deltas has a positive coefficient.
What is puzzling, however, is the interaction term between vega and lower deltas has a
negative coefficient.
The effect on productivity of different combinations of delta and vega is best
portrayed in Figure 4. The graph clearly shows that the relationship between productivity
and these two incentive measures is quite complex. Not only does delta have opposing
effects on productivity, but so does vega for a given delta. When we calculate the net
effect of vega on productivity for a given delta, we find that a rise in vega enhances
productivity for the vast majority – over 95 percent -- of the firms in our sample.
However, for a small fraction of firms in our sample, where delta values are in the mid-
range ($2.15 M -$4.34M), increasing vega decreases productivity.
On the one hand, we find that higher vega enhances productivity, which is
consistent with the view that stock options makes managers more willing to take risk. On
the other hand, we also find that for certain delta values, a higher vega lowers
productivity, which is more consistent with CEO risk aversion. One possible explanation
for these puzzling results is given in Ross (2004), who shows that adding call options to a
24
manager’s compensation package also increases the delta and can actually make a
manager more risk-averse, contrary to conventional wisdom.24 Although we do not
explicitly model any feedback between the CEO’s delta and vega, it precisely in the
region where delta is close to its negative slope threshold that increased vega can make
the CEO more risk-averse since delta is already high. Our findings thus show that
awarding managers with stock option grants may not always achieve the intended effect
of encouraging more risk-taking behavior.
In sum, we find that CEO incentives have significant real effects on firm
performance, which consequently impact firm value. These effects however, are not
monotonic. Our findings imply that appropriate combinations of stock and stock option
grants should be chosen in order to increase productivity, which consequently increase
firm value. Encouragingly, for most of the firms in our sample, we find that CEO
compensation structures create incentives that positively impact productivity.25
C. Robustness Tests
We perform two categories of robustness tests for our specifications. First, we
deal with issues of mis-specifications due to omitted variables or choice of instruments.
To mitigate this concern we modify our empirical specifications in Tables 4-6 as follows:
1) exclude R&D and the R&D dummy from the instrument set; 2) include R&D and the
R&D dummy in the control group; 3) include leverage in the control group; and 4)
include volatility in the control group. The rationale for the first two tests is that although
24 A similar counter-intuitive observation is made in Carpenter (2000). 25 It is also possible that the delta-vega combination we observe is not the optimal compensation structure chosen by the shareholders, but is a result of two factors: one, the CEO’s tenure with the company; and two, the CEO’s portfolio rebalancing (to the extent possible). Core and Guay (2002), however, present evidence contrary to this hypothesis. They find that firms award new stock and stock option grants to optimize CEO incentive levels. Their sample is taken from ExecuComp over the period 1992-1997.
25
R&D is insignificant in our base regression in Table 2, prior work has still found R&D to
be a significant determinant of productivity. We perform the third test because previous
studies have argued that leverage may also affect productivity indirectly through
investment. For example, Lang, Ofek and Stulz (1996) document that leverage is
negatively related to investment; this finding is attributed to the Myers (1977) under-
investment hypothesis or debt overhang. Finally, the occurrence of productivity shocks
over time may induce a correlation between productivity levels and firm volatility. Thus,
we also include volatility as a control variable. With these modifications to our empirical
model, we obtain results that are very similar to our main findings. In addition, R&D,
leverage and volatility have no additional effect on productivity in these alternative
specifications.
Second, we estimate some of our main regressions using an alternative
econometric specification. Although we believe that the dynamic panel estimator is the
most appropriate specification to use since productivity is persistent, we also
acknowledge the fact that the test for identifying the correct instrument set are weak
when there is a large number of instruments. Therefore, in Table 7 we provide some
we cannot correct for productivity persistence in this model we include covariates (such
as R&D and the concentration index) that we believe may proxy well for the lagged
dependent variable. We use all the instruments from the earlier dynamic panel models
and treat the CEO compensation variables as endogenous. Thus this specification corrects
for the endogeneity of compensation in the productivity regression but does not address
the productivity persistence issue.
26
We find that the main results are quite similar to those found in the dynamic panel
model, with a few differences. For most specifications the sign of all the control variables
are similar to earlier results. Firm size and age have a positive impact on productivity
similar to earlier results. The R&D variable has no impact and the market concentration
index is strongly negative in all specifications suggesting that less competition hinders
productivity growth. The CEO compensation variables show some minor differences in
sign when compared to the dynamic panel results. However, they are all at least an order
of magnitude larger than the earlier results.
Comparing column 1 in Table 7 to column 2 in Table 3 we find that for the static
results the productivity index increases by .008 percent in the latter and .08 percent in the
former when CEO holdings increase by 1 percent. The coefficients on delta show similar
differences in magnitude. Vega is positive and economically very significant in columns
3 and 4 (compared to Table 6 columns 1 and 2). We believe that the difference in results
is explained by the fact that we have omitted the lagged productivity variable from our
robustness regressions. The last column in Table 7, where a piece-wise function is
estimated, does not perform as well as the dynamic panel estimator. However, the
direction of effect is the same for all the significant coefficients. Thus, we find that even a
simple fixed effects IV model, that may be subject to omitted variable bias, gives us
similar results as the dynamic panel model.
IV. Conclusions and Extensions
There has been much interest in the effect of managerial ownership on a firm’s
financial performance. However, the empirical evidence is mixed and it is still unclear
whether managerial ownership has any effect on firm value. In this paper, we trace the
27
effects of CEO incentives on firm value to total factor productivity. In doing so, we
examine whether the stock and stock option ownership of CEOs have any real effects on
firm performance.
We have two main results: First, we find an inverse U-shaped relationship
between productivity and CEO delta, which suggests that the high CEO portfolio risk
associated with high delta discourages CEOs from undertaking risky positive-NPV,
productivity-enhancing projects. Second, we also find that CEO vega generally increases
productivity, consistent with stock option grants making CEOs less concerned with risk
due to the down-side protection it offers. However, for a range of delta values it may
actually reduce productivity, suggesting that stock option grants may not always achieve
their intended effect of making CEOs less risk-averse. These results highlight the
importance of careful structuring of CEO compensation contracts. Encouragingly, we
find that CEO incentives positively impact productivity for the vast majority of the firms
in our sample.
We also examine the relationship between productivity and firm value and find
that more productive firms have significantly higher Tobin’s q. Hence, a CEO’s
incentives for maximizing shareholder wealth are manifested in the relationship between
total factor productivity and CEO incentives. Productivity is thus an important
mechanism through which CEO incentives affect firm financial performance.
The focus of this paper has been on the relationship between firm productivity
and CEO incentives due to stock and stock option holdings. However, there is much
scope for future work. Equity-linked compensation, although a large component of CEO
pay, is not the only element. Sundaram and Yermack (2005) find that debt-based
compensation, such as pension plans, play an important role in determining the CEO’s
28
overall incentives. In particular, they find that high debt-based compensation results in
more conservative policy choices for the firm. Beyond executive compensation, we
expect that governance structures should also have a significant impact on firm
productivity. Numerous studies have examined the effect of board ownership, board
structure, shareholder rights and institutional ownership on firm financial performance.
A natural extension of this study would be to examine the effect of these various factors
on firm productivity.
29
Appendix A: Estimating Total Factor Productivity
Consider that firms have idiosyncratic efficiencies but face the same market
structure and factor prices. Firms produce output (y) using a fixed factor, capital (k), and
a variable input such as labor (l), as given by the equation below.
ititititit kly εωββα ++++= 210 (2)
In this equation, ωit is the efficiency parameter that is unobserved by the econometrician
but known by the firm when making investment and staffing decisions. εit is the
idiosyncratic error term. Endogeneity arises from the fact that, 1) the capital stock is
correlated with productivity through past productivity and selection bias, and 2) firms
with a larger capital stock may continue to produce even at low productivity levels. Thus
the coefficient on capital may be biased downward. The selection bias exists because
OLS does not control for firm exit, which may occur due to a negative productivity
shock.
Olley and Pakes (1996) have developed a methodology for the consistent
estimation of a firm-level production function. They assume that efficiency is a function
of investment and capital and that there exists a monotonic relationship between
investment and unobserved firm-level productivity. They then use this to correct for the
simultaneity issue. They correct for the selection bias by calculating the survival
probability of a firm. The primary condition that is needed to implement this
methodology is that firms have positive investment. For our sample of firms, this
condition is easily satisfied.
The estimation sample consists of US manufacturing firms from 1992 to 2003
that are included in Compustat and ExecuComp. We classify these manufacturing firms
30
into industry groups following the Fama-French 49 industry classification.26 The largest
industry group in our sample is ‘Chips’ and the smallest group is ‘Toys’. We calculate the
productivity estimates separately for each industry group since the underlying production
function parameters may be different across these groups.
The Olley-Pakes methodology yields consistent estimates of the production
function for each industry type.27 Table A1 provides these estimates. Over-all, the input
shares of labor and capital are consistent with the estimates of Palia and Lichtenberg
(1999) with the exception of electrical equipment, autos & trucks and computer
hardware, whose estimated share of capital is not significant. Electrical equipment and
computer hardware consist of small precision instruments so it is quite plausible that only
the share of labor is significant. The result for autos and trucks, on the other hand, is
surprising since we expect this to be a capital-intensive industry. Hence, we drop the
auto industry from our sample. As a robustness check, we performed our analyses
excluding the electrical equipment and hardware industries; our findings are unchanged.
Productivity is then calculated as the residual between the predicted and actual output.
As an alternative to this two-factor production function, we also estimate a
production function with labor, capital and materials as inputs; our main findings are
unchanged. Moreover, the closest proxy available for material inputs is cost of goods
sold (Compustat data item 41). This is a noisy measure of materials since it includes
other items such as wages and rent. Thus, our preferred specification is that with only
labor and capital as inputs to production.
26 We only include those industries that have at least 100 observations during our sample period to obtain reliable productivity estimates. The industries that do not meet this criterion are Beer and Liquor, Boxes (Shipping Containers), Business Services (Commercial Printing), Candy and Soda, Fabricated Products, Guns (Defense), Shipbuilding and Railroad Equipment, and Tobacco – totaling 455 observations. The industry grouping is from Ken French’s website. 27Both output and inputs to the production function are measured in logs.
31
Appendix B: Variable Construction All variables used as covariates are winsorized at the 1 % tails. (Compustat data item in parenthesis) A. Variables used in the Productivity Estimation Output = Sales (data12) deflated by the producer price index (PPI) at the four-digit SIC level28
Capital Stock = We use the perpetual inventory method to calculate the replacement value of the capital stock. The inputs are gross property plant and equipment (data7), depreciation (data14), capital expenditures (data128) and the price index for non-residential private fixed investment.29 See Salinger and Summers (1983) for more details. Labor = Employees (data29) Investment = Capital expenditures (data128) deflated by the price index for non-residential private fixed investment B. CEO Incentive Measures CEO Holdings = number of shares of the firm held by the CEO/total shares outstanding CEO delta = Equity delta + Option delta (or Equity delta if Option delta is missing)30
0atility/10return volstock *atilityreturn volstock /ueoption val
Equity value is the number of shares outstanding multiplied by the stock price. Option value is calculated using the Black-Scholes (1973) formula for European call options for every option grant j awarded to the CEO, accounting for dividends according to Merton (1973). We measure stock return volatility as the standard deviation of monthly returns for the previous 60 months, reported by ExecuComp. If this is missing, it is calculated using CRSP data.31 See Core and Guay (2002) for more details. CEO delta and vega are calculated in 2003 dollars.
28 The PPI is obtained from the Bureau of Labor and Statistics website. 29 This price index is obtained from the Bureau of Economic Analysis website. 30 There are 279 firm-year observations for which there is insufficient information to calculate the CEO’s option delta and vega. 31 Our findings are unchanged if we use the standard deviation of daily returns for the previous 252 trading days.
32
C. Variables used as Determinants of Productivity Firm Size = Log(Total Assets) (data6) 32
Firm age = current year – incorporation year33 where available; if the incorporation year is unavailable, we use the earliest year on CRSP that a firm has a positive stock price or the earliest year in Compustat that a firm has non-missing data for total assets Industry Concentration Index = Herfindahl Index based on Compustat data. This is given by: Σαi
2 where αi is the output (sales) share of each firm in the industry in that particular year and is summed over all firms in the industry. This is an industry concentration measure and the closer to zero this measure is, the more competitive the industry. R&D/K = R&D expenditures / net property, plant and equipment (data46/data8) R&D dummy = equals one if R&D is non-missing, equals zero otherwise; missing values of R&D are set to zero D. Additional Variables used in the Tobin’s q Regressions Tobin’s q = (data199*data25+ 10*data19 + data181)/data6, following Himmelberg, Hubbard and Palia (1999) Tangible Assets, K/S = net property, plant and equipment / sales (data8/data12) Investment, I/K = capital expenditures / net property, plant and equipment (data128/data8) E. Additional Variables Used as Instruments for CEO Incentive Measures CEO Tenure = current year – year the executive became CEO, as reported in ExecuComp Advertising/K = Advertising expenditures / net property, plant and equipment (data45/data8) Advertising dummy = equals one if Advertising is non-missing, equals zero otherwise; missing values of Advertising are set to zero Volatility = the standard deviation of the previous 60 months stock returns, reported by ExecuComp, and if missing, is calculated from CRSP Book leverage = (data6-book equity)/data6 where book equity = (data6 – data181 + data35 – data10)
32 The use of total sales as a measure of firm size leaves our results mostly unchanged and qualitatively similar. We remain cautious however, with this alternative specification because total sales is the measure of output in the productivity estimation. 33 We are grateful to John Ritter for the use of his data on incorporation dates.
33
References Agrawal, Anup and Charles R. Knoeber, 1996, “Firm Performance and Mechanisms to
Control Agency Problems between Managers and Shareholders,” Journal of Financial and Quantitative Analysis, Vol. 31(3), pp. 377-397.
Arellano, Manuel and Stephen Bond, 1991, “Some tests of specification for panel data:
Monte Carlo evidence and an application to employment equations,” Review of Economic Studies, Vol. 58, pp. 277-297.
Aw, Bee Yan, Xiaomin Chen and Mark J. Roberts, 2001, “Firm-level Evidence on
Productivity Differentials and Turnover in Taiwanese Manufacturing,” Journal of Development Economics, Vol. 66(1), pp. 51-86.
Bartelsman, Eric J. and Mark Doms, 2000, “Understanding Productivity: Lessons from
Barth, Erling, Trygve Gulbrandsen, and Pål Schøne, 2005, “Family Ownership and
Productivity: The Role of Owner-Management,” Journal of Corporate Finance, Vol. 11, pp. 107-127.
Basant, Rakesh and Brian Fikkert, 1996, “The Effects of R&D, Foreign Technology
Purchase, and Domestic and International Spillovers on Productivity in Indian Manufacturing Firms,” Review of Economics and Statistics, Vol. 782, pp. 187 – 199.
Basu, Susanto, John G. Fernald, and Matthew D. Shapiro, 2001, “Productivity Growth in
the 1990s: Technology, Utilization or Adjustment?” Carnegie-Rochester Conference Series on Public Policy, Vol. 55, pp. 117-165.
Berle, Adolph and Gardiner Means, 1932, The Modern Corporation and Private Property,
Macmillan, New York. Biesebroeck, Johannes V., 2004. "Robustness of Productivity Estimates," NBER Working
Paper No. 10303 Black, Fischer and Myron Scholes, 1973, “The Pricing of Options and Corporate
Liabilities,” Journal of Political Economy, Vol. 81, pp. 637-659. Black, Sandra. E. and Lisa M. Lynch, 2003, “What’s driving the New Economy: The
Benefits of Workplace Innovation,” California Centre for Population Research Working Paper, CCPR-017-03.
Brick, Ivan E., Darius Palia, and Chia-Jane Wang, 2005, "Simultaneous Estimation of
CEO Compensation, Leverage, and Board Characteristics on Firm Value", Working paper.
Cadman, Brian, Sandy Klasa and Steve Matsunaga, 2006, “Evidence on How Systematic Differences Between ExecuComp and non-ExecuComp Firms Can Affect Empirical Research Results,” Northwestern University Working Paper
Carpenter, Jennifer N., 2000, “Does Option Compensation Increase Managerial Risk
Appetite?” Journal of Finance, Vol. 55, pp. 2311-2331. Claessens, Stijn, Simeon Djankov, Joseph P. H. Fan and Larry H. P. Lang, 2002,
“Disentangling the Incentive and Entrenchment Effect of Large Shareholdings,” University of Amsterdam, Working Paper.
Cho, Myeong-Hyeon, (1998), “Ownership Structure, Investment, and the Corporate
Value: An Empirical Analysis,” Journal of Financial Economics, Vol. 47, pp. 103-121.
Coles, Jeffrey L., Naveen D. Daniel, and Lalitha Naveen, 2006, “Managerial Incentives
and Risk-Taking,” Journal of Financial Economics, Vol. 79, pp. 431-468. Coles, Jeffrey L., Michael L. Lemmon, and Felix Meschke, 2007, “Structural Models and
Endogeneity in Corporate Finance: The Link Between Managerial Ownership and Corporate Performance,” Working Paper, Arizona State University.
Core, John and Wayne Guay, 1999, “The Use of Equity Grants to Manage Optimal
Equity Incentive Levels,” Journal of Accounting and Economics, Vol. 28, pp. 151-184.
Core, John and Wayne Guay, 2002, “Estimating the Value of Employee Stock Option
Portfolios and Their Sensitivities to Price and Volatility,” Journal of Accounting Research, Vol. 40(3), pp. 613-630.
Cui, Huimin and Y.T. Mak, 2002, “The Relationship Between Managerial Ownership
and Firm Performance in High R&D Firms,” Journal of Corporate Finance, Vol. 8, pp. 313-336.
Demsetz, Harold, 1983, “The Structure of Ownership and the Theory of the Firm,”
Journal of Law and Economics, Vol. 26, pp. 375-390. Demsetz, Harold and Belen Villalonga, 2001, “Ownership Structure and Corporate
Performance,” Journal of Corporate Finance, Vol. 7, pp. 209-233. Fama, Eugene F. and Michael C. Jensen, 1983, “Separation of Ownership and Control,”
Journal of Law and Economics, Vol. 26, pp. 301-325. Griliches, Zvi, 1980, “R&D and Productivity Slowdown,” American Economic Review,
Papers and Proceedings of the Ninety-Second Annual Meeting of the American Economic Association, Vol. 70(2), pp. 343-348.
35
Griliches, Zvi, 1986, “Productivity, R&D, and Basic Research at the Firm Level in the 1970’s,” American Economic Review, Vol. 76(1), pp. 141-154.
Griliches, Zvi and Frank R. Lichtenberg, 1984, “Interindustry Technology Flows and
Productivity Growth: A Reexamination”, Review of Economics and Statistics, Vol. 66(2), pp. 324-329.
Guay, Wayne, 1999, “The Sensitivity of CEO Wealth to Equity Risk: An Analysis of the
Magnitude and Determinants,” Journal of Financial Economics, Vol. 53, pp. 43-71.
Hall, Brian J. and Jeffrey B. Liebman, 1998, “Are CEOs Really Paid Like Bureaucrats?”
Quarterly Journal of Economics, Vol. 113, pp. 653-691. Haltiwanger, John C., Lulia I. Lane, and James R. Speltzer, 1999, “Firm Size and Wages
- Productivity Differences Across Employers: The Roles of Employer Size, Age, and Human Capital”, American Economic Review, Vol. 89(2), pp. 94 – 99.
Haskell, Jonathan E., Sonia C. Pereira, and Matthew J. Slaughter, 2004, “Does Inward
Foreign Direct Investment Boost the Productivity of Domestic Firms”, Working Paper.
Hermalin, Benjamin E., and Michael S. Weisbach, 1991, “The Effects of Board
Composition and Direct Incentives on Firm Performance,” Financial Management, Vol. 20, pp. 101-112.
Himmelberg, Charles P., Glenn R. Hubbard, and Darius Palia, 1999, “Understanding the
Determinants of Managerial Ownership and The Link Between Ownership and Performance,” Journal of Financial Economics, Vol. 53, pp. 353-384.
Holderness, Clifford G., Randall S. Kroszner, and Dennis P. Sheehan, 1999, “Were the
Good Old Days That Good? Evolution of Managerial Stock Ownership and Corporate Governance Since the Great Depression,” Journal of Finance, Vol. 54, pp. 435-469.
Huergo, Elena and Jordi Jaumandreu, 2004, “Firms’ Age, Process Innovation and
Productivity Growth”, International Journal of Industrial Organization, Vol. 22(4), pp. 541 – 561.
Jensen, Michael C., 1986, “Agency Costs of Free Cash Flow, Corporate Finance and
Takeovers,” American Economic Review, Vol. 76(2), pp. 323-329. Jensen, Michael C. and William Meckling, 1976, “Theory of the Firm: Managerial
Behavior, Agency Costs and Ownership Structure,” Journal of Financial Economics, Vol. 3, pp. 305-360.
36
Jensen, Michael C., Kevin J. Murphy and Eric G. Wruck, 2004, “Remuneration: Where we’ve been, how we got to here, what are the problems and how to fix them,” ECGI Finance Working Paper # 44.
Jensen, Michael C. and Jerold B. Warner, 1988, “The Distribution of Power Among
Corporate Managers, Shareholders and Directors,” Journal of Financial Economics, Vol. 3, pp. 3-24.
Keller, Wolfgang, 1997, “Are International R&D Spillovers Trade-Related? Analyzing
Spillovers Among Randomly Matched Trade Partners”, European Economic Review, Vol. 42(8), pp. 1469 – 1483.
Growth”, NBER Working Paper Series, No. 6990. Keller, Wolfgang and Stephen R.Yeaple, 2003, “Multinational Enterprises, International
Trade and Productivity Growth: Firm Level Evidence From the United States”, NBER Working Paper Series, No. 9504.
Köke, Jens F. and Luc Renneboog, 2005, “Do Corporate Control and Product Market
Competition Lead to Stronger Productivity Growth? Evidence from Market-Oriented Blockholder-Based Governance Regimes,” Journal of Law and Economics, Vol. 48, pp. 475-516.
Lang, Larry, Eli Ofek and Rene M. Stulz, 1996, “Leverage, Investment, and Firm
Growth,” Journal of Financial Economics, Vol. 40, pp. 3-29. Lehr, Bill and Frank Lichtenberg, 1997, “Information Technology and Its Impact on
Firm-Level Productivity: Evidence from Government and Private Data Sources”, Centre for Study of Living Standards Conference on Service Sector Productivity and the Productivity Paradox, Working Paper.
Loderer, Claudio and Kenneth Martin, 1997, “Executive Stock Ownership and
Performance: Tracking Faint Traces,” Journal of Financial Economics, Vol. 45, pp. 223-255.
McConnell, John J. and Henri Servaes, 1990, “Additional Evidence on Equity Ownership
and Corporate Value,” Journal of Financial Economics, Vol. 27, pp. 595-612. Merton, Robert, 1973, “Theory of Rational Option Pricing,” Bell Journal of Economics
and Management Science, Vol. 4, pp. 141-183. Morck, Randall, Andrei Shleifer, and Robert W. Vishny, 1988, “Management Ownership
and Market Valuation: An Empirical Analysis,” Journal of Financial Economics, Vol. 20, pp. 293-315.
37
Murphy, Kevin J., 1999, “Executive Compensation,” Handbook of Labor Economics, Ashenfelter, O., Card, D. (editors), Elsevier Science, North Holland, Vol. 3b, pp.2485-2563.
Myers, Stewart C., 1977, “Determinants of Corporate Borrowing,” Journal of Financial
Economics, Vol. 5, pp. 147-175. Nickell, Stephen, Daphne Nicolitsas, and Neil Dryden, 1997, “What Makes Firms
Perform Well?” European Economic Review, Vol. 41, pp.783-796. Olley, Steven G. and Ariel Pakes, 1996, “The Dynamics of Productivity in the
Telecommunications Equipment Industry,” Econometrica, Vol. 64(6), pp. 1263 – 1298.
Plant-Level Evidence from Turkish Manufacturing Firms,” Working Paper. Palia, Darius, 2001, “The Endogeneity of Managerial Compensation in Firm Valuation:
A Solution,” Review of Financial Studies, Vol. 14(3), pp. 735-764. Palia, Darius and Frank Lichtenberg, 1999, “Managerial Ownership and Firm
Performance: A Re-Examination Using Productivity Measurement,” Journal of Corporate Finance, Vol. 5, pp. 323-339.
Pavcnik, Nina, 2002,“Trade Liberalization, Exit and Productivity Improvements:
Evidence from Chilean Plants”, Review of Economic Studies, Vol. 69(238), pp.245-276 .
Perez-Gonzales, Francisco, 2004, “The Impact of Acquiring Control on Productivity,”
Working paper, Columbia University. Perry, Todd and Marc Zenner, 2000, “CEO Compensation in the 1990s: Shareholder
Alignment or Shareholder Expropriation?” Wake Forest Law Review, Vol. 35, pp. 123-152.
Rogers, Mark, 2004,“Competition, Agency and Productivity,” International Journal of
the Economics of Business, Vol. 11(3), pp. 349-367. Ross, Stephen A., 2004, “Compensation, Incentives, and the Duality of Risk Aversion
and Riskiness,” Journal of Finance, Vol. 59(1), pp. 207-225. Salinger, Michael A. and Lawrence Summers, 1983, “Tax reform and corporate
investment: A microeconomic simulation study,” Behavioral Simulation Methods in Tax Policy Analysis, edited by M. Feldstein, Chicago: University of Chicago Press, pp. 247-286
38
Smith, Clifford W. and Rene M. Stulz, 1985, “The Determinants of Firm’s Hedging Policies,” Journal of Financial and Quantitative Analysis, Vol. 20(4), pp. 391-405.
Soderbom, Mans M. and Francis Teal, 2001, “Firm Size and Human Capital as
Determinants of Produtivity and Earnings,” Working Paper, University of Oxford. Sundaram, Rangarajan K. and David L. Yermack, 2005, “Pay Me Later: Inside Debt and
Its Role in Managerial Compensation,” Journal of Finance, forthcoming. Tang, Jianmin and Weiming Wang, 2005, “Product Market Competition, Skill Shortages
and Productivity: Evidence from Canadian Manufacturing Firms”, Journal of Productivity Analysis, Vol. 23(3), pp. 317-33.
Tirole, Jean, 1999, “Incomplete Contracts: Where do we stand?” Econometrica, Vol.
67(4), pp. 741-781. Windmeijer, Frank, 2005, “A finite sample correction for the variance of linear efficient
two-step GMM estimators,” Journal of Econometrics, Vol. 126, pp. 25-51.
Figure 1. The solid line represents the average CEO compensation package (2002 dollars) that includes salary, bonus, stock and options, for S&P 500 firms. This data is taken from Jensen, Murphy and Wruck (2004). The dashed line represents total factor productivity, whose estimation is described in Section I. This data covers 20 manufacturing industries from Compustat and Execucomp.
Quadratic Model
0.00
0.20
0.40
0.60
0.80
1.00
1.20
0 2 4 6 8
CEO Delta ($M)
Prod
uctiv
ity In
dex
Pred
icte
d V
alue
s
10
Figure 2: The solid line represents predicted values of the productivity index as a quadratic function of CEO delta, estimated from Table 4, column 5. The region between the dashed lines represents the 95 % confidence interval. The maximum productivity level is achieved at CEO delta = $5 million.
40
Cubic Model
0.00
0.20
0.40
0.60
0.80
1.00
0 2 4 6 8
CEO Delta ($M)
Prod
uctiv
ity In
dex
Pred
icte
d V
alue
s
10
Figure 3: The solid line represents predicted values of the productivity index as a cubic function of CEO delta, estimated from Table 4, column 6. The region between the dashed lines represents the 95 % confidence interval. The local maximum and minimum levels of productivity are achieved at $2.3 million and $8.3 million respectively.
Figure 4: Relationship between CEO delta, vega and productivity. Delta and vega are measured in millions of dollars. Productivity is the productivity index described in Section I.
Notes: The primary sample of 6,636 observations is based on non-missing observations for the productivity index, lagged productivity index, total assets, firm age and CEO holdings. Total assets, total sales, delta and vega are reported in 2003 dollars.
R&D/K 1 AD/K 0.1519 1 CEO Holdings -0.0147 0.1194 1 CEO Delta -0.0301 0.1616 0.4592 1 CEO Vega -0.0546 0.0104 -0.154 0.2783 1 CEO Tenure 0.0142 0.0008 0.3056 0.2479 0.0085 1
TABLE 2 EXPLAINING LONG-RUN AND SHORT-RUN FIRM PERFORMANCE
(1) (2) Dependent Variable Productivity Index
Tobin’s Q
Lagged Productivity Index 0.468*** (0.047) Productivity Estimate 0.464*** (0.121) Firm Age 0.075*** (0.009) Log(Assets) 0.049* -0.396*** (0.029) (0.063) Lagged Industry Concentration -0.027 -0.014 Index (0.064) (0.128) R&D/K -0.019 0.153 (0.044) (0.126) Tangible Assets, K/S -0.424* (0.250) Investment, I/K 1.294*** (0.239) Advertising/K 0.033 (0.203) Book Leverage -0.974*** (0.211) Volatility -0.006** (0.002) Relevant Statistics Observations 6596 6341 Number of Firms 902 908 Wald Statistic 942.628 Hansen J Statistic p-value 0.000 Arellano-Bond m2 Statistic p-value 0.984 Adjusted R-Square 0.142 F Statistic 21.345
Notes: Col 1: Arellano-Bond dynamic panel data estimation (difference-GMM). Unbalanced Panel. Range 1992- 2003. All specifications contain year fixed effects. Windmeijer (2005) robust standard errors are reported in parenthesis. * significant at 10%; ** significant at 5%; *** significant at 1%. The Hansen J test is a test of over-identifying restrictions. The Arellano-Bond m2 test is a test of lack of serial correlation in the error term. For both tests, p-values less than 0.10 reject the validity of the instruments. Col 2: Firm fixed effects estimation. Unbalanced Panel. Range 1992- 2003. Q is restricted to be less than 10. All specifications contain year fixed effects. The smaller sample size in column (3) is due to missing data in the construction of book leverage. Standard errors (in parentheses) are robust and clustered by firm. * significant at 10%; ** significant at 5%; *** significant at 1%. Robustness checks include: 1) the addition of log(assets) squared and tangible assets squared as explanatory variables, and 2) substituting the productivity index for the productivity estimate.
Notes: Arellano-Bond dynamic panel data estimation (difference-GMM).Unbalanced Panel. Range 1992 – 2003. All specifications contain year fixed effects. Additional pre-determined variables used as instruments in the estimation: CEO tenure, volatility, R&D/K, Advertising/K, book leverage, and R&D and Advertising dummies. Windmeijer (2005) robust standard errors are reported in parentheses: * significant at 10%; ** significant at 5%; *** significant at 1%. The Hansen J test is a test of over-identifying restrictions. The Arellano-Bond m2 test is a test of lack of serial correlation in the error term. For both tests, p-values less than 0.10 reject the validity of the instruments.
Notes: Arellano-Bond dynamic panel data estimation (difference-GMM).Unbalanced Panel. Range 1992 – 2003. All specifications contain year fixed effects. Additional pre-determined variables used as instruments in the estimation: CEO tenure, volatility, R&D/K, Advertising/K, book leverage, and R&D and Advertising dummies. Windmeijer (2005) robust standard errors are reported in parentheses: * significant at 10%; ** significant at 5%; *** significant at 1%. The Hansen J test is a test of over-identifying restrictions. The Arellano-Bond m2 test is a test of lack of serial correlation in the error term. For both tests, p-values less than 0.10 reject the validity of the instruments.
46
TABLE 5 INFLUENCE OF CEO DELTA: PIECE-WISE LINEAR SPECIFICATION
Notes: Arellano-Bond dynamic panel data estimation (difference-GMM).Unbalanced Panel. Range 1992 – 2003. All specifications contain year fixed effects. Additional pre-determined variables used as instruments in the estimation: CEO tenure, volatility, R&D/K, Advertising/K, book leverage, and R&D and Advertising dummies. Windmeijer (2005) robust standard errors are reported in parentheses: * significant at 10%; ** significant at 5%; *** significant at 1%. The Hansen J test is a test of over-identifying restrictions. The Arellano-Bond m2 test is a test of lack of serial correlation in the error term. For both tests, p-values less than 0.10 reject the validity of the instruments. Delta1=Delta if 0< Delta ≤ P1, and equals P1 if Delta > P1. Delta2=0 if 0< Delta ≤ P1, equals Delta –P1 if P1< Delta ≤ P2, and equals P2-P1 if Delta > P2. Delta2=0 if P1=P2. Delta3=0 if Delta ≤ P2, and equals Delta-P2 if Delta > P2. Top percentiles (P1 and P2) for Delta are the following: 95th= $2.26M, 96th=$2.69M, 97th=$3.34M, 98th=$4.34M, 99th=$8.24M.
Notes: Arellano-Bond dynamic panel data estimation (difference-GMM).Unbalanced Panel. Range 1992 – 2003. All specifications contain year fixed effects. Additional pre-determined variables used as instruments in the estimation: CEO tenure, volatility, R&D/K, Advertising/K, book leverage, and R&D and Advertising dummies. Windmeijer (2005) robust standard errors are reported in parentheses: * significant at 10%; ** significant at 5%; *** significant at 1%. The Hansen J test is a test of over-identifying restrictions. The Arellano-Bond m2 test is a test of lack of serial correlation in the error term. For both tests, p-values less than 0.10 reject the validity of the instruments. Delta1=Delta if 0< Delta ≤ P, and equals P if Delta > P. Delta2=0 if 0 Delta ≤ P, and equals Delta-P if Delta > P. The threshold point, P, for Delta is the 98th percentile ($4.34M). Similar results are obtained using threshold values equal to the 95th, 96th, and 97th percentiles.
48
TABLE 7 ROBUSTNESS TESTS
Dependent Variable: Productivity Index (1) (2) (3) (4) (5) CEO Incentives
Notes: Fixed effects instrumental variable panel data estimation.Unbalanced Panel. Range 1992 – 2003. All specifications contain year fixed effects and a constant term. Instruments in the estimation: CEO tenure, volatility, R&D/K, Advertising/K, book leverage, and R&D and Advertising dummies. Standard errors are reported in parentheses: * significant at 10%; ** significant at 5%; *** significant at 1%. Delta1=Delta if 0< Delta ≤ P, and equals P if Delta > P. Delta2=0 if 0 Delta ≤ P, and equals Delta-P if Delta > P. The threshold point, P, for Delta is the 98th percentile ($4.34M). Similar results are obtained using threshold values equal to the 95th, 96th, and 97th percentiles.
49
TABLE A1
PRODUCTION FUNCTION ESTIMATES BY INDUSTRY: OLLEY-PAKES (1996) METHODOLOGY Manufacturing Industries (SIC codes 2000-3999)
Notes: The production function is estimated separately by industry. Productivity is calculated as the residual between the predicted and actual output. We follow the Fama-French 49 industry classification taken from Ken French’s website. Data is from Compustat and ExecuComp for the period 1992-2003.
TABLE A2 PRODUCTIVITY INDEX VALUES BY INDUSTRY AND YEAR
Manufacturing Industries (SIC codes 2000-3999)
1993 1998 2003 Industry Mean Median Mean Median Mean Median
Median 0.28 0.30 0.37 0.36 0.34 0.36Notes: The productivity index is constructed as follows: pindxit=prodv_estit – prodv_estj,1992, where prodv_estit is the productivity estimate for firm i in year t and prodv_estj,1992 is the mean productivity estimate for industry j in 1992. We follow the Fama-French 49 industry classification taken from Ken French’s website. Data is from Compustat and ExecuComp for the period 1992-2003.
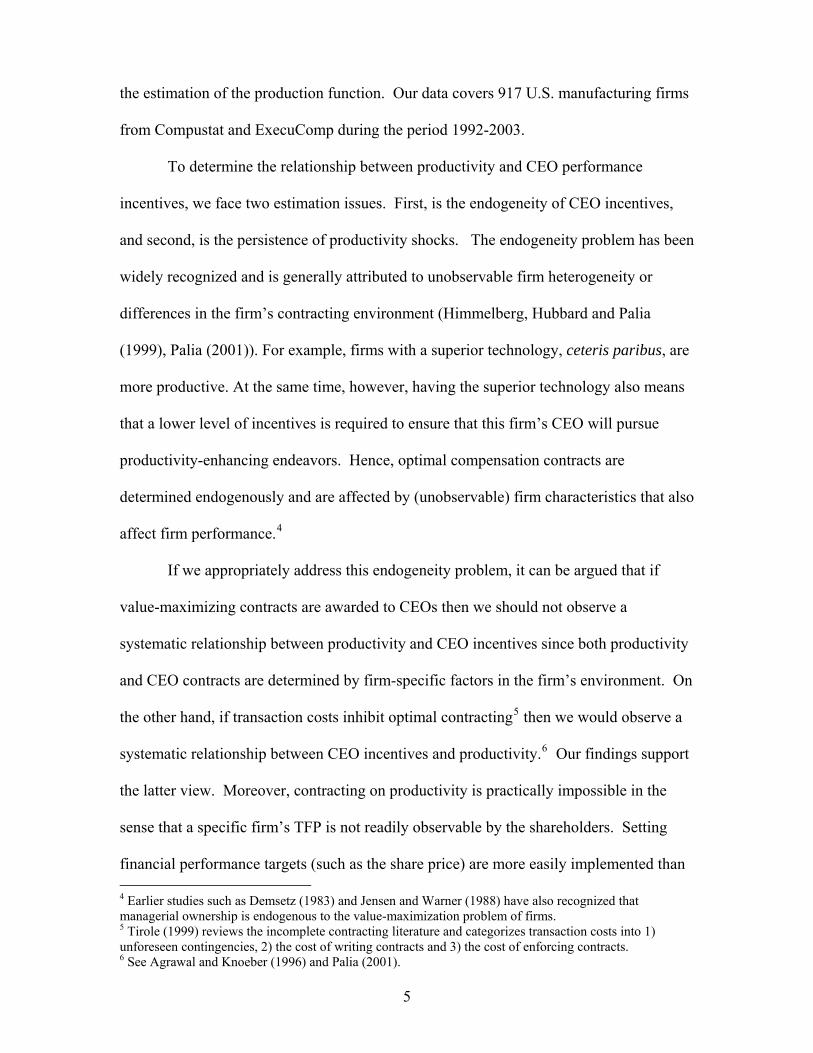
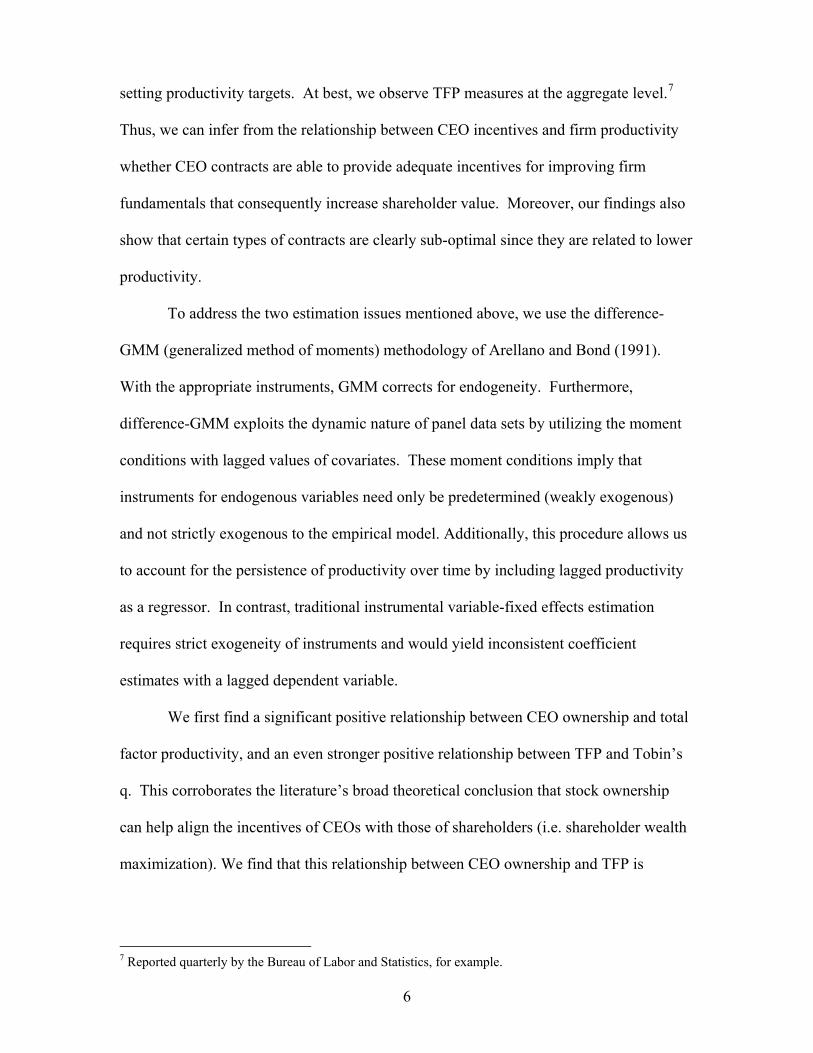
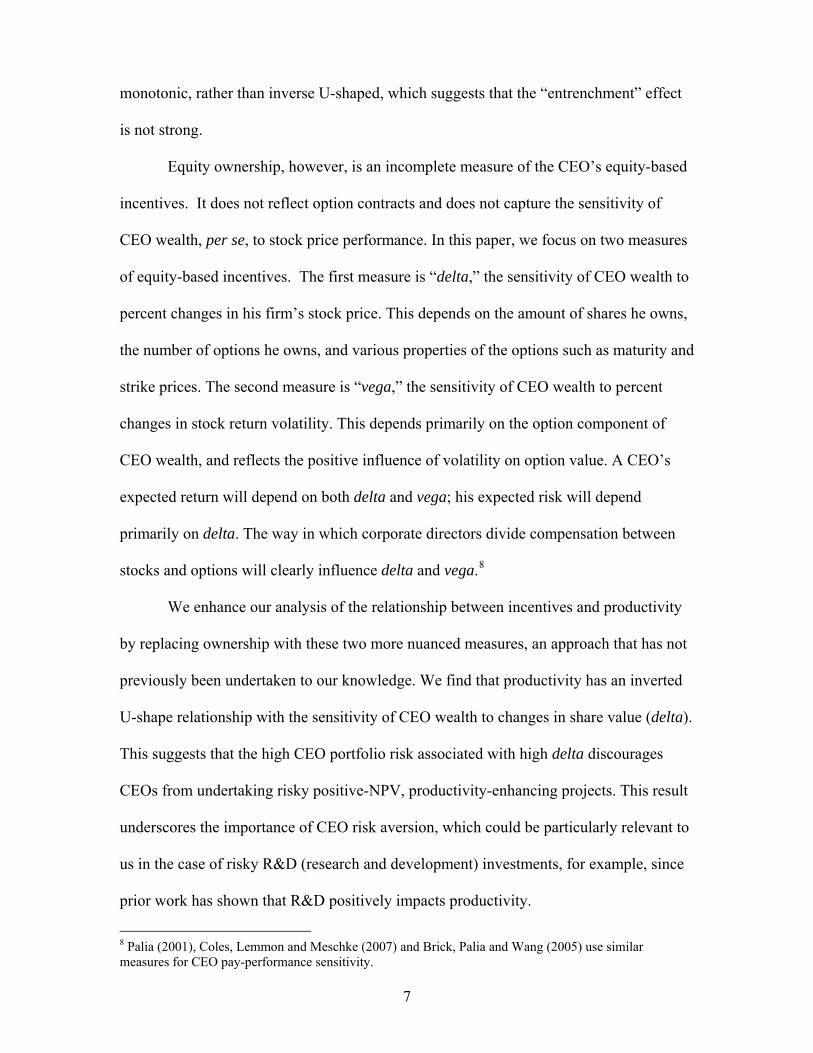
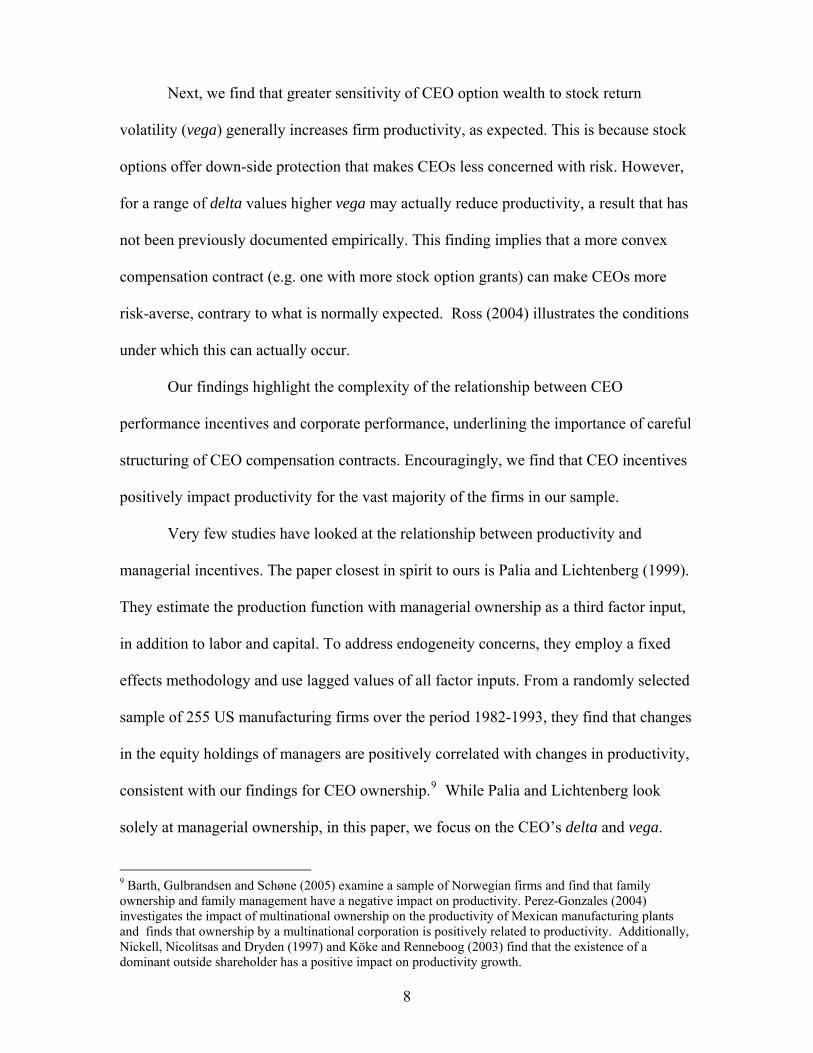
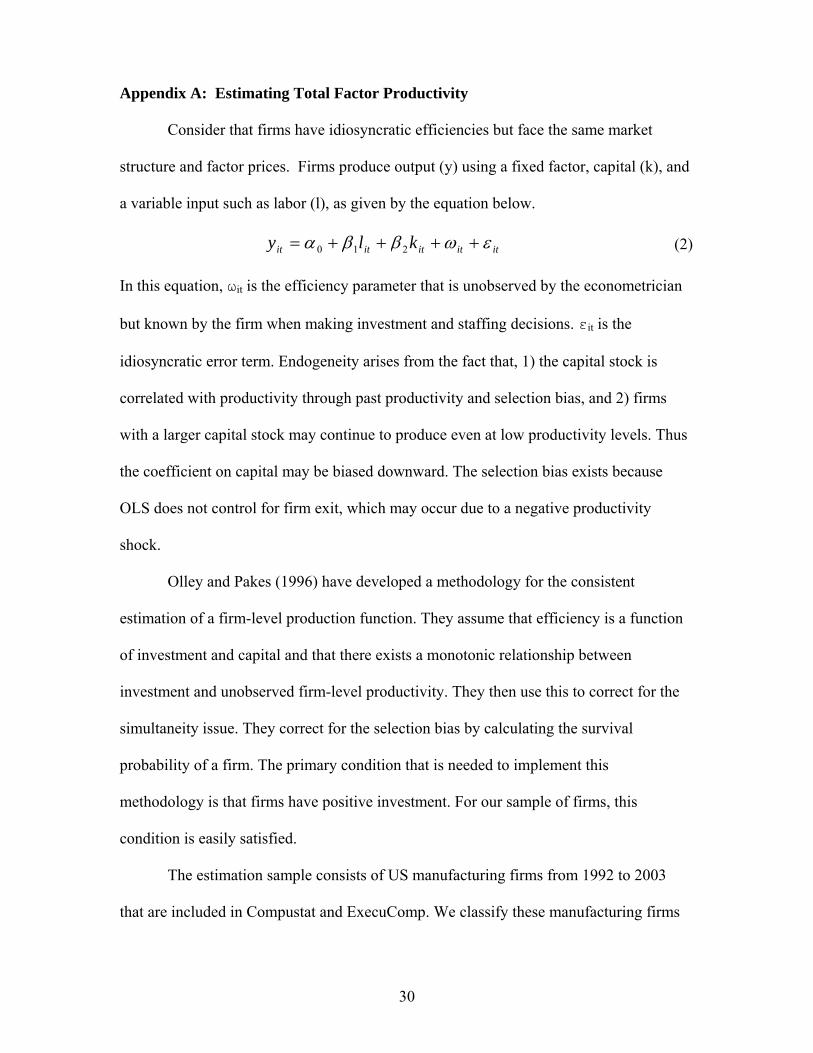
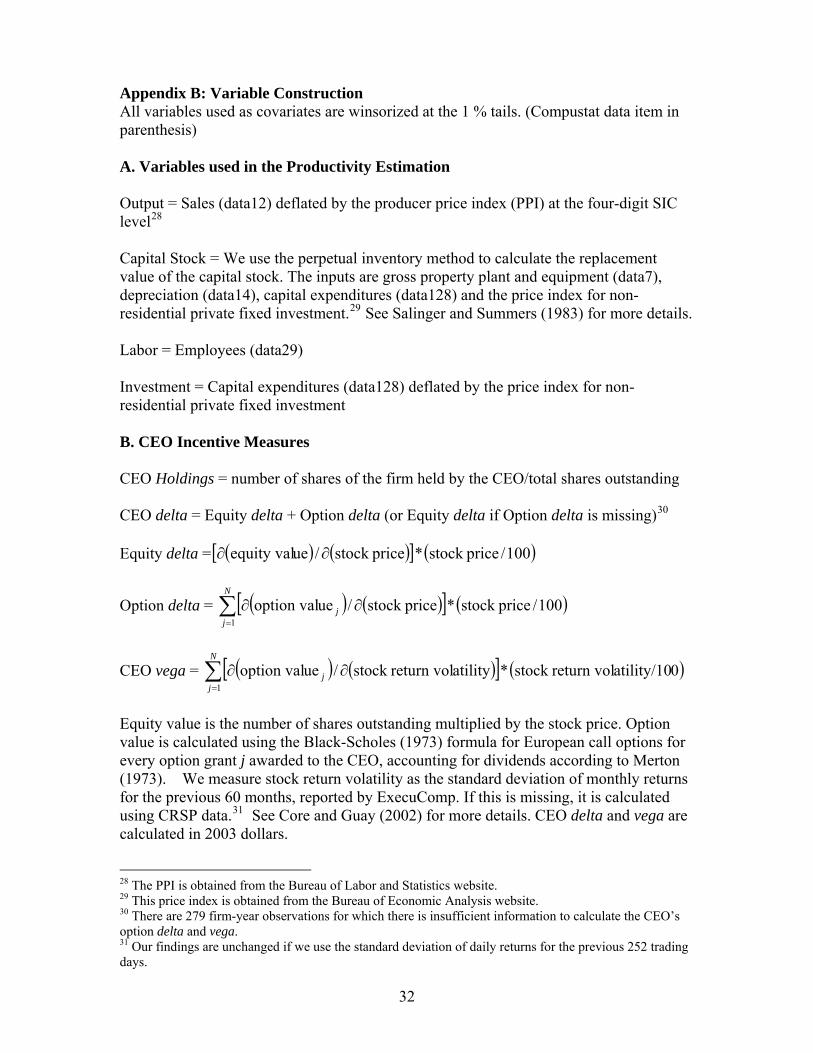
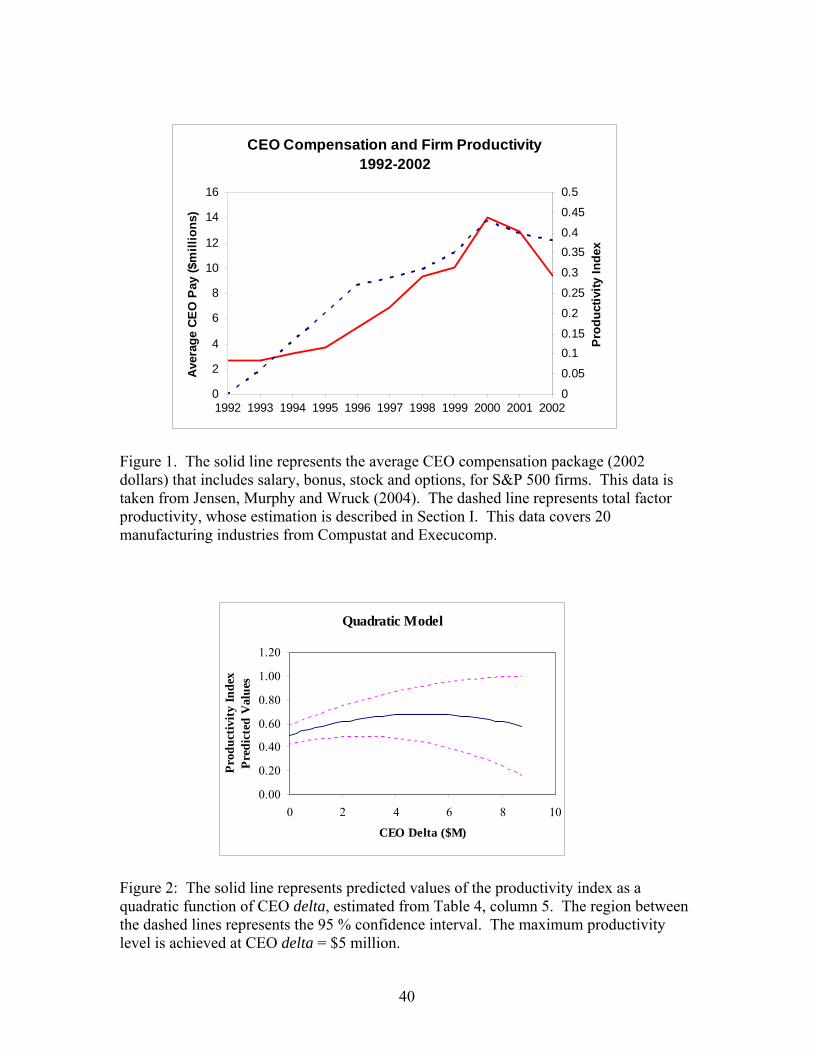
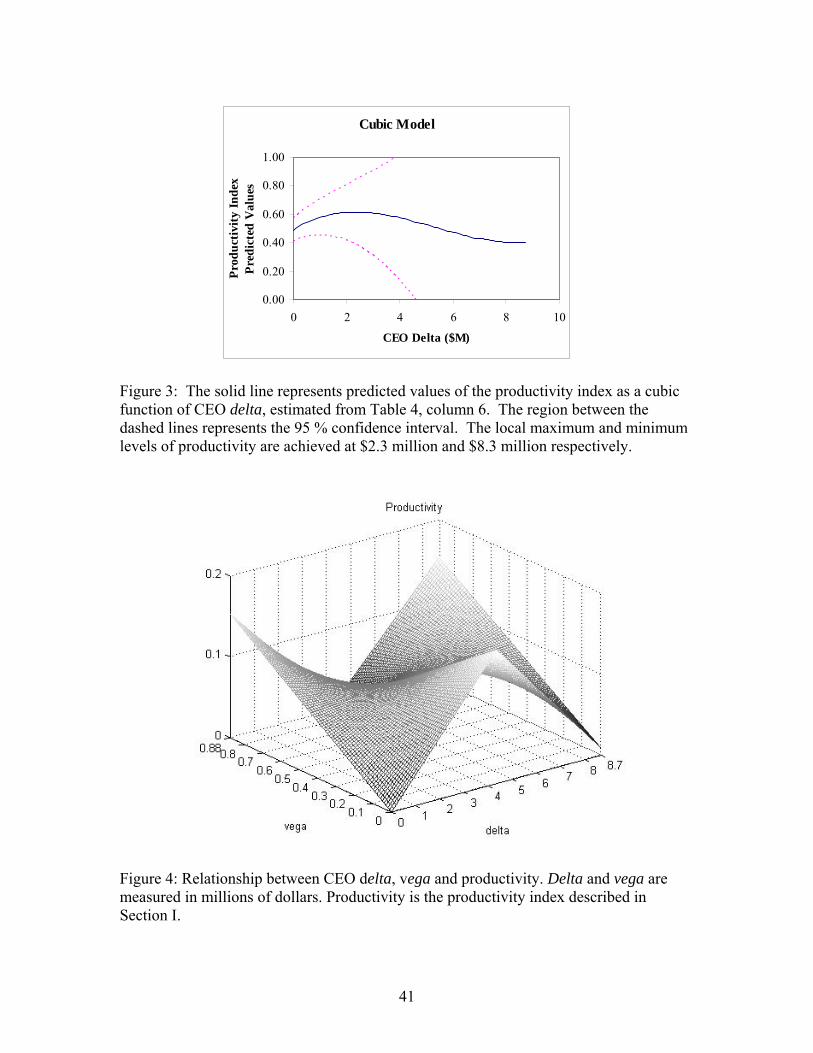
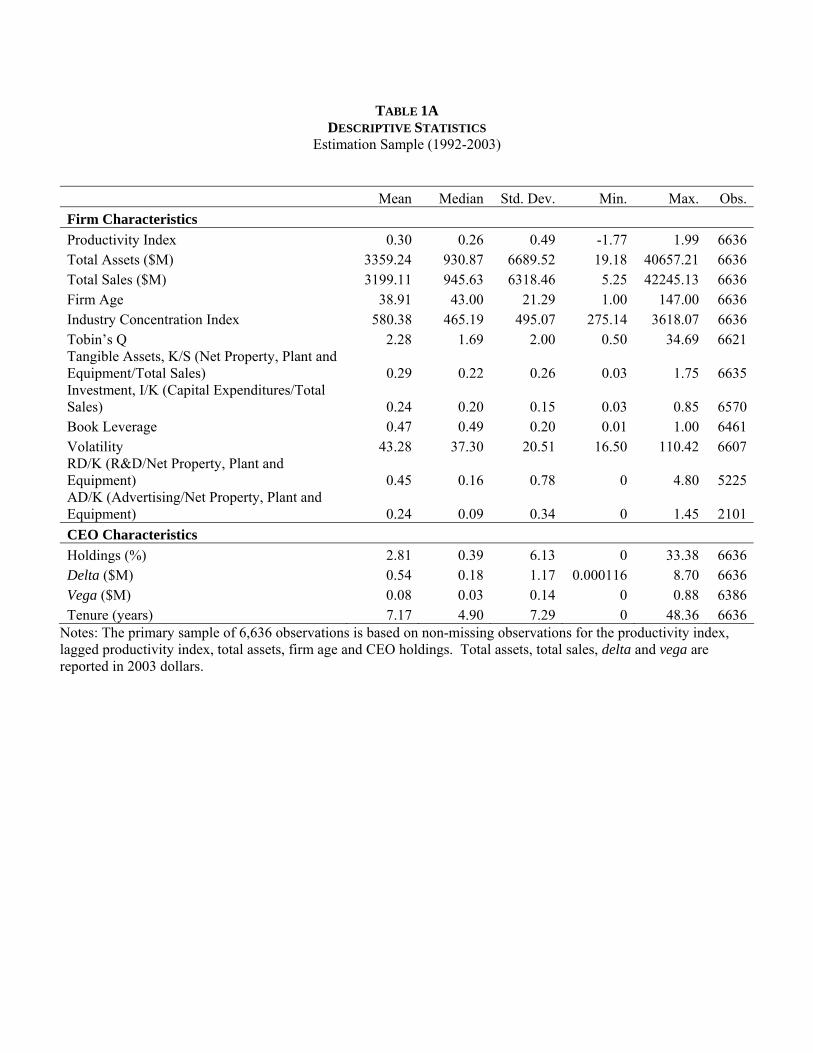
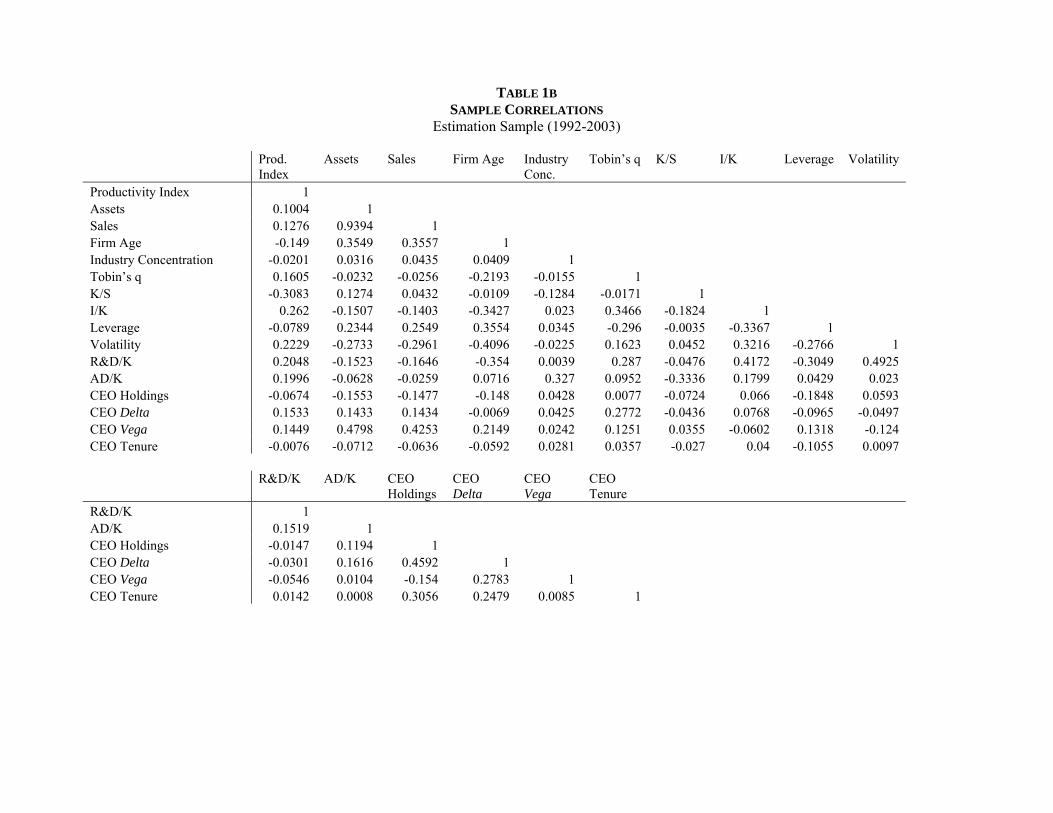
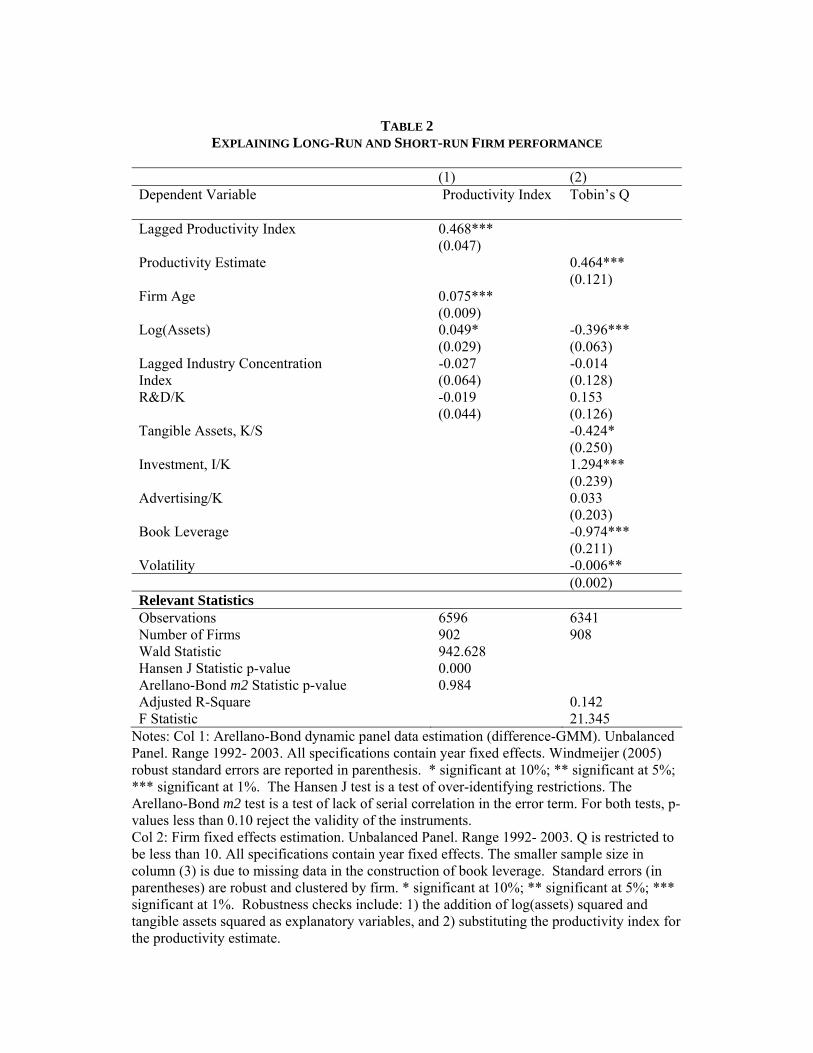
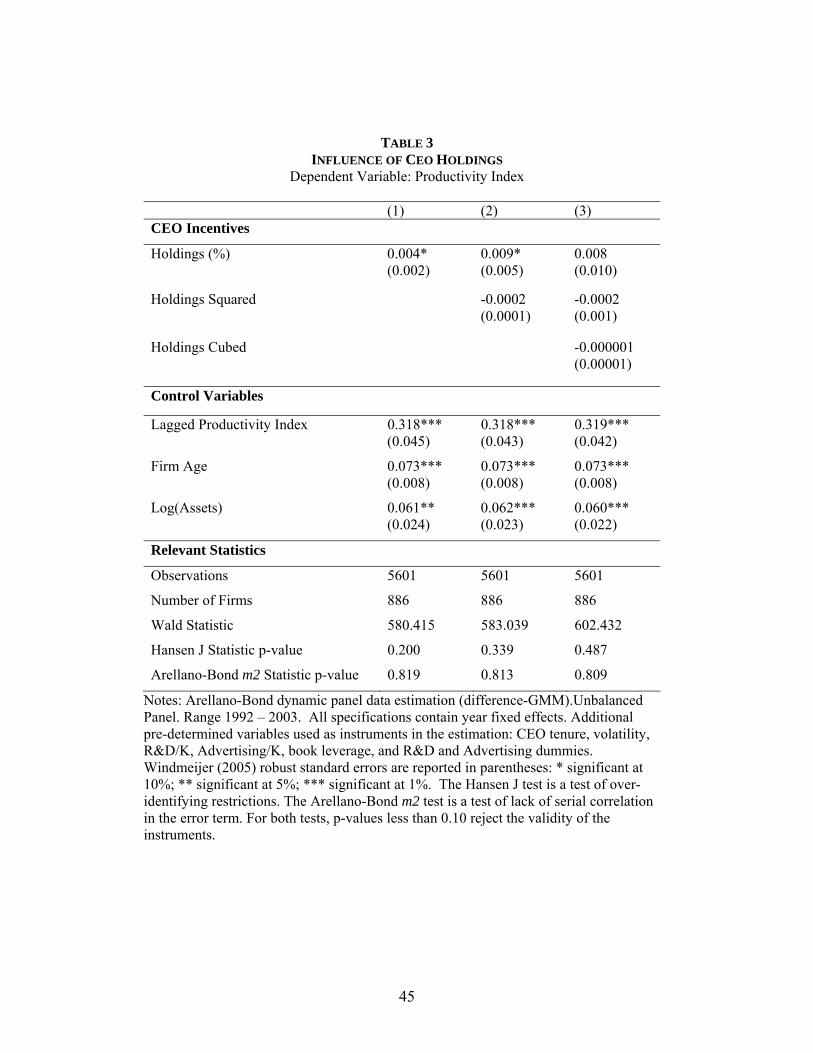
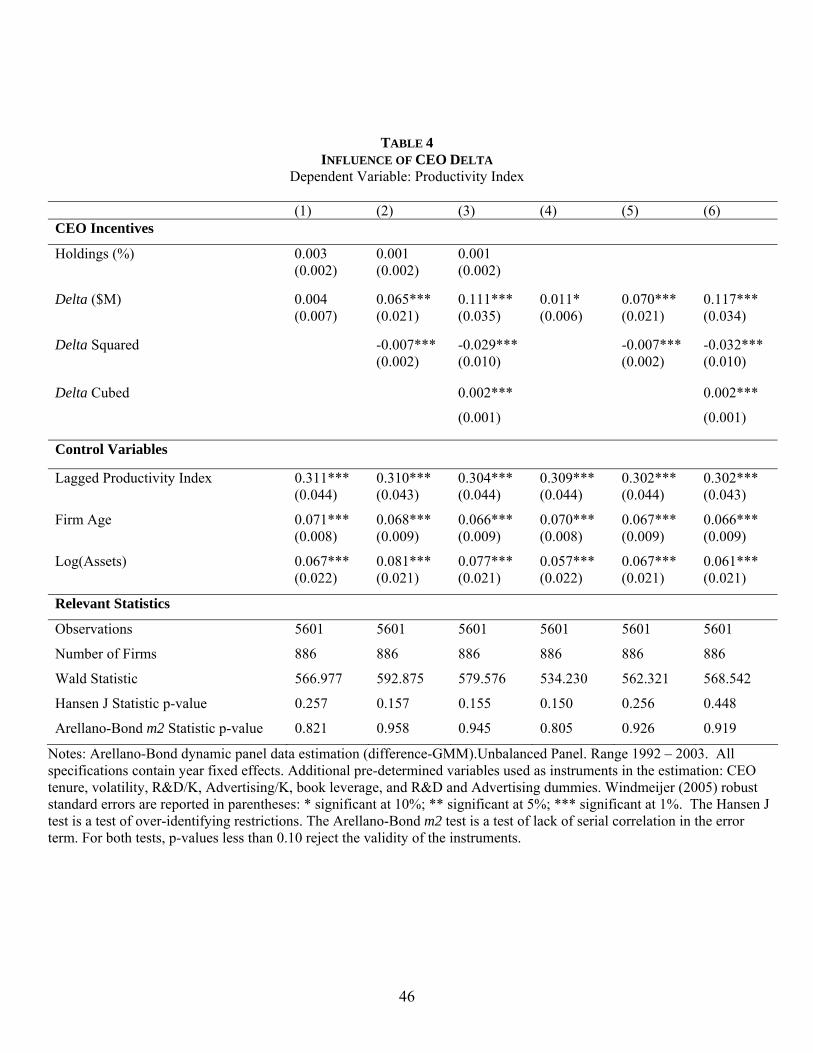
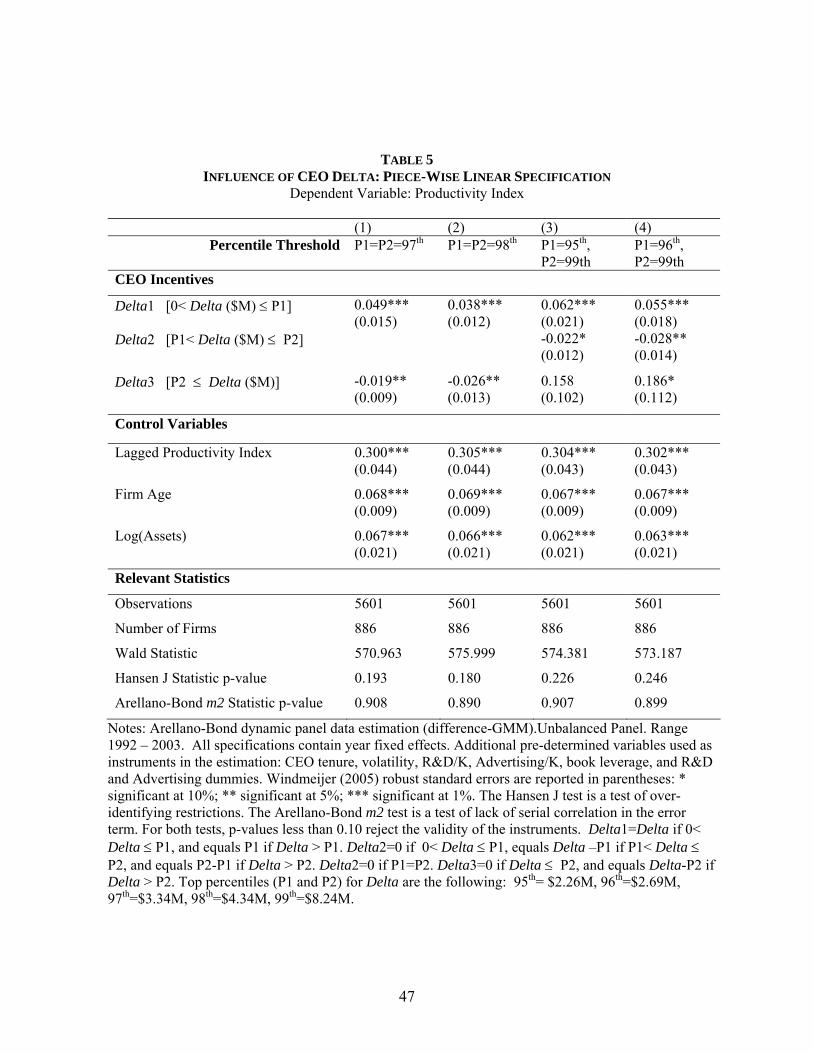
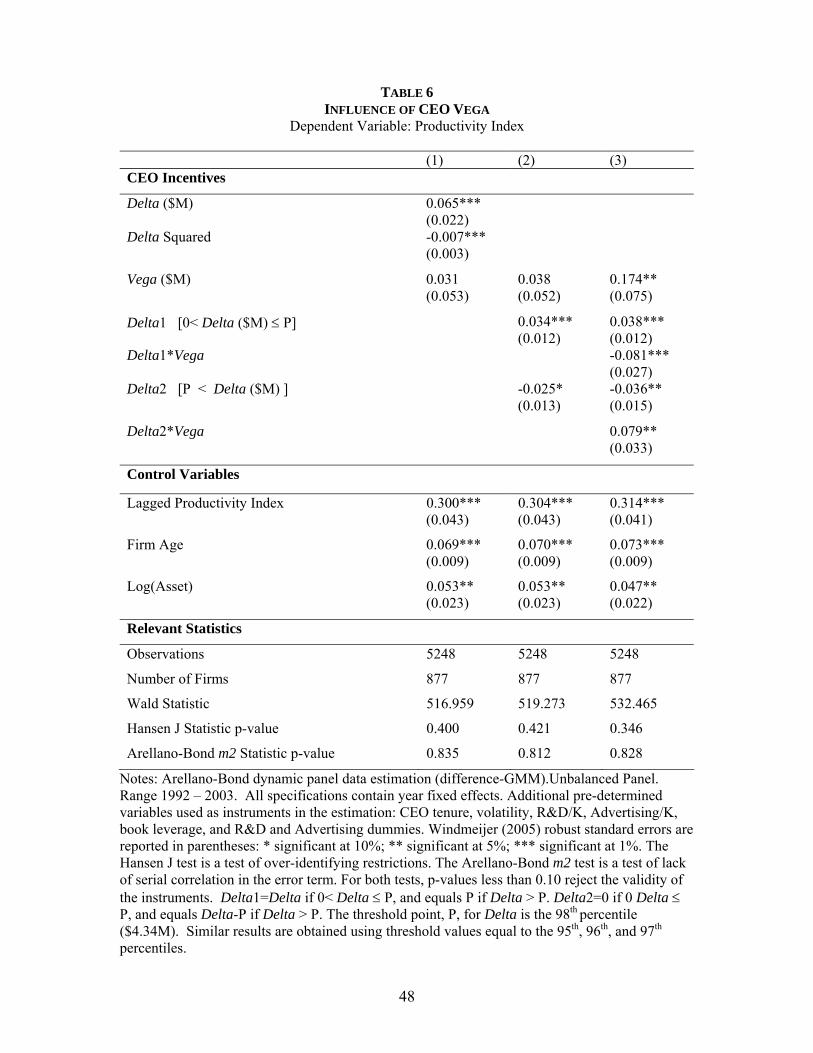
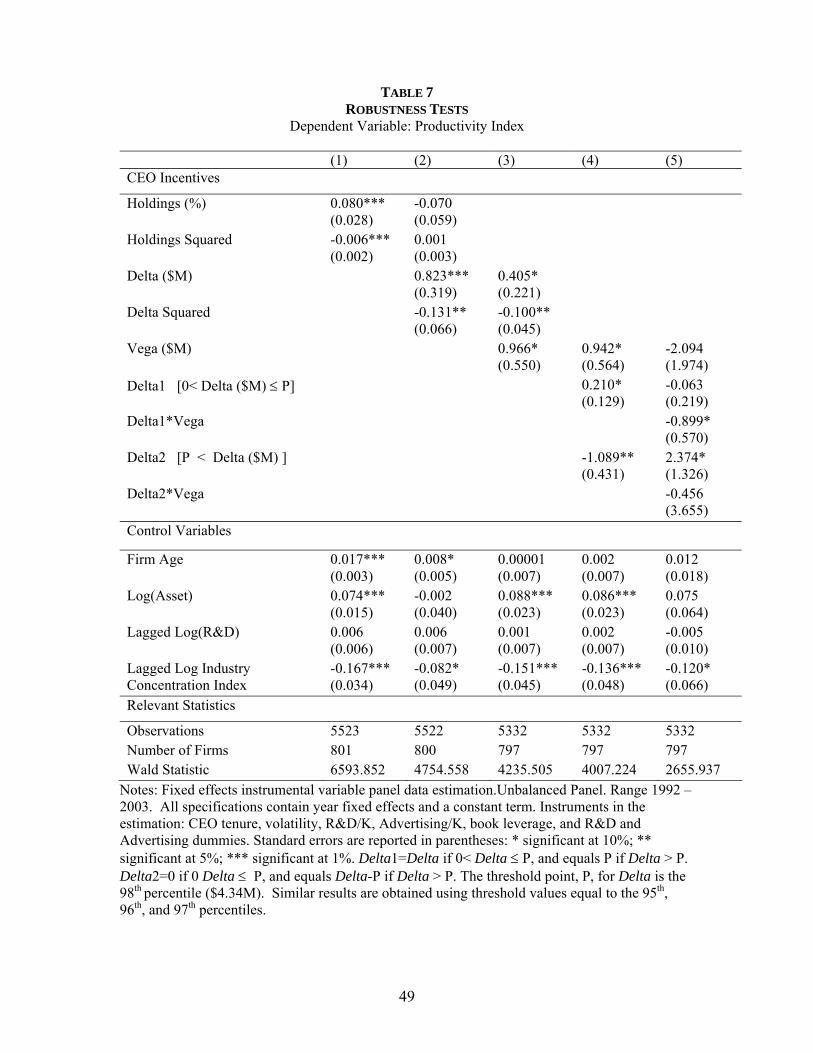
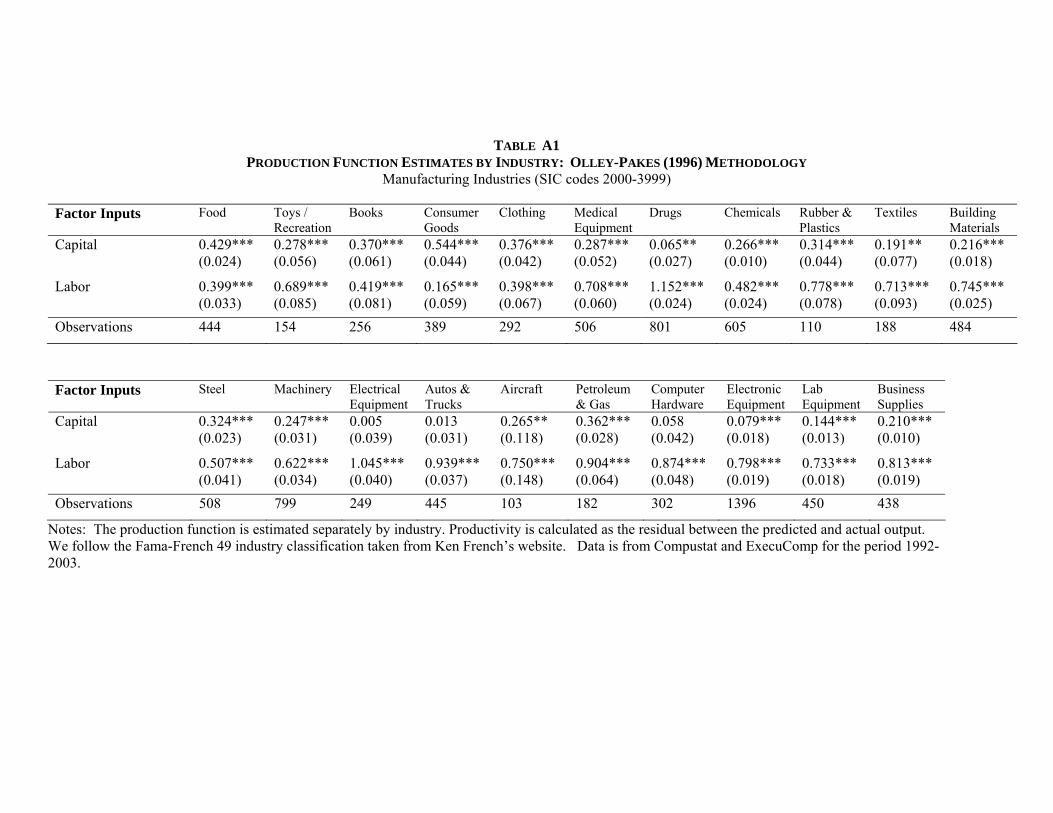
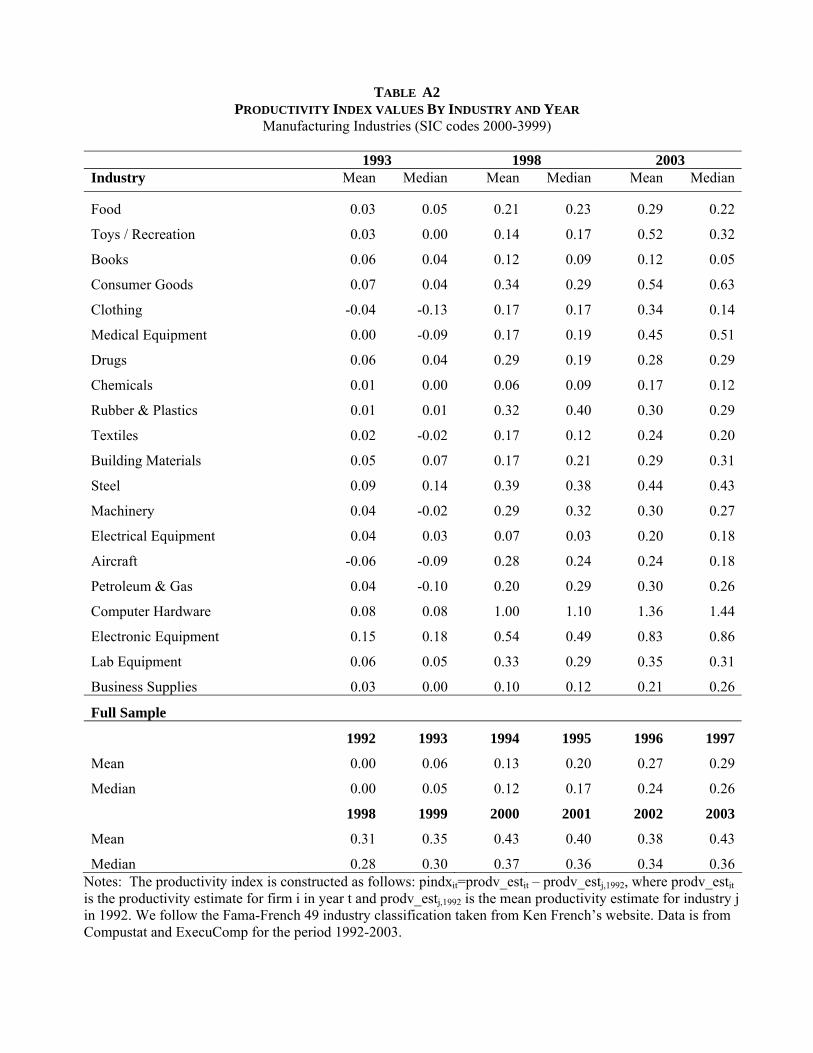


![[Job Market Paper] - NYUpages.stern.nyu.edu/~hchung2/jobmarketpaper1127_haejinchung.pdf[Job Market Paper] Board Independence and CEO Incentives Hae Jin Chung∗ 27 November 2008 Abstract](https://static.documents.pub/doc/80x56/5e73be3198d4a631a22baad9/job-market-paper-hchung2jobmarketpaper1127haejinchungpdf-job-market-paper.jpg)