16
Cerebrospinal Fluid (CSF) Analysis for total protein
| Date post: | 01-Jan-2016 |
| Category: |
Documents |
| Upload: | astra-nolan |
| View: | 45 times |
| Download: | 1 times |
Cerebrospinal Fluid (CSF) Analysis for total
protein
CSF sample
The specimen should be delivered to the laboratory immediately after collection
Glucose and protein estimations should be performed as soon as possible after drawing the CSF specimen
If testing is to be delayed, the specimen should be frozen at – 200 C.

Physical Examination
Turbidity Clear- normal Cloudy/ turbid- may indicate the
presence of white, or red blood cells, microorganisms, or an increase in protein level

Physical Examination
Color Colorless- normal Yellow, orange-brown, or red- may
indicate the presence blood
Physical Examination
Viscosity Normal CSF should have the
same consistency as water Thicker CSF may be seen in
patients with certain types of cancers or meningitis.
Chemical Analysis
Routinely performed biochemical tests in CSF are: glucose protein (total and specific) lactate lactate dehydrogenase glutamine and acid-base
parameters
Remember !!
Before any analysis, the fluid should be centrifuged to avoid contamination by cellular elements
CSF is the most precious biological material. Often, only small volumes of CSF are available for analysis due to difficulty in collection; hence handle this with care
The specimen may contain virulent organisms, so strict safety precautions should be followed.
CSF Protein Assay
Protein present in the CSF is detected by a kit based on Biuret method.
Biuret reagent when interacts with the peptide bonds in the protein give a blue coloured product
The intensity of the colour is proportional the amount of protein in CSF
CSF Protein Assay Color intensity is determined by
measuring the absorbance by the colored solution at a wavelength of 546nm
Absorbance is measured by an instrument, spectrophotometer
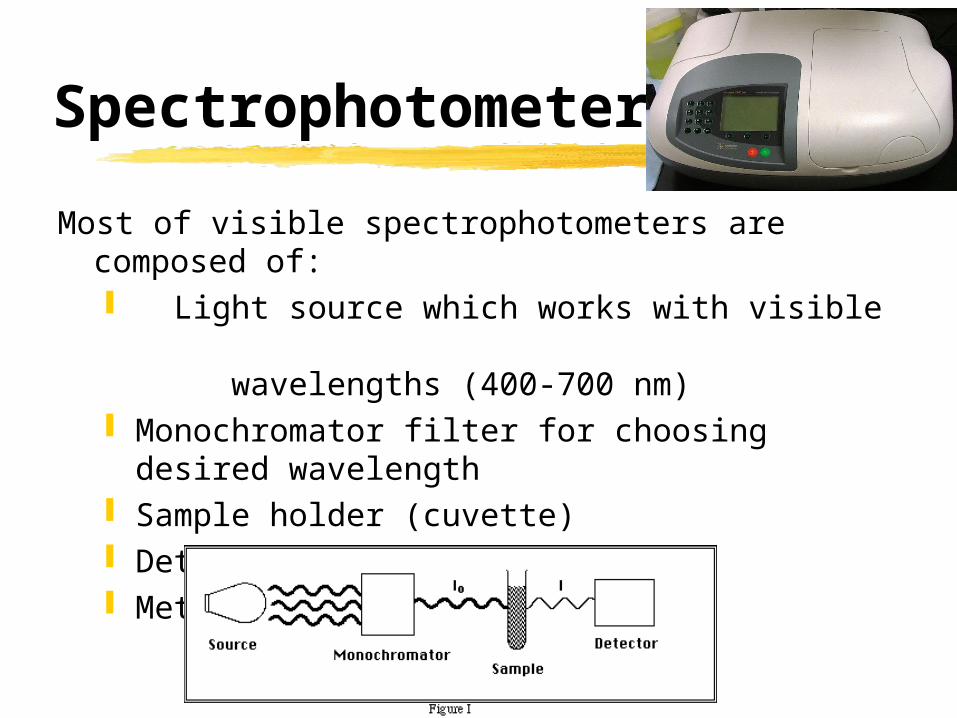
Spectrophotometer
Most of visible spectrophotometers are composed of: Light source which works with visible
wavelengths (400-700 nm) Monochromator filter for choosing desired
wavelength Sample holder (cuvette) Detector Meter or recorder
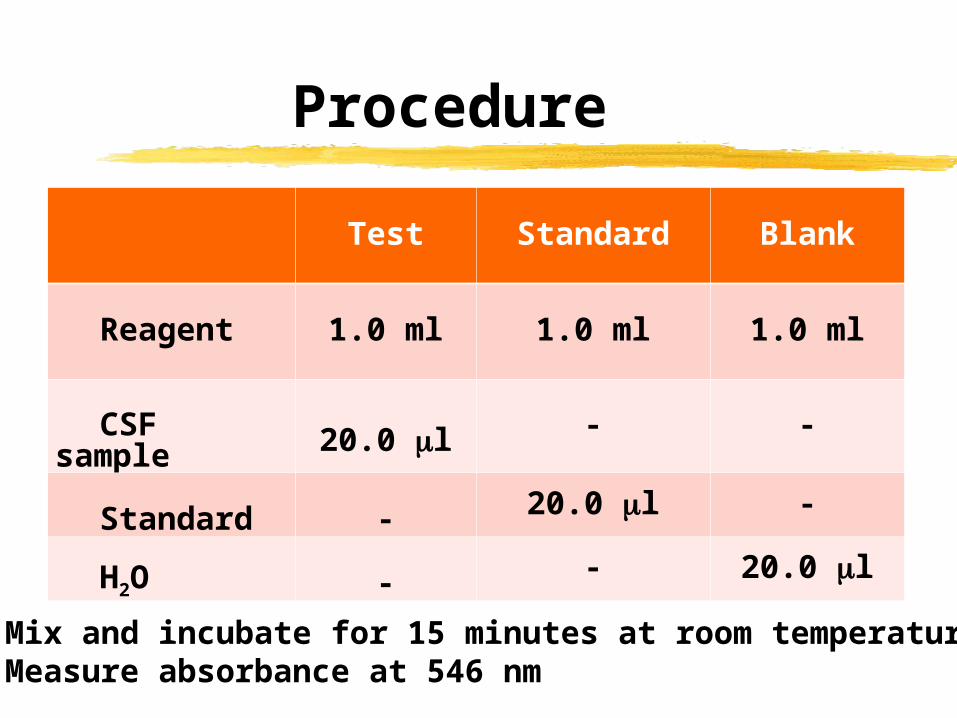
Procedure
Test Standard Blank
Reagent 1.0 ml 1.0 ml 1.0 ml
CSF sample 20.0 l - -
Standard - 20.0 l -
H2O - - 20.0 l
Mix and incubate for 15 minutes at room temperatureMeasure absorbance at 546 nm
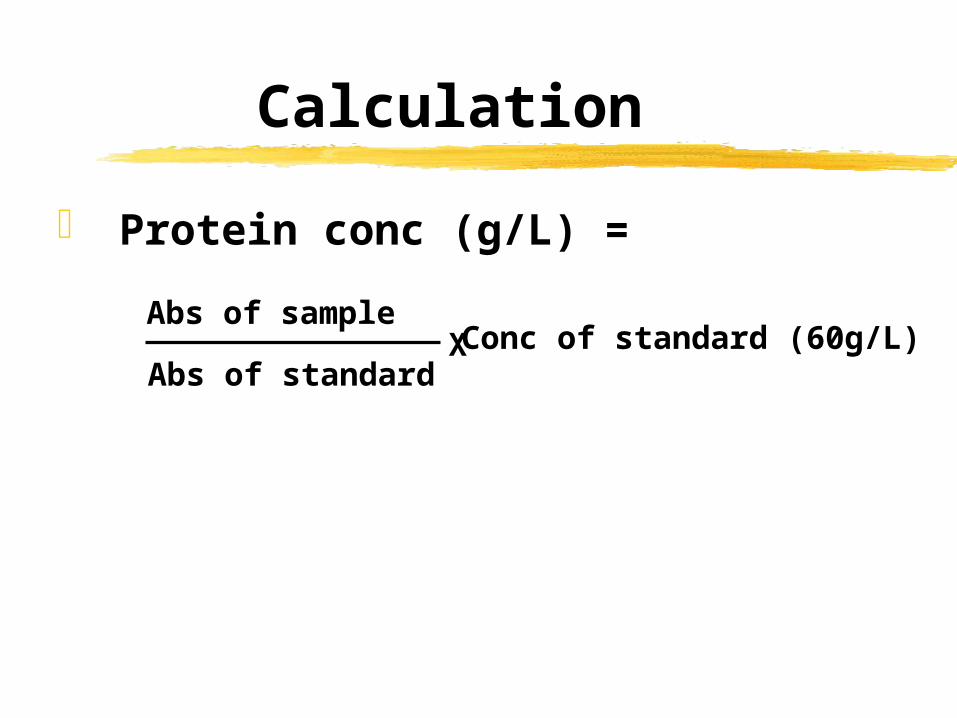
Calculation
Protein conc (g/L) =
Abs of sample
Abs of standardXConc of standard (60g/L)
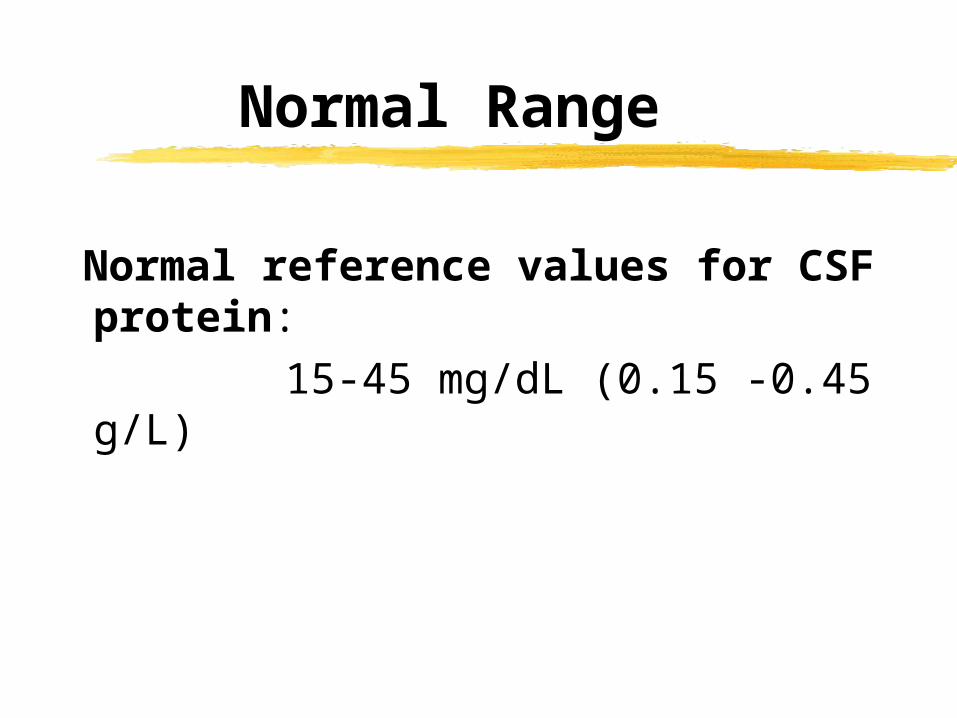
Normal Range
Normal reference values for CSF protein:
15-45 mg/dL (0.15 -0.45 g/L)
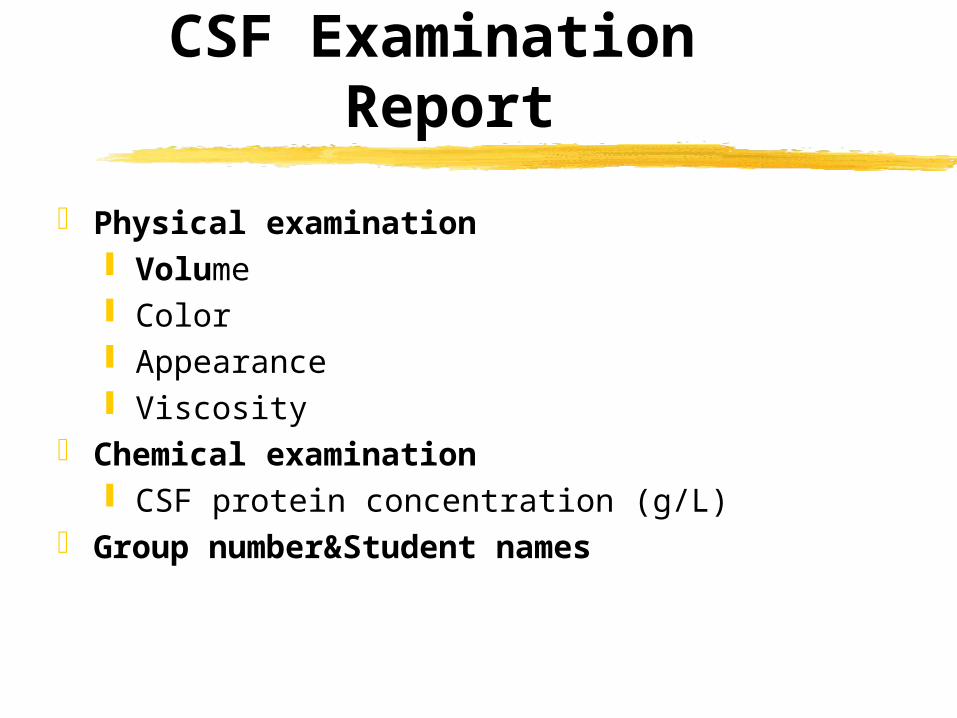
CSF Examination Report
Physical examination Volume Color Appearance Viscosity
Chemical examination CSF protein concentration (g/L)
Group number&Student names
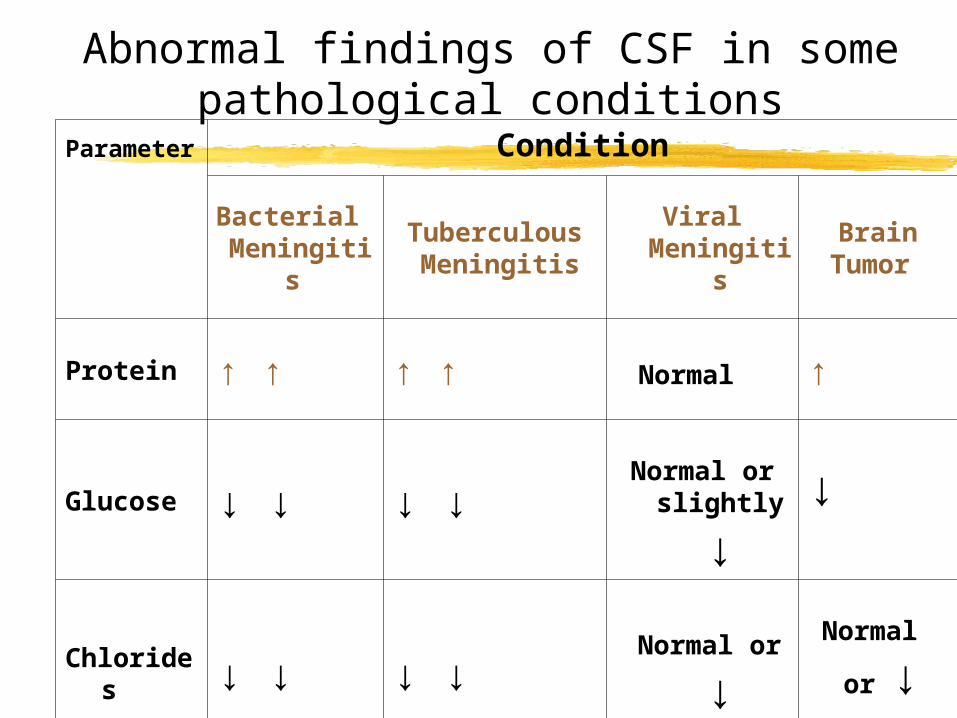
Parameter
Condition
Bacterial Meningiti
s
Tuberculous Meningitis
Viral Meningiti
s
BrainTumor
Protein ↑ ↑ ↑ ↑ Normal ↑
Glucose ↓ ↓ ↓ ↓
Normal or
slightly
↓↓
Chlorides ↓ ↓ ↓ ↓
Normal or
↓ Normal
or ↓
Abnormal findings of CSF in some pathological conditions