Page 1
© Phil Hurvitz, 1999-2000
CFR 250/590 Introduction to GIS
intro_gis.ppt 1
Introduction to GIS
• Spatial (coordinate) data model
• Relational (tabular) data model
• Scale issues
• Sample data_
Overview
Page 2
© Phil Hurvitz, 1999-2000
CFR 250/590 Introduction to GIS
intro_gis.ppt 2
Spatial Data Model
• GIS are driven by spatial data
• 2 basic spatial data models exist
• vector• points• lines • polygons
• raster• grid cells (images, bitmaps, DEMs)
_
Page 3
© Phil Hurvitz, 1999-2000
CFR 250/590 Introduction to GIS
intro_gis.ppt 3
Vector Data Model
• Characteristics of the vector data model:
• Features positioned accurately
• Shape of features represented correctly
• Features represented discretely (no fuzzy boundaries)
• Complex data structure (especially for polygons)_
Page 4
© Phil Hurvitz, 1999-2000
CFR 250/590 Introduction to GIS
intro_gis.ppt 4
Vector Data Model
Points: represent discrete point features
Page 5
© Phil Hurvitz, 1999-2000
CFR 250/590 Introduction to GIS
intro_gis.ppt 5
Vector Data Model
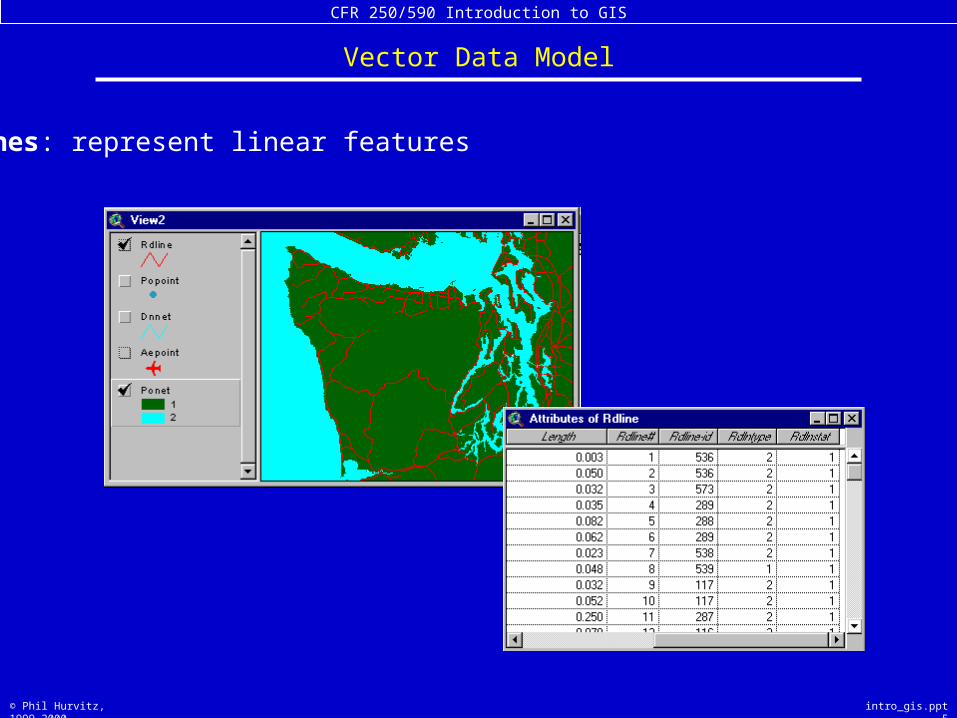
Lines: represent linear features
Page 6
© Phil Hurvitz, 1999-2000
CFR 250/590 Introduction to GIS
intro_gis.ppt 6
Vector Data Model
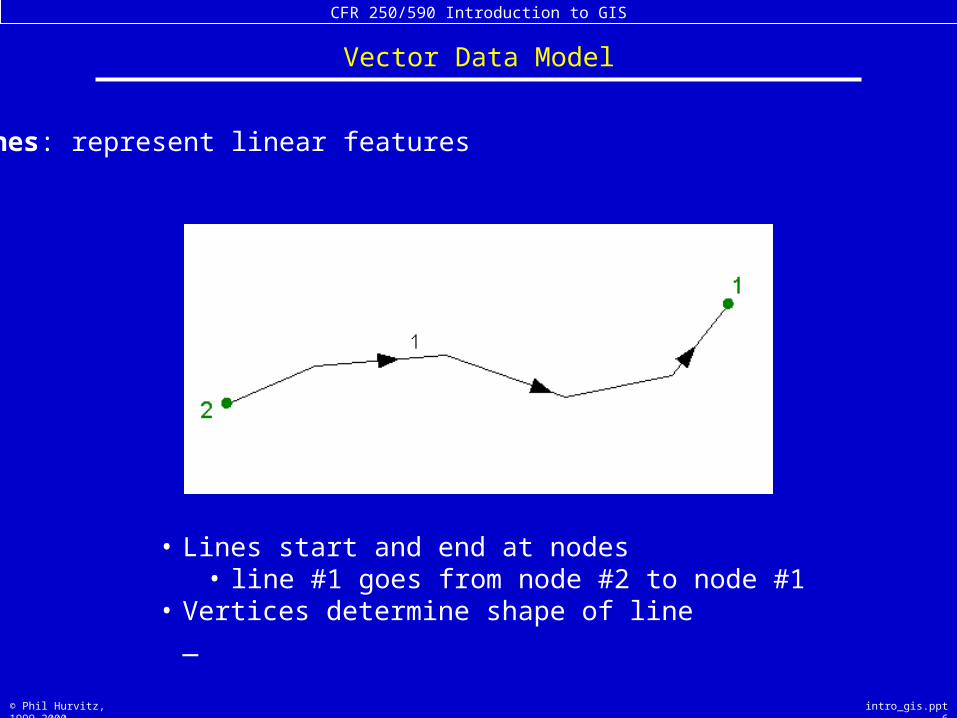
Lines: represent linear features
• Lines start and end at nodes• line #1 goes from node #2 to node #1
• Vertices determine shape of line_
Page 7
© Phil Hurvitz, 1999-2000
CFR 250/590 Introduction to GIS
intro_gis.ppt 7
Vector Data Model
Polygons: represent bounded areas
Page 8
© Phil Hurvitz, 1999-2000
CFR 250/590 Introduction to GIS
intro_gis.ppt 8
Vector Data Model
Polygons: represent bounded areas
• Polygon #2 is bounded by lines 1 & 2• Line 2 has polygon 1 on left and polygon 2 on right
_
Page 9
© Phil Hurvitz, 1999-2000
CFR 250/590 Introduction to GIS
intro_gis.ppt 9
Vector Data Model
• complex data model• “arc/node topology”
_
Polygons: represent bounded areas
Page 10
© Phil Hurvitz, 1999-2000
CFR 250/590 Introduction to GIS
intro_gis.ppt 10
Vector Data Model
Types (formats) of vector data available in ArcView
• ArcView shapefiles
• ArcInfo coverages and libraries
• CAD files (AutoCAD DWG, DXF;Microstation DGN)
• StreetMap files
• Spatial Database Engine (SDE) data
• ASCII point coordinate data_
Page 11
© Phil Hurvitz, 1999-2000
CFR 250/590 Introduction to GIS
intro_gis.ppt 11
Vector Data Model
• A relatively new vector data format
• Preferred in ArcView• Draws fast• Fully editable in ArcView
• Simple in structure
• Does not use arc-node topology• “Connected” lines do not necessarily share a common node• Adjacent polygons do not share common bounding arcs• Data sets are either point or line or polygon
_
ArcView shapefiles
Page 12
© Phil Hurvitz, 1999-2000
CFR 250/590 Introduction to GIS
intro_gis.ppt 12
Vector Data Model
• A commonly found format
• Data model more complex
• Draws more slowly in ArcView
• Coordinate data not editable in ArcView
• Can be used in both ArcView and ArcInfo
• Polymorphic
• Problematic file structure (more on this later in the term)_
ArcInfo coverages
Page 13
© Phil Hurvitz, 1999-2000
CFR 250/590 Introduction to GIS
intro_gis.ppt 13
Vector Data Model
• CAD data are very common (industry standard)
• DXF, DWG, and DGN formats supported in ArcView
• Coordinate data not editable in ArcView
• Frequently contain “sloppy” data• No enforced topology rules• Gaps in data
• Frequently contain little or no useful attribute data_
AutoCAD & Microstation CAD drawing data
Page 14
© Phil Hurvitz, 1999-2000
CFR 250/590 Introduction to GIS
intro_gis.ppt 14
Vector Data Model
• Easy to obtain from a variety of sources• GPS• Traverse• Direct reading from maps
• OS, architecture, and application independent
ASCII coordinate data
Page 15
© Phil Hurvitz, 1999-2000
CFR 250/590 Introduction to GIS
intro_gis.ppt 15
Raster Data Model
• Rectangular grid of square cells
• Shape of features generalized by cells
• Continuous (surface) data represented easily
• Simple data structure_
Characteristics of the raster data model:
Page 16
© Phil Hurvitz, 1999-2000
CFR 250/590 Introduction to GIS
intro_gis.ppt 16
Raster Data Model
• Wind speed
• Elevation, slope, aspect
• Chemical concentration
• Likelihood of existence of a certain species
• Electromagnetic reflectance (photographic or satellite imagery)_
Raster data are good at representing continuous phenomena
Page 17
© Phil Hurvitz, 1999-2000
CFR 250/590 Introduction to GIS
intro_gis.ppt 17
Raster Data Model
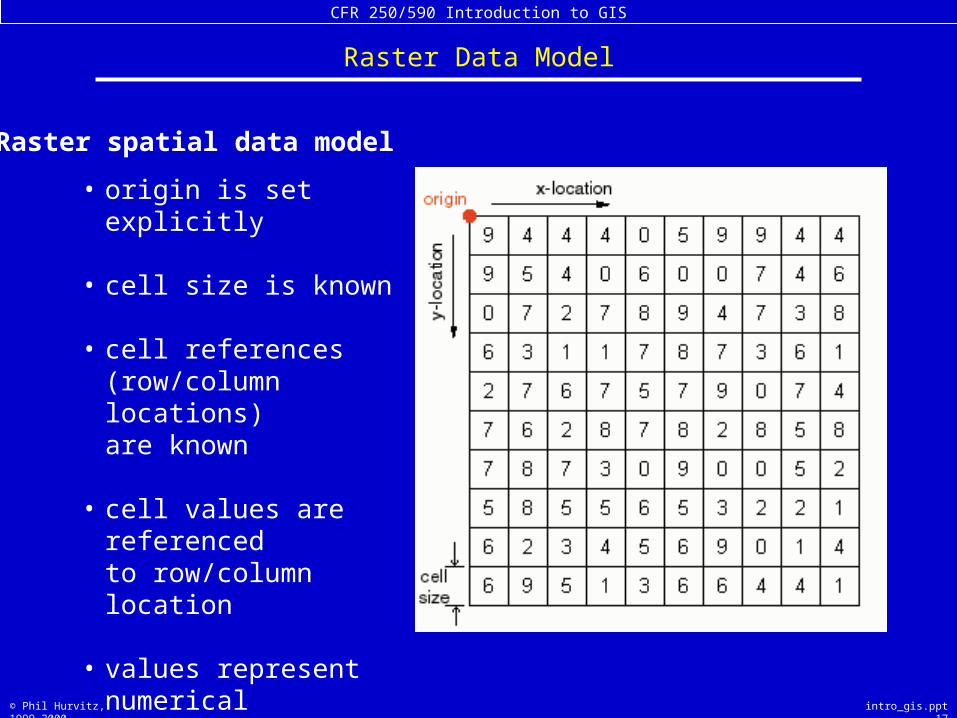
• origin is set explicitly
• cell size is known
• cell references (row/column locations)are known
• cell values are referencedto row/column location
• values represent numerical phenomena orindex codes for non-numerical phenomena_
Raster spatial data model
Page 18
© Phil Hurvitz, 1999-2000
CFR 250/590 Introduction to GIS
intro_gis.ppt 18
Raster Data Model
• digital orthophoto
• digital elevation model (DEM)_
A few different types of raster data
Page 19
© Phil Hurvitz, 1999-2000
CFR 250/590 Introduction to GIS
intro_gis.ppt 19
• The “where” of GIS is determined by coordinate (map) data structures, but …
• The “what” of GIS is determined by tabular (relational database) data structures
• Thus, tabular data are just as important as coordinate data_
Relational Database Model & Attribute Data Structures
Page 20
© Phil Hurvitz, 1999-2000
CFR 250/590 Introduction to GIS
intro_gis.ppt 20
Relational Database Model & Attribute Data Structures
• Tables are composed of:
• fields
and
• records_
Attribute data are stored in database tables.
Page 21
© Phil Hurvitz, 1999-2000
CFR 250/590 Introduction to GIS
intro_gis.ppt 21
Relational Database Model & Attribute Data Structures
• dBase
• rBase
• Access
• Excel (database functionality)
• Oracle, INFORMIX, INGRES, SQL Server
• INFO (in ArcInfo)_
You may already be familiar with relational databases
Page 22
© Phil Hurvitz, 1999-2000
CFR 250/590 Introduction to GIS
intro_gis.ppt 22
Relational Database Model & Attribute Data Structures
• tables are stored on the disk as
• .dbf,
• .txt, or
• in INFO directories_
ArcView uses tabular data formats from dBase, ASCII text, and INFO files
Page 23
© Phil Hurvitz, 1999-2000
CFR 250/590 Introduction to GIS
intro_gis.ppt 23
Relational Database Model & Attribute Data Structures
Tables can be linked and joined (“related”) by use of common values in fields
Page 24
© Phil Hurvitz, 1999-2000
CFR 250/590 Introduction to GIS
intro_gis.ppt 24
Relational Database Model & Attribute Data Structures
• Vector• point attribute tables• polygon attribute• line attribute
• node attribute* • text attribute*• route & event tables*
* in ArcInfo coverage data only
Different types of attribute tables in ArcView
• Raster• value attribute
_
Page 25
© Phil Hurvitz, 1999-2000
CFR 250/590 Introduction to GIS
intro_gis.ppt 25
Relational Database Model & Attribute Data Structures
Relationship between tabular and map data
• one-to-one between features and records_
Page 26
© Phil Hurvitz, 1999-2000
CFR 250/590 Introduction to GIS
intro_gis.ppt 26
Scale Issues
Be aware of:
• Data’s source scale
• Mixing data from different source scales
• Appropriateness of output scale_
Scale of data plays an important role, and frequently causes problems
Page 27
© Phil Hurvitz, 1999-2000
CFR 250/590 Introduction to GIS
intro_gis.ppt 27
Scale Issues
• A 1/40th in line on a 1:24,000 scale map is 50 ft on the ground
50' * * 0.025" 12"1'
1"24,000"
• A .30 mm line on a 1:200,000 scale map is almost 2,000 ft on the ground_
1,969' * * * * mm 0.30 12"1'
2.54cm1"
mm 101cm
12,000,000
Map measurement and true ground measurement
Page 28
© Phil Hurvitz, 1999-2000
CFR 250/590 Introduction to GIS
intro_gis.ppt 28
Scale Issues
• 1:100,000 scale data from USGS DLG
Data from different sources and scales can vary widely
Page 29
© Phil Hurvitz, 1999-2000
CFR 250/590 Introduction to GIS
intro_gis.ppt 29
Scale Issues
• 1:1,000,000 scale data from DCW (DMA)
Data from different sources and scales can vary widely
Page 30
© Phil Hurvitz, 1999-2000
CFR 250/590 Introduction to GIS
intro_gis.ppt 30
Scale Issues
•1:2,000,000 scale data from USGS DLG
Data from different sources and scales can vary widely
Page 31
© Phil Hurvitz, 1999-2000
CFR 250/590 Introduction to GIS
intro_gis.ppt 31
Scale Issues
• one inch on the map equals 200 inches on the ground?
or
• one inch on the map equals 200 feet on the ground?_
• “one to two-hundred”: does this mean
Beware of scale statements
Page 32
© Phil Hurvitz, 1999-2000
CFR 250/590 Introduction to GIS
intro_gis.ppt 32
Course Sample Data
• Original data sources
• Legacy maps
• USGS digital line graphs
• DNR data
• GPS surveys
• Digital orthophoto interpretation_
Pack Forest GIS database
Page 33
© Phil Hurvitz, 1999-2000
CFR 250/590 Introduction to GIS
intro_gis.ppt 33
Course Sample Data
• CD directory pfdata• Forest stands• Streams• Roads, trails• Soils• Elevation contours• Culverts• Forest inventory data• Digital orthophotos• Digital elevation model• …
_
Pack Forest GIS database
Page 34
© Phil Hurvitz, 1999-2000
CFR 250/590 Introduction to GIS
intro_gis.ppt 34
Course Sample Data
• CD directory esridata• Worldwide data sets
• countries• major rivers
• United States data• states• counties• cities• rivers• roads
• Canada• Mexico
_
ESRI Sample Data
Page 35
© Phil Hurvitz, 1999-2000
CFR 250/590 Introduction to GIS
intro_gis.ppt 35
Sample Data
Unless otherwise specified,
Projection STATEPLANEWashington South Zone (State Plane 5626 or FIPSZone 4602)
Datum HPGN (a.k.a. NAD83/91)Units FEET Spheroid GRS1980_
Pack Forest GIS database projection & coordinate definition