44
Ch 2 Velocity ~Motion in One Dimension~
| Date post: | 25-Dec-2015 |
| Category: |
Documents |
| Upload: | oliver-oliver |
| View: | 225 times |
| Download: | 0 times |

Ch 2 Velocity~Motion in One Dimension~

Scalar versus Vector
• Scalar – quantity that only has magnitude
• Vector – quantity that has magnitude and direction.

• Three friends drive their four wheelers a distance of 100.0 m.• Will they end up in the same place? Why or why not.• No, 100.0 m is a scalar and does not specify a specific direction.• Now suppose they drive 175.0 m due East.• Will they end up in the same place? Why or why not.• Yes, 100.0 m East is a vector. It has direction
Scalar versus Vector
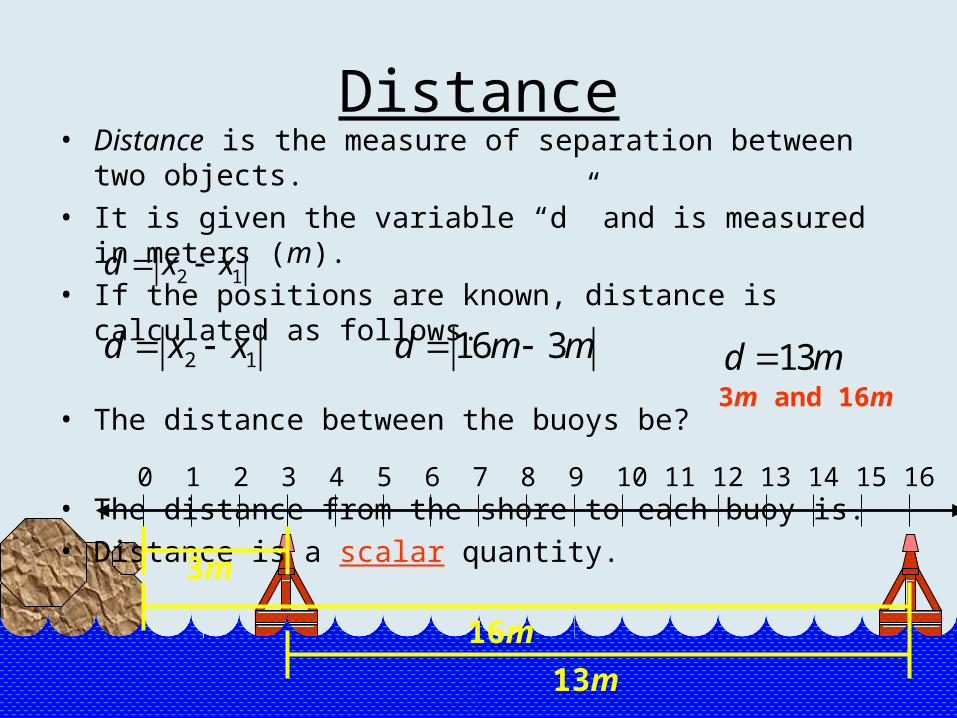
Distance• Distance is the measure of separation between two objects.
• It is given the variable “d” and is measured in meters (m).
• If the positions are known, distance is calculated as follows.
• The distance between the buoys be?
• The distance from the shore to each buoy is.
• Distance is a scalar quantity.
2 1d x x
0 1 2 3 4 5 6 7 8 9 10 11 12 13 14 15 16
2 1d x x 16 3d m m 13d m
13m
3m and 16m
16m
3m
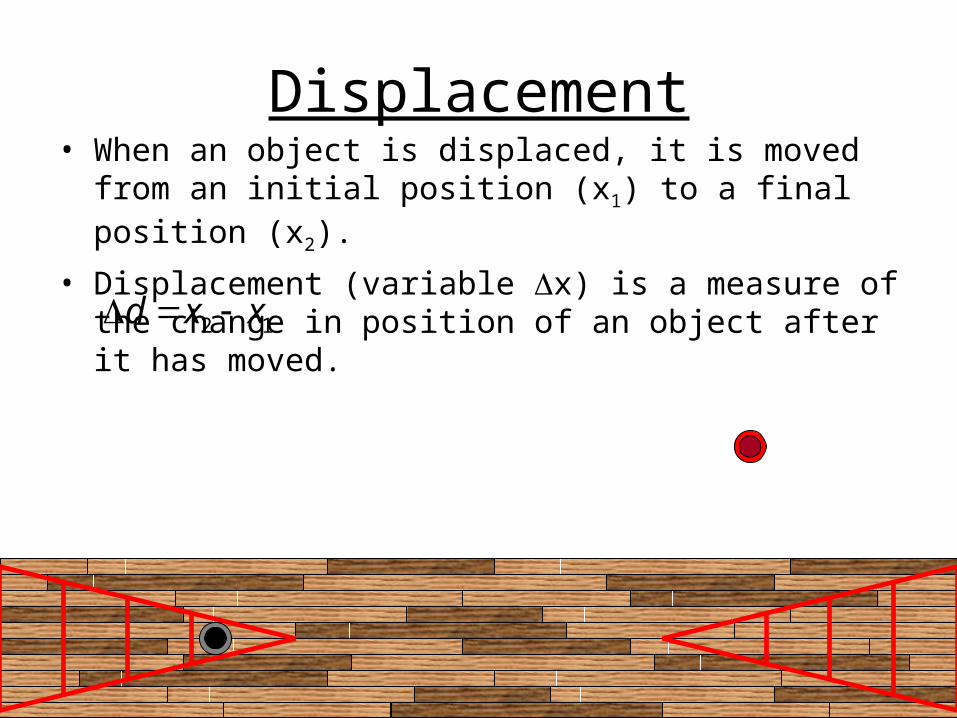
Displacement• When an object is displaced, it is moved from an initial
position (x1) to a final position (x2).
• Displacement (variable x) is a measure of the change in position of an object after it has moved.
2 1d x x

Example Displacement - Distance
• John travels east along a straight highway and passes mile marker 260. John continues until mile marker 150 and then doubles back to mile marker 175.
• What is Johns displacement from marker 260?• +85 miles
• What is the total distance John traveled?• 135 miles
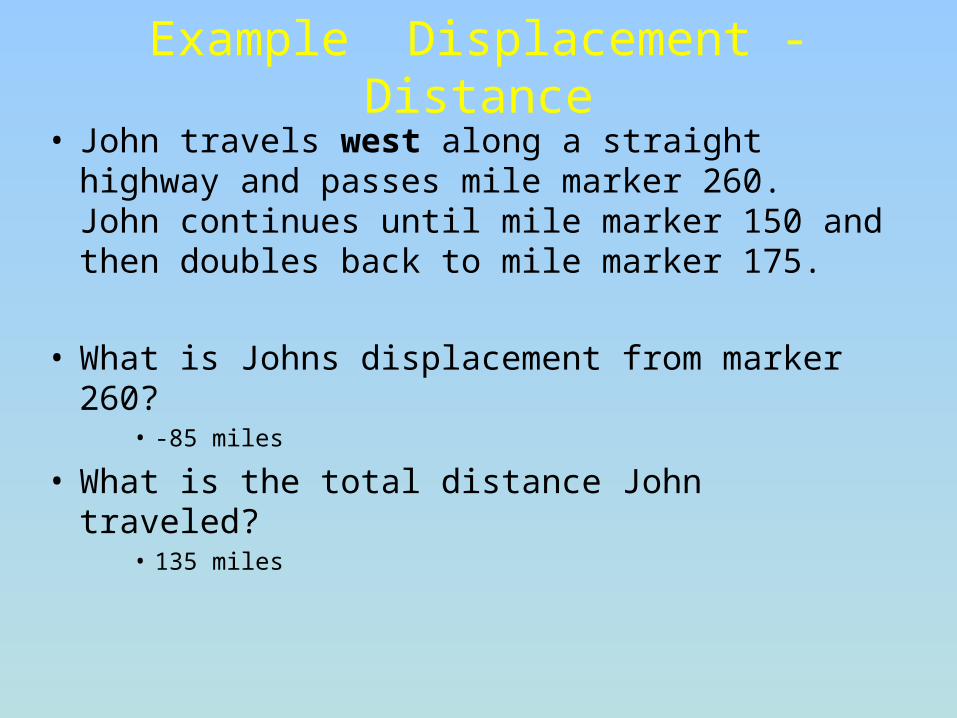
Example Displacement - Distance
• John travels west along a straight highway and passes mile marker 260. John continues until mile marker 150 and then doubles back to mile marker 175.
• What is Johns displacement from marker 260?• -85 miles
• What is the total distance John traveled?• 135 miles


Average Velocity• Average Velocity – the change in position
of an object over a given time interval.
xv
t
2 1
2 1
x x
t t
Finial positionInitial position
Initial time
Final time
Vector or Scalar??

• A ball moves at 12m/s and coasts up a hill with a uniform acceleration of -1.6m/s2.
Example
• Distance traveled for the 1st 6s.
• Distance traveled for the 1st 9s.

Simultaneous equations
3 7 95x y
11 2 88x y
• Solve the following equations for both x and y
x = 6
Y = 11
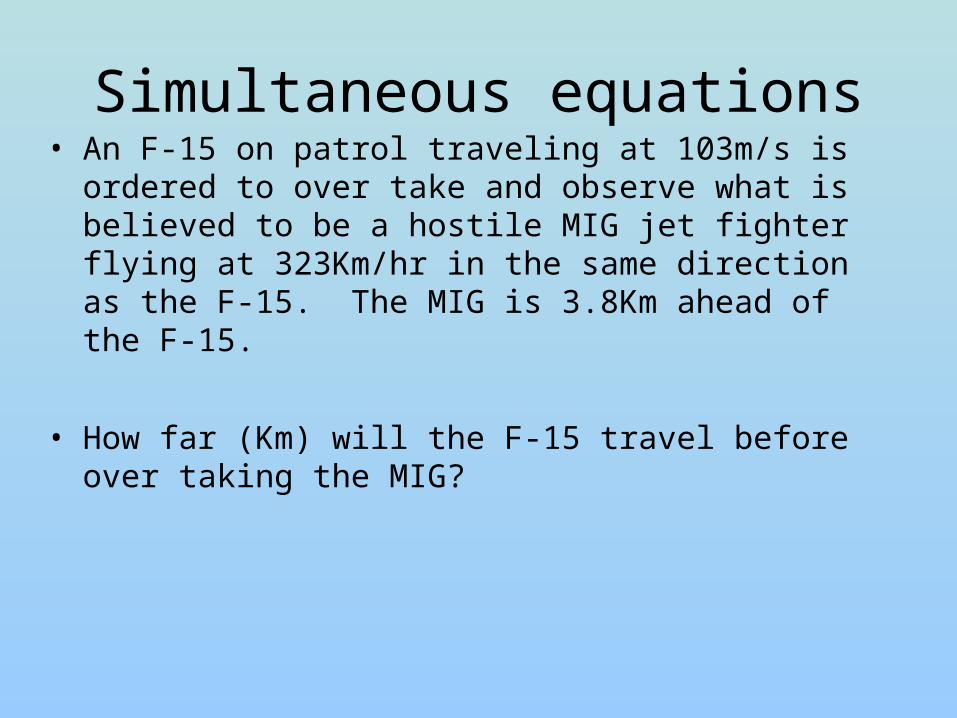
Simultaneous equations• An F-15 on patrol traveling at 103m/s is ordered to over
take and observe what is believed to be a hostile MIG jet fighter flying at 323Km/hr in the same direction as the F-15. The MIG is 3.8Km ahead of the F-15.
• How far (Km) will the F-15 travel before over taking the MIG?
2 1
2 1
v v
t t
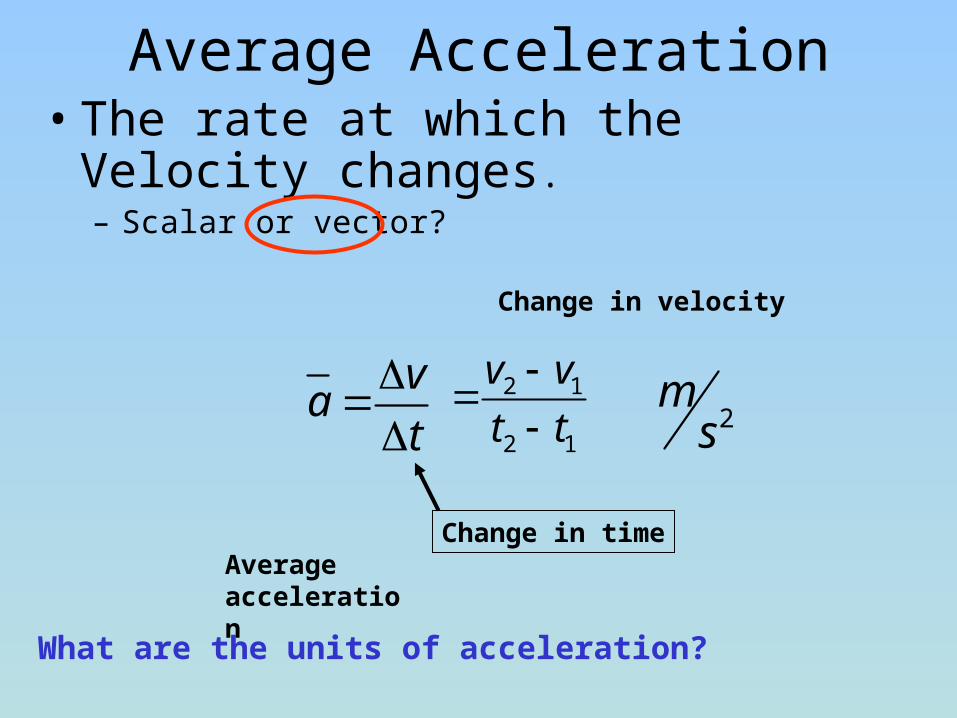
Average Acceleration• The rate at which the Velocity
changes.– Scalar or vector?
va
t
Average acceleration
Change in velocity
Change in time
What are the units of acceleration?
2ms
Average Acceleration• Can an object speed up and have a
negative average acceleration?
– YES!
• Let’s see an example how!

Practice Problem – Avg Acceleration
• Simon rolls backwards faster and faster down his driveway. He starts at -2.0 m/s and is moving at -9.0 m/s 2.0 s later. What is his average acceleration?
12
12
tt
vva
02
)2(9
25.3s
m
Negative a!
AHHH!!!!

Average Acceleration• Can an object slow down and have a
positive average acceleration?
– YES!
• Let’s see an example how!

Practice Problem – Avg Acceleration
• Simon rolls up the other side of the ramp and slows down from-9.0m/s to -2m/s in 2s. What is his average acceleration?
12
12
tt
vva
2 ( 9)
2 0
23.5ms
AHHH!!!!

-250
100150
250
0 10 20 30 40 50 60 70 80 90
Time (s)
0-50
-100-150-200
Po
siti
on
(m
)
50
200
Position vs. Time Graph

What is the position of the object at t = 10s?
What is the position of the object at t = 40s?
What is the position of the object at t = 60s?
Position vs. Time Graph
-25-20
-15-10
-505
1015
2025
0 10 20 30 40 50 60 70 80 90
Po
siti
on
(m
)
Time (s)
Position vs. Time Graph
-25-20
-15-10
-505
1015
2025
0 10 20 30 40 50 60 70 80 90
Po
siti
on
(m
)
Time (s)
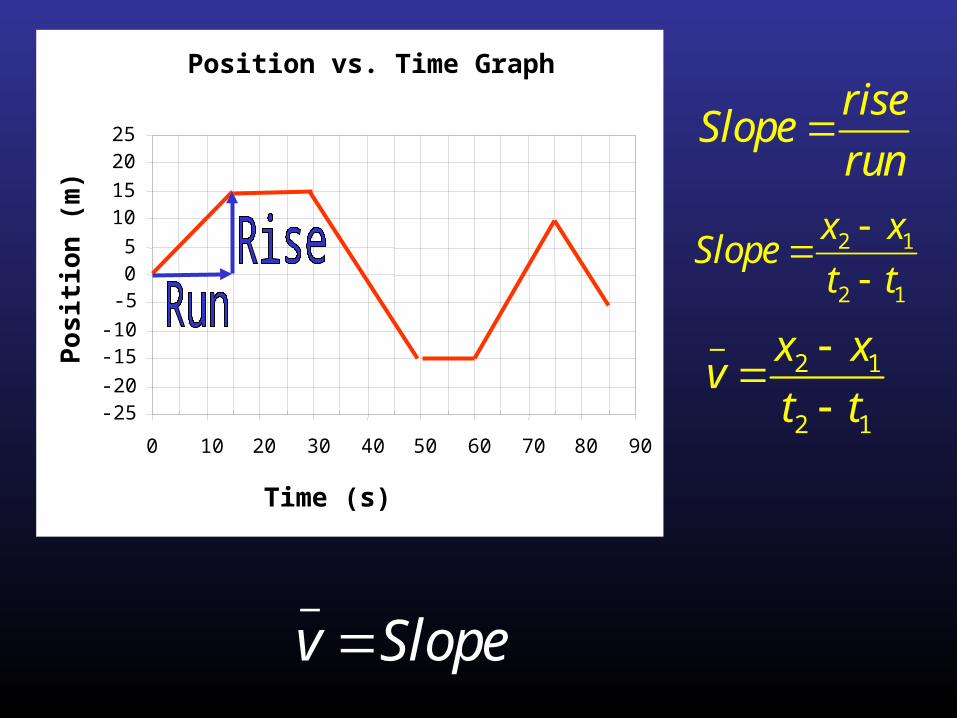
riseSlope
run
2 1
2 1
x xSlope
t t
_
2 1
2 1
x xv
t t
_
v Slope

Position vs. Time Graph
-25-20
-15-10
-505
1015
2025
0 10 20 30 40 50 60 70 80 90
Po
siti
on
(m
)
Time (s)
_
v Slope
+ Slope + VelocityMoving forwards
- Slope - VelocityMoving backwards
0 Slope 0 VelocityNot moving

Position vs. Time Graph
-25-20
-15-10
-505
1015
2025
0 10 20 30 40 50 60 70 80 90
Po
siti
on
(m
)
Time (s)
_
v Slope
During what time period(s) is the object moving forward?
During what time period(s) is the object moving backwards?
During what time period(s) is the object not moving?
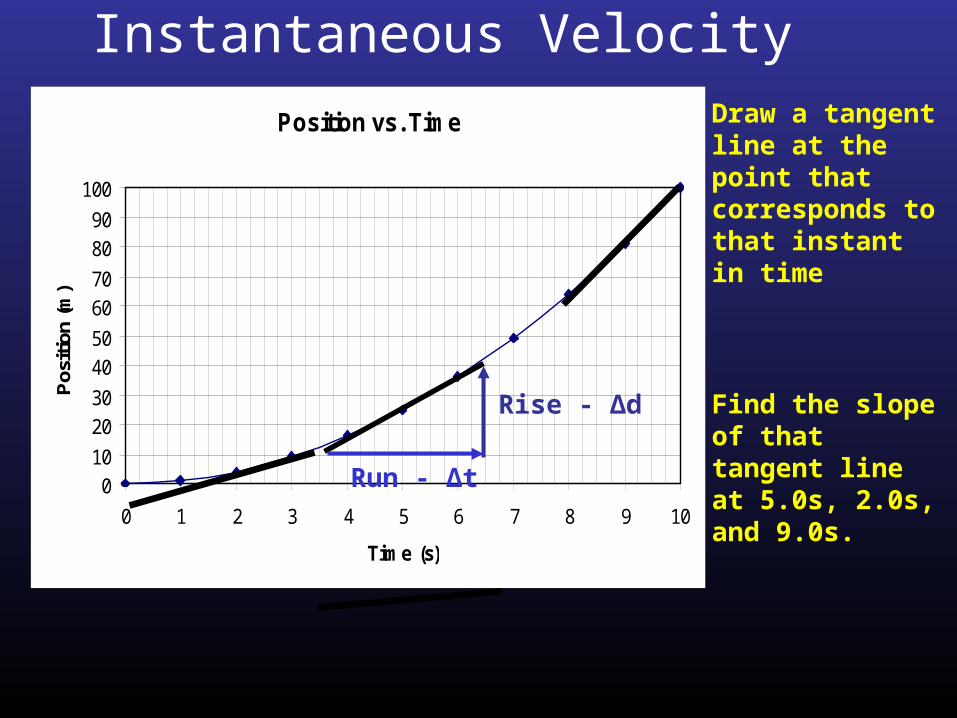
Instantaneous Velocity
Position vs. Time
010
2030
4050
6070
8090
100
0 1 2 3 4 5 6 7 8 9 10
Time (s)
Pos
ition
(m)
Draw a tangent line at the point that corresponds to that instant in time
Find the slope of that tangent line at 5.0s, 2.0s, and 9.0s.
Rise - Δd
Run - Δt

Position Time Graphs Velocity Time Graphs
Velocity vs. Time Graph
-25-20-15-10-505
10152025
0 10 20 30 40 50 60 70 80 90
Time (s)V
elo
cit
y (m
/s)
Position vs. Time Graph
-25-20-15-10-505
10152025
0 10 20 30 40 50 60 70 80 90
Po
siti
on
(m
)
Time (s)
Position–Time graphs lets us calculate velocity.
Velocity–Time graphs lets us calculate displacement (x).
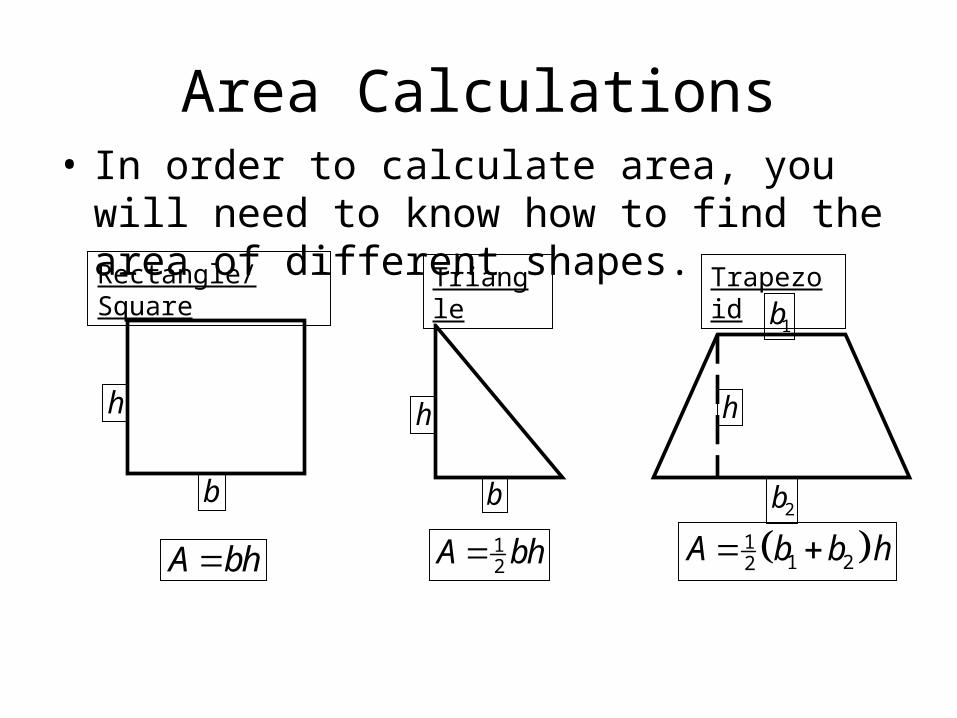
Area Calculations• In order to calculate area, you will need to
know how to find the area of different shapes.
Trapezoid
11 22A b b h
1b
2b
h
Triangle
12A bh
b
h
Rectangle/Square
A bh
h
b

Velocity vs. Time Graph
-25
-20
-15
-10
-5
0
5
10
15
20
25
0 10 20 30 40 50 60 70 80 90
Time (s)
Ve
loc
ity
(m/s
)
Displacement equals the area between the curve and the x-axis. (d = Area)
Find the displacement between 10s-25s.
15 *(15 )msx s
225x m
A bh

“Negative” Area• Area above the x-
axis indicates positive displacement.
• Area below the x-axis indicates negative displacement.
• Negative velocity means negative displacement
Velocity vs. Time Graph
-25-20-15-10-505
10152025
0 10 20 30 40 50 60 70 80 90
Time (s)
Ve
loc
ity
(m/s
)

Velocity vs. Time Graph
-25
-20
-15
-10
-5
0
5
10
15
20
25
0 10 20 30 40 50 60 70 80 90
Time (s)
Ve
loc
ity
(m/s
)
Displacement equals the area under the curve (d = Area)
Find the distance traveled between 40-55s
12 (15 )( 15 )msx s
112.5x m

Velocity vs. Time Graph
-25
-20
-15
-10
-5
0
5
10
15
20
25
0 10 20 30 40 50 60 70 80 90
Time (s)
Ve
loc
ity
(m/s
)
Displacement equals the area under the curve (d = Area)
Find the distance traveled between 25-65s
12 (15 )(15 )msx s
150x m
12 40 25 15 m
ss s
65 55 15 mss s

Velocity vs. Time Graph
-25
-20
-15
-10
-5
0
5
10
15
20
25
0 10 20 30 40 50 60 70 80 90
Time (s)
Ve
loc
ity
(m/s
)
Displacement equals the area under the curve (d = Area)
Find the displacement traveled between 10-55s
225x m
1 (15 )(15 )msx s
225 112.5 112.5x m m m
3
1(15 )( 15 )
2msx s
12 2 (15 )(15 )msx s

Velocity vs. Time Graph
-25
-20
-15
-10
-5
0
5
10
15
20
25
0 10 20 30 40 50 60 70 80 90
Time (s)
Ve
loc
ity
(m/s
)
Find the displacement between 40-75s
337.5x m
1 1(15 )( 15 / ) 10 ( 15 / ) (10 )( 15 / )
2 2x s m s s m s s m s
337.5m left
Velocity-TimeVelocity vs. Time Graph
-25-20-15-10-505
10152025
0 1 2 3 4 5 6 7 8 9
Time (s)
Vel
oci
ty (
m/s
) Δv
Δt
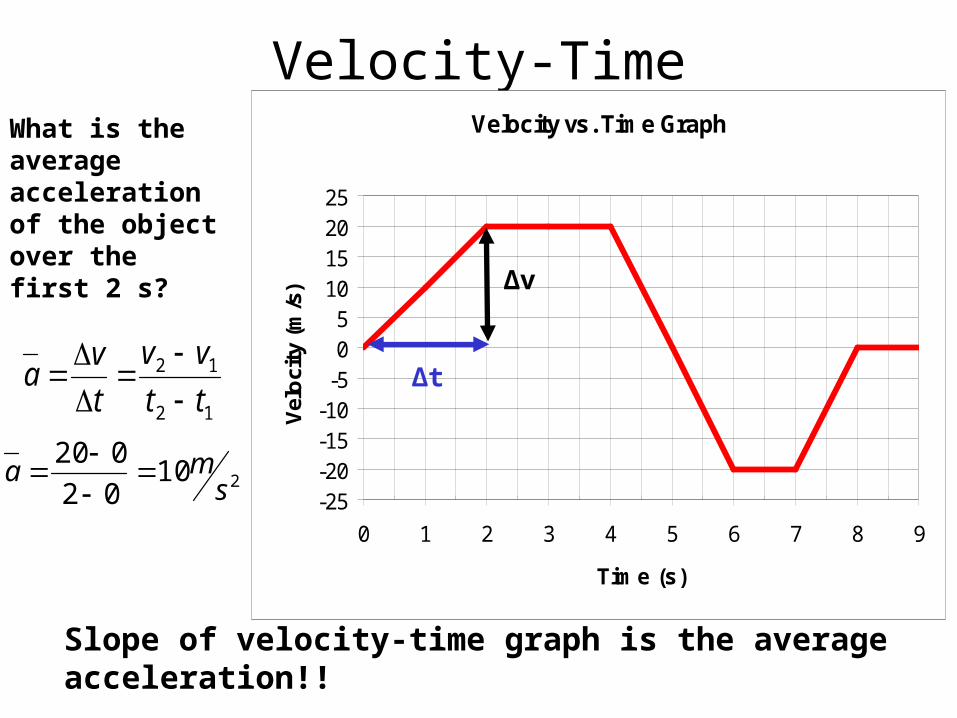
What is the average acceleration of the object over the first 2 s?
21002
020s
ma
Slope of velocity-time graph is the average acceleration!!
12
12
tt
vv
t
va
Velocity-Time Graphs
Velocity vs. Time Graph
-25-20-15-10-505
10152025
0 1 2 3 4 5 6 7 8 9
Time (s)
Velo
city
(m/s
)
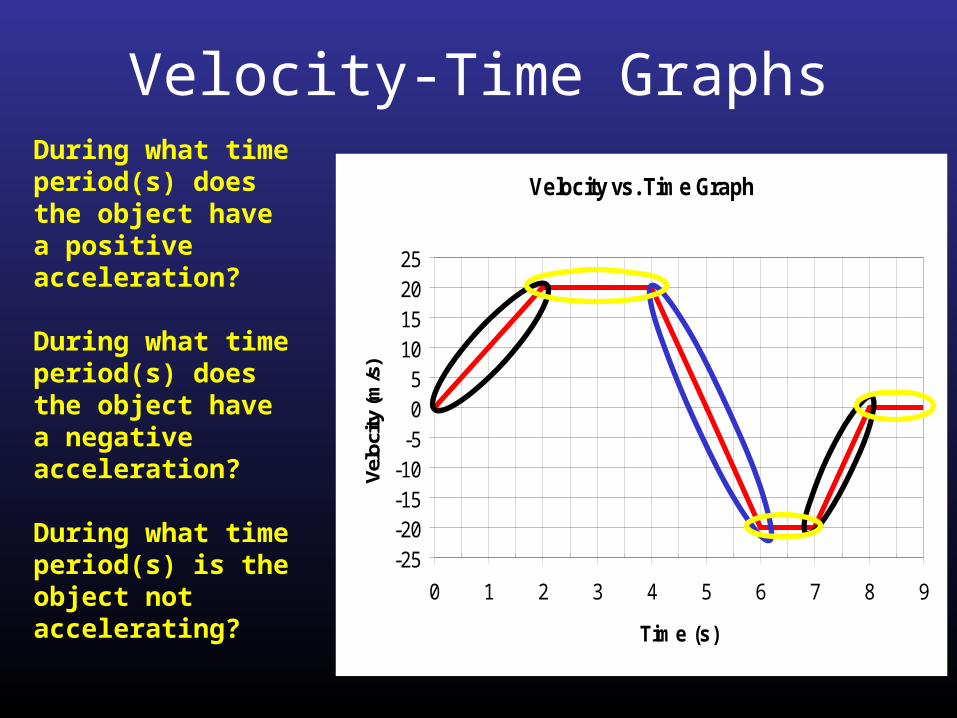
During what time period(s) does the object have a positive acceleration?
During what time period(s) does the object have a negative acceleration?
During what time period(s) is the object not accelerating?
Velocity-Time Graphs
Velocity vs. Time Graph
-25-20-15-10-505
10152025
0 1 2 3 4 5 6 7 8 9
Time (s)
Velo
city
(m/s
)
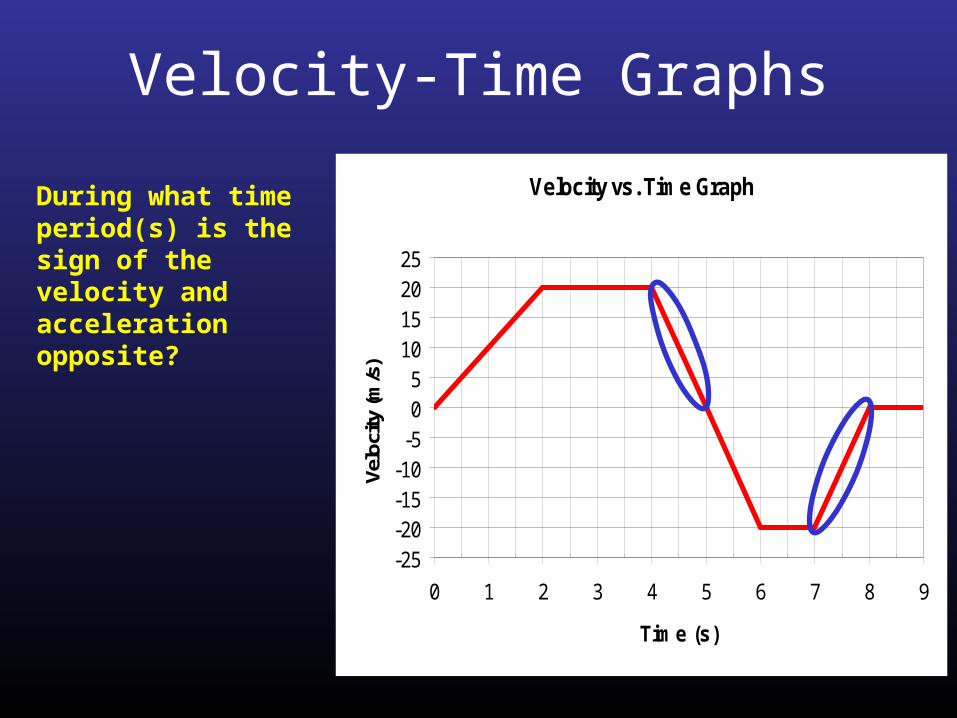
During what time period(s) is the sign of the velocity and acceleration opposite?

Constant Acceleration
• Acceleration that does not change in time is uniform or constant acceleration.
• On a Velocity-Time Graph, constant acceleration is a straight line

Velocity – Time Graph
The slope is the Acceleration
Velocity - Time Graph
0
10
20
30
40
50
60
70
80
0 1 2 3 4 5 6 7
Time (s)
Vel
oci
ty (
m/s
)

Acceleration vs. Time
0
2
4
6
8
10
12
0 0.5 1 1.5 2 2.5 3 3.5 4
Time (s)
Acce
lerati
on (m
/s^2)
Velocity of an Object with Constant Acceleration
• Constant Acceleration = Uniform Acceleration
Velocity vs. Time Graph
0
10
20
30
40
50
60
0 1 2 3 4
Time (s)
Velo
city
(m/s
)
What would the graph of a versus t look like?

Velocity of an Object with Constant Acceleration
D vs t v vs t a vs t

Distance v. Time
0
1
2
3
4
5
6
7
8
9
10
0 0.2 0.4 0.6 0.8 1
Time (s)
Dis
tan
ce (
m)
Zero Acceleration, Constant Speed
We can use small triangles to visualize the distance traveled per increment of time.
The same amount of distance is covered in the same amount of time.
The speed of the object remained constant.

Negative AccelerationWe can use small triangles to visualize the distance traveled per increment of time.
The second triangle is much smaller that the first triangle.
The larger size means that the body traveled more distance in the same increment of time
The object was moving slower during the second increment.
The object experienced a negative acceleration.
Distance v. Time
0
2
4
6
8
10
12
14
0 0.2 0.4 0.6 0.8 1
Time (s)
Dis
tan
ce (
m)

Positive Acceleration
Distance v. Time
0
10
20
30
40
50
60
0 0.2 0.4 0.6 0.8 1
Time (s)
Dis
tan
ce (
m)
We can use small triangles to visualize the distance traveled per increment of time.
The second triangle is much larger that the first triangle.
The larger size means that the body traveled more distance in the same increment of time
The object was moving faster during the second increment.
The object experienced a positive acceleration.

Instantaneous Speed• You raced your 4-wheeler
over a 30 mile long track in 1.5 hours.
• What is your average speed?• 20mph
• Watch the animation. Is the speed always 20mph?
t
x
tt
xxv
12
12

Graphs of Motion• Label the three distance v. time graphs below as
either accelerating positive, accelerating negative, or zero acceleration.
Distance v. Time
0
1
2
3
4
5
6
7
8
9
10
0 0.2 0.4 0.6 0.8 1
Time (s)
Dist
ance
(m)
Distance v. Time
0
10
20
30
40
50
60
0 0.2 0.4 0.6 0.8 1
Time (s)
Dist
ance
(m)
Distance v. Time
0
2
4
6
8
10
12
14
0 0.2 0.4 0.6 0.8 1
Time (s)
Dist
ance
(m)

Velocity versus Time• Label the three velocity versus time graphs below as either
– accelerating positive– accelerating negative – zero acceleration.
• Simply read the values directly from the graph.
Velocity v. Time
0
2
4
6
8
10
12
0 0.5 1 1.5
Time (s)
Velo
city
(m/s
)
Velocity v. Time
0
1
2
3
4
5
6
0 0.5 1 1.5
Time (s)
Velo
city
(m/s
)
Velocity v. Time
0
2
4
6
8
10
12
0 0.5 1 1.5
Time (s)
Velo
city
(m/s
)


