Ch. 7 STUDY GUIDE: Hypothesis Testing Hypothesis Testing Procedure Null Hypothesis Format: : = or : = “k” is the constant in the problem that represents the value being tested/the historical value of the mean or the proportion. Alternate Hypothesis Format: : < : > : ≠ : < : > : ≠ σ known? z σ unknown? t proportion/percentage? z Test Statistic “z” Left tailed test: look up value on z-table. P = table value Right tailed test: look up value on z-table P = 1 – table value Two tailed test: look up “negative” z score on table P = 2 x table value Test Statistic “t” If “t” is a negative number, always look up the positive version of it. Look at row where d.f. = n-1 Look where your t-value would be (between 2 values) Look up to top to find either the one-tail or two-tail values that your P-values will be between P = between A and B = (A, B) “less than” = left tailed test = one tail area “more than” = right tailed test = one tail area “different” = two tailed test = two tail area 2. State the Level of Significance, α, and the type of test (left/right/two) tailed 1. State the Null and Alternate Hypothesis 3. Determine which test statistic to use and then calculate it. 4. Find the “P-value” of your test statistic. 5. Make a decision about H 0 P ≤ α “REJECT” H 0 “The data is sufficient at the α-level to reject H0. It seems that the alternate hypothesis is true.” P > α “FAIL TO REJECT” H 0 “The data is insufficient at the α-level to reject H0. It seems that the null hypothesis is true.”
Transcript
Ch. 7 STUDY GUIDE: Hypothesis Testing
Hypothesis Testing Procedure
Null Hypothesis Format: 𝑯𝟎: 𝝁 = 𝒌 or 𝑯𝟎: 𝒑 = 𝒌 “k” is the constant in the problem that represents the
value being tested/the historical value of the mean or the proportion.
σ known? z σ unknown? t proportion/percentage? z Test Statistic “z” Left tailed test: look up value on z-table. P = table value Right tailed test: look up value on z-table P = 1 – table value Two tailed test: look up “negative” z score on table P = 2 x table value Test Statistic “t” If “t” is a negative number, always look up the positive version of it. Look at row where d.f. = n-1 Look where your t-value would be (between 2 values) Look up to top to find either the one-tail or two-tail values that your P-values will be between P = between A and B = (A, B)
“less than” = left tailed test = one tail area
“more than” = right tailed test = one tail area
“different” = two tailed test = two tail area
2. State the Level of Significance, α, and the type of test (left/right/two) tailed
1. State the Null and Alternate Hypothesis
3. Determine which test statistic to use and then calculate it.
4. Find the “P-value” of your test statistic.
5. Make a decision about H0
P ≤ α “REJECT” H0 “The data is sufficient at the α-level to reject H0. It seems that the alternate hypothesis is true.”
P > α “FAIL TO REJECT” H0
“The data is insufficient at the α-level to reject H0. It seems that the null hypothesis is true.”
Practice Questions: Not For a Grade For Questions 1 – 4: A small electronics store has begun to advertise in the local newspaper. Before advertising, the long term mean weekly sales were $9820. A random sample of 10 weeks while the newspaper ads were running had a sample mean weekly sale of x = $10,960. Does this indicate that the population mean weekly sales is now more than
$9820? Test at the 5% level of significance. Assume = $1580.
4. Based on your answers above, what is your conclusion?
(a) Do not reject H0 (b) Reject H0 (c) Cannot determine
For Questions 5 - 8 The average annual salary of employees at Wintertime Sports was $28,750 last year. This year the company opened another store. Suppose a random sample of 18 employees had an average annual salary of x = $25,810 with sample standard deviation of s = $4230. Use a 1% level of significance to test the claim that the average annual salary for all employees is different from last year’s average salary. Assume salaries are normally distributed.
(c) H0: = 25,810; H1: < 25,810 (d) H0: x = 25,810; H1: x 25,810
(e) H0: = 28,750; H1: ≠ 28,750
6. Compute the value of the test statistic.
(a) t = 2.95 (b) z = 2.95
(c) t = 2.87 (d) z = 12.51 (e) t = 2.95
7. Find the interval containing the P-value for the test statistic.
(a) P-value < 0.001 (b) P-value: (0.001 to 0.01)
(c) P-value : (0.01 to 0.02) (d) P-value: (0.0005 to 0.005) (e) P-value < 0.0005
8. Based on your answers above, what is your conclusion?
(a) Do not reject H0 (b) Reject H0 (c) Cannot determine
For Questions 9 – 12 The owner of Prices Limited claims that 75% of all the items in the store are less than $5. Suppose that you check a random sample of 146 items in the store and find that 105 have prices less than $5. Does this indicate that the
proportion of items in the store costing less than $5 is different from 75%? Use = 0.01.
9. State the null and alternate hypotheses.
(a) H0: p = 0.05; H1: p ≠ 0.05 (b) H0: p = 5; H1: p 5
(c) H0: p̂ = 0.75; H1: p̂ 0.75 (d) H0: p = 0.75; H1: p 0.75
(e) H0: p̂ = 0.72; H1: p̂ 0.72
10. Compute the value of the test statistic.
(a) t = 0.86 (b) t = 0.73
(c) z = 0.73 (d) z = 0.86 (e) z = 0.86
11. Find the P-value for the sample test statistic.
12. Based on your answers above, what is your conclusion?
(a) Do not reject H0 (b) Reject H0 (c) Cannot determine
For Questions 13 – 16: A machine in the lodge at a ski resort dispenses a hot chocolate drink. The average cup of hot chocolate is
supposed to contain 7.75 ounces. We may assume that x has a normal distribution with = 0.3 ounces. A random sample of 16 cups of hot chocolate from this machine had a mean content of 7.62 ounces. Do you think the machine needs an adjustment? Use a 5% level of significance and test whether the mean amount of liquid is different than 7.75 ounces.
16. Based on your answers for parts AD, what is your conclusion?
(a) Do not reject H0 (b) Reject H0 (c) Cannot determine
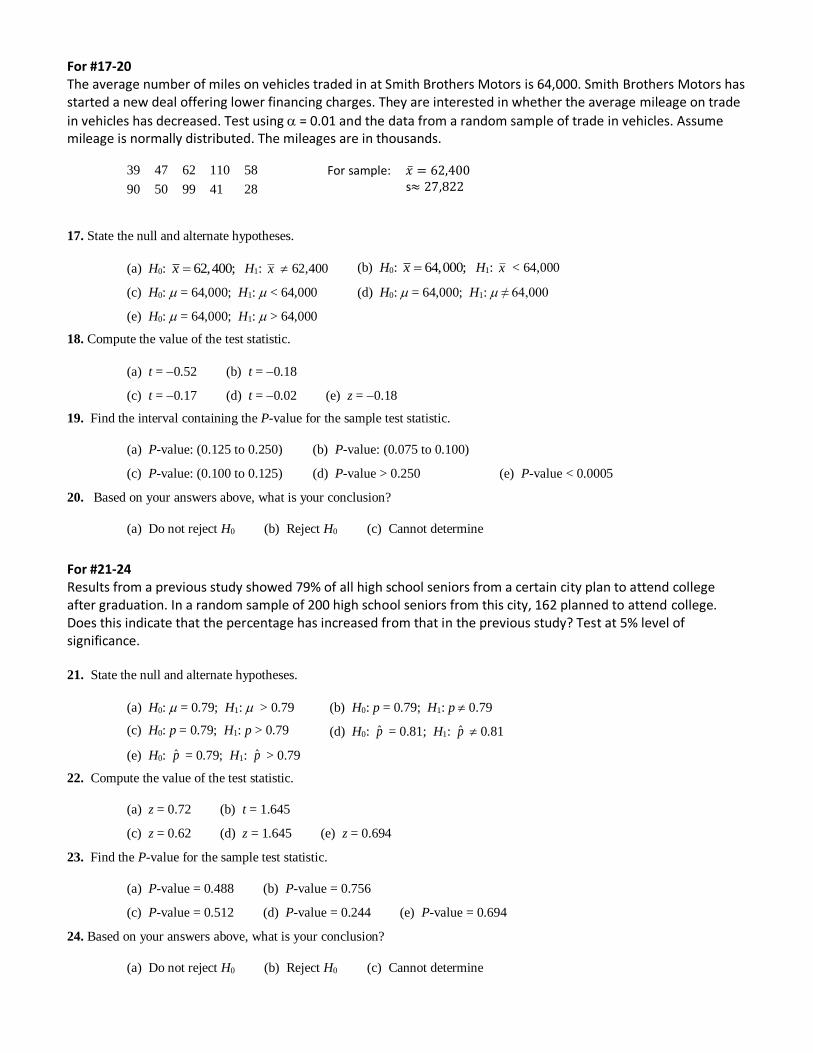
For #17-20 The average number of miles on vehicles traded in at Smith Brothers Motors is 64,000. Smith Brothers Motors has started a new deal offering lower financing charges. They are interested in whether the average mileage on trade
in vehicles has decreased. Test using = 0.01 and the data from a random sample of trade in vehicles. Assume mileage is normally distributed. The mileages are in thousands.
39 47 62 110 58
90 50 99 41 28
17. State the null and alternate hypotheses.
(a) H0: 62,400;x H1: x 62,400 (b) H0: 64,000;x H1: x < 64,000
20. Based on your answers above, what is your conclusion?
(a) Do not reject H0 (b) Reject H0 (c) Cannot determine
For #21-24 Results from a previous study showed 79% of all high school seniors from a certain city plan to attend college after graduation. In a random sample of 200 high school seniors from this city, 162 planned to attend college. Does this indicate that the percentage has increased from that in the previous study? Test at 5% level of significance. 21. State the null and alternate hypotheses.
(a) H0: = 0.79; H1: > 0.79 (b) H0: p = 0.79; H1: p 0.79
(c) H0: p = 0.79; H1: p > 0.79 (d) H0: p̂ = 0.81; H1: p̂ 0.81
(e) H0: p̂ = 0.79; H1: p̂ > 0.79
22. Compute the value of the test statistic.
(a) z = 0.72 (b) t = 1.645
(c) z = 0.62 (d) z = 1.645 (e) z = 0.694
23. Find the P-value for the sample test statistic.
24. Based on your answers above, what is your conclusion?
(a) Do not reject H0 (b) Reject H0 (c) Cannot determine
For sample: �̅� = 62,400 s≈ 27,822
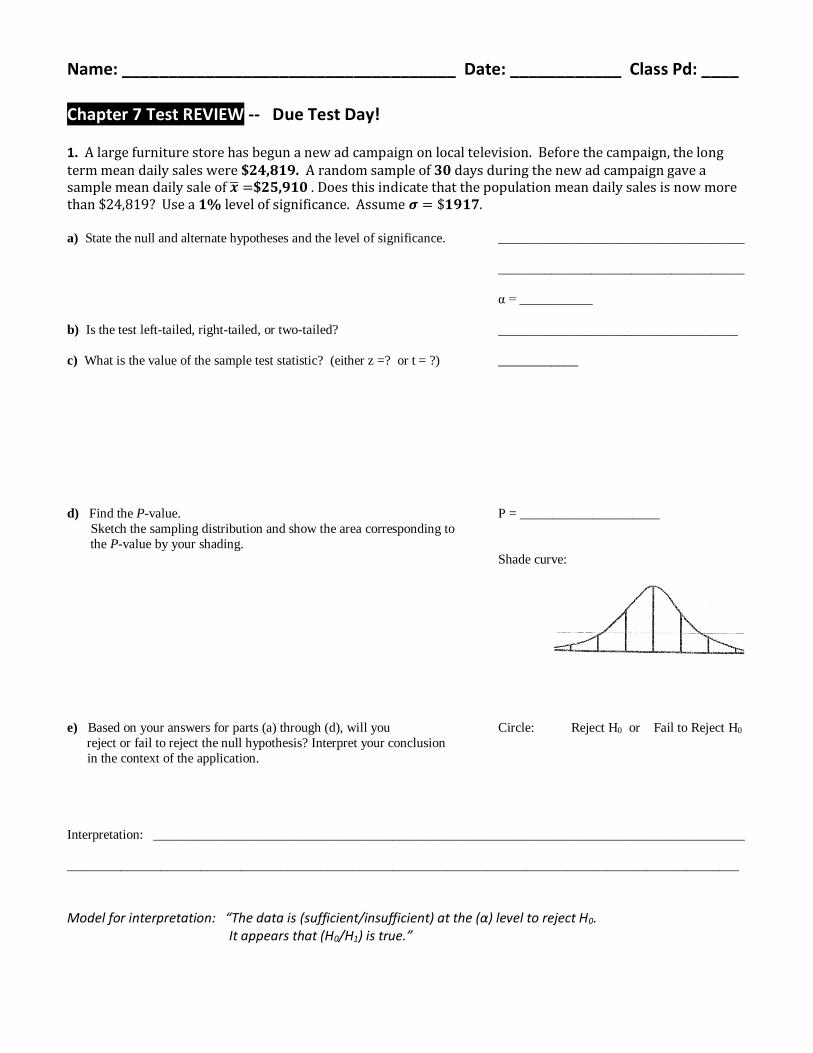
Name: ____________________________________ Date: ____________ Class Pd: ____ Chapter 7 Test REVIEW -- Due Test Day!
1. A large furniture store has begun a new ad campaign on local television. Before the campaign, the long term mean daily sales were $24,819. A random sample of 30 days during the new ad campaign gave a sample mean daily sale of �̅� =$25,910 . Does this indicate that the population mean daily sales is now more than $24,819? Use a 1% level of significance. Assume 𝝈 = $𝟏𝟗𝟏𝟕.
a) State the null and alternate hypotheses and the level of significance. _____________________________________
_____________________________________
α = ___________
b) Is the test left-tailed, right-tailed, or two-tailed? ____________________________________
c) What is the value of the sample test statistic? (either z =? or t = ?) ____________
d) Find the P-value. P = _____________________
Sketch the sampling distribution and show the area corresponding to
the P-value by your shading.
Shade curve:
e) Based on your answers for parts (a) through (d), will you Circle: Reject H0 or Fail to Reject H0
reject or fail to reject the null hypothesis? Interpret your conclusion
Model for interpretation: “The data is (sufficient/insufficient) at the (α) level to reject H0. It appears that (H0/H1) is true.”
2. A new bus route has been established between downtown Denver and Englewood, a suburb of Denver. Buddy has taken the bus to work for many years. For the old bus route, he knows from long experience that the mean waiting time between buses at his stop was 𝝁 = 𝟏𝟖. 𝟑 minutes. However, a random sample of 5 waiting times between buses using the new route had a mean �̅� = 𝟏𝟖. 𝟏 minutes with a sample standard deviation of s = 6.2 minutes. Does this indicate that the population mean waiting time for the new route is less than what it used to be? Use α = .05. Assume that x is normally distributed.
a) State the null and alternate hypotheses and the level of significance. _____________________________________
_____________________________________
α = ___________
b) Is the test left-tailed, right-tailed, or two-tailed? ____________________________________
c) What is the value of the sample test statistic? (either z =? or t = ?) ____________
d) Find the P-value. P = _____________________
Sketch the sampling distribution and show the area corresponding to
the P-value by your shading.
Shade curve:
e) Based on your answers for parts (a) through (d), will you Circle: Reject H0 or Fail to Reject H0
reject or fail to reject the null hypothesis? Interpret your conclusion
Model for interpretation: “The data is (sufficient/insufficient) at the (α) level to reject H0. It appears that (H0/H1) is true.”
3. The State Fish and Game Division claim that 75% of the fish in Homestead Creek are rainbow trout. However, the local fishing club caught and released 189 fish one weekend. They found that the 125 were rainbow trout. Does this indicate that the percentage of rainbow trout in Homestead Creek is less than 75%? Use α =0.01.
a) State the null and alternate hypotheses and the level of significance. _____________________________________
_____________________________________
α = ___________
b) Is the test left-tailed, right-tailed, or two-tailed? ____________________________________
c) What is the value of the sample test statistic? (either z =? or t = ?) ____________
d) Find the P-value. P = _____________________
Sketch the sampling distribution and show the area corresponding to
the P-value by your shading.
Shade curve:
e) Based on your answers for parts (a) through (d), will you Circle: Reject H0 or Fail to Reject H0
reject or fail to reject the null hypothesis? Interpret your conclusion