9. Find the exact real solutions of the equation 2 16 4 35x x x , if they exist. A) 5 and 7x x B) 5 and 7x x C) 6 and 8x x D) 6 and 7x x E) 6 and 8x x Ans: B
10.
Find the exact real solutions of the equation 25 17
1 024 12
yy , if they exist.
A) 4 and 6
5y y
B) 4 and 6y y C) 4 and 6y y D) 4
and 65
y y
E) –6 and 4y y Ans: D
11. Find the exact real solutions of the equation 26 12 5x x , if they exist.
A) 66 661 and 1
6 6x x
B) 6 61 and 1
6 6x x
C) 31 311 and 1
6 6x x
D) 6 61 and 1
5 5x x
E) Real solutions do not exist. Ans: B
12. Solve the equation by using a graphing utility.
2–14 105 7 0x x A) 3, –5x x B) 3, 3x x C) –42, 70x x D) –3, 5x x E) –7, 105x x Ans: A
download from https://testbankgo.eu/p/Harshbarger/Reynolds, Mathematical Applications for the Management, Life, and Social Sciences, 10e
13. Solve the equation 26.5 6.3 2.6 0z z by using a graphing utility. Round your answer to two decimal places. A) 1.04 or –0.07x x B) 1.86 or –0.92x x C) 1.28 or –0.31x x D) 1.75 or –0.78x x E) 1.40 or –0.43x x Ans: C
14.
Multiply both sides of the equation 9
10xx
by the LCD, and then solve the resulting
quadratic equation. A) 9,1x B) 10,1x C) 9,10x D) 1, 1x E) 9, 1x Ans: A
15.
Solve the equation 4
54 4
xx
x x
by first multiplying by the LCD, and then solving
the resulting equation. A) 1x B) 1x C) 1
5x
D) 1, 4
5x x
E) 1
5x
Ans: D
16. Solve the equation below using quadratic methods. 2( 8) 3( 8) 2 0x x
A) 10, 9x x B) 8, 2x x C) 6, 1x x D) –10, –9x x E) 8, 3x x Ans: D
download from https://testbankgo.eu/p/Harshbarger/Reynolds, Mathematical Applications for the Management, Life, and Social Sciences, 10e
17. If the profit from the sale of x units of a product is 285 400p x x , what level(s) of production will yield a profit of $1100 ? A) less than 25 units of production. B) more than 60 units of production C) 85 units of production D) 35 units of production E) 25 or 60 units of production. Ans: E
18. If a ball is thrown upward at 64 feet per second from the top of a building that is 100
feet high, the height of the ball can be modeled by 2100 64 16s t t , where t is the number of seconds after the ball is thrown. How long
after it is thrown is the height 100 feet? A) 4t seconds B) 32t seconds C) 1t seconds D) 64t seconds E) 5.20t seconds Ans: A
19. The amount of airborne particulate pollution p from a power plant depends on the wind
speed s, among other things, with the relationship between p and s approximated by 249 0.01p s . Find the value of s that will make 0p .
A) 700s B) 80s C) 70s D) 49s E) 490s Ans: C
20. The sensitivity S to a drug is related to the dosage size by 290S x x , where x is the
dosage size in milliliters. Determine all dosages that yield 0 sensitivity. A) 0x milliliters, 9x milliliters B) 0x milliliters, 90x milliliters C) 0x milliliters, 90x milliliters D) 90x milliliters, 90x milliliters E) 0x milliliters Ans: B
download from https://testbankgo.eu/p/Harshbarger/Reynolds, Mathematical Applications for the Management, Life, and Social Sciences, 10e
21. The time t, in seconds, that it takes a 2005 Corvette to accelerate to x mph can be
described by 20.001 0.729 15.415 607.738t x x . How fast is the Corvette going
after 9.06 seconds? Give your answer to the nearest tenth. A) 101.6 mph B) 97.6 mph C) 103.6 mph D) 118.3 mph E) 118.8 mph Ans: B
22. Suppose that the percent of total personal income that is used to pay personal taxes is
given by 20.034 0.044 12.642y x x , where x is the number of years past 1990 (Source: Bureau of Economic Analysis, U.S. Department of Commerce). Find the year or years when the percent of total personal income used to pay personal taxes is 14 percent. A) 2007 B) 1997 C) 1996 D) 2032 E) 2004 Ans: B
23. A fissure in the earth appeared after an earthquake. To measure its vertical depth, a
stone was dropped into it, and the sound of the stone's impact was heard 3.1 seconds later. The distance (in feet) the stone fell is given by 2
118 ,s t and the distance (in feet)
the sound traveled is given by 21090s t . In these equations, the distances traveled by
the sound and the stone are the same, but their times are not. Using the fact that the total time is 3.1 seconds, find the depth of the fissure. Round your answer to two decimal places. A) 63.51 feet B) 60.56 feet C) 157.25 feet D) 161.25 feet E) 162.25 feet Ans: C
24. An equation that models the number of users of the Internet is
211.786 142.214 493y x x million users, where x is the number of years past 1990 (Source: CyberAtlas, 1999). If the pattern indicated by the model remains valid, when does this model predict there will be 500 million users? A) 2001 B) 2014 C) 2011 D) 2005 E) 2003 Ans: E
download from https://testbankgo.eu/p/Harshbarger/Reynolds, Mathematical Applications for the Management, Life, and Social Sciences, 10e
25. The model for body-heat loss depends on the coefficient of convection K, which depends on wind speed v according to the equation 2 19 5K v where v is in miles per hour. Find the positive coefficient of convection when the wind speed is 26 mph. Round your answer to the nearest integer. A) 19K B) 22K C) 5K D) 8K E) 20K Ans: B
26. Find the vertex of the graph of the equation
20.125y x x A) (4, –2) B) (4,2) C) (–2, –4) D) (–4, –2) E) (0,8) Ans: D
27. Determine if the vertex of the graph of the equation is a maximum or minumim point.
213
4y x x
A) vertex is at a maximum point B) vertex is at a minimum point C) has no vertex Ans: B
28. Find the vertex of the graph of the equation
22 – 3y x x A) (0.75, –1.13) B) (2, –3) C) (0,1.50) D) (–1.13,0.75) E) (1.50, 1.50) Ans: A
download from https://testbankgo.eu/p/Harshbarger/Reynolds, Mathematical Applications for the Management, Life, and Social Sciences, 10e
29. Determine what value of x gives the optimal value of the function, and determine the optimal (maximum or minimum) value.
22 – 3y x x A) optimal value of x: 0, optimal value: 1 B) optimal value of x: –1.13 , optimal value: 0.75 C) optimal value of x: 1.50 , optimal value: –1.50 D) optimal value of x: –0.75 , optimal value: –1.13 E) optimal value of x: 0.75 , optimal value: –1.13 Ans: E
30. Determine whether the function’s vertex is a maximum point or a minimum point and
find the coordinates of this point. 2 12 6y x x
A) vertex: (–6, –30) , a minimum point B) vertex: (6, –42) , a maximum point C) vertex: (6, –42) , a minimum point D) vertex: (–6, –30) , a maximum point E) vertex: (–42,6) , a maximum point Ans: A
download from https://testbankgo.eu/p/Harshbarger/Reynolds, Mathematical Applications for the Management, Life, and Social Sciences, 10e
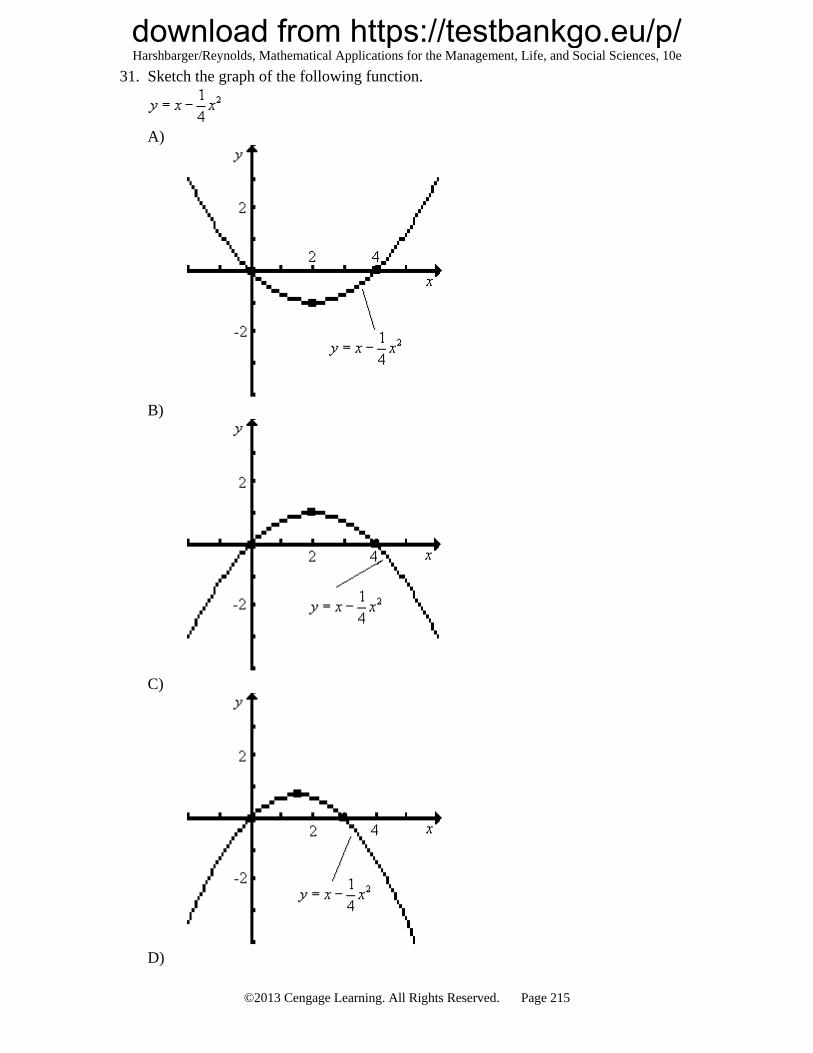
33. Determine whether the vertex of the graph of the following function vertex is a maximum point or a minimum point. Also find the coordinates of the vertex.
21 + 2 – 8 0
7x x y
A) vertex: (–7, –15) , a maximum point B) vertex: (–7, –15) , a minimum point C) vertex: (7, –15) , a minimum point D) vertex: (14,48) , a minimum point E) vertex: (–15,7) , a maximum point Ans: B
34. Find the x-intercepts, if any exist.
21 + 3 – 5 0
4x x y
A) x-intercepts: –6.00, –14.00x x B) x-intercepts: –1.48, 13.48x x C) x-intercepts: 1.48, –13.48x x D) x-intercepts: 12.00, 67.00x x E) no x-intercepts Ans: C
35. How is the graph of 2y x shifted to obtain the graph of the function 2( 5) 11y x ?
A) shifted 5 units to the left and 11 units up B) shifted 5 units to the right and 11 units down C) shifted 25 units to the left and 11 units up D) shifted 10 units to the right and 11 units down E) shifted 5 units to the right and 11 units up Ans: E
36. Use a graphing utility to find the vertex of the function.
21 3
20 4y x x
A) vertex: (10, –5.75) B) vertex: origin C) vertex: (10,15.75) D) vertex: (10,14.25) E) vertex: ( 10, –5.75) Ans: A
download from https://testbankgo.eu/p/Harshbarger/Reynolds, Mathematical Applications for the Management, Life, and Social Sciences, 10e
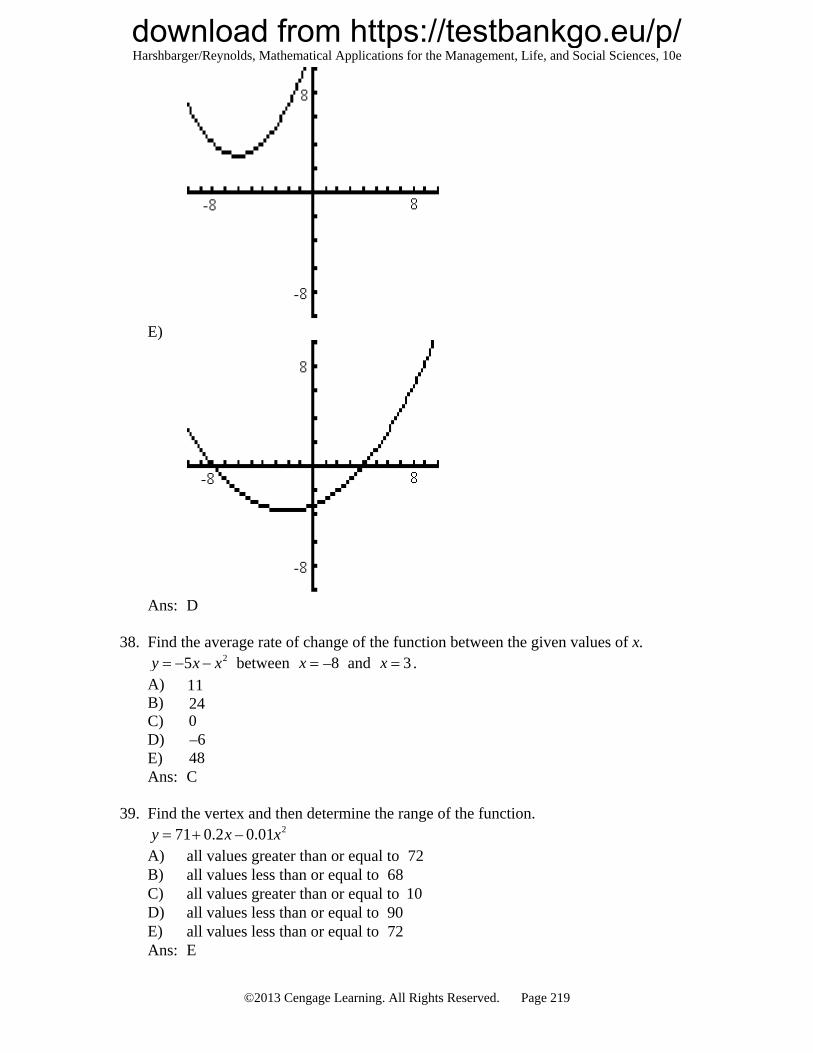
38. Find the average rate of change of the function between the given values of x. 25y x x between –8x and 3x .
A) 11 B) 24 C) 0 D) –6 E) 48 Ans: C
39. Find the vertex and then determine the range of the function.
271 0.2 – 0.01y x x A) all values greater than or equal to 72 B) all values less than or equal to 68 C) all values greater than or equal to 10 D) all values less than or equal to 90 E) all values less than or equal to 72 Ans: E
download from https://testbankgo.eu/p/Harshbarger/Reynolds, Mathematical Applications for the Management, Life, and Social Sciences, 10e
40. Use a graphing utility to approximate the solutions to ( ) 0f x . 2( ) 3 – 20 20f x x x
A) 16.32, 3.68x x B) –1.23, –5.44x x C) 5.44, 1.23x x D) 3.33, –13.33x x E) 5.44, 1.23x x Ans: C
41. Factor the function 2( ) 2 – 21 49f x x x .
A) ( ) ( 7)( 7)f x x x B) ( ) –21( 7)(2 7)f x x x C) ( ) ( 7)(2 7)f x x x D) 7
( ) ( 7)( )2
f x x x
E) ( ) (7 1)(2 7)f x x x Ans: C
42. Solve ( ) 0f x for the function 2( ) 5 –102 289f x x x .
A) 17, –102
5x x
B) 1717,
5x x
C) 517,
17x x
D) 1717,
5x x
E) no real solutions Ans: D
43. The daily profit from the sale of a product is given by 220 – 0.2 – 99P x x dollars.
What level of production maximizes profit? A) production level of 100 units B) production level of 10 units C) production level of 5 units D) production level of 50 units E) production level of 95 units Ans: D
download from https://testbankgo.eu/p/Harshbarger/Reynolds, Mathematical Applications for the Management, Life, and Social Sciences, 10e
44. The daily profit from the sale of a product is given by 220 – 0.2 – 96P x x dollars. What is the maximum possible profit? A) $894 B) $1404 C) $ 404 D) $50 E) $95 Ans: C
45. The daily profit from the sale of a product is given by 288 – 0.3 – 210P x x dollars.
What is the maximum possible profit? Round your answer to the nearest dollar. A) $ 6,243 B) $19,209 C) $12,682 D) $147 E) $ 291 Ans: A
46. The yield in bushels from a grove of orange trees is given by 1100 ,Y x x where x
is the number of orange trees per acre. How many trees will maximize the yield? A) 1100 trees B) 2200 trees C) 600 trees D) 1150 trees E) 550 trees Ans: E
47. The sensitivity S to a drug is related to the dosage x in milligrams by 2980S x x .
Use a graphing utility to determine what dosage gives maximum sensitivity. A) 98 B) 240,100 C) 980 and 0x D) 980 E) 490 Ans: E
48. A ball thrown vertically into the air has its height above ground given by
2112 –16s t t , where t is in seconds and s is in feet. Find the maximum height of the ball. A) 224 feet B) 112feet C) 7 feet D) 16 feet E) 196 feet Ans: E
download from https://testbankgo.eu/p/Harshbarger/Reynolds, Mathematical Applications for the Management, Life, and Social Sciences, 10e
49. The owner of a skating rink rents the rink for parties at $ 648 if 54 or fewer skaters attend, so that the cost per person is $12 if 54 attend. For each 5 skaters above 54 , she reduces the price per skater by $0.50. Which table gives the revenue generated if 54 , 64 , and 74 skaters attend? A) Price No. of skaters Total Revenue
12 54 $ 740 11 64 $ 704 10 74 $ 648
B) Price No. of skaters Total Revenue
12 54 $ 648 13 64 $ 704 14 74 $ 740
C) Price No. of skaters Total Revenue
12 54 $ 648 11 64 $ 704 10 74 $ 740
D) Price No. of skaters Total Revenue
12 54 $ 648 13 64 $832 14 74 $1036
E) Price No. of skaters Total Revenue
12 54 $ 648 11.5 64 $ 736 11 74 $814
Ans: C
50. When a stone is thrown upward, it follows a parabolic path given by a form of the equation 2 .y ax bx c If 0y represents ground level, find the equation of a stone that is thrown from ground level at 0x and lands on the ground 100 units away if the stone reaches a maximum height of 100 units. A) 21
250
y x x
B) 214
25y x x
C) 2 14
25y x x
D) 2 12
50y x x
E) 22 50y x x
Ans: B
download from https://testbankgo.eu/p/Harshbarger/Reynolds, Mathematical Applications for the Management, Life, and Social Sciences, 10e
51. In 1995, America’s 45 million Social Security recipients received a 2.6% cost-of-living increase, the second smallest increase in nearly 20 years, a reflection of lower inflation. The percent increase might be described by the function
2( ) –0.4375 7.4 – 34.3625p t t t , where t is the number of years past 1980. In what year does the model predict the highest cost of living percent increase? A) 1989 B) 2008 C) 1986 D) 1988 E) none of the above Ans: D
download from https://testbankgo.eu/p/Harshbarger/Reynolds, Mathematical Applications for the Management, Life, and Social Sciences, 10e
decribed by the equation 286 6 3p q q . Algebraically determine the equilibrium point for the supply and demand functions. A) (2.87, –4.58)E B) (–4.58,44.11)E C) 1
( ,86)2
E
D) (2.87,44.11)E E) (2.87,4.11)E Ans: D
54. If the supply function for a commodity is 2 8 16p q q and the demand function is
2–9 6 426p q q , find the equilibrium quantity and equilibrium price. A) (6.30,35.15)E B) (–6.50,72.74)E C) (6.30,72.74)E D) (6.30,51.15)E E) (6.30,106.17)E Ans: E
55. If the supply and demand functions for a commodity are given by 8 290p q and
2 5720,p q respectively, find the price that will result in market equilibrium.
A) 38 B) 110 C) 50 D) 142 E) 63 Ans: C
56. If the supply and demand functions for a commodity are given by 10p q and
(2 10) 1000q p , what is the equilibrium price and what is the corresponding number of units supplied and demanded? A) (30.00,20.00)E B) (30.00, –15.00)E C) (30.00,40.00)E D) (15.00, –25.00)E E) (15.00,40.00)E Ans: A
download from https://testbankgo.eu/p/Harshbarger/Reynolds, Mathematical Applications for the Management, Life, and Social Sciences, 10e
57. The supply function for a product is 2 10 0,p q while the demand function for the same product is ( 10)( 30) 7200p q . Find the market equilibrium point E(q,p). A) (110.00,50.00)E B) (–150.00, –70.00)E C) (30,10)E D) (90.00,50.00)E E) (–70.00,50.00)E Ans: D
58. The supply function for a product is 2 10 0,p q while the demand function for the
same product is ( 10)( 30) 6600p q . If a $22 tax is placed on production of the item, then the supplier passes this tax on by adding $22 to his selling price. Find the new equilibrium point E(q,p) for this product when the tax is passed on. (The new supply function is given by 1
2 27.)p q
A) (32.17,43.08)E B) (44.46,49.23)E C) (32.17,49.23)E D) (64.98,59.49)E E) (–168.98,43.08)E Ans: D
59. The total costs for a company are given by 2( ) 2,925 20C x x x , and the total
revenues are given by ( ) 130R x x . Find the break-even points. A) Break-even values are at 45x and 65x units. B) Break-even values are at infx units. C) Break-even values are at infx units. D) Break-even values are at 22.50x and 32.50x units. E) Break-even values are at 65x units. Ans: A
60. If a firm has the following cost and revenue functions, find the break-even points.
21( ) 4800 25 ,
21
( ) 2152
C x x x
R x x x
A) Break-even values are at 40x and 160x units. B) Break-even values are at 30x and 110x units. C) Break-even values are at 40x and 110x units. D) Break-even values are at 160x and 110x units. E) Break-even values are at 30x and 160x units. Ans: E
download from https://testbankgo.eu/p/Harshbarger/Reynolds, Mathematical Applications for the Management, Life, and Social Sciences, 10e
61. If a company has total costs 2( ) 15,000 35 0.1C x x x , and total revenues given by 2( ) 385 0.9R x x x , find the break-even points.
A) Break-even values are at 300x and 175 units. B) Break-even values are at 300x and 50 units. C) Break-even values are at 0x and 427.78 units. D) Break-even values are at 175x units. E) Break-even values are at 175x and 427.78 units. Ans: B
62. If total costs are ( ) 1100 1500C x x and total revenues are 2( ) 1620 ,R x x x find
the break-even points. A) Break-even values are at 10x and 50x units. B) Break-even values are at 10x and 110x units. C) Break-even values are at 50x and 110x units. D) Break-even values are at 10x and 115x units. E) Break-even values are at 50x and 115x units. Ans: B
63. Given the profit function, 2( ) –14.5 0.1 300P x x x , and that production is restricted
to fewer than 75 units, find the break-even point(s). A) Break-even value is at 21x units. B) Break-even value is at 20.83x units. C) Break-even value is at 75x units. D) Break-even value is at 120x units. E) Break-even value is at 25x units. Ans: E
64. Find the maximum revenue for the revenue function 2( ) 475 0.8 .R x x x
A) $70,507.81 B) $211,523.44 C) $52,880.86 D) $193,896.48 E) $212,523.44 Ans: A
65. If, in a monopoly market, the demand for a product is 170 – 0.25p x , and the revenue
function is R px , where x is the number of units sold, what price will maximize revenue? A) Price that will maximize revenue is $85.00p . B) Price that will maximize revenue is $191.25p . C) Price that will maximize revenue is $255.00p . D) Price that will maximize revenue is $340.00p . E) Price that will maximize revenue is $170.00p . Ans: A
download from https://testbankgo.eu/p/Harshbarger/Reynolds, Mathematical Applications for the Management, Life, and Social Sciences, 10e
66. The profit function for a certain commodity is 2( ) 110 900P x x x . Find the level of production that yields maximum profit, and find the maximum profit. A) Production levels of 110 yields a maximum profit of $900 . B) Production levels of 110 yields a maximum profit of $ 2125 . C) Production levels of 55 yields a maximum profit of $5095 . D) Production levels of 55 yields a maximum profit of $3025 . E) Production levels of 55 yields a maximum profit of $ 2125 . Ans: E
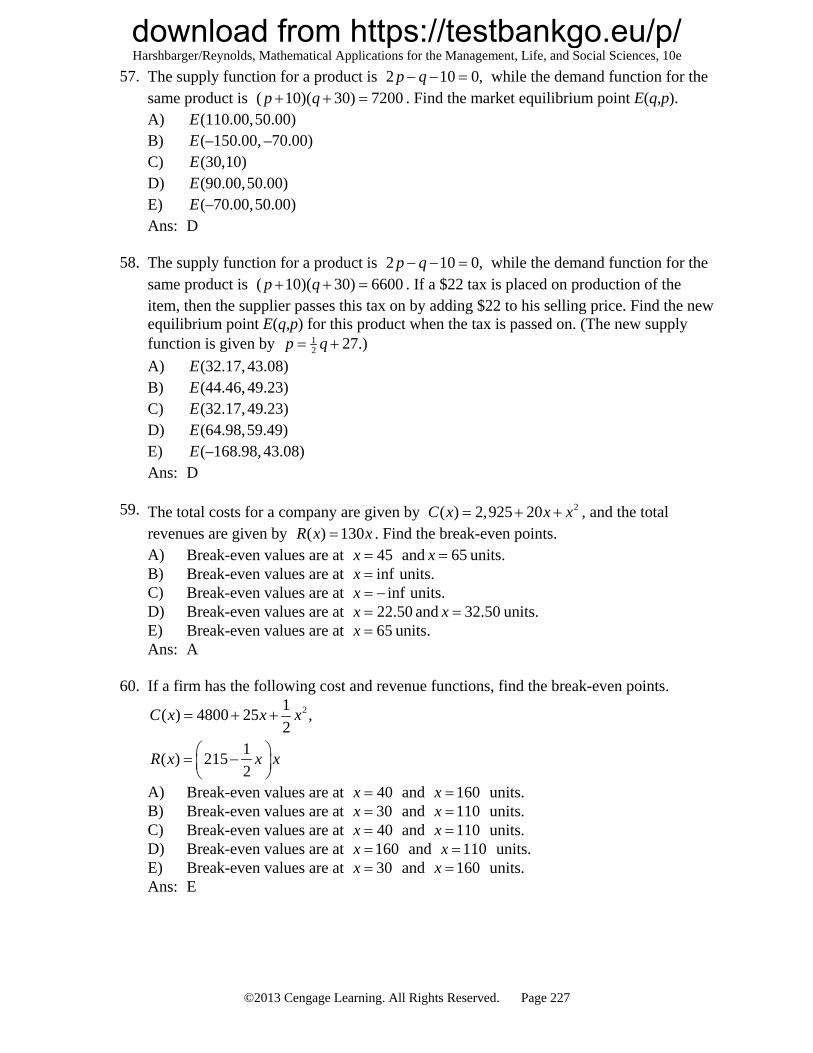
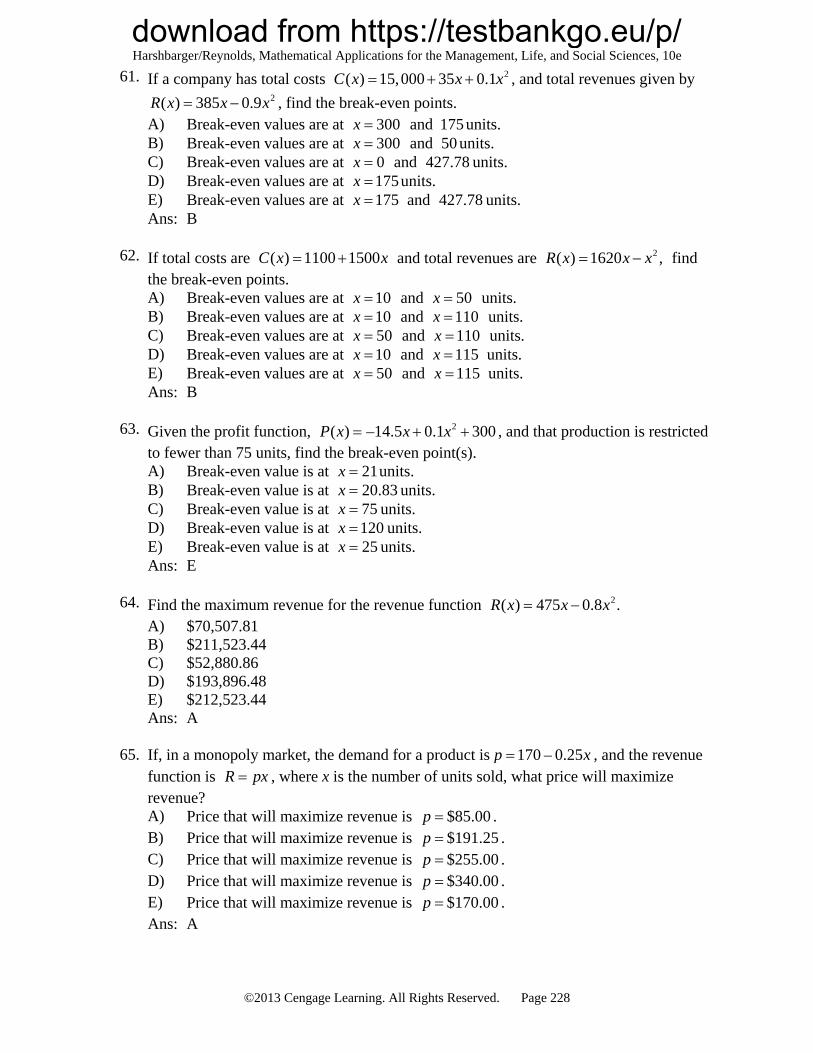
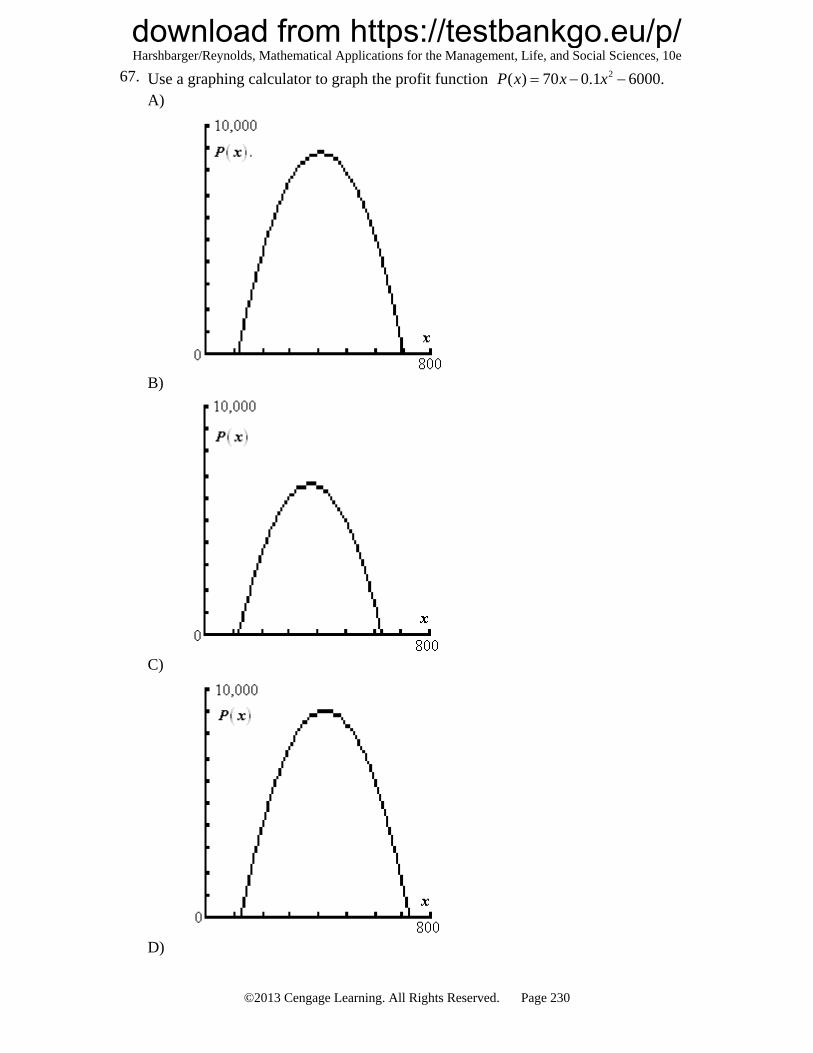
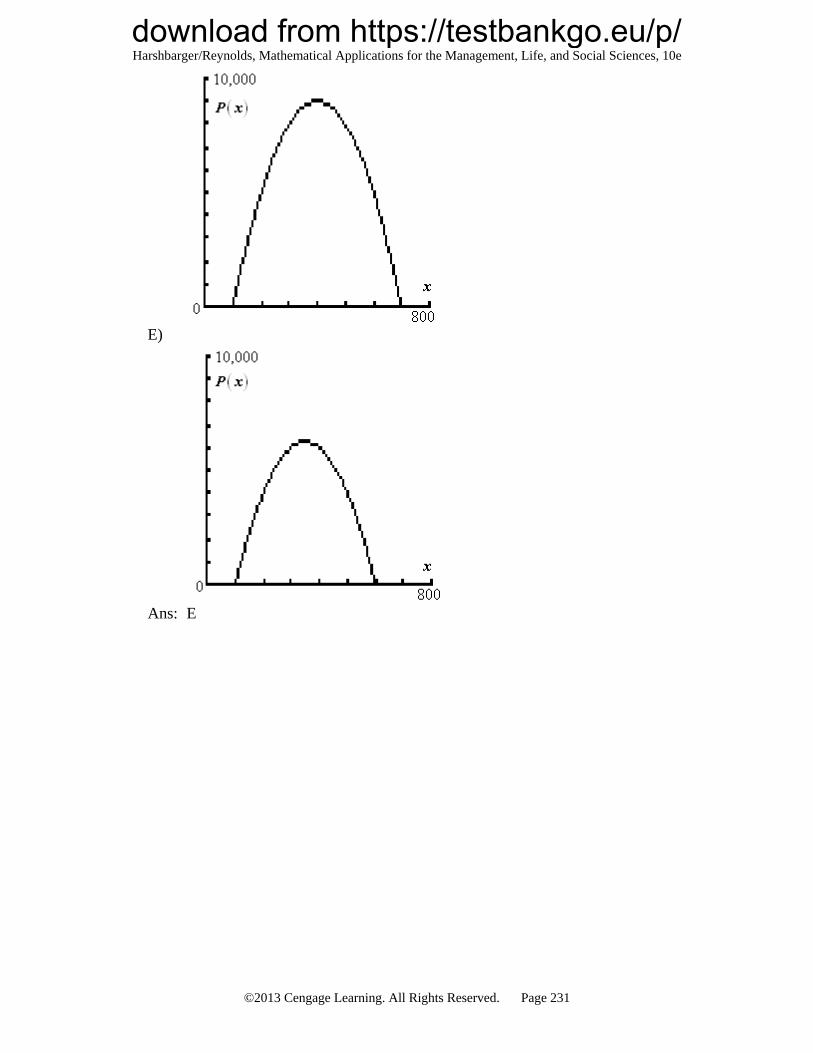
download from https://testbankgo.eu/p/Harshbarger/Reynolds, Mathematical Applications for the Management, Life, and Social Sciences, 10e
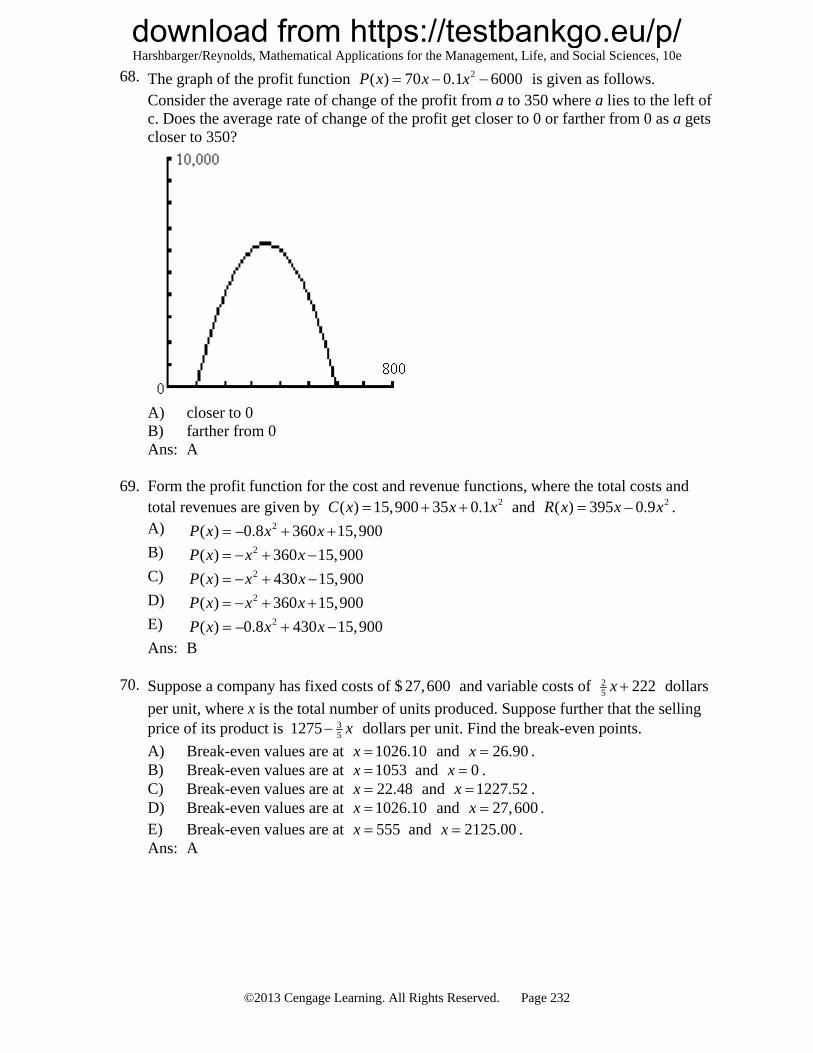
68. The graph of the profit function 2( ) 70 0.1 6000P x x x is given as follows. Consider the average rate of change of the profit from a to 350 where a lies to the left of c. Does the average rate of change of the profit get closer to 0 or farther from 0 as a gets closer to 350?
A) closer to 0 B) farther from 0 Ans: A
69. Form the profit function for the cost and revenue functions, where the total costs and
total revenues are given by 2( ) 15,900 35 0.1C x x x and 2( ) 395 – 0.9R x x x . A) 2( ) –0.8 360 15,900P x x x B) 2( ) 360 15,900P x x x C) 2( ) 430 15,900P x x x D) 2( ) 360 15,900P x x x E) 2( ) –0.8 430 15,900P x x x Ans: B
70. Suppose a company has fixed costs of $ 27,600 and variable costs of 2
5 222x dollars
per unit, where x is the total number of units produced. Suppose further that the selling price of its product is 3
51275 x dollars per unit. Find the break-even points.
A) Break-even values are at 1026.10x and 26.90x . B) Break-even values are at 1053x and 0x . C) Break-even values are at 22.48x and 1227.52x . D) Break-even values are at 1026.10x and 27,600x . E) Break-even values are at 555x and 2125.00x . Ans: A
download from https://testbankgo.eu/p/Harshbarger/Reynolds, Mathematical Applications for the Management, Life, and Social Sciences, 10e
71. Suppose a company has fixed costs of $ 27,000 and variable costs of 25 222x dollars
per unit, where x is the total number of units produced. Suppose further that the selling price of its product is 3
51300 x dollars per unit. Find the maximum revenue.
A) Maximum revenue is $1052.34 . B) Maximum revenue is $ 27,000 . C) Maximum revenue is $ 26,850.00 . D) Maximum revenue is $ 650,000.00 . E) Maximum revenue is $ 600 . Ans: D
72. Assume that sales revenues for Continental Divide Mining can be described by
2( ) –0.031 0.776 0.179R t t t , where t is the number of years past 1992. Use the function to determine the year in which maximum revenue occurs. A) Maximum revenue occurred during 2005 . B) Maximum revenue occurred during 1992. C) Maximum revenue occurred during 2004 . D) Maximum revenue occurred during 2017 . E) Maximum revenue occurred during 1991. Ans: C
73. Assume that sales revenues, in millions, for Continental Divide Mining can be described
by 2( ) –0.041 0.676 0.179R t t t , where t is the number of years past 1992. Use the function to find the maximum revenue. A) Maximum revenue is $8.244 million. B) Maximum revenue is $5.636 million. C) Maximum revenue is $ 2.786 million. D) Maximum revenue is $ 2.965 million. E) Maximum revenue is $13.996 million. Ans: D
74. Assume that costs and expenses for Continental Divide Mining can be described by
2( ) 0.011 0.526 0.722C t t t and the sales revenue can be described by 2( ) 0.027 0.811 0.178R t t t where t is the number of years since the beginning of
1992. Find the year in which maximum profit occurs. A) 2009 B) 1995 C) 2000 D) 2001 E) 1996 Ans: C
download from https://testbankgo.eu/p/Harshbarger/Reynolds, Mathematical Applications for the Management, Life, and Social Sciences, 10e
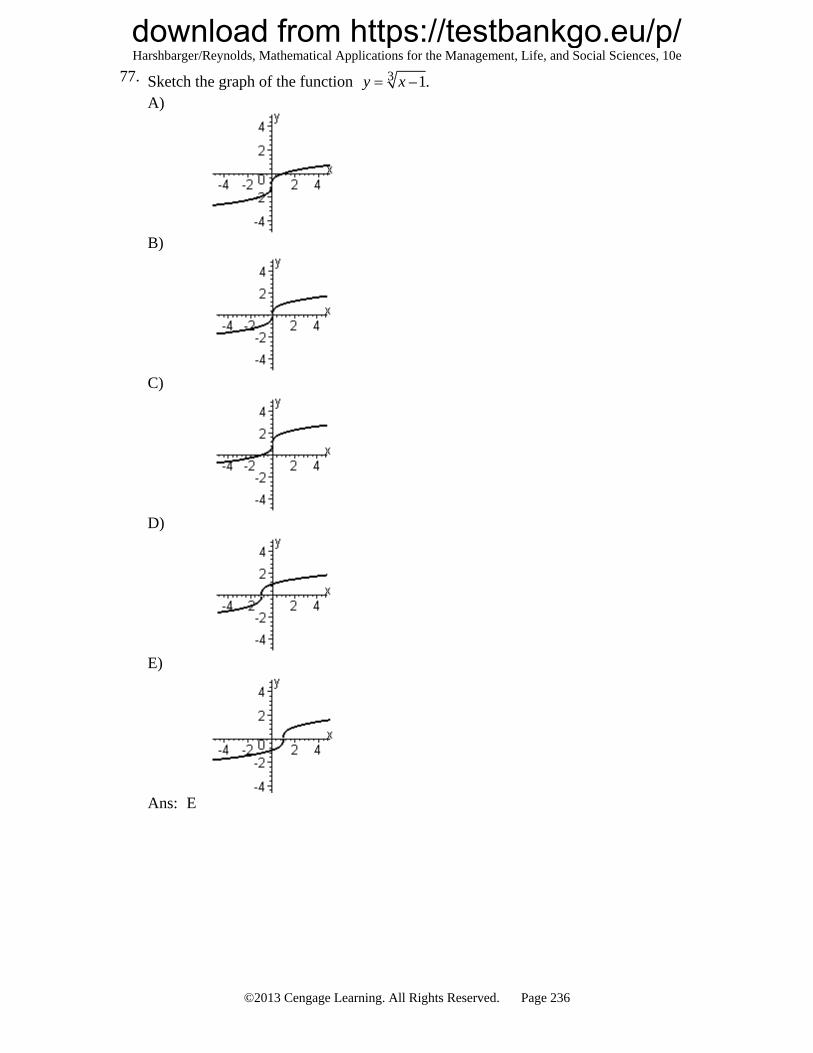
82. By recognizing shapes and features of polynomial functions, sketch the graph of the function 3 –y x x . Use a graphing utility to confirm your graph. A)
B)
C)
D)
E)
Ans: C
download from https://testbankgo.eu/p/Harshbarger/Reynolds, Mathematical Applications for the Management, Life, and Social Sciences, 10e
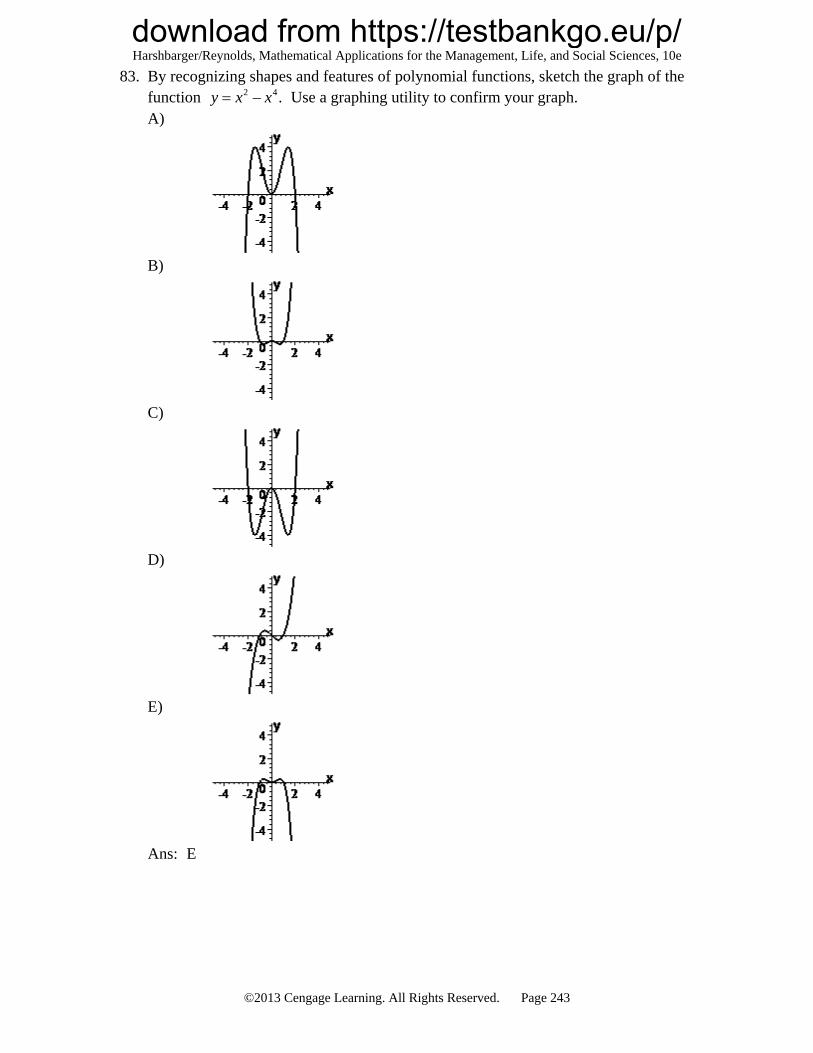
83. By recognizing shapes and features of polynomial functions, sketch the graph of the function 2 4– .y x x Use a graphing utility to confirm your graph. A)
B)
C)
D)
E)
Ans: E
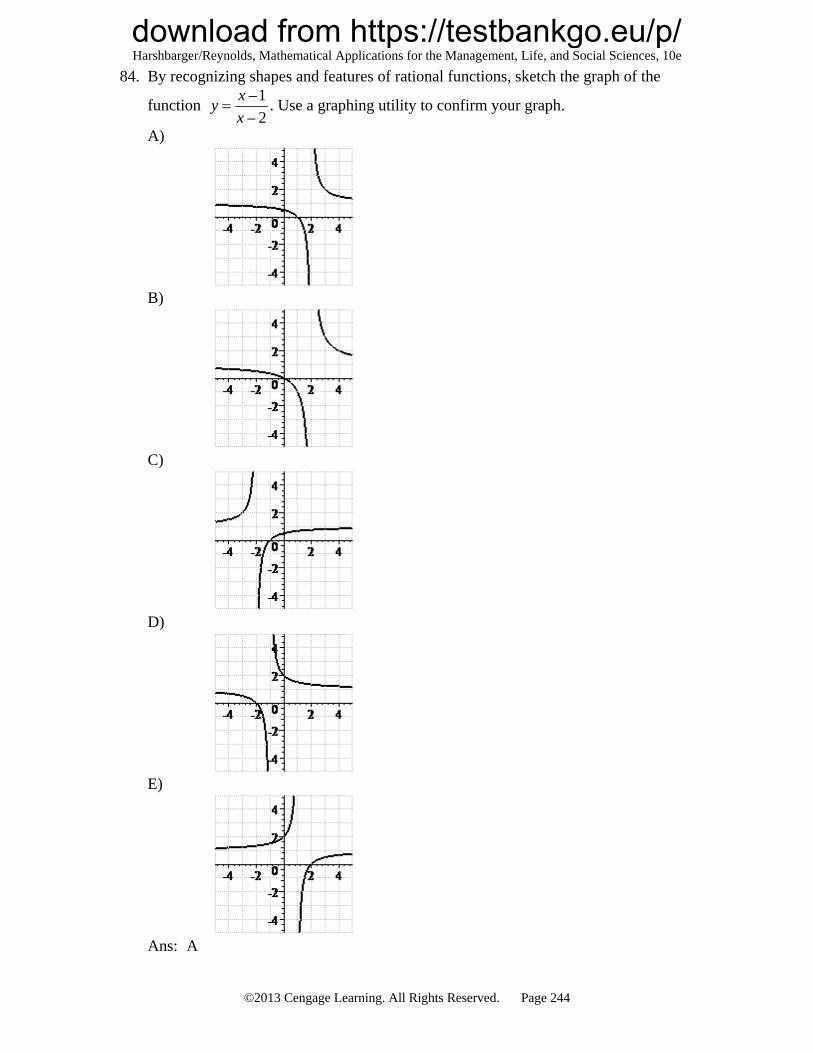
download from https://testbankgo.eu/p/Harshbarger/Reynolds, Mathematical Applications for the Management, Life, and Social Sciences, 10e
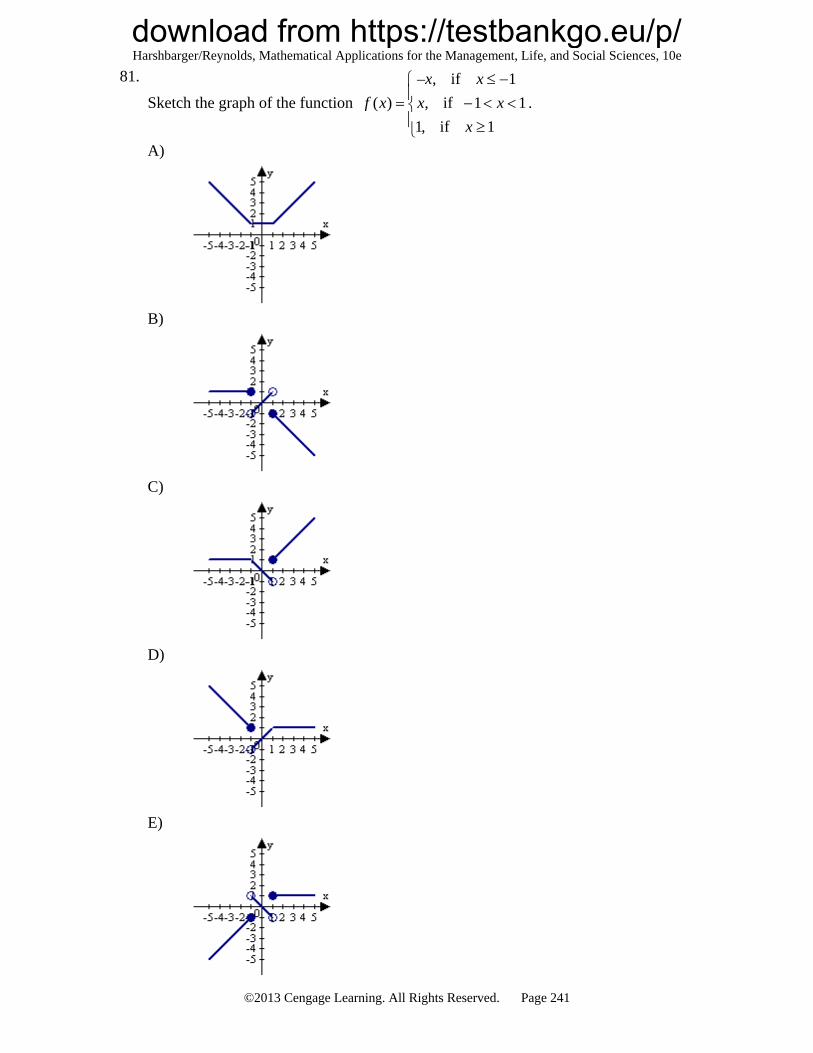
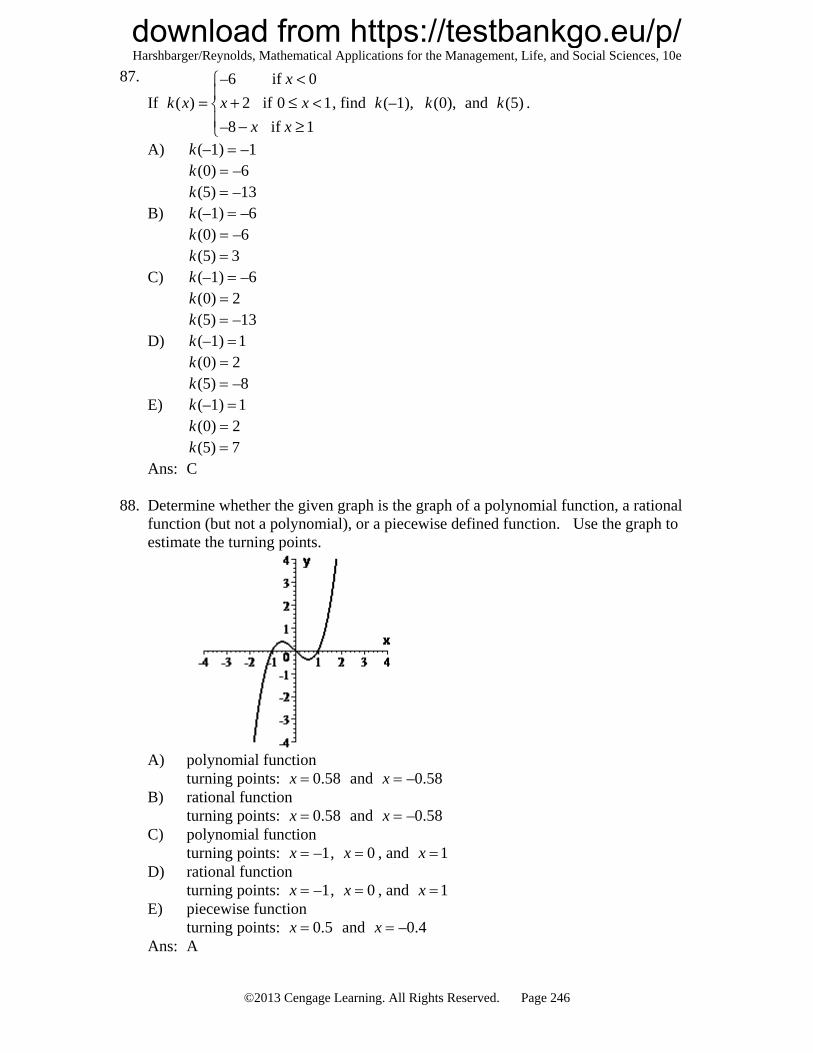
88. Determine whether the given graph is the graph of a polynomial function, a rational function (but not a polynomial), or a piecewise defined function. Use the graph to estimate the turning points.
A) polynomial function turning points: 0.58x and –0.58x
B) rational function turning points: 0.58x and –0.58x
C) polynomial function turning points: –1x , 0x , and 1x
D) rational function turning points: –1x , 0x , and 1x
E) piecewise function turning points: 0.5x and –0.4x
Ans: A
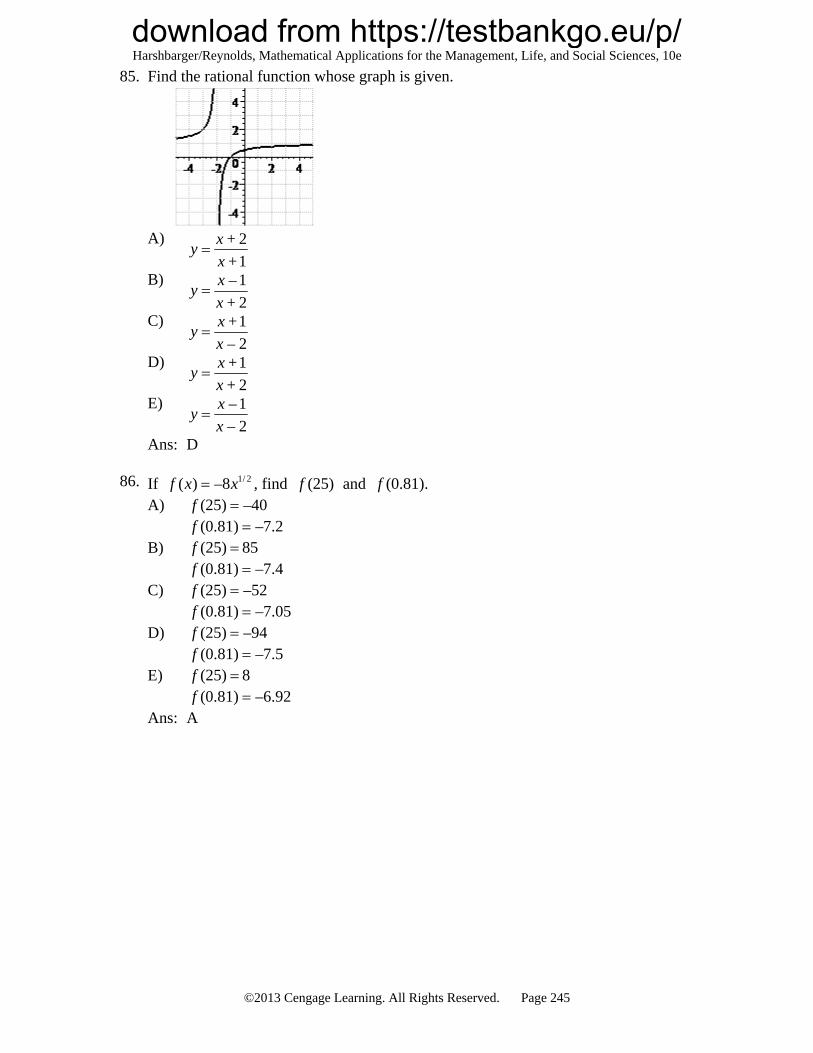
download from https://testbankgo.eu/p/Harshbarger/Reynolds, Mathematical Applications for the Management, Life, and Social Sciences, 10e
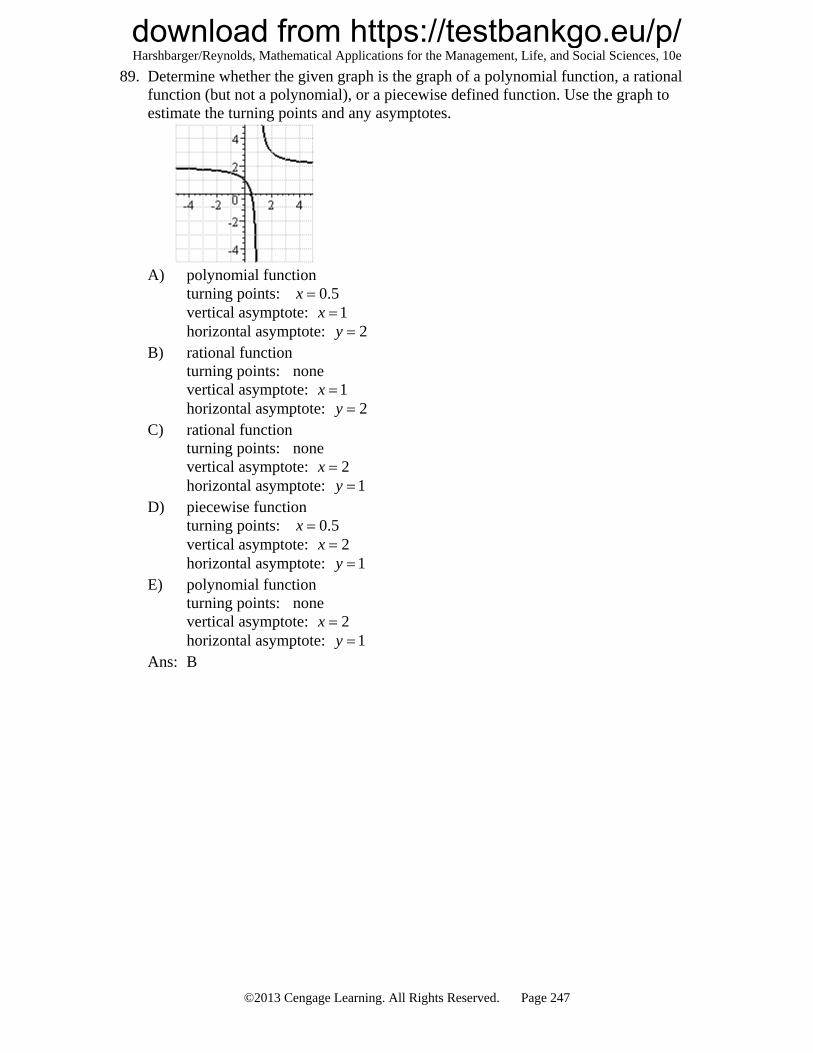
89. Determine whether the given graph is the graph of a polynomial function, a rational function (but not a polynomial), or a piecewise defined function. Use the graph to estimate the turning points and any asymptotes.
A) polynomial function turning points: 0.5x vertical asymptote: 1x horizontal asymptote: 2y
B) rational function turning points: none vertical asymptote: 1x horizontal asymptote: 2y
C) rational function turning points: none vertical asymptote: 2x horizontal asymptote: 1y
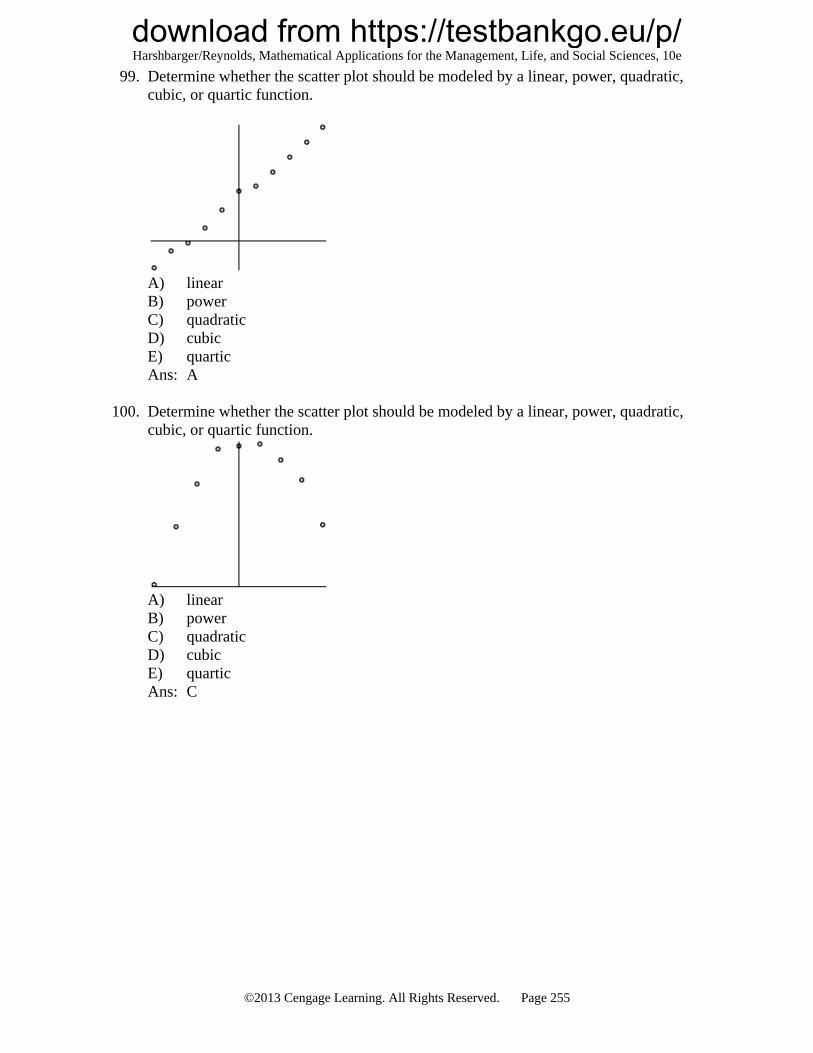
90. Determine whether the given graph is the graph of a polynomial function, a rational function (but not a polynomial), or a piecewise defined function. Use the graph to estimate the turning points.
A) piecewise function turning points: 0x and 2x
B) polynomial function turning points: 0x and 2x
C) rational function turning points: 0x
D) polynomial function turning points: 1x
E) piecewise function turning points: 1x
Ans: E
91. An open-top box is constructed from a square piece of cardboard with sides of length 8 ft. The volume of such a box is given by 2(8 2 )V x x ft3, where x is the height of the box. Find the volume of the box if its height is 2 ft. A) 30.5 ft3 B) 31.5 ft3 C) 32 ft3 D) 34 ft3 E) 36.5 ft3 Ans: C
download from https://testbankgo.eu/p/Harshbarger/Reynolds, Mathematical Applications for the Management, Life, and Social Sciences, 10e
92. The amount of money invested in a certain mutual funds, measured in millions of dollars, for the years 1995 to 1999 was found to be modeled by 1.35( ) 97.25f x x= million dollars, where x is the number of years past 1990. Will the graph of this function bend upward or will it bend downward? How much money is predicted to be in the fund in the year 2010? A) the function's graph bends downward; the function predicts 2,800,298.24 million
dollars in 2010 B) the function's graph bends upward; the function predicts 2,800,298.24 million
dollars in 2010 C) the function's graph bends downward; the function predicts 1,402,924.04 million
dollars in 2010 D) the function's graph bends upward; the function predicts 5549.84 million dollars
in 2010 E) the function's graph bends downward; the function predicts 5549.84 million
dollars in 2010 Ans: D
93. Suppose that the cost C (in dollars) of removing p percent of the particulate pollution
from the smokestacks of an industrial plant is estimated by 7250
( )100
pC p
p=
-. What is the
domain of this function? What will it cost to remove 99% of the particulate pollution? A) domain: 0 99p
cost: $717,750.00 B) domain: 0 100p
cost: $717,750.00 C) domain: all p except 100p
cost: $717,750.00 D) domain: 0 100p
cost: $72.49 E) domain: all p except 100p
cost: $72.49 Ans: B
download from https://testbankgo.eu/p/Harshbarger/Reynolds, Mathematical Applications for the Management, Life, and Social Sciences, 10e
95. A shipping company's charges for delivery of a package is a function of the package's weight. The following table describes the company's shipping rates. Weight Increment Rate First pound or fraction of a pound $ 0.35 Each additional pound or fraction of a pound $ 0.95 Convert this table to a piecewise defined function that represents shipping costs for packages weighing between 0 and 4 pounds using x as the weight in pounds and C as the cost in dollars. Find the postage for a 3.25-pound package. A) 0.35 if 0 1
0.70 if 1 2( )
1.05 if 2 3
1.40 if 3 4
x
xC x
x
x
< £ÏÔ < £Ô= Ì < £ÔÔ < £Ó
cost for a 3.25 lb package: $ 1.40 B) 0.35 if 0 1
0.95 if 1 2( )
1.90 if 2 3
2.85 if 3 4
x
xC x
x
x
< £ÏÔ < £Ô= Ì < £ÔÔ < £Ó
cost for a 3.25 lb package: $ 2.85 C) 0.35 if 0 1
( )0.35 0.95 if 1 4
xC x
x x
< £Ï= Ì + < £Ó
cost for a 3.25 lb package: $ 3.44 D) 0.35 if 0 1
1.30 if 1 2( )
2.25 if 2 3
3.20 if 3 4
x
xC x
x
x
< £ÏÔ < £Ô= Ì < £ÔÔ < £Ó
cost for a 3.25 lb package: $ 3.20 E) 0.35 if 0 1
0.35 0.95 if 1 2( )
0.35 1.90 if 2 3
0.35 2.85 if 3 4
x
x xC x
x x
x x
< £ÏÔ + < £Ô= Ì + < £ÔÔ + < £Ó
cost for a 3.25 lb package: $ 9.61 Ans: D
download from https://testbankgo.eu/p/Harshbarger/Reynolds, Mathematical Applications for the Management, Life, and Social Sciences, 10e
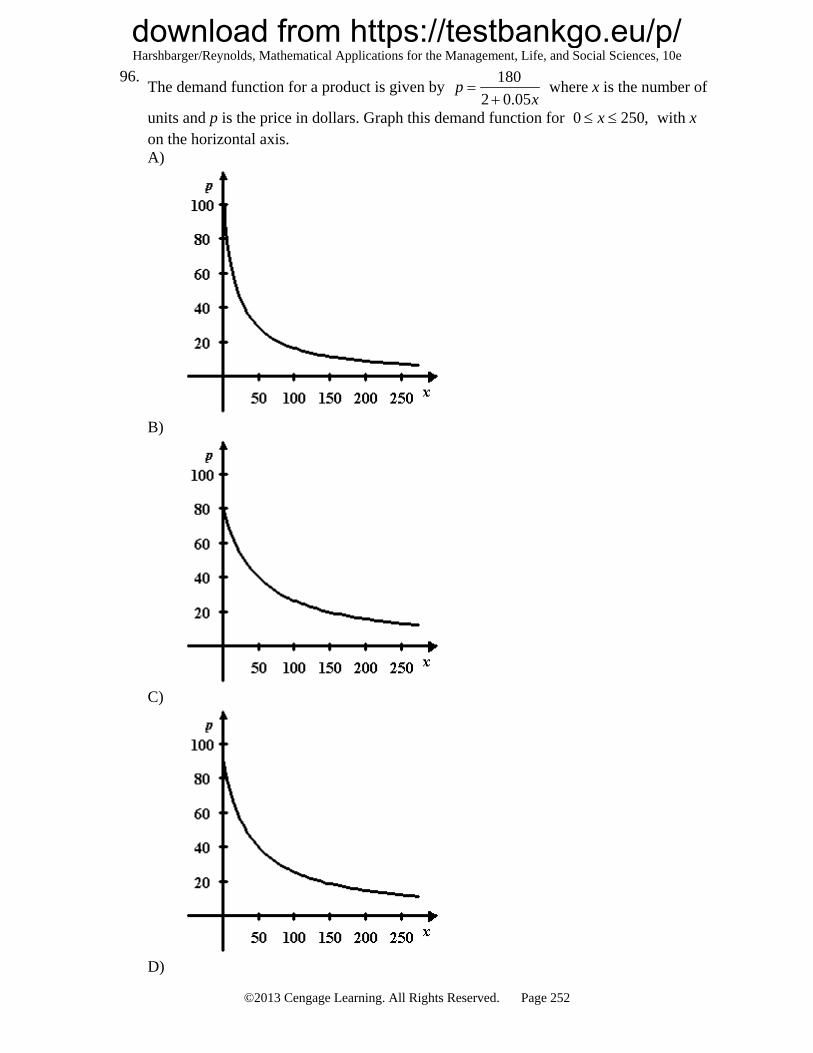
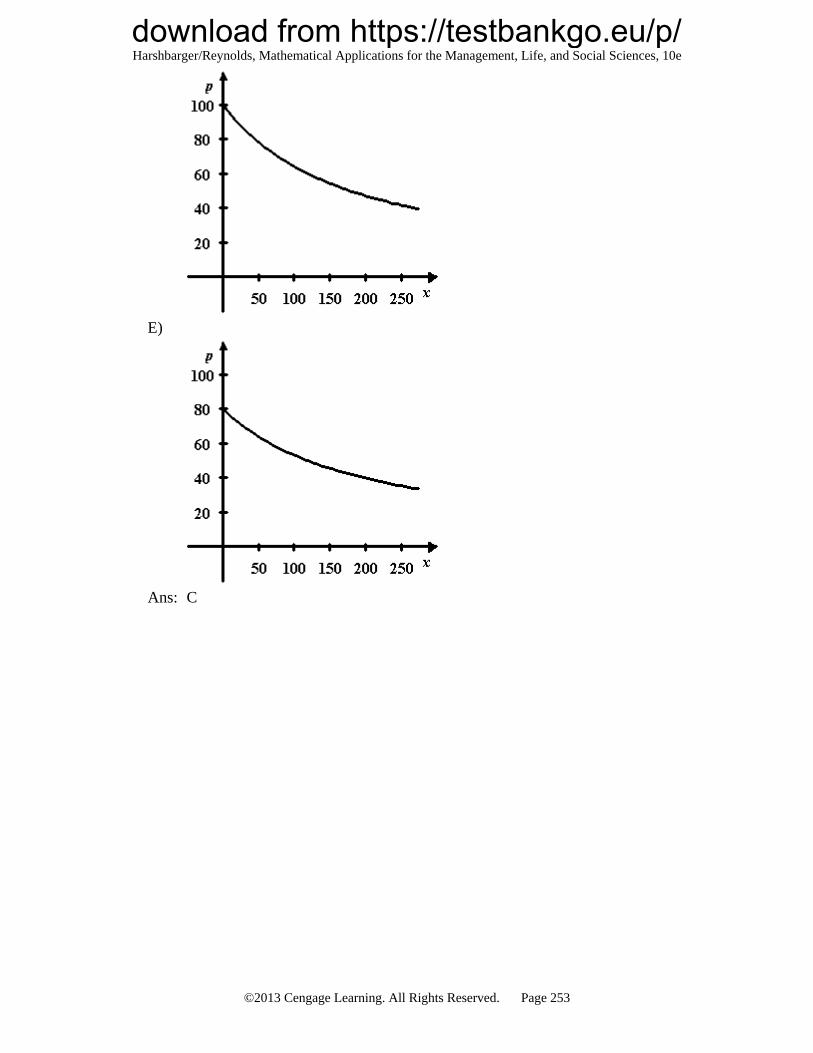
units and p is the price in dollars. The graph of this demand function for 0 250,x with x on the horizontal, axis is given below. Does the demand function ever reach 3?
A) no B) yes Ans: B
98. The given graph shows the cost C, in thousands of dollars, of a production run for a
product when x machines are used. Estimate the company's fixed cost of production to the nearest thousand dollars, and determine the number of machines that will result in maximum cost for the company.
A) fixed production cost: $ 4000 maximum cost when 3 machines used
B) fixed production cost: $ 7000 maximum cost when 3 machines used
C) fixed production cost: $ 3000 maximum cost when 3 machines used
D) fixed production cost: $ 4000 maximum cost when 5 machines used
E) fixed production cost: $ 3000 maximum cost when 5 machines used
Ans: C
download from https://testbankgo.eu/p/Harshbarger/Reynolds, Mathematical Applications for the Management, Life, and Social Sciences, 10e
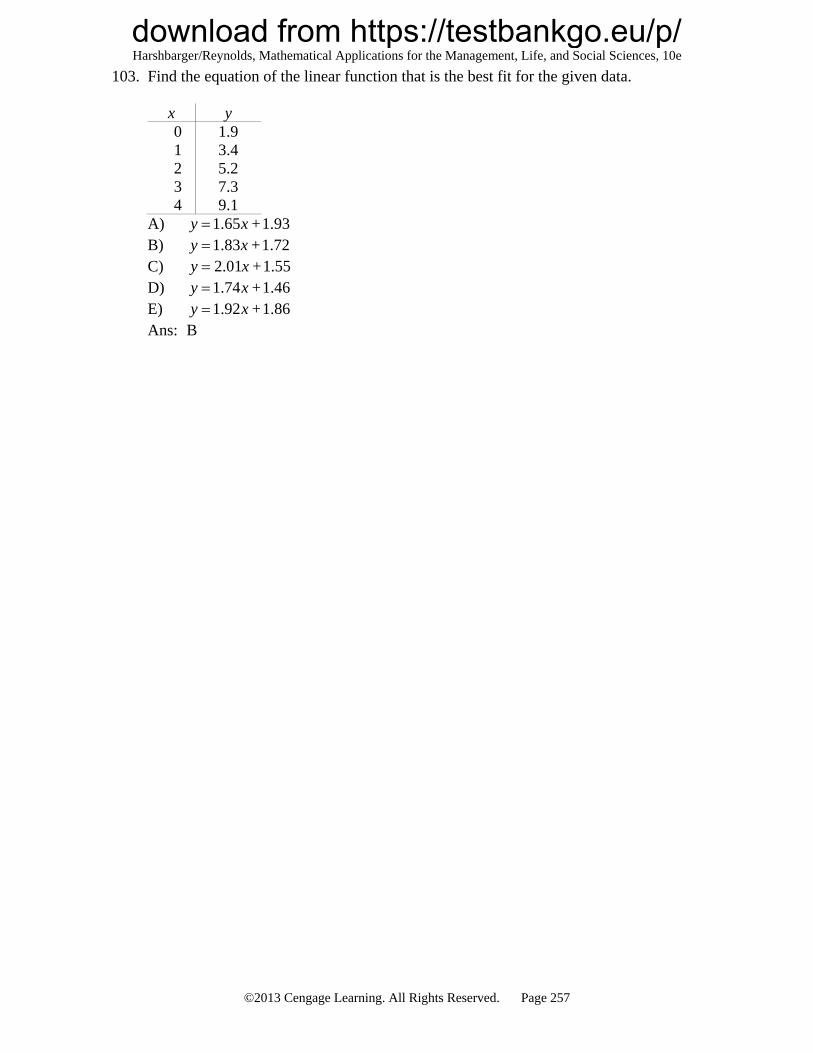
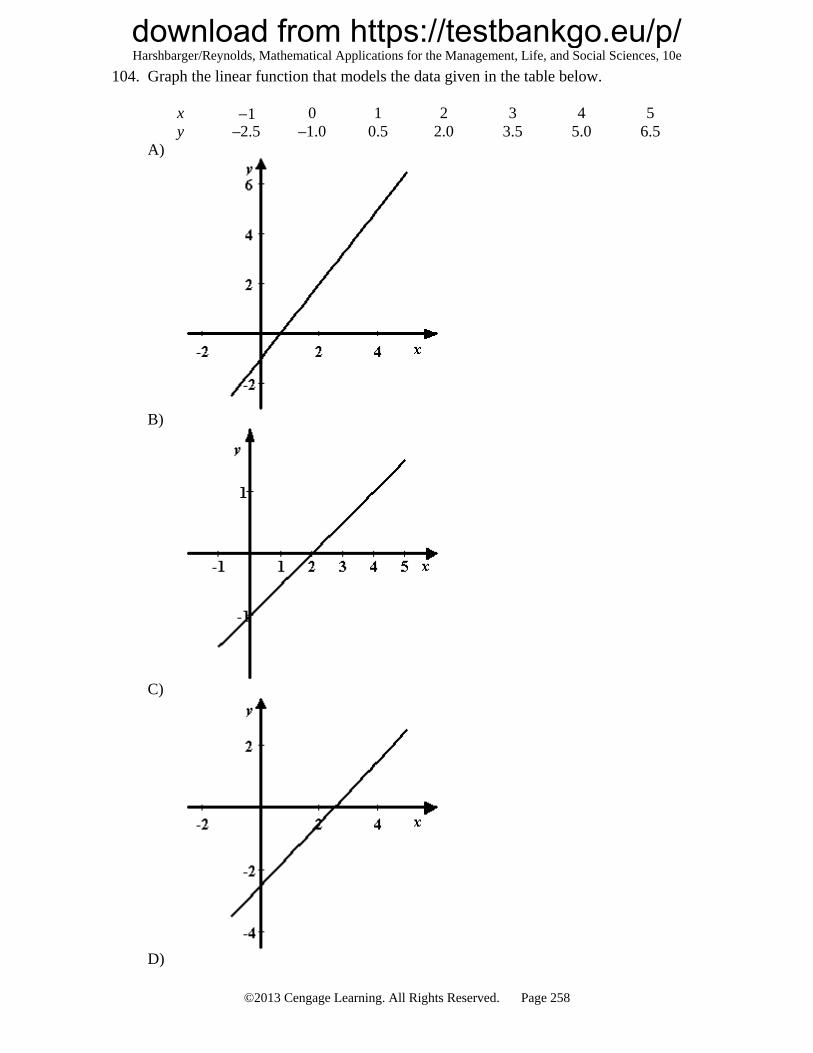
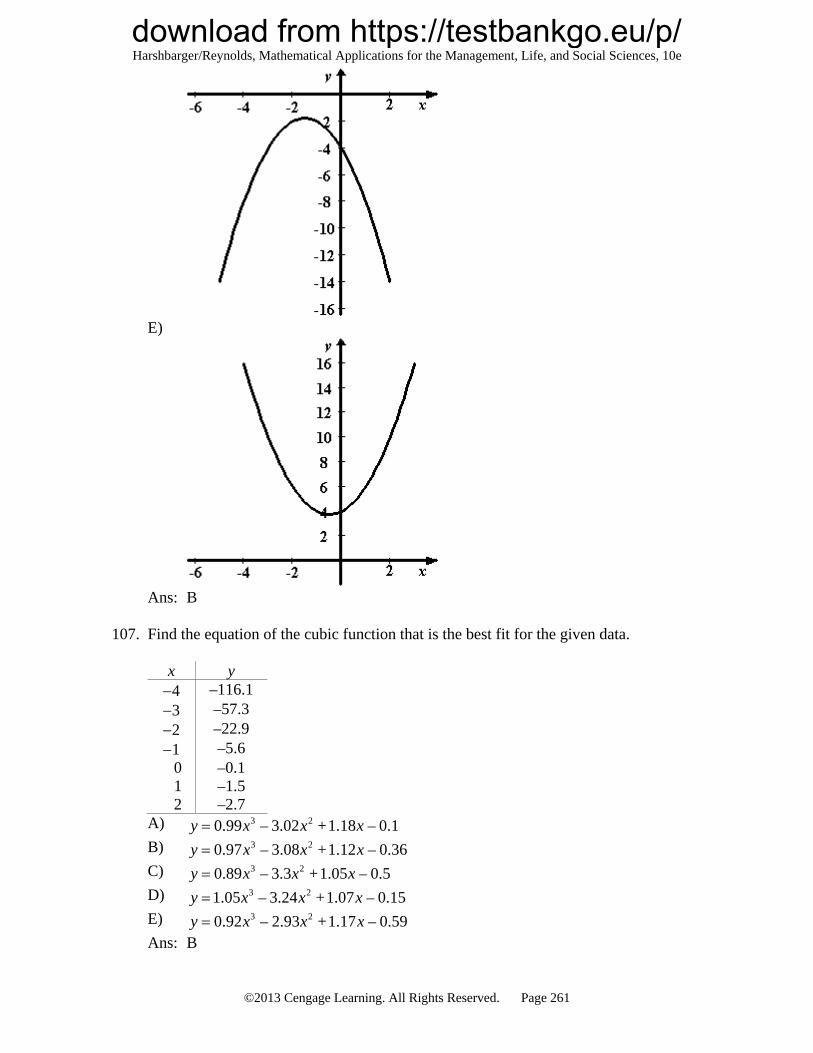
107. Find the equation of the cubic function that is the best fit for the given data.
x y 4 –116.1 3 –57.3 2 –22.9 1 –5.6 0 –0.1 1 –1.5 2 –2.7
A) 3 20.99 – 3.02 + 1.18 – 0.1y x x x B) 3 20.97 – 3.08 + 1.12 – 0.36y x x x C) 3 20.89 – 3.3 + 1.05 – 0.5y x x x D) 3 21.05 – 3.24 + 1.07 – 0.15y x x x E) 3 20.92 – 2.93 + 1.17 – 0.59y x x x Ans: B
download from https://testbankgo.eu/p/Harshbarger/Reynolds, Mathematical Applications for the Management, Life, and Social Sciences, 10e
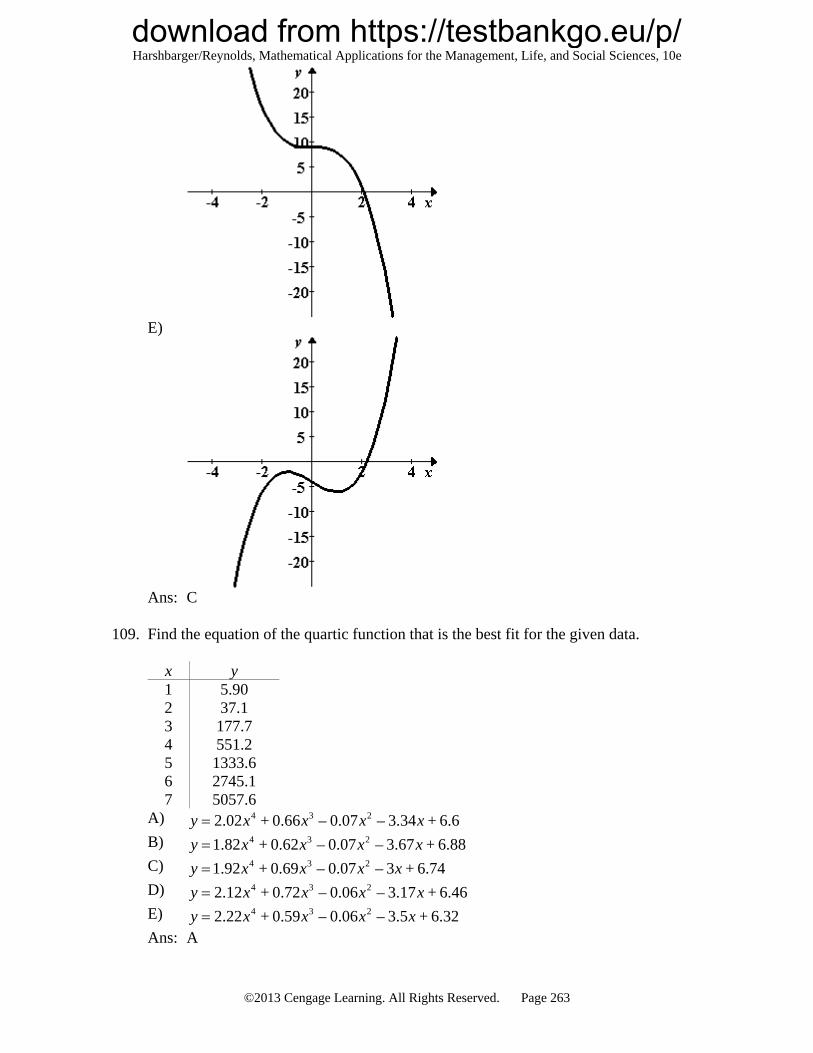
109. Find the equation of the quartic function that is the best fit for the given data.
x y 1 5.90 2 37.1 3 177.7 4 551.2 5 1333.6 6 2745.1 7 5057.6
A) 4 3 22.02 + 0.66 – 0.07 – 3.34 + 6.6y x x x x B) 4 3 21.82 + 0.62 – 0.07 – 3.67 + 6.88y x x x x C) 4 3 21.92 + 0.69 – 0.07 – 3 + 6.74y x x x x D) 4 3 22.12 + 0.72 – 0.06 – 3.17 + 6.46y x x x x E) 4 3 22.22 + 0.59 – 0.06 – 3.5 + 6.32y x x x x Ans: A
download from https://testbankgo.eu/p/Harshbarger/Reynolds, Mathematical Applications for the Management, Life, and Social Sciences, 10e
111. Determine what type of function best models the data given below, and find the equation that is the best fit for the data.
x y 0 –2.6 1 3.35 2 9.46 3 15.49 4 21.35 5 27.41 6 33.3
A) linear; 5.9896 – 2.5746y x B) quadratic; 2–0.0106 + 6.0532 – 2.6276y x x C) power; –infinfy x D) cubic; 3 2–0.0014 + 0.0019 + 6.0254 – 2.6193y x x x E) quartic: 4 3 20.002 – 0.0255 + 0.0911 + 5.9239 – 2.609y x x x x Ans: A
112. Determine what type of function best models the data given below, and find the
equation that is the best fit for the data.
x y 0 7.5 1 –15.85 2 –30.1 3 –34.95 4 –30.4 5 –16.25 6 7.7
A) linear; –0.0179 – 15.9964y x B) quadratic; 24.7298 – 28.3964 + 7.6524y x x C) power; infinfy x D) cubic; 3 20.025 + 4.5048 – 27.8964 + 7.5024y x x x E) quartic; 4 3 20.0004 + 0.0205 + 4.5216 – 27.9156 + 7.5043y x x x x Ans: B
download from https://testbankgo.eu/p/Harshbarger/Reynolds, Mathematical Applications for the Management, Life, and Social Sciences, 10e
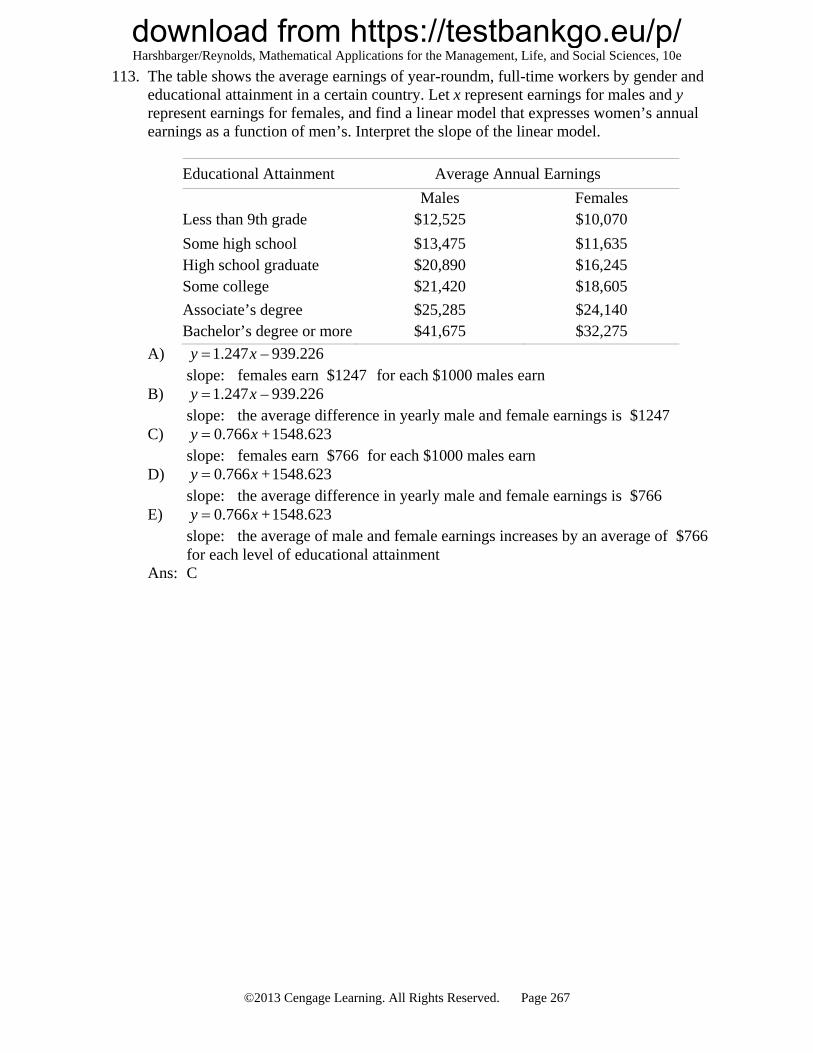
113. The table shows the average earnings of year-roundm, full-time workers by gender and educational attainment in a certain country. Let x represent earnings for males and y represent earnings for females, and find a linear model that expresses women’s annual earnings as a function of men’s. Interpret the slope of the linear model.
Educational Attainment Average Annual Earnings
Males Females Less than 9th grade $12,525 $10,070
Some high school $13,475 $11,635 High school graduate $20,890 $16,245 Some college $21,420 $18,605
Associate’s degree $25,285 $24,140 Bachelor’s degree or more $41,675 $32,275
A) 1.247 – 939.226y x slope: females earn $1247 for each $1000 males earn
B) 1.247 – 939.226y x slope: the average difference in yearly male and female earnings is $1247
C) 0.766 + 1548.623y x slope: females earn $766 for each $1000 males earn
D) 0.766 + 1548.623y x slope: the average difference in yearly male and female earnings is $766
E) 0.766 + 1548.623y x slope: the average of male and female earnings increases by an average of $766 for each level of educational attainment
Ans: C
download from https://testbankgo.eu/p/Harshbarger/Reynolds, Mathematical Applications for the Management, Life, and Social Sciences, 10e
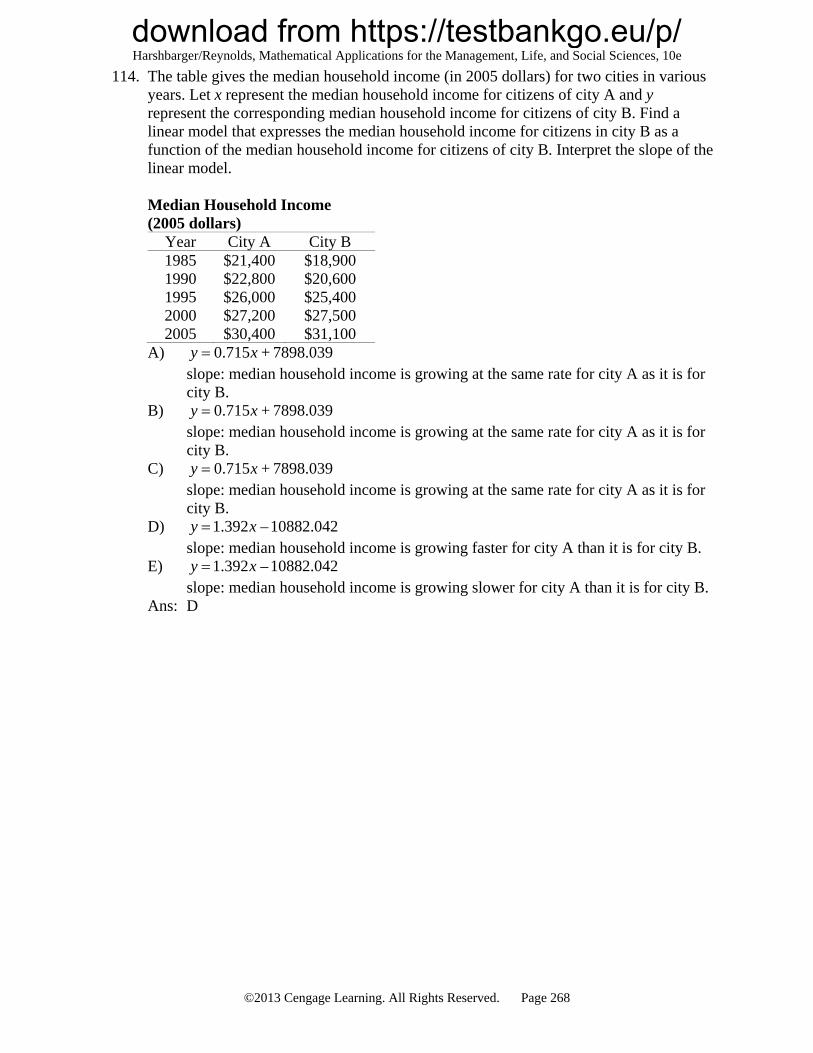
114. The table gives the median household income (in 2005 dollars) for two cities in various years. Let x represent the median household income for citizens of city A and y represent the corresponding median household income for citizens of city B. Find a linear model that expresses the median household income for citizens in city B as a function of the median household income for citizens of city B. Interpret the slope of the linear model. Median Household Income (2005 dollars)
Year City A City B 1985 $21,400 $18,900 1990 $22,800 $20,600 1995 $26,000 $25,400 2000 $27,200 $27,500 2005 $30,400 $31,100
A) 0.715 + 7898.039y x slope: median household income is growing at the same rate for city A as it is for city B.
B) 0.715 + 7898.039y x slope: median household income is growing at the same rate for city A as it is for city B.
C) 0.715 + 7898.039y x slope: median household income is growing at the same rate for city A as it is for city B.
D) 1.392 – 10882.042y x slope: median household income is growing faster for city A than it is for city B.
E) 1.392 – 10882.042y x slope: median household income is growing slower for city A than it is for city B.
Ans: D
download from https://testbankgo.eu/p/Harshbarger/Reynolds, Mathematical Applications for the Management, Life, and Social Sciences, 10e
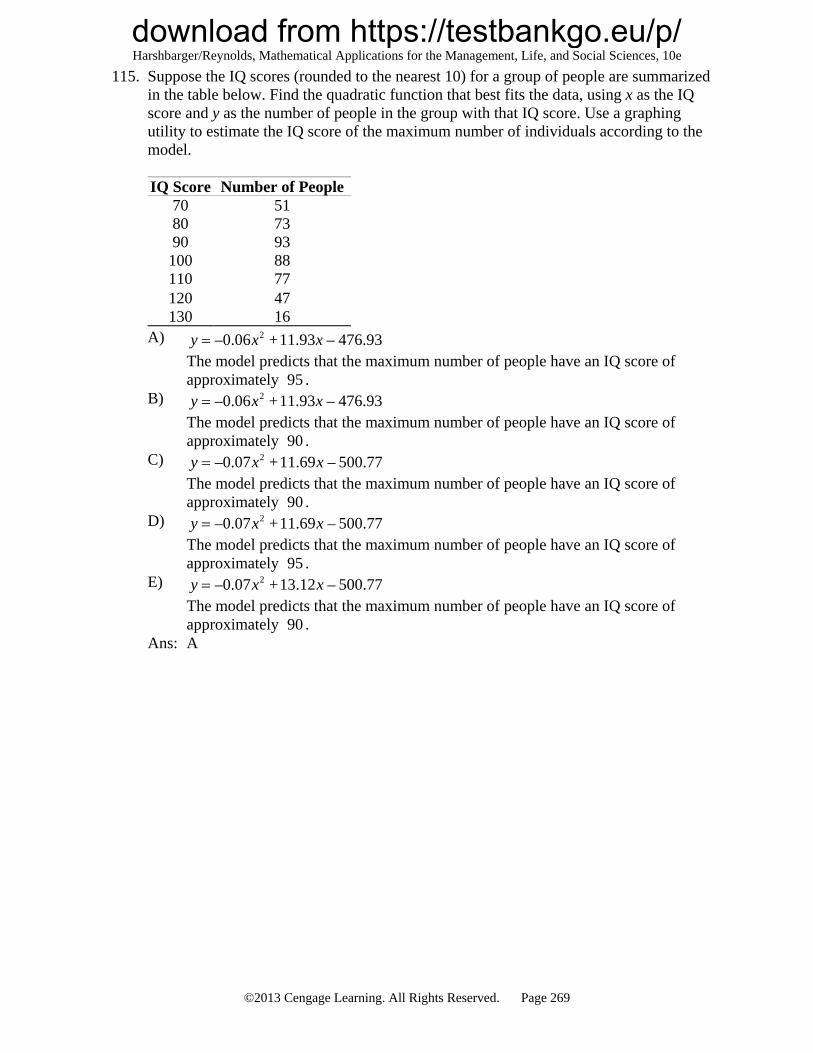
115. Suppose the IQ scores (rounded to the nearest 10) for a group of people are summarized in the table below. Find the quadratic function that best fits the data, using x as the IQ score and y as the number of people in the group with that IQ score. Use a graphing utility to estimate the IQ score of the maximum number of individuals according to the model. IQ Score Number of People
70 51 80 73 90 93 100 88 110 77 120 47 130 16
A) 2–0.06 + 11.93 – 476.93y x x The model predicts that the maximum number of people have an IQ score of approximately 95 .
B) 2–0.06 + 11.93 – 476.93y x x The model predicts that the maximum number of people have an IQ score of approximately 90 .
C) 2–0.07 + 11.69 – 500.77y x x The model predicts that the maximum number of people have an IQ score of approximately 90 .
D) 2–0.07 + 11.69 – 500.77y x x The model predicts that the maximum number of people have an IQ score of approximately 95 .
E) 2–0.07 + 13.12 – 500.77y x x The model predicts that the maximum number of people have an IQ score of approximately 90 .
Ans: A
download from https://testbankgo.eu/p/Harshbarger/Reynolds, Mathematical Applications for the Management, Life, and Social Sciences, 10e
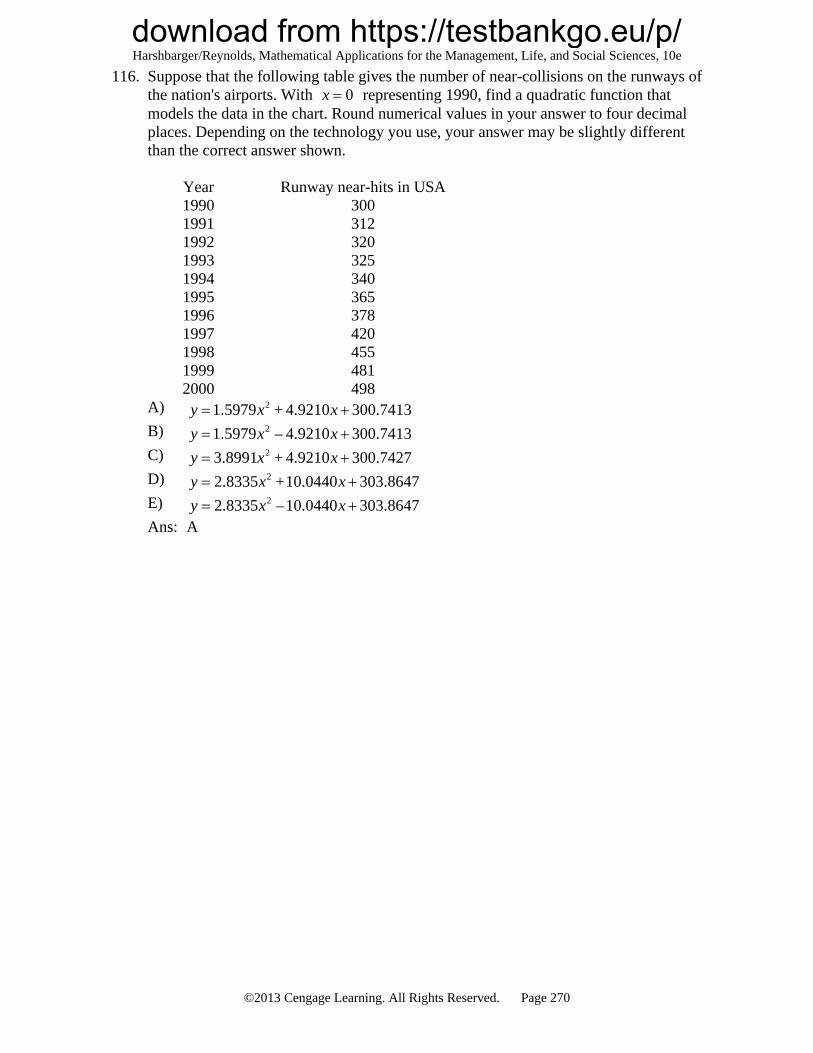
116. Suppose that the following table gives the number of near-collisions on the runways of the nation's airports. With 0x representing 1990, find a quadratic function that models the data in the chart. Round numerical values in your answer to four decimal places. Depending on the technology you use, your answer may be slightly different than the correct answer shown.
Year Runway near-hits in USA 1990 300 1991 312 1992 320 1993 325 1994 340 1995 365 1996 378 1997 420 1998 455 1999 481 2000 498
A) 21.5979 + 4.9210 300.7413y x x B) 21.5979 – 4.9210 300.7413y x x C) 23.8991 + 4.9210 300.7427y x x D) 22.8335 +10.0440 303.8647y x x E) 22.8335 –10.0440 303.8647y x x Ans: A
download from https://testbankgo.eu/p/Harshbarger/Reynolds, Mathematical Applications for the Management, Life, and Social Sciences, 10e
117. The table that follows gives the population of a city. Find the power function that best fits the data, with x equal to the number of years past 1950. According to the model, will the city's population be greater than 1400 by the year 2010?
Year Population 1960 604 1970 893 1980 1195 1990 1223 2000 1244
A) 0.4745.357y x The model predicts that the population will be greater than 1400.
B) 0.474212.109y x The model predicts that the population will be greater than 1400.
C) 0.5265.357y x The model predicts that the population will not be greater than 1400.
D) 0.526212.109y x The model predicts that the population will not be greater than 1400.
E) 0.5604y x The model predicts that the population will be greater than 1400.
Ans: B
download from https://testbankgo.eu/p/Harshbarger/Reynolds, Mathematical Applications for the Management, Life, and Social Sciences, 10e
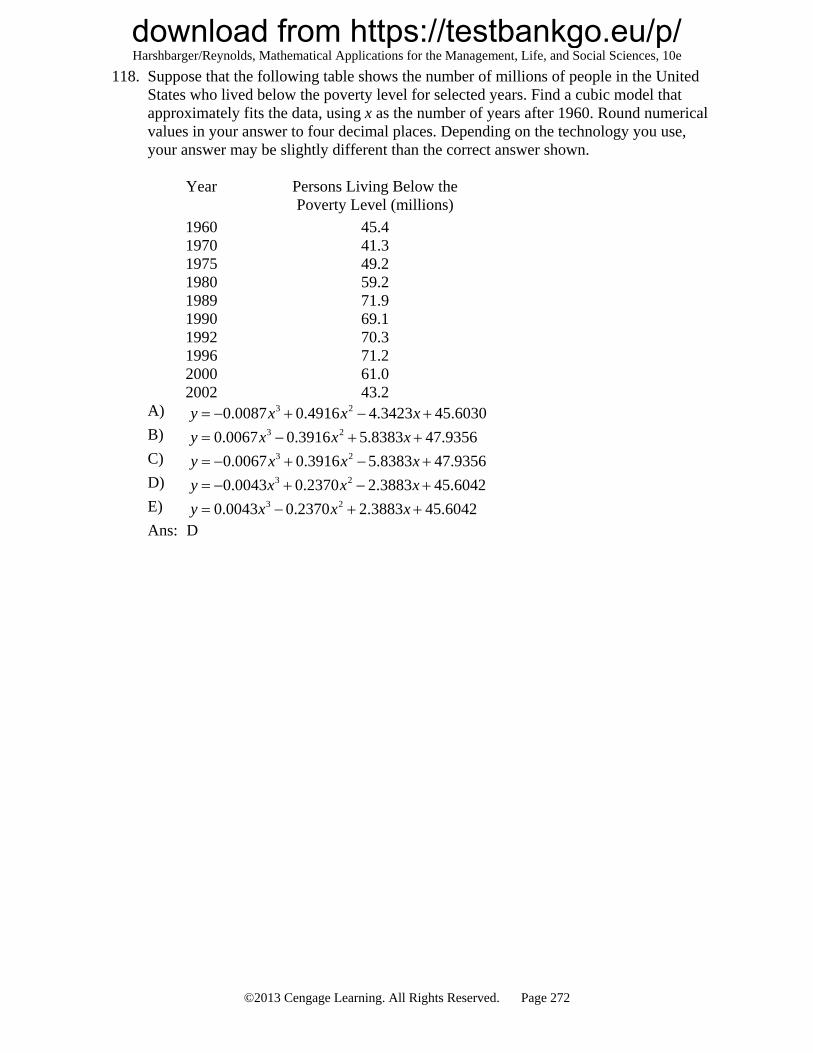
118. Suppose that the following table shows the number of millions of people in the United States who lived below the poverty level for selected years. Find a cubic model that approximately fits the data, using x as the number of years after 1960. Round numerical values in your answer to four decimal places. Depending on the technology you use, your answer may be slightly different than the correct answer shown.
Year Persons Living Below the Poverty Level (millions)
A) 3 20.0087 0.4916 4.3423 45.6030y x x x B) 3 20.0067 0.3916 5.8383 47.9356y x x x C) 3 20.0067 0.3916 5.8383 47.9356y x x x D) 3 20.0043 0.2370 2.3883 45.6042y x x x E) 3 20.0043 0.2370 2.3883 45.6042y x x x Ans: D
download from https://testbankgo.eu/p/Harshbarger/Reynolds, Mathematical Applications for the Management, Life, and Social Sciences, 10e
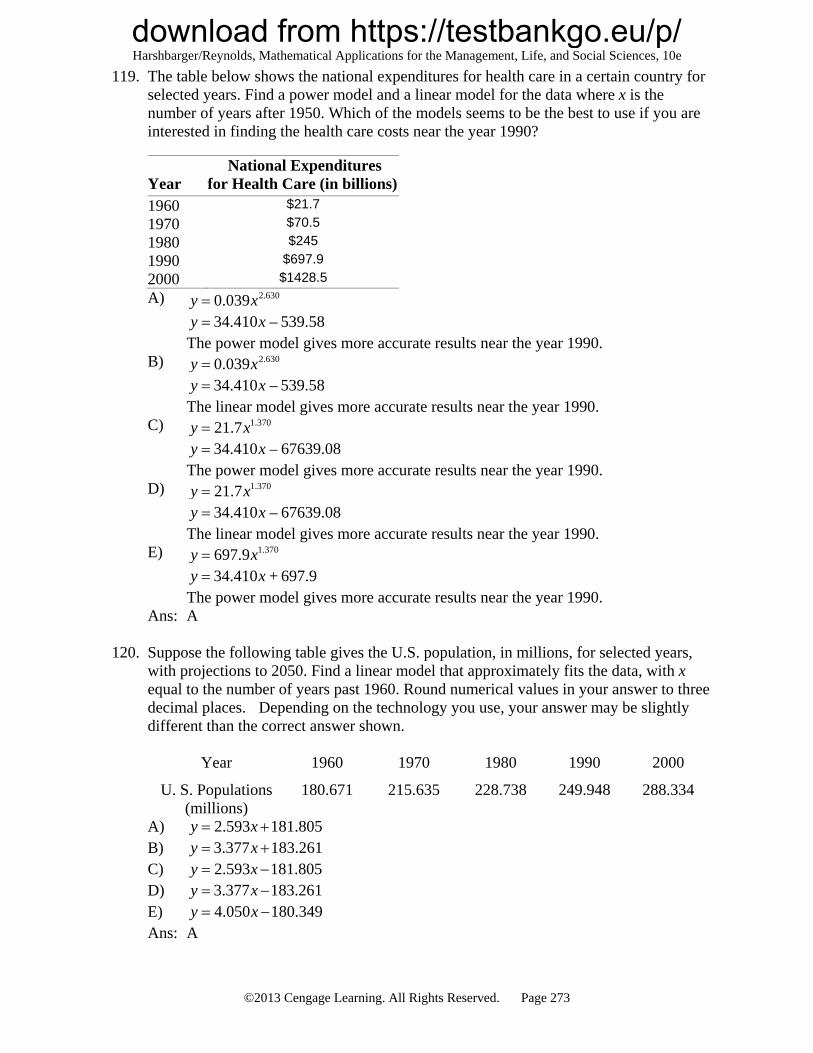
119. The table below shows the national expenditures for health care in a certain country for selected years. Find a power model and a linear model for the data where x is the number of years after 1950. Which of the models seems to be the best to use if you are interested in finding the health care costs near the year 1990? Year
National Expenditures for Health Care (in billions)
1960 $21.7
1970 $70.5
1980 $245
1990 $697.9
2000 $1428.5
A) 2.6300.039y x 34.410 – 539.58y x
The power model gives more accurate results near the year 1990. B) 2.6300.039y x
34.410 – 539.58y x The linear model gives more accurate results near the year 1990.
C) 1.37021.7y x 34.410 – 67639.08y x
The power model gives more accurate results near the year 1990. D) 1.37021.7y x
34.410 – 67639.08y x The linear model gives more accurate results near the year 1990.
E) 1.370697.9y x 34.410 + 697.9y x
The power model gives more accurate results near the year 1990. Ans: A
120. Suppose the following table gives the U.S. population, in millions, for selected years,
with projections to 2050. Find a linear model that approximately fits the data, with x equal to the number of years past 1960. Round numerical values in your answer to three decimal places. Depending on the technology you use, your answer may be slightly different than the correct answer shown.
Year 1960 1970 1980 1990 2000
U. S. Populations (millions)
180.671 215.635 228.738 249.948 288.334
A) 2.593 181.805y x B) 3.377 183.261y x C) 2.593 181.805y x D) 3.377 183.261y x E) 4.050 180.349y x Ans: A
download from https://testbankgo.eu/p/Harshbarger/Reynolds, Mathematical Applications for the Management, Life, and Social Sciences, 10e
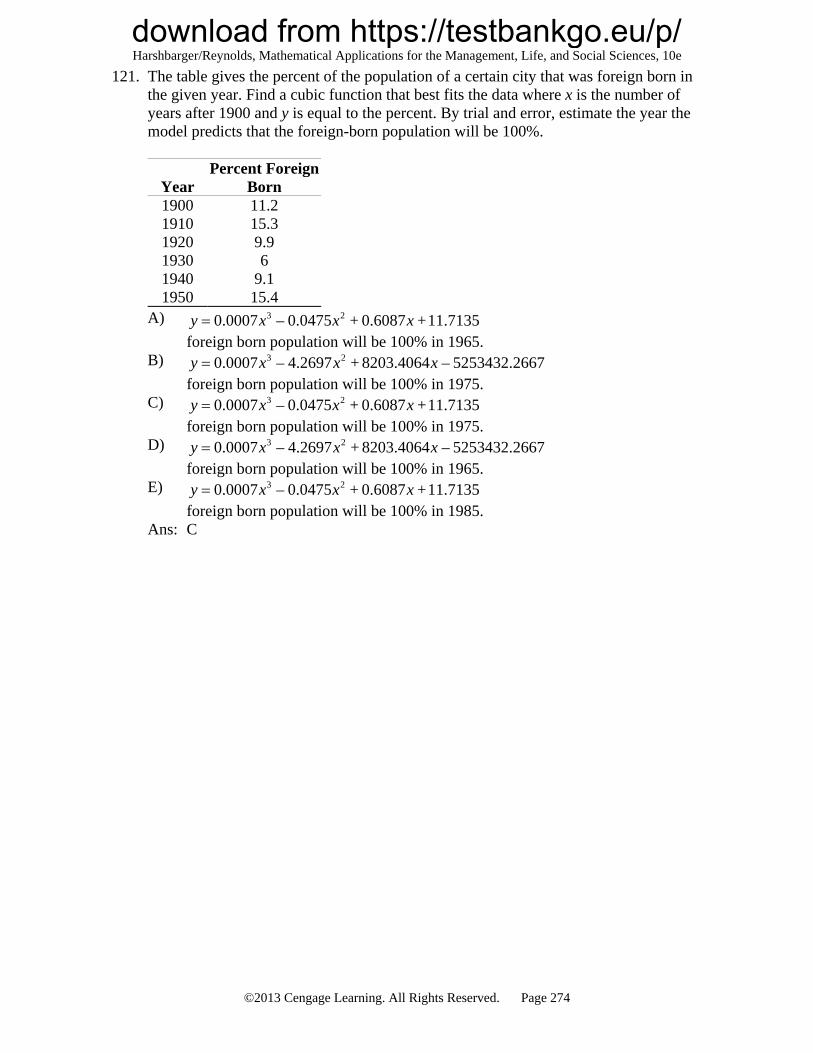
121. The table gives the percent of the population of a certain city that was foreign born in the given year. Find a cubic function that best fits the data where x is the number of years after 1900 and y is equal to the percent. By trial and error, estimate the year the model predicts that the foreign-born population will be 100%.