Page 1
56 Dimensions.07 Forum Guide www.dimensions-info.com
THURSDAY afternoon session
Meeting theChallenges ofThermalPackagingDespite an increased quantity of availablesolutions and overall improved effectiveness oftemperature sensitive packaging, validatingeffectiveness of these solutions and comparingperformance between several solutions ischallenging for many teams. Severaltechniques including the ISTA 5B summer andwinter profiles will be presented to compareand optimize off the shelf as well as custompackaging solutions for performance, size,weight and cost will be covered along withidentification of common validation pitfalls.
Mark A. Escobedo Chief Technologist
Westpak, Inc.
Education: Package Engineering from San Jose State
University.
Activities: Member of ISTA, ASTM, and IoPP.
Achievements: In addition to writing articles for industry
publications, Mark also conducts seminars on a variety of
testing related topics.
83 Great Oaks Blvd
San Jose, CA 95119 USA
Tel: 408-224-1300
[email protected]
Page 2
Meeting the Challenges of Thermal Packaging Mark Escobedo – Dimensions.07
Meeting the Challenges of Thermal Packaging
Despite an increased quantity of available solutions and overall improved effectiveness of Cold
Chain packaging, validating effectiveness of these solutions and comparing performance
between several solutions is challenging for many teams. Several techniques including the ISTA
5B summer profile will be presented to compare and optimize off the shelf as well as custom
packaging solutions for performance, size, weight and cost along with the identification of
common validation pitfalls. Ultimately, a model will be introduced as a way to determine the
thermal resistance of the package system and then correlate the performance to the expected
temperature extremes in the environment.
Several types of thermal packages
Cold Chain packaging is the ability to maintain the integrity of temperature sensitive products
from the point of manufacture to the point of distribution or end-use. Once they have left the point
of manufacture, the product temperature must be maintained and is typically shipped using
express or overnight shipment. The required duration that a thermal package will need to
maintain the temperature of the product may vary widely from 48 to 96 hours or even longer.
Product temperature can be maintained by using either an active system or a passive system.
Active thermal packaging requires some type of heat pump or mechanical system and may be
beneficial in a closed loop distribution system. These packages have the ability to be reused, but
are costly when compared to a passive system. Passive systems typically use a coolant such as
gel packs or dry ice and are classified as frozen or refrigerated. For the purposes of this paper
we will focus on refrigerated packaging that maintains a range of temperature from +2 to +8°C.
Products that require temperature control between +2 to +8°C can be vaccines or protein
therapies where the effectiveness of these treatments degrade rapidly when exposed to
temperature excursions outside this range. The challenge has been for passive systems to
maintain the internal temperature of the product long enough through a distribution environment
Page 3
Meeting the Challenges of Thermal Packaging Mark Escobedo – Dimensions.07
with unknown temperature extremes and duration of exposure. In addition, these systems need
to achieve this goal at reasonable cost and weight along with a simple pack-out procedure to
eliminate errors. Developing and validating a thermal package system is a long process and for
many teams composed mostly of trial and error. This paper will address pitfalls associated with
thermal packaging that may improve a current package design, consider thermal profiles, and
provide a model to more rapidly determine the thermal resistance of a package system and
predict the ability of a system to protect the product.
Background
The trade off for thermal packaging is cost, not only for the package but for the associated
shipping costs and disposal costs; therefore, optimization of the thermal package is necessary.
Variables to consider are time in transit, temperature extremes, package size, and thermal
resistance. Review of basic heat transfer concepts and minimizing the effects will help build a
better thermal design.
Heat transfer occurs through three mechanisms, conduction, convection, and radiation.
Minimizing heat loss through conduction is achieved by the thickness of the insulation used.
Convection occurs in two locations; within the package system and outside the package system.
Internal convection will take place as the coolant continues to remove heat from the product.
Heat loss due to air exchange from outside of the package is critical and linked to the quality of
the container construction. Heat transfer due to radiation can be reduced with the use of
reflective surfaces, but cannot be eliminated completely. Cost efficiency of reflective surfaces
within the package may also be a limiting factor.
Coolant, in the form of gel packs, must have the ability to absorb large quantities of energy while
maintaining a constant temperature. Material phase change (solid to liquid) of the coolant is the
means by which absorption of energy is accomplished. Unfortunately, most gel packs are made
from water or saline. These have a phase change at 0C which of course is below our +2 to +8°C
range. Direct contact with the product is not recommended and may cause a portion of the
product to freeze. Ideally, we would like to have a coolant with a phase change within the
Page 4
Meeting the Challenges of Thermal Packaging Mark Escobedo – Dimensions.07
temperature range of our product. However, coolant with phase change characteristics within the
+2 to +8°C range are made of toxic materials. Rupture of the coolant would be too high of a risk
for a medical product. The shape of the coolant can also have a dramatic effect during pack-out
if the package design requires flat gel packs.
Insulation is the primary means of slowing heat transfer due to conduction. Common materials
are rigid polyurethane foam, or expanded polystyrene. Other elaborate materials are also
available, but are usually more expensive. An insulated container should be made of lightweight
yet dense material and should have the ability to be sealed. Issues with cracking due to impacts
will compromise the effectiveness at reducing thermal transfer.
ISTA 5B and the distribution environment
The distribution environment is the largest unknown variable in the equation of the thermal
package system. Seasonal changes have a dramatic effect on temperature exposure and require
developing a thermal pack for a wide temperature range. ISTA 5B recommends a study of the
distribution environment monitoring all trip segments, but statistical significance comes into play
when trying to measure the environment. Several trips would have to be recorded between all
major distribution hubs, assuming a nationwide customer base. If the product is distributed
globally the number of required measurements increases exponentially. This does not take into
account the trips required to monitor the varying seasonal changes. Other data collected by LTL
carriers would be helpful, but is often difficult to obtain. Doing a search on the web for
temperature extremes yields many sites with data collected worldwide.
Once the data is obtained incorporating the temperature extremes into a thermal profile will be a
good approximation for use in validating the package system. However, determining duration of
exposure at a temperature extreme is difficult if not impossible. Therefore, we look to standards
organizations, like ISTA to make recommendations. But even these recommendations can be
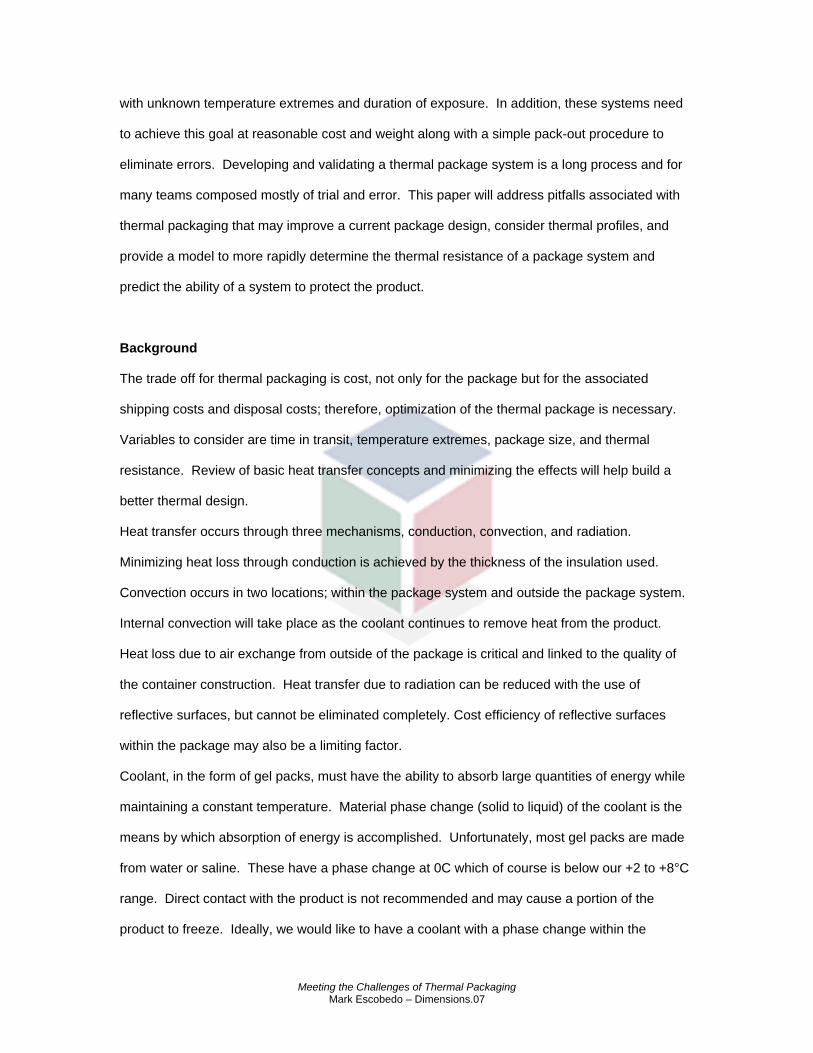
extreme. Two thermal packs used for this study were subjected to the ISTA 5B thermal profile.
Page 5
Meeting the Challenges of Thermal Packaging Mark Escobedo – Dimensions.07
Small Shipper 14 gel packs = 17.781kg (39.2 lb.)
0
10
20
30
40
50
60
0 4 8 12 16 20 24 28 32 36 40 44 48 52 56 60 64
Time (Hours)
Tem
pera
ture
°C
Chamber Small Shipper Core Small Shipper Vial 2°C 8°C
Figure 1 Unmodified ISTA 5B Profile and the Response of the Small Thermal Pack
Page 6
Meeting the Challenges of Thermal Packaging Mark Escobedo – Dimensions.07
Figure 2 Unmodified ISTA 5B Profile and the Response of the Large Thermal Pack
Looking at the vial temperature in both package systems, the small thermal pack maintains +8°C
for a little more than 24 hours and the large thermal pack maintains the +8°C for 34 hours.
Neither package system makes it through the entire 48 hour profile. Please note that this is a
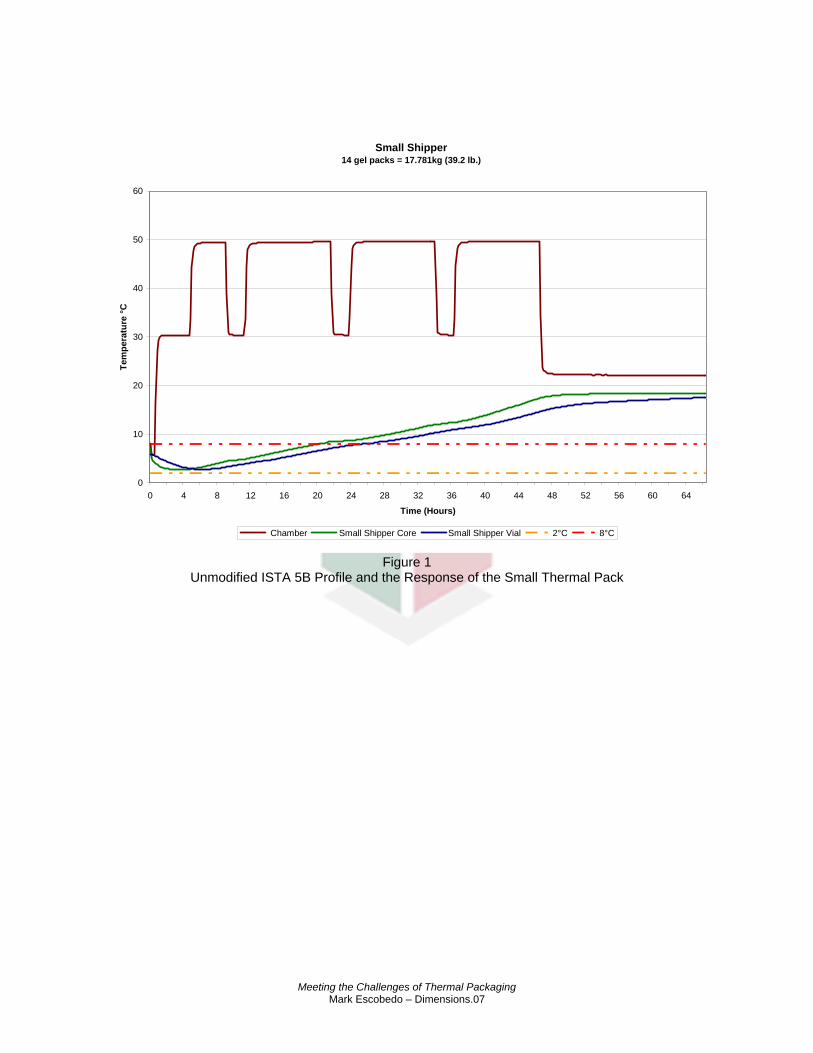
representation of what may be an extreme profile of the distribution environment. Figure 3
represents the ISTA 7D Summer Profiles for 24 and 48 hour domestic shipment by air. Figure 4
represents a custom profile with the associated thermal data.
Large Shipper 22 Gel Packs = 27.942kg of Coolant
0
10
20
30
40
50
60
0 4 8 12 16 20 24 28 32 36 40 44 48 52 56 60 64
Time (Minutes)
Tem
pera
ture
°C
Chamber Large Shipper Core Large Shipper Vial 2°C 8°C
Page 7
Meeting the Challenges of Thermal Packaging Mark Escobedo – Dimensions.07
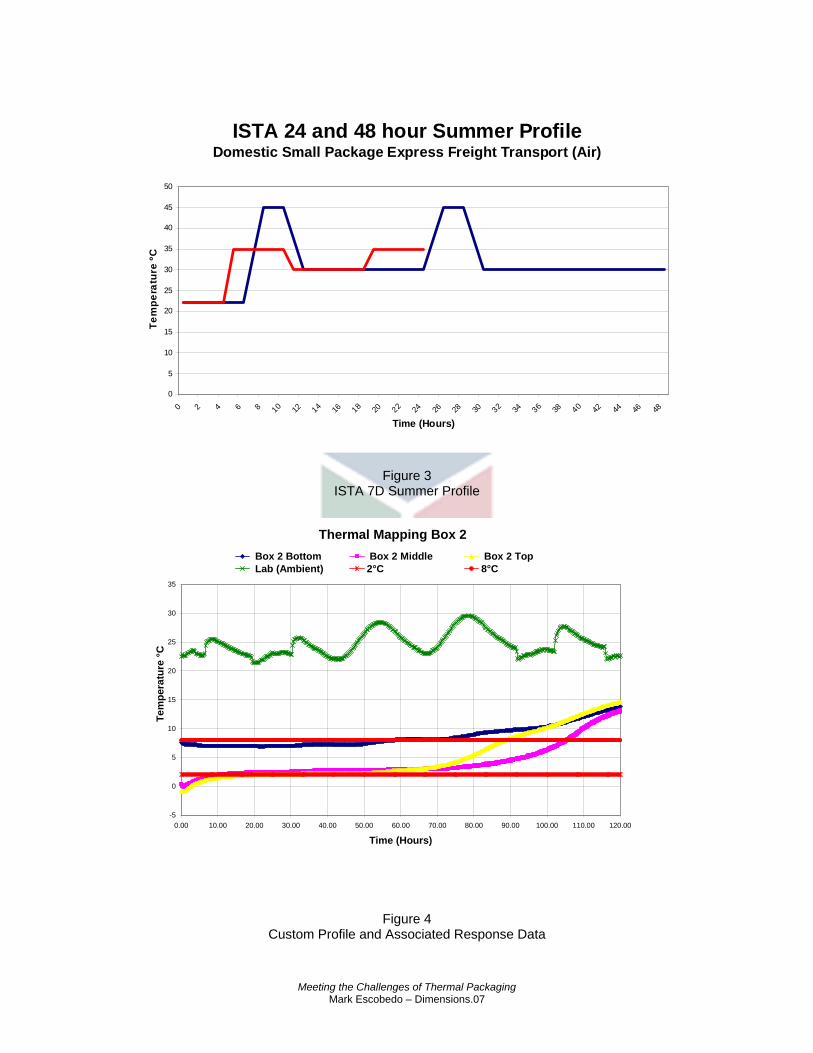
Figure 3 ISTA 7D Summer Profile
Figure 4 Custom Profile and Associated Response Data
ISTA 24 and 48 hour Summer Profile Domestic Small Package Express Freight Transport (Air)
0
5
10
15
20
25
30
35
40
45
50
0 2 4 6 8 10 12 14 16 18 20 22 24 26 28 30 32 34 36 38 40 42 44 46 48
Time (Hours)
Tem
pera
ture
ºC
Thermal Mapping Box 2
-5
0
5
10
15
20
25
30
35
0.00 10.00 20.00 30.00 40.00 50.00 60.00 70.00 80.00 90.00 100.00 110.00 120.00
Time (Hours)
Tem
pera
ture
°C
Box 2 Bottom Box 2 Middle Box 2 Top Lab (Ambient) 2°C 8°C
Page 8
Meeting the Challenges of Thermal Packaging Mark Escobedo – Dimensions.07
Attention to detail is necessary when mounting temperature sensors and assembling the package
system inside a test chamber. When a package system is subjected to a temperature profile the
shipper comes out of the chamber in a pristine condition. Impacts or vibration have not had any
effect on the system. When the package system is subjected to impacts and vibration the
thermal characteristics of the package system can change dramatically. Cracked insulation will
allow convection to occur at the damage site and reduce the ability of the package system to
protect the product for the required duration. The coolant packs will also begin to melt; the plastic
barrier may become torn or punctured no longer containing the gel. A routine distribution test
may take only one day to complete, but the package system can become soggy and coolant
packs can shift away from the product no longer providing adequate thermal protection. The
ISTA 5B specification mentions that shock and vibration should be considered, however, it does
not cover these inputs in any more detail.
A Simplified Method for Determining Thermal Resistance
The information presented above discusses the many variables associated in thermal package
design. However, what is really being discussed is the thermal resistance of the package system.
Interestingly enough there are several assumptions made when developing a package system.
The first is based on the thermal mass of the payload. Typical payloads consist of water and air
therefore the thermal mass is relatively low. Products with a higher thermal mass will have a
dramatic effect on the cooling capacity of the thermal package system. Next is the capacity of the
coolant to remove heat from the product for the required duration. The coolant temperature is
below our temperature range so the coolant continues to try to remove more heat to achieve 0C
equilibrium. This concept is why we would want to have a phase change material at the required
temperature range of +2 to +8°C.
Selecting the insulating properties of the material is critical in order to slow the transfer of heat to
the product. Two off the shelf thermal packs were purchased constructed with 2 inch thick
Expanded Polystyrene (EPS) insulating material. The table below summarizes the characteristics
of both shippers. In addition, gel coolant packs were used both frozen and unfrozen. Care was
Page 9
Meeting the Challenges of Thermal Packaging Mark Escobedo – Dimensions.07
taken to keep the core together. Locations were monitored at the vial and core of the package
system using a data logger with RTD sensors which yields accuracy of +/- 0.2°C. Readings were
taken every 10 minutes which allows for good resolution of temperature changes inside the
package.
Shipper Flute Type Insulation
Material
Thickness
(in)
Shipper ID
(in.)
Payload Box ID
(in.)
Payload OD
(in.)
Large C flute EPS 2 25 x 16 x 17.5 18 x 8 x 6 6.25 x 4.5 x 3
Small C flute EPS 2 16 x 16 x 19 9 x 7 x 7 6.25 x 4.5 x 3
The package system should be packaged so that the payload and the surrounding coolant are
the same temperature (+2 to +8°C) and frozen coolant is insulated from the pay load so as not to
make direct contact with the product. Additional frozen coolant shall be added if necessary
surrounding the refrigerated gel packs. Expose the package to a high temperature or low
temperature extremes and terminate the test once equilibrium is attained. Repeat for at least one
other setpoint and compare the variation in slope. The data can then be used to create a model
for the thermal performance of the package system. Since the internal components are the
same, the internal cooling capacity of the system remains the same so the variables are reduced
to the steady state temperature of the chamber. Selecting at least two setpoints around the
highest temperature extreme will give you the ability to screen the thermal performance of a
package before spending a lot of time testing each package system through an entire thermal
profile. Figure 5 below shows an example of the package system tested at +30°C and +40°C.
Page 10
Meeting the Challenges of Thermal Packaging Mark Escobedo – Dimensions.07
Figure 5 Thermal performance of the small and large shippers
Conclusion
To summarize the above information, identify the duration of your distribution environment, 48,
72, 96 hours and the temperature extreme of the distribution environment by measurement or
literature search. Calculate the thermal mass of the entire core to be cooled inside the package
system. Pack-out the package system to eliminate shifting of the coolant during transport.
Monitor several locations throughout the package system with a data logger. Select four
temperatures (two high and two low) for the setpoint temperature to use in the steady state
models to determine the thermal resistance of the package system. Conduct four tests one at
each setpoint until the package system attains equilibrium. Calculating the thermal performance
using this method may be refined to become a tool to eliminate the trial and error design of
Small Insulated ShipperSetpoint +30°C
0
5
10
15
20
25
30
35
0 4 8 12 16 20 24 28 32 36 40 44 48 52 56 60 64Time (hrs)
Small Shipper Vial Small Shipper Core Set Point +2°C +8°C
Tem
pera
ture
°C
Large Insulated ShipperSetpoint +30°C
0
5
10
15
20
25
30
35
0 4 8 12 16 20 24 28 32 36 40 44 48 52 56 60 64Time (hrs)
Large Shipper Vial Large Shipper Core Set Point +2°C +8°C
Tem
pera
ture
°C
Large Insulated ShipperSetpoint +40°C
0
5
10
15
20
25
30
35
40
45
0 4 8 12 16 20 24 28 32 36 40 44 48 52 56 60 64Time (hours)
Large Shipper Vial Large Shipper Core +2°C +8°C Set Point
Tem
pera
ture
°C
Small Insulated ShipperSetpoint +40°C
0
5
10
15
20
25
30
35
40
45
0 4 8 12 16 20 24 28 32 36 40 44 48 52 56 60 64Time (hours)
Small Shipper Vial Small Shipper Core +2°C +8°C Set Point
Tem
pera
ture
°C
Page 11
Meeting the Challenges of Thermal Packaging Mark Escobedo – Dimensions.07
thermal packaging. A software model could be developed to predict the thermal performance of a
single parcel shipment based on gel pack size, insulation properties, and product contents.
Page 12
Meeting the Challenges of Thermal Packaging Mark Escobedo – Dimensions.07
References
Huang, Francis F. “Engineering Thermodynamics Fundamentals and Application” Second Edition,
Macmillan Publishing Company 1988 USA
“ISTA Guide 5B 2002 - 2007, Focused Simulation Guide for Thermal Performance Testing of
Temperature Controlled Transport Packaging”, International Safe Transit Association, 1400
Abbott Rd., Suite 160, East Lansing, MI, 48823 USA
“ISTA Procedure 7D 2006 – 2007, Thermal Controlled Transport Packaging for Parcel Delivery
System Shipment”, International Safe Transit Association, 1400 Abbott Rd., Suite 160, East
Lansing, MI, 48823 USA
Schueneman, Herbert, H. CP-P/MH, “Design and Testing of Insulated Shipping Containers”
Westpak, Inc., 83 Great Oaks Blvd San Jose CA 95115
Temperature Data gathered from the Washington Post Website, Natilan Weather Service in San
Francisco CA