Chalmers Publication Library Mapping colors from paintings to tapestries: Rejuvenating the faded colors in tapestries based on colors in reference paintings This document has been downloaded from Chalmers Publication Library (CPL). It is the author´s version of a work that was accepted for publication in: Proceedings of SPIE - The International Society for Optical Engineering. Human Vision and Electronic Imaging XVII, Burlingame, CA, 23-26 January 2012 (ISSN: 0277-786X) Citation for the published paper: Ström, M. ; Johansson, E. ; Strok, D. (2012) "Mapping colors from paintings to tapestries: Rejuvenating the faded colors in tapestries based on colors in reference paintings". Proceedings of SPIE - The International Society for Optical Engineering. Human Vision and Electronic Imaging XVII, Burlingame, CA, 23-26 January 2012, vol. 8291 http://dx.doi.org/10.1117/12.905275 Downloaded from: http://publications.lib.chalmers.se/publication/156027 Notice: Changes introduced as a result of publishing processes such as copy-editing and formatting may not be reflected in this document. For a definitive version of this work, please refer to the published source. Please note that access to the published version might require a subscription. Chalmers Publication Library (CPL) offers the possibility of retrieving research publications produced at Chalmers University of Technology. It covers all types of publications: articles, dissertations, licentiate theses, masters theses, conference papers, reports etc. Since 2006 it is the official tool for Chalmers official publication statistics. To ensure that Chalmers research results are disseminated as widely as possible, an Open Access Policy has been adopted. The CPL service is administrated and maintained by Chalmers Library. (article starts on next page)
Transcript
Chalmers Publication Library
Mapping colors from paintings to tapestries: Rejuvenating the faded colors intapestries based on colors in reference paintings
This document has been downloaded from Chalmers Publication Library (CPL). It is the author´s
version of a work that was accepted for publication in:
Proceedings of SPIE - The International Society for Optical Engineering. Human Vision and
Electronic Imaging XVII, Burlingame, CA, 23-26 January 2012 (ISSN: 0277-786X)
Citation for the published paper:Ström, M. ; Johansson, E. ; Strok, D. (2012) "Mapping colors from paintings to tapestries:Rejuvenating the faded colors in tapestries based on colors in reference paintings".Proceedings of SPIE - The International Society for Optical Engineering. Human Vision andElectronic Imaging XVII, Burlingame, CA, 23-26 January 2012, vol. 8291
Notice: Changes introduced as a result of publishing processes such as copy-editing and
formatting may not be reflected in this document. For a definitive version of this work, please refer
to the published source. Please note that access to the published version might require a
subscription.
Chalmers Publication Library (CPL) offers the possibility of retrieving research publications produced at ChalmersUniversity of Technology. It covers all types of publications: articles, dissertations, licentiate theses, masters theses,conference papers, reports etc. Since 2006 it is the official tool for Chalmers official publication statistics. To ensure thatChalmers research results are disseminated as widely as possible, an Open Access Policy has been adopted.The CPL service is administrated and maintained by Chalmers Library.
Mapping colors from paintings to tapestries: Rejuvenatingthe faded colors in tapestries based on colors in reference
paintings
Marie Stroma∗, Eija Johanssona∗ and David G. Storkb
aSignals and Systems, Chalmers University of Technology, SE-412 96, Gothenburg SWEDENbRambus Labs, 1050 Enterprise Way Suite 700, Sunnyvale, CA 94089 USA
ABSTRACT
We addressed the problem of recovering or “rejuvenating” colors in a faded tapestry (the target image) byautomatically mapping colors from digital images of the reference painting or cartoon (the source image). Wedivided the overall computational challenge into several subproblems, and implemented their solutions in Matlab:1) quantizing the colors in both the tapestry and the referent painting, 2) matching corresponding regions inthe works based on spatial location, area and color, 3) mapping colors from regions in the source image tocorresponding regions in the target image, and 4) estimating the fading of colors and excluding color mapping ofareas where color has not faded. There are a number of semi-global design parameters in our algorithm, whichwe currently set by hand, for instance the parameter that balance the effects of 1) matching color areas in thetwo images and 2) matching the spatial locations between the two images. We demonstrated our method onsynthetic data and on small portions of 16th-century European tapestries of cultural patrimony. Our first stepsin a proof-of-concept work suggest that future refinements to our method will lead to a software tool of value toart scholars.
Keywords: color rejuvenation, fugitive pigments, fine art, cultural heritage, computer image analysis of art,tapestries
1. INTRODUCTION
There are many two-dimensional polychrome works of cultural heritage whose pigments are fugitive—that is,which fade in response to ambient light or the passage of time—including murals, paintings, prints, and tapestries.If we wish to understand the intentions of the artists of these works, we may seek to render the works in theiroriginal colors. For instance, it was well known even during his short lifetime that the pigments in some worksby the pioneer Pointillist Georges Seurat were fugitive, specifically the whites and cadmium yellows in his Undimanche apres-midi a l’Ille de la Grande Jatte, 1884–86.1 Color was particularly important to Seurat and he wasdeeply influenced by color science; he incorporated scientific discoveries into his choices of colors and their spatialarrangements in Un dimanche and indeed other works. Berns modeled the color fading of different pigments andthen applied the transformation to a high-resolution digital image of Un dimanche in its current state. In thisway, he produced a digital image of the painting in its 19th-century condition that was much brighter than thepainting in its modern state.2 The computed digital image of the rejuvenated painting provides art scholars witha better understanding of Seurat’s palette, his interpretation of the color theory of his time, and his workingmethods.
There are a number of methods for recovering or “rejuvenating” such faded colors, and the most appropriatemethods depends on the extent of fading and whether or not a reference source for the original colors exists. Forexample, the pigments along the borders in some paintings have been protected from light by the edge of a mattepicture frame, and thus can serve as referents for at least some of the colors in the faded painting. Likewise,the colors of threads on the reverse side of old tapestries are protected from light damage and retain their colorsbetter than the obverse.3 Finally, there may exist chemical data or laboratory samples of the unfaded pigments,
or information on the fading of pigments.4 The above sources are direct, that is, the material used for estimatingthe fading is contained in the work in question, or is physically related (as in matching pigment samples).
In this article, we consider the problem of rejuvenating colors in the absence of direct sources of informationbut with indirect information in the form of other artworks, which served as sources or references for the artist.For instance, many tapestries are based on paintings or colored cartoon references, such as Raphael’s cartoonfor The miraculous draught of fishes, a tapestry woven by the workshop of Pieter van Aelst. Of course, therelationship between colors in such an indirect source and the final work is based on the artist’s interpretationand possibly differences in the media themselves (a tapestry’s threads might be colored with vegetable pigmentswhile the source painting is executed in oil on canvas). In such a case there is an added uncertainty in therejuvenation.
Although not described in full detail, the Berns rejuvenation of La Grande Jatte required laborious handselection of brush strokes in high-resolution digital images of the painting. Clearly such a process is not practicalin the vast majority of works art scholars might wish to rejuvenate. Our goal, then, is to make digital rejuvenationas automatic a process as possible, ideally making it a software tool for non-computer-savvy art scholars. Akey step is thus automatically or semi-automatically segmenting regions within the source image and the targetimage, so that the comparison between the works’ colors can be made. The research presented here is but a firststep toward that step in the overall rejuvenation process.
The rest of this article is organized as follows. In Sect. 2 we describe our particular color rejuvenation assump-tions and problems in some detail. In Sect. 3 we describe the algorithm, including its mathematical foundations.In Sect. 4 we show results on synthetic data and on a small portion of Raphael’s The Miraculous Draught OfFishes,1515–16. A discussion about the obtained results and how our results may aid in the interpretation of oldtapestries is found in Sect. 5. Finally, in Sect. 6 we discuss future improvements and outline the way forward.
2. PROBLEM FORMULATION
In this section we will describe the background to the problem we address. Our overall goal is to develop analgorithm to compute a digital image in which severely faded color areas in an artwork, such as a tapestry, are“rejuvenated,” that is, restored to an approximation of their original colors. We consider the case where there isa referent image, such as a corresponding colored cartoon, which bears unfaded colors. In the unrealistic, “ideal”case, the shapes in the referent and target work correspond perfectly (they have the same shapes throughout),so the method is to merely apply the colors from the referent source (painting) to the corresponding points inthe target work (tapestry) to rejuvenate the work. One can, moreover, then compute the difference between thecolors at corresponding points to thereby determine the amount of fading in each color. For example, it mightbe that the blue regions are nearly the same color (indicating that the blue in the tapestry has not faded much)while the red regions differ significantly (indicating that the red in the tapestry has faded greatly).
In the more realistic case, the shapes in the two works differ somewhat, due to the artistic choices and libertiestaken by the copyist. The tapestry might, for example, have additional figures, or slightly altered composition.In this case, the simple method for the “ideal”case, just described, cannot work well because the colors from thereferent will not be mapped to the proper (shifted, altered) shapes in the target work. The algorithm needs tocompute the proper correspondences between shapes in the referent and in the target image so it can map thecolors from the source image to the corresponding shape in the target image.
The key computational challenge in this more realistic case is, therefore, to find the proper correspondencebetween points in the referent image and in the target image, despite the fact that some of the shapes have beenaltered a bit or shifted somewhat. Moreover, there may be regions in the source image that have no correspondingregions in the target image, since the artist deleted or added figures for compositional or other reasons. Onegeneral approach is to find regions in the referent and in the target images, then search for correspondences. Thefirst step in that overall process is to first cluster regions in each of the image.
There are several challenges in developing such an overall algorithm, for instance the differences in color andshape of the objects and the different amount of fading depending on color. The first difficulty is to clusterthe tapestry, since for example green and blue has usually faded into a yellow color and is therefore hard todistinguish from the true yellow color. To solve this problem one must include information about the spatial
SPIE-IS&T/ Vol. 8291 82911F-2
position of the pixels. Pixels closer together should be more likely to form a cluster than pixels far away fromeach other.
3. ALGORITHM
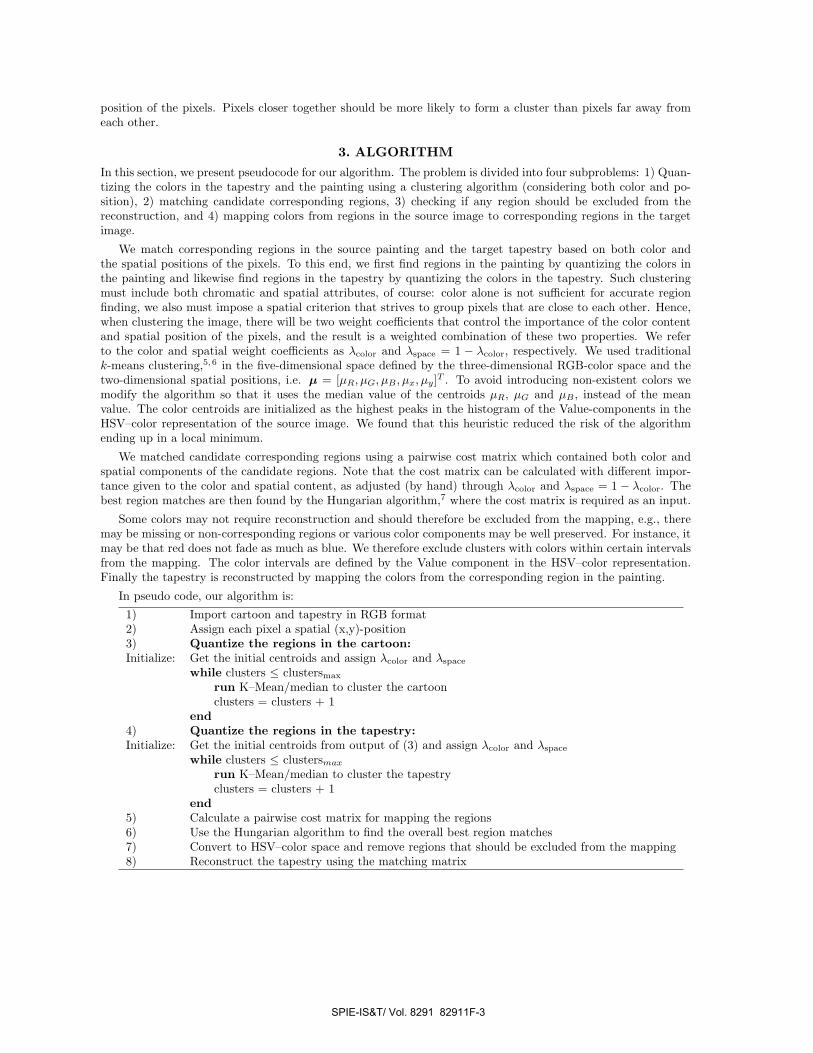
In this section, we present pseudocode for our algorithm. The problem is divided into four subproblems: 1) Quan-tizing the colors in the tapestry and the painting using a clustering algorithm (considering both color and po-sition), 2) matching candidate corresponding regions, 3) checking if any region should be excluded from thereconstruction, and 4) mapping colors from regions in the source image to corresponding regions in the targetimage.
We match corresponding regions in the source painting and the target tapestry based on both color andthe spatial positions of the pixels. To this end, we first find regions in the painting by quantizing the colors inthe painting and likewise find regions in the tapestry by quantizing the colors in the tapestry. Such clusteringmust include both chromatic and spatial attributes, of course: color alone is not sufficient for accurate regionfinding, we also must impose a spatial criterion that strives to group pixels that are close to each other. Hence,when clustering the image, there will be two weight coefficients that control the importance of the color contentand spatial position of the pixels, and the result is a weighted combination of these two properties. We referto the color and spatial weight coefficients as λcolor and λspace = 1 − λcolor, respectively. We used traditionalk-means clustering,5,6 in the five-dimensional space defined by the three-dimensional RGB-color space and thetwo-dimensional spatial positions, i.e. μ = [μR, μG, μB , μx, μy]
T . To avoid introducing non-existent colors wemodify the algorithm so that it uses the median value of the centroids μR, μG and μB , instead of the meanvalue. The color centroids are initialized as the highest peaks in the histogram of the Value-components in theHSV–color representation of the source image. We found that this heuristic reduced the risk of the algorithmending up in a local minimum.
We matched candidate corresponding regions using a pairwise cost matrix which contained both color andspatial components of the candidate regions. Note that the cost matrix can be calculated with different impor-tance given to the color and spatial content, as adjusted (by hand) through λcolor and λspace = 1 − λcolor. Thebest region matches are then found by the Hungarian algorithm,7 where the cost matrix is required as an input.
Some colors may not require reconstruction and should therefore be excluded from the mapping, e.g., theremay be missing or non-corresponding regions or various color components may be well preserved. For instance, itmay be that red does not fade as much as blue. We therefore exclude clusters with colors within certain intervalsfrom the mapping. The color intervals are defined by the Value component in the HSV–color representation.Finally the tapestry is reconstructed by mapping the colors from the corresponding region in the painting.
In pseudo code, our algorithm is:
1) Import cartoon and tapestry in RGB format2) Assign each pixel a spatial (x,y)-position3) Quantize the regions in the cartoon:Initialize: Get the initial centroids and assign λcolor and λspace
while clusters ≤ clustersmax
run K–Mean/median to cluster the cartoonclusters = clusters + 1
end4) Quantize the regions in the tapestry:Initialize: Get the initial centroids from output of (3) and assign λcolor and λspace
while clusters ≤ clustersmax
run K–Mean/median to cluster the tapestryclusters = clusters + 1
end5) Calculate a pairwise cost matrix for mapping the regions6) Use the Hungarian algorithm to find the overall best region matches7) Convert to HSV–color space and remove regions that should be excluded from the mapping8) Reconstruct the tapestry using the matching matrix
SPIE-IS&T/ Vol. 8291 82911F-3
4. NUMERICAL RESULTS
We implemented the above algorithm in Matlab and show our results for two different cases: one pair of syntheticexamples and one pair of regions taken from a cartoon and its associated faded tapestry. The synthetic exampleconsists of two different source images (where each image emphasizes a different problem) and two correspondingtarget images where the objects have different shapes and color compared to the target images. For the artwork,we used Raphael’s cartoon The Miraculous Draught of Fishes,1515–16,8 commissioned by Pope Leo X to constructcorresponding tapestries for the Sistine chapel. This example illustrates the importance of finding the correctspatial and color weights for the examined image, and how the algorithm performs for different problem regions.
4.1 Synthetic data image
We here present the results of applying our algorithm on two synthetically generated images. Two differentsynthetic images were generated to illustrate different problems in the color rejuvenation. The images are shownin Fig. 1(a) and 1(c). To evaluate the color reconstruction algorithm, two different representations of the sourceimages were created and can be seen in Fig. 1(b) and Fig. 1(d). The latter images will show the importanceof the color and the spatial clustering, respectively, as governed by the weighting parameters. In Fig. 1(b), theshapes and the colors of the objects have been altered somewhat. Nevertheless, one can still distinguish betweenthe different colors and therefore the colors should play an important role in the color quantization. On theother hand, if we investigate Fig. 1(d), the colors of two different areas exhibit a similar color representation andtherefore the spatial weight coefficient will play an important role. For both source–target images a cluster sizeof five clusters is used.
The two pair of synthetic images emphasize problems related to the color rejuvenation of faded tapestries.In the first set of source–target images (see Fig 1(a) and Fig 1(b)) new objects are introduced and the colors ofthe objects are slightly faded. Similar issues arise for the cartoon–tapestry pair, as objects can be introduced,distorted and/or slightly faded in color. The second pair of source–target images (see Fig 1(c) and Fig 1(d))instead emphasize the problem where colors fade into similar colors as other objects, thereby requiring spatialinformation about the objects. This example is highly relevant, as in the cartoon–tapestry pair several objectshave faded into similar colors.
In the first experiment we examine how well the color reconstruction algorithm performs for the first pair ofsource–target images. The reconstructed images can be seen in Fig. 2(a) and Fig. 2(b), for weight coefficients(λcolor, λspace) = (1, 0) and (λcolor, λspace) = (0.14, 0.86), respectively. As illustrated here, if the spatial weightcoefficient λspace is badly chosen, the image reconstruction algorithm fails.
We next applied our algorithm to the second pair of source–target images. The results from the colorreconstruction algorithm are presented in Figs. 3(b) and 3(a), where the weight coefficients are chosen as(λcolor, λspace) = (0.3, 0.7) and (λcolor, λspace) = (1, 0), respectively. The results show that the correct weightcoefficients are necessary for acceptable clustering results. Moreover, one sees that if the color of some regionshave faded, extra information about the spatial position of the pixels is necessary to distinguish objects withsimilar colors.
4.2 The Miraculous Draught of Fishes
We now turn to the application of our color reconstruction algorithm to the problem of interest: the rejuvenationof colors in a faded tapestry based on unfaded colors in its source cartoon. The cartoon can be seen in Fig. 4(a)and its corresponding tapestry in Fig. 4(b).
We examine two different segments of the cartoon and tapestry to evaluate the performance of the proposedalgorithm. The first evaluated segment is depicted in Fig. 5(a) and Fig. 5(b), respectively. Here, the green areahas suffered severe fading, compared to the red area where the colors are still intense. Therefore, we introducethe criterion that objects in clusters corresponding to a red color will be left out from the color mapping. In thisexperiment, we decided to use a cluster size of nine clusters. First the clustering algorithm is run on the cartoon,see Fig. 6(a), where the weight coefficients are chosen as (λcolor, λspace) = (0.79, 0.21). The weight coefficientsare tuned such that the best possible reconstruction of the colors in the tapestry, based on the visual impression,is achieved. The resulting values are (λcolor, λspace) = (0.36, 0.64). The reconstructed tapestry with these weight
SPIE-IS&T/ Vol. 8291 82911F-4
(a) Source image 1. (b) Target image 1. Here new objectsare introduced and colors are slightlyfaded compared with the source im-age.
(c) Source image 2. (d) Target image 2. Here severe fadingof one object is introduced comparedwith the source image.
Figure 1. Two synthetic pairs of source–target images that emphasize different complications which arise for cartoon–tapestry pairs. Fig 1(a) and Fig 1(b) : New objects are introduced and the colors of the objects are slightly faded. Fig 1(c)and Fig 1(d): Distinct colors in the source fade into similar colors in the target, thereby requiring spatial informationabout the objects.
coefficients is depicted in Fig. 6(b). Fig. 6(c) and Fig.6(d) show the color reconstruction for (λcolor, λspace) = (1, 0)and (λcolor, λspace) = (0.11, 0.89), respectively. As expected, the color reconstruction is poor when the weightcoefficients are not properly chosen.
In the second experiment, another segment of the cartoon–tapestry pair is investigated, see Figs. 7(a) and7(b). This segment shows an area where the color reconstruction algorithm experiences problems. The problemoccurs when objects have faded into similar colors as other nearby objects. In this experiment we set themaximal number of clusters to nine. The outcome of the reconstruction algorithm with weight coefficients tunedso as to giving the best visual interception is depicted in Fig. 4.2, where Fig. 8(a) shows the clustered cartoon((λcolor, λspace) = (0.78, 0.22)) and Fig. 8(b) shows the tapestry after color rejuvenation, with (λcolor, λspace) =(0.44, 0.56). Since the neck area and the lining of the cloth area are close both in color and space, they end upin the same cluster.
Figure 2. Color rejuvenation of the first pair of source–target images with different values of the weight coefficients. Thisexample was constructed such that the color content is more important than the spatial position of the objects. Therefore,the color reconstruction fails if the color weight coefficient is too low.
Figure 3. Color rejuvenation of the second pair of source–target images with different values of the weight coefficients.Here the importance of the spatial weight coefficient is emphasized, as information about the spatial position of the pixelsis required to distinguish objects with similar colors.
5. CONCLUSIONS
We have described the problem of reconstructing or “rejuvenating” colors that have faded in a tapestry in the casewhere an unfaded source image, such as an oil cartoon, is available. The proposed algorithm considers both colorand spatial features for clustering regions, and uses the Hungarian algorithm for finding corresponding region inthe two images. The current version of our algorithm requires some hand tuning of the relative weighting of thechromatic and the spatial properties of regions. Finding the optimal such weightings automatically is a topicof future research. We tested our algorithm on simple synthetic and and on The miraculous draught of fishes,showing promising results.
In the case of synthetic images, it is seen that, as expected, clustering based solely on chromatic featuresyields acceptable regions when the colors within each region are fairly uniform and differ significantly from thosein neighboring regions (see Fig. 2(a)). However, when severe fading has changed the color into a completelydifferent color, e.g., when green has turned into beige, it is important to also consider the spatial position ofthe pixels when constructing the clusters. This is illustrated in Fig. 3(a), where the reconstruction fails sincethe positions of the pixels are ignored. If the spatial weight coefficient is increased, the reconstruction performsmuch better, see Fig. 3(b).
SPIE-IS&T/ Vol. 8291 82911F-6
(a) The Miraculous Draught of Fishes cartoon,Raphael 1515–1516
(b) The Miraculous Draught of Fishes tapestry, wo-ven by the workshop of Pieter van Aelst 1517–1519.
Figure 4. The miraculous draught of fishes, cartoon and tapestry pair.
(a) First evaluated segment of the cartoon. (b) First evaluated segment of the tapestry.
Figure 5. A segment of the cartoon–tapestry pair evaluated as our first experiment. The green area in the tapestry hassuffered severe fading.
Secondly, we evaluated the performance on real pieces of art. We found that with suitable chosen weightcoefficients it is possible to rejuvenate colors which have faded in the tapestry, with the help of its correspondingcartoon, see Figs. 4(a), 4(b) and 6(b). However, our algorithm has problems handling cases where nearby partshave faded into similar colors, see Figs. 7(a),7(b) and 8(b).
6. FUTURE WORK
This work should be considered a beginning and a proof of concept and there are of course parts that need tobe further investigated and developed. For example, we need to handle cases when a faded object both has asimilar color as another object, and is nearby in space. One possible way to resolve this is to add a patternrecognition algorithm that can identify shapes and map their colors. Furthermore, since the painting and thetapestry possibly had different colors even when they were made, the actual colors to map should not necessarilybe picked from the painting. We could still use the painting to distinguish the areas to map and what color(green, blue...) but the actual shade of green should be chosen from actual restoration with knowledge on howthe color green has faded from its original color in tapestries from that age in general. Also, using historicalknowledge about the fading of the colors in tapestries would allow us to get a measure of how well we succeedin reconstructing the colors and how well it actually represents the original tapestry. It is also helpful to knowwhich colors need reconstruction and which have not faded particularly and should therefore be kept.
SPIE-IS&T/ Vol. 8291 82911F-7
(a) Quantization and clustering of the cartoonwith (λcolor, λspace) = (0.79, 0.21).
(b) The reconstructed tapestry with(λcolor, λspace) = (0.36, 0.64). Note that thecolor of the green area is enhanced compared withthe original tapestry.
(c) The reconstructed tapestry with(λcolor, λspace) = (1, 0). Since the weight co-efficients are not properly chosen the colorreconstruction fails.
(d) The reconstructed tapestry with(λcolor, λspace) = (0.11, 0.89). This recon-struction fails as the importance of the spatialposition is greatly overestimated.
Figure 6. Investigation of the color clustering and color reconstruction algorithm for a segment of the cartoon–tapestrypair, for different values of the weight coefficients.
(a) Second evaluated segment ofthe cartoon.
(b) Second evaluated segment ofthe tapestry.
Figure 7. A segment of the cartoon–tapestry pair evaluated as our second experiment. The green area in the tapestry hassuffered from severe fading and is similar to the neck in both color and spatial position.
SPIE-IS&T/ Vol. 8291 82911F-8
(a) Quantization and clus-tering of the cartoon with(λcolor, λspace) = (0.78, 0.22).
(b) The reconstructedtapestry with (λcolor, λspace) =(0.44, 0.56)
Figure 8. The segment of the cartoon–tapestry pair evaluated in the second experiment, illustrating the problem whenareas close in spatial position have faded into a similar color.
REFERENCES
1. R. L. Herbert, Seurat and the making of La Grande Jatte, Art Institute of Chicago, Chicago, IL, 2004.
2. R. S. Berns, “Rejuvenating Seurat’s palette using color and imaging science: A simulation,” in Seurat andthe making of La Grande Jatte, R. L. Herbert, ed., pp. 214–227, Art Institute of Chicago, Chicago, IL, 2004.
3. T. P. Campbell, Tapestry in the Renaissance – Art and Magnificence, The Metropolitan Museum of Art,New York, 2002.
4. N. Eastaugh, V. Walsh, T. Chaplin, and R. Siddall, Pigment compendium: A dictionary of historical pigments,Elsevier, New York, NY, 2004.
5. J. T. Tou and R. C. Gonzalez, Pattern Recognition Principles, Reading MA: Addison-Wesley, 1974.
6. R. O. Duda, P. E. Hart, and D. G. Stork, Pattern classification, John Wiley and Sons, New York, NY,Second ed., 2001.
7. H. W. Kuhn, “The hungarian method for the assignment problem,” Naval Res. Logist. Quart. 2, pp. 83 – 97,1955.
8. M. Evans and C. Browne, Raphael: Cartoons and Tapestries for the Sistine Chapel., Victoria and AlbertMuseum, London, 2020.