Changes in ruminal and reticular pH andbacterial communities in Holstein cattle feda high-grain dietYo-Han Kim1,2, Rie Nagata1, Akira Ohkubo1, Natsuki Ohtani1, Shiro Kushibiki3, Toshihiro Ichijo2 and Shigeru Sato1,2*
Abstract
Background: Subacute ruminal acidosis (SARA) is characterized by a ruminal pH depression, and microbiota canalso be affected by a higher acidity and/or dietary changes. Previous studies have revealed similar patterns in pHreduction in the rumen and reticulum, whereas changes in reticular pH and bacterial community following a high-grain diet are not fully understood. The aim of this study was to investigate the changes in reticular pH andbacterial community structure following a high-grain diet simultaneously with those in the rumen.
Results: SARA was diagnosed when ruminal and reticular pH remained under 5.6 for 350 ± 14 and 312 ± 24 min/d,respectively, on the last day of the CON period. During the CON period, lower proportion of acetic acid and higherproportion of butyric acid were observed compared with the HAY period. The proportions of acetic acid andpropionic acid were lower and higher, respectively, in the rumen compared with the reticulum. From 454pyrosequencing analysis, the relative abundance of several genera differed significantly between the two periodsand the two locations. During the HAY period, higher relative abundances of Prevotella, Eubacterium, Oscillibacter,and Succiniclasticum and lower relative abundances of Ruminococcus, Clostridium, and Olsenella were identifiedcompared with the CON period. Furthermore, the relative abundance of Eubacterium was lower in the rumencompared with the reticulum. Bacterial diversity indices were significantly different between the HAY and CONperiods, being higher in the HAY period. The quantitative real-time PCR showed that the copy numbers of severalcellulolytic bacteria (Fibrobacter succinogenes and Ruminococcus albus) were higher during the HAY period.
Conclusion: A high-grain diet showed similar impacts on the pH, fermentation, and bacterial community structurein the rumen and reticulum. During the CON period, ruminal and reticular pH decreased following the high-grainchallenge, and lower bacterial diversity and changes in the bacterial composition, similarity, and bacterial copynumbers were observed due to a higher acidity and dietary changes compared with the HAY period. Thesechanges may influence the fermentative ability of the rumen and reticulum.
Keywords: Microbiota, pH, Reticulum, Rumen, SARA
BackgroundSubacute ruminal acidosis (SARA) is a common healthand production problem in dairy herds, and is defined as acondition characterized by ruminal pH < 5.6 for more than3 h per day [1]. Monitoring of forestomach pH has beensuggested as a potentially valuable tool for diagnosing
SARA [2, 3]. Sato et al. [2] measured ruminal and reticularpH simultaneously using a radio transmission pH meas-urement system and observed similar patterns in pH re-duction in the rumen and reticulum after feeding. Morerecently, Falk et al. [3] compared the ruminal and reticularpH of cows in early stages of lactation. They found that re-ticular pH was higher than ruminal pH in averaged pHprofiles at all weeks of lactation. Collectively, these twostudies demonstrated that reticular pH is closely corre-lated with ruminal pH.Pyrosequencing technology is an alternative to trad-
itional gel-based sequencing techniques for de novo
* Correspondence: [email protected] Graduate School of Veterinary Science, Gifu University, Gifu 501-1193,Japan2Cooperative Department of Veterinary Medicine, Faculty of Agriculture,Iwate University, Morioka, Iwate 020-8550, JapanFull list of author information is available at the end of the article
DNA sequencing, and has been used to analyze rumin-ant gastrointestinal microbiota, especially in the rumen[4–6]. A decrease in ruminal pH following a high-graindiet is quite common; microbiota and epithelial bacterialcommunities in the rumen can also change due to higheracidity and/or dietary changes [5, 7]. Sato [5] reported thata high-grain diet caused not only decreased ruminal pHbut also a reduction in the relative abundance of the rumi-nal phyla Bacteroidetes and Proteobacteria in cattle withrepeatedly induced SARA. Furthermore, the addition ofstarch source reduces bacterial diversity indices [8, 9], andthe relative abundances of ruminal phyla are affected bystarch and oil additions [4].Although rumen microbiota are influenced by rumen
conditions such as pH, feeding materials, and nutritionalcompositions [5, 6], changes in reticular pH and bacter-ial communities following a high-grain diet are not fullyunderstood. Therefore, the objective of this study was toidentify the continuous changes in reticular pH and itseffect on bacterial community structure following ahigh-grain diet simultaneously with those in the rumen.
ResultsRuminal and reticular pH and volatile fatty acids (VFAs)The 24-h mean ruminal and reticular pH decreased fol-lowing the high-grain challenge (Fig. 1), and reticularpH was higher than ruminal pH during the HAY andCON periods, except on day 12. No significant differ-ences were observed in 1-h mean pH and duration ofpH < 5.6 in the rumen and reticulum. A significant dif-ference (P < 0.05) between the ruminal and reticular pH
was identified only on day 1, and ruminal pH was sig-nificantly (P < 0.05) decreased on day 9 compared to thaton day 7 (Fig. 1). Linear regression analysis revealed asignificant relationship between the 24-h mean pH anddays in both rumen and reticulum (R2 = 0.79 and R2 =0.81, respectively; P < 0.05). Diurnal changes in the 1-hmean ruminal and reticular pH observed on the last daysof the HAY (day 7) and CON (day 14) periods are shownin Fig. 2. In day 14, linear regression analysis revealedthat the ruminal and reticular pH decreased up to 4 hafter the morning feeding (R2 = 0.92 and R2 = 0.89, re-spectively; P < 0.05 and P = 0.057, respectively), and in-creased from 4 h after the evening feeding (R2 = 0.99 andR2 = 0.97, respectively; P < 0.05). The duration of timewhere ruminal and reticular pH < 5.6 were 350 ± 14 and312 ± 24 min/d, respectively, on the last day of the CONperiod (Fig. 3).No significant differences were observed in total VFA
and NH3-N concentrations in the rumen and reticulum(Table 1). However, a lower proportion of acetic acidand higher proportions of butyric acid and other VFAs(95% confidence interval: 2.14 to 3.46), excluding aceticacid, propionic acid, and butyric acid from the totalVFAs, were observed during the CON period comparedwith the HAY period. The proportions of ruminal aceticacid and propionic acid were significantly lower andhigher compared with the reticulum values, respectively,in both periods (P < 0.05). The proportions of ruminalbutyric acid and other VFAs were significantly higher inthe CON than in the HAY period (P < 0.05). The ratios ofruminal acetic acid to propionic acid in both periods weresignificantly lower than those in the reticulum (P < 0.05).The concentration of ruminal lactic acid was significantlyhigher in the CON than in the HAY period (P < 0.05).
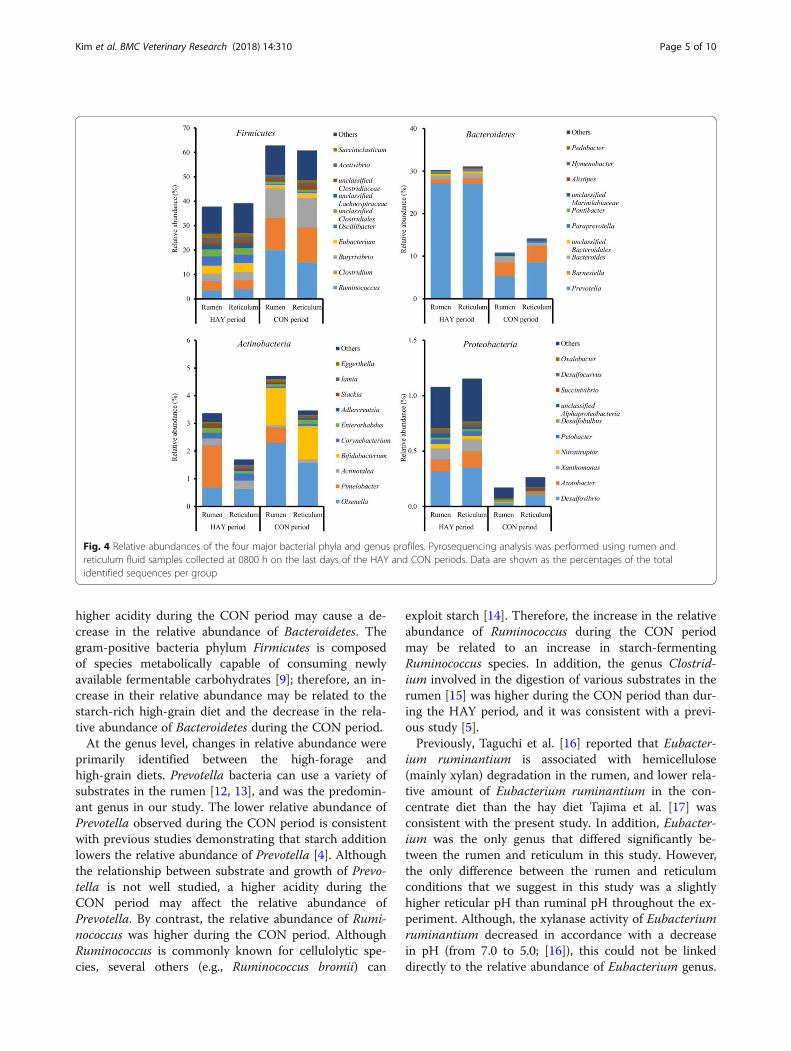
Bacterial abundanceOf the major phyla, Firmicutes, Bacteroidetes, and Acti-nobacteria were the most abundant, accounting for74.3% of the total ruminal sequences and 74.0% of thetotal reticular sequences (Fig. 4). The remaining phylahad low relative abundances of < 1%. A total of 337 bac-terial genera were identified; the relative abundances of323 genera comprised < 1% of the total sequences. Ofthe major genera, Prevotella was the most abundant inboth the rumen and reticulum, followed by Ruminococ-cus and Clostridium. The relative abundance of Prevo-tella (18.4%) in the rumen was lower than that in thereticulum (21.2%), whereas the relative abundances ofRuminococcus (10.5%) and Clostridium (7.7%) in therumen were higher than those of the reticulum (7.7%and 6.8%, respectively) regardless of diet.At the phylum level, the relative abundances of Firmi-
cutes and Bacteroidetes differed significantly between theHAY and CON periods (P < 0.05; Table 2). At the genus
Fig. 1 Daily changes in 24-h mean ruminal and reticular pH duringthe HAY and CON periods. Ruminal and reticular pH were measuredsimultaneously during the experimental period. Cattle were fed ahigh-forage diet for 7 days (HAY period) and then a high-grain dietfor 7 days (CON period). A SARA challenge was performed as a high-forage period followed by a high-grain period. * denotes difference(P < 0.05) between the rumen and reticulum at the same day point.# denotes difference (P < 0.05) between the last day of the HAYperiod (day 7) and other day points at the same location. The valuesshown are means ± SEM
Kim et al. BMC Veterinary Research (2018) 14:310 Page 2 of 10
level, the relative abundances of Prevotella, Eubacterium(95% confidence interval: 2.02 to 3.18), Oscillibacter, andSucciniclasticum were lower during the CON period,whereas the relative abundances of Ruminococcus, Clos-tridium, and Olsenella (95% confidence interval: 0.78 to1.80) were higher during this period; these genera dif-fered significantly between the HAY and CON periods(P < 0.05; Table 2). The relative abundance of Barnesiellaexhibited a trend for difference (P = 0.077) between thetwo periods, being higher during the CON period com-pared with the HAY period. Considering the relativeabundance of Eubacterium spp., a lower relative abun-dance (P < 0.05) was detected for rumen samples thanreticulum samples. The period × location interaction
was significant (P < 0.05) for the relative abundance ofOlsenella. The relative abundances of Olsenella in therumen and reticulum during the CON period were sig-nificantly (P < 0.05) lower compared with those duringthe HAY period. During the CON period, the relativeabundance of Olsenella was significantly (P < 0.05)higher in the rumen compared with the reticulum. How-ever, there was no statistical significance in the relativeabundances of Butyrivibrio (95% confidence interval:3.20 to 12.0), unclassified Clostridiales (95% confidenceinterval: 0.73 to 2.93), Acetivibrio (95% confidence inter-val: 0.63 to 2.27), unclassified Lachnospiraceae (95% con-fidence interval: 0.33 to 1.95), unclassified Clostridiaceae(95% confidence interval: 0.81 to 1.45), and Bacteroides(95% confidence interval: 0.43 to 1.55) between the twoperiods and two locations.
Bacterial diversity analysisRarefaction curves calculated at a 97% similarity level in-dicated that the reticulum had higher bacterial diversitythan did the rumen (Additional file 1: Figure S1), andthe HAY period had higher bacterial diversity than didthe CON period, regardless of the location (Table 3).The PCoA results indicated that the HAY period wasseparate from the CON period in the plot regardless oflocation, whereas the individual plots for cattle showedclose similarity between the rumen and reticulum (PC1+ PC2 = 27.6%; Fig. 5). Moreover, the operational taxo-nomic units (OTUs), abundance-based coverage esti-mator (ACE), Chao1, Shannon (95% confidenceinterval: 4.70 to 5.52), Simpson indices were higherin the HAY period, while Simpson index was higherin the CON period. The effect of location and theinteraction effect of period × location were not sig-nificant for indices.
Fig. 2 Diurnal changes in the 1-h mean ruminal and reticular pH. Ruminal and reticular pH were measured simultaneously during theexperimental period. Cattle were fed a high-forage diet for 7 days (HAY period) and then a high-grain diet for 7 days (CON period). A SARAchallenge was performed as a high-forage period followed by a high-grain period. Day 7 and 14 indicate the last days of the HAY (day 7) andCON (day 14) periods, respectively. Arrows indicate feeding times (08:00 and 17:00). The values shown are means ± SEM
Fig. 3 Daily changes in the 24-h mean time that ruminal andreticular pH < 5.6. Ruminal and reticular pH were measuredsimultaneously during the experimental period. Cattle were fed ahigh-forage diet for 7 days (HAY period) and then a high-grain dietfor 7 days (CON period). A SARA challenge was performed as a high-forage period followed by a high-grain period. The values shown aremeans ± SEM
Kim et al. BMC Veterinary Research (2018) 14:310 Page 3 of 10
Copy numbers of bacterial 16S genesThe copy numbers of total methanogens, Fibrobacter suc-cinogenes, and Selenomonas ruminantium differed signifi-cantly (P < 0.05) between the HAY and CON periods,being higher during the HAY period (Table 4). The copynumber of Ruminococcus albus was tended (P = 0.068) tobe higher during the HAY period compared with the
CON period. No statistical difference was identified in thecopy numbers of Megasphaera elsdenii (95% confidenceinterval: 2.93 to 4.87), Streptococcus bovis (95% confidenceinterval: 5.65 to 7.47), and Ruminococcus flavefaciens (95%confidence interval: 5.92 to 7.042). The copy number oftotal methanogens was significantly different between therumen and reticulum (P < 0.05), being higher in therumen. The period × location interaction was significantfor Ruminococcus flavefaciens (P < 0.05). The copy num-ber of Ruminococcus flavefaciens in the rumen during theHAY period was significantly (P < 0.05) higher comparedwith that during the CON period.
DiscussionThis study aimed to identify the continuous changes inreticular pH following a high-grain diet and to investi-gate its effect on the reticular bacterial composition, di-versity, and similarity simultaneously with those in therumen. Sato et al. [2] previously identified significantpositive correlations between reticular and ruminal pHin both healthy and SARA-induced cows. SARA was di-agnosed based on a condition characterized by ruminalpH < 5.6 for more than 3 h per day [1] in our study, andthe ruminal and reticular pH remained under 5.6 over3 h from 2 days after the high-grain diet feeding to theend of the experiment. Therefore, SARA was success-fully induced in the present study. Furthermore, thelower proportion of acetic acid and higher proportion ofbutyric acid following the high-grain diet were consist-ent with a previous study [7]. Although a temporarilyhigher concentration of lactic acid at 20:00 was identi-fied in the CON period, this increase may not accuratelyreflect the diurnal changes in the 1-h mean ruminal andreticular pH throughout a day. Therefore, VFA produc-tion by microbes and its removal by absorption throughruminal epithelial cells, neutralization with salivary buf-fer, and passage to the lower digestive tracts [10] mightbe a more plausible determinant of the ruminal and re-ticular pH. However, no statistically significant differ-ences in total VFA concentration were identified, so wecan only speculate that fatty acid removal was encour-aged by the marked decrease in ruminal and reticularpH in this study.In our study, significant change in the relative abun-
dance at the phylum level was only identified betweenthe HAY and CON periods. Firmicutes and Bacteroideteswere the most abundant bacterial phyla in both therumen and reticulum, and they were affected by ahigh-grain diet in our study. Gram-negative Bacteroi-detes bacteria have been shown to decrease in the rumenof cattle with SARA induced by either grain or alfalfapellets [11], and their relative abundance was reduced incattle with induced SARA [5]. Because a low rumen pHcan lead to death and lysis of gram-negative bacteria [9],
Table 1 Total VFA, NH3-N, and lactic acid concentrations,individual VFA proportions, and acetic acid-to-propionic acidratio
Items HAY period CON period SEM
Rumen Reticulum Rumen Reticulum
Total VFA, mmol/dL
08:00 12.21 8.44 9.91 9.47 0.83
14:00 9.05 9.48 11.60 11.07 0.70
20:00 8.94 9.66 9.70 9.18 0.40
Acetic acid, %
08:00 73.58a 75.39 61.12A 66.45 0.53
14:00 71.91a 73.98 57.23 60.87 1.22
20:00 70.52A 73.80 59.46A 63.11 1.36
Propionic acid, %
08:00 17.68 16.73 17.49A 15.21 0.95
14:00 18.42 17.47 16.72 15.28 1.23
20:00 19.22A 17.35 18.33A 16.90 1.10
Butyric acid, %
08:00 7.05 6.37b 17.07A 14.67 0.48
14:00 8.15Aa 7.27b 21.44 19.63 0.57
20:00 8.70 7.65 18.52A 16.73 0.59
Others, %
08:00 1.70 1.51B 4.33 3.67 0.27
14:00 1.51Aa 1.28B 4.62a 4.21 0.30
20:00 1.57A 1.20B 3.68a 3.26 0.14
A/P Ratio
08:00 4.16 4.52 3.58A 4.47 0.26
14:00 3.91 4.26 3.56 4.12 0.36
20:00 3.69A 4.27 3.31A 3.82 0.30
NH3-N, mg/dL
08:00 9.02 8.17 5.62 6.44 0.61
14:00 4.75 5.21 3.46 2.95 0.51
20:00 4.70 5.18 5.98 6.33 0.79
Lactic acid, g/L
08:00 0.018 0.028 0.014 0.015 0.006
14:00 0.017 0.016 0.015 0.012 0.004
20:00 0.010A 0.015 0.375 0.381 0.059A,B denotes significant difference (P < 0.05) between the rumen and reticulumat the same perioda,b denotes significant difference (P < 0.05) between the HAY and CON periodsat the same location
Kim et al. BMC Veterinary Research (2018) 14:310 Page 4 of 10
higher acidity during the CON period may cause a de-crease in the relative abundance of Bacteroidetes. Thegram-positive bacteria phylum Firmicutes is composedof species metabolically capable of consuming newlyavailable fermentable carbohydrates [9]; therefore, an in-crease in their relative abundance may be related to thestarch-rich high-grain diet and the decrease in the rela-tive abundance of Bacteroidetes during the CON period.At the genus level, changes in relative abundance were
primarily identified between the high-forage andhigh-grain diets. Prevotella bacteria can use a variety ofsubstrates in the rumen [12, 13], and was the predomin-ant genus in our study. The lower relative abundance ofPrevotella observed during the CON period is consistentwith previous studies demonstrating that starch additionlowers the relative abundance of Prevotella [4]. Althoughthe relationship between substrate and growth of Prevo-tella is not well studied, a higher acidity during theCON period may affect the relative abundance ofPrevotella. By contrast, the relative abundance of Rumi-nococcus was higher during the CON period. AlthoughRuminococcus is commonly known for cellulolytic spe-cies, several others (e.g., Ruminococcus bromii) can
exploit starch [14]. Therefore, the increase in the relativeabundance of Ruminococcus during the CON periodmay be related to an increase in starch-fermentingRuminococcus species. In addition, the genus Clostrid-ium involved in the digestion of various substrates in therumen [15] was higher during the CON period than dur-ing the HAY period, and it was consistent with a previ-ous study [5].Previously, Taguchi et al. [16] reported that Eubacter-
ium ruminantium is associated with hemicellulose(mainly xylan) degradation in the rumen, and lower rela-tive amount of Eubacterium ruminantium in the con-centrate diet than the hay diet Tajima et al. [17] wasconsistent with the present study. In addition, Eubacter-ium was the only genus that differed significantly be-tween the rumen and reticulum in this study. However,the only difference between the rumen and reticulumconditions that we suggest in this study was a slightlyhigher reticular pH than ruminal pH throughout the ex-periment. Although, the xylanase activity of Eubacteriumruminantium decreased in accordance with a decreasein pH (from 7.0 to 5.0; [16]), this could not be linkeddirectly to the relative abundance of Eubacterium genus.
Fig. 4 Relative abundances of the four major bacterial phyla and genus profiles. Pyrosequencing analysis was performed using rumen andreticulum fluid samples collected at 0800 h on the last days of the HAY and CON periods. Data are shown as the percentages of the totalidentified sequences per group
Kim et al. BMC Veterinary Research (2018) 14:310 Page 5 of 10
Therefore, further studies are required to clarify the ef-fects of acidic conditions on the changes in the relativeabundance of Eubacterium genus. Collectively, these re-sults suggest that changes in the relative abundances ofbacterial genera may be mainly influenced by changes inuseable substrates, as well as by the acidic environment.The passage rate of ruminal contents from the rumen
to the duodenum is increased in cattle by feeding a con-centrated diet, resulting in less time for microbial fer-mentation [18]. The increased passage rate could causemethanogenesis to shift to the hind gut and manure[19], and it was consistent with the lower copy numberof total methanogens in the CON period. In this study,several bacteria well known for their cellulolytic activity(Fibrobacter succinogenes, Ruminococcus albus, andRuminococcus flavefaciens; [20]) had higher copy num-bers during the HAY period, which may be related to
the higher fiber contents during this period. Meanwhile,Megasphaera elsdenii, a lactate-metabolizing species, in-creases in abundance as the bacterial community adaptsto more readily fermentable carbohydrates [21], and thehigher copy number of Megasphaera elsdenii during theCON period may be associated with higher relativeabundance of lactate-producing bacterium, such as Olse-nella, during the same period. Moreover, dilution of thereticulum contents occurs with fresh and less-fermentedfeed [2, 3], which might cause the lower bacterial copynumbers in the reticulum compared with the rumen.Feeding a high-grain diet to cattle decreases the rumi-
nal pH and bacterial diversity of the rumen epithelialcommunity [7], and calves fed a high-grain diet showsignificantly lower ruminal pH and bacterial diversitycompared with calves fed a high-grain diet with forage[6]. In the present study, ruminal and reticular pH
Table 2 Relative abundance (% of total sequences) of the major bacterial phyla and genera
Items HAY Period CON Period SEM P value
Rumen (n = 4) Reticulum (n = 4) Rumen (n = 4) Reticulum (n = 4) Period (P) Location (L) P x L
Kim et al. BMC Veterinary Research (2018) 14:310 Page 6 of 10
decreased after cattle transitioned from a high-forage to ahigh-grain diet, and bacterial diversity indices, such asOTUs, ACE, Chao1, and Shannon index, were lower dur-ing the CON period than during the HAY period. Further-more, PCoA results showed that the HAY period wasseparate from the CON period in the plot regardless of lo-cation, and the rarefaction curve was consistent with thebacterial diversity analysis. Therefore, we assumed thatthe lower ruminal and reticular pH during the CONperiod resulted in the lower bacterial diversity. Althoughno statistically significant difference was identified in bac-terial diversity between the rumen and reticulum, thehigher diversity indices identified in the reticulum wereconsistent with the higher pH there compared to that inthe rumen, which supports our hypothesis.
ConclusionTo the best of our knowledge, this is the first study toexamine changes in reticular pH continuously and
bacterial community structure following a high-grain dietfeeding. Ruminal and reticular pH decreased after feedinga high-grain diet, and SARA was successfully induced dur-ing the CON period. Changes in the bacterial communitystructure and copy number were mainly identified be-tween the two periods, which might be related to thechanges in pH and diet. Furthermore, the decrease in pHidentified during the CON period was consistent with thelow bacterial diversity during the same period. These find-ings suggest that bacterial composition and diversity inboth the rumen and reticulum were affected mainly bythe acidic conditions and substrates useable for theirgrowth, all of which may influence the fermentative abilityof the rumen and reticulum.
MethodsAnimals and experimental designAll animals were cared for according to protocols ap-proved by Iwate University Laboratory Animal Care andUse Committee (A201401). Four rumen-cannulated Hol-stein bull cattle (192 ± 12 kg; 9.0 ± 1.4 months of age)were used in this study. Following the 7-day high-forageadaptation period, all cattle were fed a high-forage dietfor 7 days (HAY period), and then a high-grain diet for7 days (CON period). A SARA challenge was defined aHAY period followed by a CON period. During the ex-perimental periods, cattle were fed mixed hay (orchardand timothy hay) in the HAY period and a high-graindiet with a forage-to-concentrate ratio of 19:81 (dry mat-ter basis) during the CON period. The diet was supplieddaily in two equal portions at 08:00 and 17:00. All cattlehad free access to water and mineral salt block (E100TZ;ZENOAQ, Koriyama, Fukushima, Japan) throughout thestudy period. Daily total DMI was recorded for individualcattle throughout the experimental period, and all feed of-fered to the cattle was consumed. The amount and contentof a high-forage (control) and a high-grain (SARA-indu-cing) diet were based on our previous study [8]. The chem-ical compositions of the mixed hay and high-grain diet fedto the cattle are shown in Additional file 1: Table S1.
Fig. 5 Principal coordinates analysis (PCoA) plots generated fromthe 454 pyrosequencing data. Pyrosequencing analysis wasperformed using rumen and reticulum fluid samples collected at0800 h on the last days of the HAY and CON periods. PC1 and PC2represent principal components 1 and 2, respectively. The numbersrepresent the individual cattle
Table 4 Copy number of mcrA and 16S rRNA genes identified form qRT-PCR
Items HAY Period CON Period SEM P value
Rumen (n = 4) Reticulum (n = 4) Rumen (n = 4) Reticulum (n = 4) Period (P) Location (L) P x L
Total methanogens 5.78 5.34 4.73 3.97 0.23 0.004 0.018 0.583
Selenomonas ruminantium 7.20 6.65 6.21 6.11 0.24 0.041 0.135 0.481a-a means within a row, same superscripts differ significantly (P < 0.05)
Kim et al. BMC Veterinary Research (2018) 14:310 Page 7 of 10
Sampling, measurements, and diagnosis of SARARuminal and reticular pH were simultaneously measuredevery 10 min using a radio transmission system(YCOW-S; DKK-TOA Yamagata, Yamagata, Japan), asreported previously [22]. The pH sensors were placed inthe ventral sac of the rumen and the reticulum throughthe rumen fistula. Ruminal and reticular pH were con-tinuously measured for 7 days during the HAY period(days 1–7) and consecutively for 7 days during the CONperiod (days 8–14). Using the rumen and reticulum ac-cessible tubes, the fluid samples were collected from therumen and reticulum adjacent to the pH sensor at 8:00,14:00, and 20:00 on the last days of the HAY (day 7) andCON (day 14) periods, respectively.The fluid samples were filtered immediately through
two layers of cheesecloth after sampling. For the VFAanalysis, 1 mL 25% HO3P in 3 N H2SO4 was added to5 mL rumen and reticulum fluid. Total VFA and VFAcomponents (i.e., acetic acid, propionic acid, and butyricacid) were separated and quantified by gas chromatog-raphy (Model 135, Hitachi, Tokyo, Japan) using a packedglass column (Thermon-3000, 3%) on a Shimalite TPA60–80-mesh support (Shinwa Chemical Industries, Ltd.,Kyoto, Japan). For the lactic acid analysis, the fluid sam-ples were centrifuged at 2000×g for 15 min, and concen-tration in the supernatant were determined using acommercially available kit (F-kit; D-lactate/L-lactate, J. K.International Co., Tokyo, Japan). To measure NH3-N con-centration, fluid samples were analyzed using the steamdistillation method with an NH3-N analyzer (Kjeltec AutoSampler System 1035 Analyzer, Tecator, Sweden).
DNA isolationTotal bacterial DNA was extracted as described previ-ously [6]. Briefly, the fluid samples were incubatedwith 750 μg/mL lysozyme (Sigma-Aldrich, St. Louis,MO, USA) at 37 °C for 90 min. Then, 10 μL purifiedachromopeptidase (Wako Pure Chemical Industries,Ltd., Osaka, Japan) was added at a concentration of10,000 U/mL and incubated at 37 °C for 30 min. Thesuspension was treated with 60 μL 1% sodium dode-cyl sulfate and 1 mg/mL proteinase K (Merck Japan,Tokyo, Japan), and incubated at 55 °C for 5 min. Thelysate was treated with phenol/chloroform/isoamyl al-cohol (Wako Pure Chemical Industries, Ltd.) andchloroform (Life Technologies Japan, Ltd., Tokyo,Japan). DNA was precipitated by adding 5 M NaCland 100% ethanol and centrifuged at 21,900×g for15 min. The DNA pellet was rinsed with 70% ethanol,dried, and dissolved in TE buffer. The purified DNAwas quantified using a Biospec-nano (Shimadzu,Kyoto, Japan) and stored at − 80 °C until furtheranalysis.
DNA pyrosequencingThe V1/V2 region of the 16S rRNA gene was amplifiedusing a forward primer (5′-CCATCTCATCCCTGCGTGTCTCCGACTCAGNNNNNNNNNNAGRGTTTGATYMTGGCTCAG-3′) containing 454 primer A, a unique10-bp barcode sequence for each sample (indicated asN), and 27Fmod (5′-AGRGTTTGATYMTGGCTCAG)in which the third base, A, in the original primer 27Fwas changed to R, as well as the reverse primer(5′-CCTATCCCCTGTGTGCCTTGGCAGTCTCAGTGCTGCCTCCCGTAGGAGT-3′) containing 454 primerB and reverse primer 338R (5′-TGCTGCCTCCCGTAGGAGT). Amplified products of ~ 370 bp were con-firmed using agarose gel electrophoresis, purified usingAMPure XP magnetic purification beads (BeckmanCoulter, Inc., Brea, CA, USA), and quantified using theQuant-iT PicoGreen dsDNA Assay Kit (Life Technolo-gies Japan). Mixed samples were prepared by pooling ap-proximately equal amounts of PCR amplicons from eachsample, and then subjected to 454 GS Junior (Roche Ap-plied Science, Indianapolis, IN, USA) sequencing follow-ing the manufacturer’s instructions.
Pyrosequencing data analysisAll pyrosequencing reads were filtered according to theprocedure of Kim et al. [23], who developed an analysispipeline for barcoded 454 pyrosequencing of PCRamplicons in V1/V2, the region amplified by the27Fmod/338R primers. A total of 151,797 filter-passedreads were processed using MOTHUR (ver. 1.35, Uni-versity of Michigan; http://www.mothur.org/wiki/;[24]), and all samples were standardized by randomsubsampling to 4522 sequences per sample using the“sub.sample” command to generate rarefaction curvesand calculate ACE, Chao1 richness estimator, andShannon diversity index, according to the IlluminaMiSeq protocol described previously [25]. Unique se-quences were determined and used to align against theSILVA reference alignment database [26]; chimera wereremoved using chimera.uchime (http://drive5.com/uchime); sequences identified as being of eukaryoticorigin were removed; the candidate sequences werescreened and preclustered to eliminate outliers; and adistance matrix was generated from the resulting se-quences. Sequences were clustered into OTU, with acutoff of 97% similarity. A rarefaction curve was gener-ated at the 97% similarity level, which was calculated bythe distance-based OTU [27]. To calculate the non-parametric species richness estimators Chao 1 and ACEand the Shannon diversity index, the “summary.single”command was used. The unweighted UniFrac distancemethod [28] was used to perform a principal coordi-nates analysis (PCoA) with all OTU.
Kim et al. BMC Veterinary Research (2018) 14:310 Page 8 of 10
Real-time quantitative PCRQuantitative real-time PCR (qRT-PCR) was performed toevaluate the copy number of methyl-coenzyme M reduc-tase α-subunit (mcrA) from total methanogens, and 16SrRNA genes from Fibrobacter succinogenes, Megasphaeraelsdenii, Ruminococcus albus, Ruminococcus flavefaciens,Streptococcus bovis, and Selenomonas ruminantium usingSYBR green (iQ SYBR Green Supermix, Bio-Rad,Hercules, CA, USA) with the MiniOpticon Real-TimePCR system (Bio-Rad). Primer pairs (Additional file 1:Table S2) were selected to detect bacterial species closelyassociated with dietary changes and other bacterial spe-cies. Each sample contained 10 ng DNA, 2× SYBR green,and 0.6 μM each primer in a final volume of 20 μL. Amp-lification conditions were as follows: 95 °C for 3 min;40 cycles of 10 s at 95 °C; 20 s at 63 °C (for total methano-gens), 60 °C (for Fibrobacter succinogenes), 58 °C (forMegasphaera elsdenii), 57 °C (for Streptococcus bovis andSelenomonas ruminantium), or 55 °C (for Ruminococcusalbus and Ruminococcus flavefaciens); and 30 s at 72 °C.The fluorescence signal was collected at the end of eachcycle. To obtain melting curve data, the temperature wasincreased in 0.5 °C increments from 65 to 94 °C. A stand-ard curve for each primer pair was constructed from re-combinant plasmid DNA containing 16S rRNA inserts ofDNA purified from a pure culture of the target species.The strains used for plasmid preparation were as follows:Methanobrevibacter ruminantium JCM13430 (DSM1093),Fibrobacter succinogenes ATCC19169, Megasphaera elsde-nii ATCC25940, Ruminococcus albus ATCC27210, Rumi-nococcus flavefaciens ATCC19208, Streptococcus bovisATCC33317, and Selenomonas ruminantium ATCC12561. Plasmid DNA was quantified and subjected to sevensequential 10-fold dilutions. Data were collected and proc-essed using CFX Manager software ver. 1.5 (Bio-Rad).
Statistical analysesRuminal and reticular pH data and the duration of pH <5.6 were summarized as 24-h means during the HAY andCON periods. The normality of the distribution of vari-ables was tested using Shapiro-Wilk test, and non-normaldata (the proportion of other VFAs, Shannon index, therelative abundances of Butyrivibrio, Eubacterium, unclas-sified Clostridiales, Acetivibrio, unclassified Lachnospira-ceae, Olsenella, unclassified Clostridiaceae, Bacteroides,and the copy numbers of Megasphaera elsdenii, Strepto-coccus bovis, and Ruminococcus flavefacience) wereroot-square transformed before analysis. One-way re-peated measures ANOVA followed by Tukey multiplecomparison method was used to determine the signifi-cance of the difference in 24-h and 1-h means pH, theduration of pH < 5.6, total VFA concentration, the propor-tions of individual VFA, and the concentrations of NH3-Nand lactic acid to compare rumen × reticulum in a same
period and HAY × CON periods in a same location. Therelative abundances of bacteria phyla and genera, bacterialdiversity indices, and bacterial species copy numbers wereanalyzed using two-way repeated-measures ANOVA andTukey’s multiple range tests. The statistical model in-cluded the fixed effects of location (rumen and reticulum),period (HAY and CON periods), and their interactions,plus the random effect of animal. Linear regression ana-lysis of 24-h and 1-h mean ruminal and reticular pHagainst days and hours was performed to determinewhether there are significant changes in pH during the ex-perimental period. All numerical data were analyzed usingPrism ver. 7.01 (GraphPad Software, Inc., La Jolla, CA,USA), and are expressed as means ± standard error ofmean (SEM). Differences were considered significant at P< 0.05, and trends suggesting possible significance weredetermined at 0.05 ≤ P < 0.10.
Additional file
Additional file 1: Table S1. Compositions of the high-forage and high-grain diet on percentage (%) and dry matter bases. Table S2. Primers se-quences used for qRT-PCR. Figure S1. Rarefaction curves calculated fromthe 454 pyrosequencing data at a 97% similarity level in the rumen andreticulum. Cattle were fed a high-forage diet until day 7 (HAY period) anda high-grin diet until day 14 (CON period). Solid and dash dot lines repre-sent the rumen of the HAY and CON periods, respectively. Dash and dotlines represent the reticulum of the HAY and CON periods, respectively.(DOCX 441 kb)
AbbreviationsACE: Abundance-based coverage estimator; ANOVA: Analysis of variance;OTU: Operational taxonomic unit; PC: Principal components; PCoA: Principalcoordinate analysis; qRT-PCR: Quantitative real time polymerase chainreaction; SARA: Subacute ruminal acidosis; SE: Standard error; VFA: Volatilefatty acid
AcknowledgementsThe authors thank Dr. Yasuo Kobayashi, Research Faculty of Agriculture,Hokkaido University, who kindly provided the recombinant DNA for qRT-PCRanalysis.
FundingThis work was supported by the Cabinet Office, Government of Japan, Cross-ministerial Strategic Innovation Promotion Program (SIP), “Technologies forcreating next-generation agriculture, forestry and fisheries.”
Availability of data and materialsThe sequencing data were deposited into the Sequence Read Archive (SRA)of NCBI and can be accessed via accession number SRP093895.
Authors’ contributionsKS, IT, and SS designed the experiment. All authors were responsible foranimal care, pH measurement, VFA analysis, and DATA analysis. KYHperformed DNA isolation, sequence, and statistical analysis. This manuscriptwas prepared by KYH and SS. All authors read and approved the finalmanuscript.
Ethics approvalAll animals were cared for according to protocols approved by IwateUniversity Laboratory Animal Care and Use Committee (A201401).
Consent for publicationNot applicable.
Kim et al. BMC Veterinary Research (2018) 14:310 Page 9 of 10
2. Sato S, Ikeda A, Tsuchiya Y, Ikuta K, Murayama I, Kanehira M, Okada K,Mizuguchi H. Diagnosis of subacute ruminal acidosis (SARA) by continuousreticular pH measurements in cows. Vet Res Commun. 2012a;36:201–5.https://doi.org/10.1007/s11259-012-9528-8.
3. Falk M, Münger A, Dohme-Meier F. Technical note: a comparison of reticularand ruminal pH monitored continuously with 2 measurement systems atdifferent weeks of early lactation. J Dairy Sci. 2016;99:1951–5. https://doi.org/10.3168/jds.2015-9725.
4. Zened A, Combes S, Cauquil L, Mariette J, Klopp C, Bouchez O, Troegeler-Meynadier A, Enjalbert F. Microbial ecology of the rumen evaluated by 454GS FLX pyrosequencing is affected by starch and oil supplementation ofdiets. FEMS Microbiol Ecol. 2013;83:504–14. https://doi.org/10.1111/1574-6941.12011.
5. Sato S. Pathophysiological evaluation of subacute ruminal acidosis (SARA)by continuous ruminal pH monitoring. Anim Sci J. 2016;87:168–77. https://doi.org/10.1111/asj.12415.
6. Kim Y-H, Nagata R, Ohtani N, Ichijo T, Ikuta K, Sato S. Effects of dietaryforage and calf starter diet on ruminal pH and bacteria in Holstein calvesduring weaning transition. Front Microbiol. 2016;7:1575. https://doi.org/10.3389/fmicb.2016.01575.
7. Liu JH, Bian GR, Zhu WY, Mao SY. High-grain feeding causes strong shifts inruminal epithelial bacterial community and expression of toll-like receptorgenes in goats. Front Microbiol. 2015;6:167. https://doi.org/10.3389/fmicb.2015.00167.
8. Kimura A, Sato S, Kato T, Ikuta K, Yamagishi N, Okada K, Mizuguchi H, Ito K.Relationship between pH and temperature in the ruminal fluid of cows,based on a radio-transmission pH-measurement system. J Vet Med Sci.2012;74:1023–8. https://doi.org/10.1292/jvms.12-0084.
9. Mao SY, Zhang RY, Wang DS, Zhu WY. Impact of subacute ruminal acidosis(SARA) adaptation on rumen microbiota in dairy cattle usingpyrosequencing. Anaerobe. 2013;24:12–9. https://doi.org/10.1016/j.anaerobe.2013.08.003.
10. Allen MS. Relationship between fermentation acid production in the rumenand the requirement for physically effective fiber. J Dairy Sci. 1997;80:1447–62. https://doi.org/10.3168/jds.S0022-0302(97)76074-0.
11. Khafipour E, Li S, Plaizier JC, Krause DO. Rumen microbiome compositiondetermined using two nutritional models of subacute ruminal acidosis. ApplEnviron Microbiol. 2009;75:7115–24. https://doi.org/10.1128/AEM.00739-09.
12. Stevenson DM, Weimer PJ. Dominance of Prevotella and low abundance ofclassical ruminal bacterial species in the bovine rumen revealed by relativequantification real-time PCR. Appl Microbiol Biotechnol. 2007;75:165–74.https://doi.org/10.1007/s00253-006-0802-y.
13. Bekele AZ, Koike S, Kobayashi Y. Genetic diversity and diet specificity ofruminal Prevotella revealed by 16S rRNA gene-based analysis. FEMSMicrobiol Lett. 2010;305:49–57. https://doi.org/10.1111/j.1574-6968.2010.01911.x.
14. Klieve AV, O’Leary MN, McMillen L, Ouwerkerk D. Ruminococcus bromii,identification and isolation as a dominant community member in therumen of cattle fed a barley diet. J Appl Microbiol. 2007;103:2065–73.https://doi.org/10.1111/j.1365-2672.2007.03492.x.
15. Pitta DW, Pinchak WE, Dowd S, Dorton K, Yoon I, Min BR, Fulford JD,Wickersham TA, Malinowski DP. Longitudinal shifts in bacterial diversity andfermentation pattern in the rumen of steers grazing wheat pasture.Anaerobe. 2014;30:11–7. https://doi.org/10.1016/j.anaerobe.2014.07.008.
16. Taguchi H, Koike S, Kobayashi Y, Cann IK, Karita S. Partial characterization ofstructure and function of a xylanase gene from the rumen hemicellulolyticbacterium Eubacterium ruminantium. Anim Sci J. 2004;75:325–32. https://doi.org/10.1111/j.1740-0929.2004.00193.x.
17. Tajima K, Aminov RI, Nagamine T, Matsui H, Nakamura M, Benno Y. Diet-dependent shifts in the bacterial population of the rumen revealed withreal-time PCR. Appl Environ Microbiol. 2001;67:2766–74. https://doi.org/10.1128/AEM.67.6.2766-2774.2001.
18. Huhtanen P, Kukkonen U. Comparison of methods, markers, sampling sitesand models for estimating digesta passage kinetics in cattle fed at twolevels of intake. Anim Feed Sci Technol. 1995;52:141–58. https://doi.org/10.1016/0377-8401(94)00699-A.
19. Hindrichsen IK, Wettstein HR, Machmüller A, Kreuzer M. Methane emission,nutrient degradation and nitrogen turnover in dairy cows and their slurry atdifferent milk production scenarios with and without concentratesupplementation. Agric Ecosys Environ. 2006;113:150–61. https://doi.org/10.1016/j.agee.2005.09.004.
20. Koike S, Kobayashi Y. Development and use of competitive PCR assays forthe rumen cellulolytic bacteria: Fibrobacter succinogenes, Ruminococcusalbus, and Ruminococcus flavefaciens. FEMS Microbiol Lett. 2001;204:361–6.https://doi.org/10.1111/j.1574-6968.2001.tb10911.x.
21. Huber TL. Physiological effects of acidosis on feedlot cattle. J Anim Sci.1976;43:902–9.
22. Sato S, Kimura A, Anan T, Yamagishi N, Okada K, Mizuguchi H, Ito K. A radiotransmission pH measurement system for continuous evaluation of fluid pHin the rumen of cows. Vet Res Commun. 2012b;36:85–9. https://doi.org/10.1007/s11259-012-9518-x.
23. Kim SW, Suda W, Kim S, Oshima K, Fukuda S, Ohno H, Morita H, Hattori M.Robustness of gut microbiota of healthy adults in response to probioticintervention revealed by high-throughput pyrosequencing. DNA Res. 2013;20:241–53. https://doi.org/10.1093/dnares/dst006.
24. Schloss PD, Westcott SL, Ryabin T, Hall JR, Hartmann M, Hollister EB,Lesniewski RA, Oakley BB, Parks DH, Robinson CJ, Sahl JW, Stres B, ThallingerGG, Van Horn DJ, Weber CF. Introducing mothur: open-source, platform-independent, community-supported software for describing and comparingmicrobial communities. Appl Environ Microbiol. 2009;75:7537–41. https://doi.org/10.1128/AEM.01541-09.
25. Kozich JJ, Westcott SL, Baxter NT, Highlander SK, Schloss PD. Developmentof a dual-index sequencing strategy and curation pipeline for analyzingamplicon sequence data on the MiSeq Illumina sequencing platform. ApplEnviron Microbiol. 2013;79:5112–20. https://doi.org/10.1128/AEM.01043-13.
26. Pruesse E, Quast C, Knittel K, Fuchs BM, Ludwig W, Peplies J, Glöckner FO.SILVA: a comprehensive online resource for quality checked and alignedribosomal RNA sequence data compatible with ARB. Nucl Acids Res. 2007;35:7188–96. https://doi.org/10.1093/nar/gkm864.
27. Schloss PD, Gevers D, Westcott SL. Reducing the effects of PCRamplification and sequencing artifacts on 16S rRNA-based studies. PLoSOne. 2011;6:e27310. https://doi.org/10.1371/journal.pone.0027310.
28. Lozupone C, Knight R. UniFrac: a new phylogenetic method for comparingmicrobial communities. Appl Environ Microbiol. 2005;71:8228–35. https://doi.org/10.1128/AEM.71.12.8228-8235.2005.
Kim et al. BMC Veterinary Research (2018) 14:310 Page 10 of 10