Changes of bedload characteristics along the Marsyandi River (central Nepal): Implications for understanding hillslope
sediment supply, sediment load evolution along fluvial networks, and denudation in active orogenic belts
Mikaël Attal†
Jérôme LavéLaboratoire de Géodynamique des Chaînes Alpines, Université Joseph Fourier, Grenoble, France
ABSTRACT
Understanding and quantifying fluvial transport and bedrock abrasion process-es have become major concerns in modeling landform response to tectonic and cli-matic forcing. Recent theoretical and experimental investigations have in particular stressed the importance of sediment supply and size in controlling bedrock incision rate. Many studies on the downstream evolution of pebble size have focused on unrav-eling the respective roles of selective sorting and abrasion, without paying much atten-tion to sediment sources. In order to track sediment supply and characteristics from source to sink in an active tectonic setting, where long-term selective deposition can be excluded, we systematically measured sediment size and lithology on gravel bars along the Marsyandi River and its tributaries (Himalayas of central Nepal), and also in sediment source material from hillslopes (landslides, moraines, terrace deposits). The downstream evolution in lithological distribution is found to be in close agree-ment with common views on pebble abrasion and present views on denudation in the range: (1) pebbles from the more rapidly uplifted and eroded Higher Himalayan gneissic units are over-represented, due to their major contribution to sediment influx, (2) easily erodible lithologies such as schists, sandstones, and limestone are under-rep-resented relative to resistant rock types like quartzite. More surprisingly, we observe a general downstream coarsening of gravel bar material along the middle and lower Marsyandi River, whereas downstream sediment fining is typical of most river sys-tems. A simple integrative model that tracks pebbles from hillslope to the main stem of the river and includes abrasion coefficients for the different Himalayan lithologies and size distribution of hillslopes sediment supplies accounts for both changing litho-logic proportion along the Marsyandi and for the downstream coarsening of gravel bar material. This coarsening mainly results from differences in sediment sources along the Marsyandi Valley, in particular from differences in size distributions of landslide and moraine material. However, the median pebble size of subsurface mate-rial in gravel bars is coarser than median size of the blocky material in the source. The choice of the measurement methods and their potential bias are discussed but cannot explain this surprising feature displayed by our measurements. We suspect
that due to sediment transport modalities in active tectonic settings, the subpave-ment grain-size distribution on gravel bars is not representative of the average bed-load size distribution. Consequently, pebble abrasion is more easily demonstrated by description of pebble lithology than by the downstream evolution of pebble size. Our study also shows, in contrast with previous studies, that experimentally derived abra-sion coefficients can account for the downstream evolution of pebbles without calling for additional fining processes. We conclude that the eroded lithology and hillslope sediment source exert a major influence on the downstream evolution of sediment characteristics, on bedload ratio, and probably on bedrock erosion efficiency. These conclusions have important implications in terms of river profile evolution, landscape denudation, internal erosion coupling, and the response of the fluvial network to gla-cial-interglacial fluctuations.
Keywords: sediment, erosion, transport, fluvial network, active orogen, Himalayas.
1. INTRODUCTION
Recent studies on coupling between tectonic, climate, and erosion (e.g., Koons, 1989; Molnar and England, 1990; Beaumont et al., 1992; Avouac and Burov, 1996; Willett, 1999) have empha-sized the key role of the erosional processes and their efficiency in shaping and uplifting mountain ranges. More particularly, the fluvial network has been recognized as having a major control on landscape denudation by setting the local base level of the hillslopes (e.g., Burbank et al., 1996; Whipple et al., 1999). Such observations have spurred many studies on the way rivers incise bedrock. Several heuristic models have been proposed, which can be grouped into three types: the detachment-limited model, which proposes a determinant incising efficiency linked to the stream power (Howard and Kerby, 1983), the transport-limited model (Willgoose et al., 1991), and the mixed-tools model (Sklar and Dietrich, 1998, 2004). The last two models strongly depend on upstream sediment supply and on sediment size. In particular, sediments introduce nonlinear behavior that can strongly affect the transitory regime (Whipple and Tucker, 2002) as well as the late-stage orogen evolution (Baldwin et al., 2003). In high moun-tain streams or in rivers draining through steep canyons, removal of static boulders on the meter scale or larger can also introduce an additional nonlinear component to river incision processes (Howard et al., 1994) and an eventual feedback between hillslope erosion and fluvial downcutting. However, few recent studies have focused on the evolution of boulders, blocks, and sediments from the hillslopes toward the mountain range outlet, even though pebble fining and abrasion have been pointed out as potential key processes (Howard, 1998; Whipple and Tucker, 2002). In the flu-vial geomorphology community, there has been a long-standing debate over the causes of downstream sediment fining in rivers (e.g., Bradley, 1970; Goede, 1975; Knighton, 1982; Brierley and Hickin, 1985; Brewer and Lewin, 1993; Kodama, 1994a; Heller et al., 2001; Surian, 2002). In part this is because two kinds of processes may be acting at the same time: fining by selective transport and fining by pebble abrasion. Observed apparent fin-ing rates in natural rivers were generally found to be much higher
than experimental abrasion rates (Kuenen, 1956; Bradley, 1970; Shaw and Kellerhals, 1982; Kukal, 1990; Brewer and Lewin, 1993). Several hypotheses have been proposed to explain this discrepancy: a predominant role of selective transport (Brierley and Hickin, 1985; Paola et al., 1992; Brewer and Lewin, 1993; Surian, 2002), the role of chemical weathering (Bradley, 1970; Jones and Humphrey, 1997) or an underestimation of experimen-tal abrasion rates, most of the experimental devices reproducing too-slow hydrodynamic regimes (Kodama, 1994b).
In an attempt to unravel the interplay between abrasion and other causes of pebble fining, and more generally to identify the role of sediments in fluvial transport and incision in active oro-gens, we must focus on a setting where only one of these pro-cesses is acting. This paper, therefore addresses the case in which abrasion is assumed to be the dominant process acting during fluvial transport. To this aim, it is important to choose a river system that presents neither short- nor long-term depositional sections: in such a setting, both selective sorting and pebble sur-face weathering during deposition can be expected to be mini-mal. Such behavior can be observed along rivers draining across actively uplifting and eroding mountain ranges. However, most of the world mountain ranges are relatively narrow and river length between its source and outlet in a depositional area (fore-land basin or intermountainous basins) rarely exceeds more than 30–50 km, except for rivers draining large ranges like the Hima-layas or the eastern Andes.
In this study, we focused our attention on the downstream evolution of sediment characteristics along a central Nepal Hima-layan river, the Marsyandi River. The choice of this 200-km-long river system was dictated both by the necessity to study a suf-ficiently long river system to observe a significant evolution, as well as by the existence of numerous constraints on both litholo-gies (Colchen et al., 1986), erosion rates, and thus sediment sup-ply rates from hillslopes (Lavé and Avouac, 2001; Burbank et al., 2003; Pratt-Sitaula et al., 2004). In addition, a previous study on gravel bar material along the Kali Gandaki, a nearby river system, has already indicated important downstream variations in pebble lithologies (Mezaki and Yabiku, 1984). In contrast with previous
Changes of bedload characteristics along the Marsyandi River 145
studies on pebble evolution and particle abrasion rates, we paid particular attention to the sediment evolution from the hillslopes down to the depositional plain at the outlet of the range, charac-terizing the size distribution of the hillslope sediment sources that feed the fluvial network. Field measurements were conducted in the autumns of 2000 and 2001.
After some brief theoretical considerations on pebble size evolution along a river incising into an actively eroded landscape, we first review the geological and geomorphological setting of the Marsyandi watershed. We then present the methodology used to characterize the sediment sources, i.e., landslides, moraines, terrace deposits, and tributaries, and to measure the size distribu-tion and lithologic composition of gravel bar material along the main stem of the Marsyandi River and its tributaries. Measure-ments, results, and geomorphic implications are discussed first qualitatively and second in the light of a simple integrative model that takes into account abrasion rates determined for Himalayan lithologies in an experimental device (Attal and Lavé, 2003; Attal, 2003).
2. GENERAL CONSIDERATIONS ON DOWNSTREAM PEBBLE SIZE EVOLUTION IN A UNIFORMLY ERODED LANDSCAPE
In several studies (Kuenen, 1956; Bradley, 1970; Brewer and Lewin, 1993; Kodama, 1994a), downstream fining rate, expressed in % per km, is directly compared to abrasion rates obtained from experimental studies. According to the authors, this comparison allows evaluation of the respective efficiency of sorting and abrasion processes. However, this approach is valid only when there is a unique sediment point source in the head-water, i.e., if sediment supply from tributaries and hillslopes fur-ther downstream can be neglected. For rivers draining through an actively eroded region, this comparison is invalid. We will demonstrate this for a simplified linear drainage geometry, i.e., defined by the relation A = wL/s, where A is the drainage area, w is the average width of the watershed between the two lateral interfluves, and s and L are the respective average sinuosity and length of the river. This relation is simply a particular case of the more general Hack’s law, with an exponent of 1. Each block or rock fragment, after being delivered from the hillslopes to the river network, will be submitted to breaking, crushing, and abra-sion that tend to round the fragment and decrease its diameter. We assume that pebbles are mostly reduced in size by abrasion after a few kilometers (Krumbein, 1941; Kuenen, 1956; Pearce, 1971) and that pebbles are abraded following the commonly used Sternberg’s law (1875):
dVV
kdL= − or dDD
kdL= −
3, (1)
where k is the pebble abrasion coefficient, and D and V are the pebble diameter and volume, respectively. We also assume that the products of abrasion are mostly fine materials that then transit as suspended load (Kuenen, 1956). If we now consider a uniform
erosion rate ε and uniform sediment supply from the hillslopes and lateral tributaries with a unique fragment size D
0, we can
write for any point along the main river stem:
* for the total sediment flux:
Q L w Lss
( ) = ε , (2)
* for the bedload sediment flux:
Q Lws
e dxw
ske
b
L kxkL( ) ( )= = −∫
−−ε ε
01 , (3)
* for the mean pebble size:
D L De dx
e dxD
ekxL
ksL
kL
( ) = =−
∫∫ −0
3
0
0
0
43
34
1
11−( )−e kL . (4)
At great distances from the river source, or for high values of the erodibility k, an asymptotic behavior is rapidly reached both for the bedload flux and the mean grain size. Moreover, the asymptotic value for the mean pebble size D = 3/4D
0 is indepen-
dent of the erodibility coefficient (Fig. 1A).Asymptotic behavior arises after a distance of the order of
3/2k from the balance between the quantity lost by abrasion and the continuous supply of fresh material from hillslopes. It can be demonstrated that this phenomenon is also observed with a more realistic model, i.e., with a more complex watershed geometry and a complete grain size distribution for the sediment sources, or even with hillslopes delivering several lithologies with differ-ent erodibilities: the asymptotic values for the mean grain size are slightly different but still independent of k. A recent study along a U.S. river that drains a homogeneous lithology in the Olympic Mountains indeed shows such seemingly asymptotic
Figure 1. Downstream evolution of fluvial sediment size produced by pebble abrasion following Sternberg’s law in a uniformly eroded linear watershed (equations 3 and 4): (a) fining ratio and (b) bedload propor-tion for different abrasion coefficients k.
0
0.25
0.5
0.75
1
0 50 100 150 200 250 300 350 400 450 500
Distance (km)
k = 0.2% km-1
k = 2% km-1
k = 20% km-1
Fini
ng ra
tio (D
/D0)
A
0
0.2
0.4
0.6
0.8
1
1 10 100 1000Bed
load
pro
porti
on (Q
b/Q
s)
Distance (km)
B
146 M. Attal and J. Lavé
behavior (Heller et al., 2001). For rivers draining a uniformly eroded region, the apparent downstream fining rate of bedload is close to 0, even if the abrasion rate of the eroded lithology is very high. Therefore, the downstream size evolution cannot be translated directly in terms of equivalent abrasion rates, except for the upper reaches, where the river length is lower than the critical length 3/2k (in the above example
dDdL
kD=
6 0).
However, in this case, downstream fining can be difficult to demonstrate given the usually large uncertainties in field mea-surement and the moderate change between upstream and down-stream values.
To unravel the role and amplitude of abrasion, it is therefore more pertinent to track the ratio of bedload to total load (Fig. 1B) rather than the downstream evolution of the mean pebble size. However, bedload flux measurements are usually very difficult to monitor for large rivers, in particular for the long periods of time that are necessary to estimate the average flux. Alternatively, it is possible to study a river crossing contrasting lithologies and track the dilution rate of the upstream lithologies in the down-stream ones. In light of the simplified model presented above, the downstream evolution of the relative proportions of the different lithologies is expected to be sensitive both to their relative abra-sion coefficients but also to the absolute values of these coef-ficients. The Marsyandi , the setting of which is detailed below, displays such characteristics.
▲ ▲ ▲ ▲ ▲ ▲ ▲ ▲ ▲ ▲ ▲
▲ ▲ ▲ ▲ ▲ ▲
▲ ▲ ▲ ▲ ▲
▲
▲
▲ ▲ ▲ ▲ ▲ ▲ ▲ ▲ ▲ ▲ ▲
▲ ▲ ▲ ▲ ▲ ▲ ▲ ▲ ▲ ▲ ▲
0 0 0 0 0 0
▲ ▲
▲
▲
▲
▲
▲
▲
▲
▲ ▲ ▲ ▲
▲ ▲
▲ ▲ ▲
▲
▲ ▲ ▲ ▲ ▲
▲
▲ 0 ▲ ▲ ▲
▲ 0 ▲ ▲ ▲
I
I
I
I
I I
I
28°N
MFT
MBT
MDT
Marsyandi
Marsyandi
28°N
MCTMCT
STDSTD
TSSTSS
HHCHHC
LHLH
200 800 1500 3000 5000 7000
Hypsometry (m)
Narayani
X.
M.A.
D.
Summits > 8000 m
Rivers
UTM45_WGS84
Downvalley extent of areashaped prominently by glacial erosion
Sub-Himalaya
Gangetic plain
INDIA
NarayangadhNarayangadh KathmanduKathmandu
MahabarathMahabarath
TrisuliTrisuli
Buri Gandaki
Buri Gandaki
Kali GandakiKali Gandaki
PokharaPokhara
Thak
khola
gra
ben
Thak
khola
gra
ben
South TibetSouth Tibet
Gyi
rong
gra
ben
Gyi
rong
gra
ben
CHINACHINA N
S
W E
Marsyandi catchment border
NEPALNEPAL
SetiSeti
84°E84°E
Figure 2. Topographic map of the Narayani basin modified from Lavé and Avouac (2001). Thick dashed line follows the catchment boundary of the Marsyandi River, for which the bedload evolution is characterized in this study. The down-valley extent (white arcuate segments) of areas shaped prominently by glacial erosion (Duncan et al., 1998) defines the beginning of dominant valley shaping by fluvial incision, i.e., domains where bedrock landslides supply most of the coarse river sediments. The major faults are the South Tibetan Detachment (STD), the Main Central thrust (MCT), the Main Boundary thrust (MBT), the Main Dun thrust (MDT), and the Main Frontal thrust (MFT). From west to east, >8000-m-high summits are labeled: D—Dhaulagiri, A—Annapurna, M—Manaslu. Domains are TTS—Tethyan Sedimentary Series, LH—Lesser Hima-laya, and HHC—Higher Himalayan Crystalline.
Changes of bedload characteristics along the Marsyandi River 147
3. LOCATION AND GEODYNAMIC SETTING OF THE MARSYANDI WATERSHED
The Marsyandi River drains across the Himalayan range in central Nepal. Its source is located north of the Annapurnas (Fig. 2). On its upper reaches, it drains to the southeast to skirt round the Annapurnas ridge. It then drains to the south and reaches the Trisuli River after a course of ~170 km. From east to west, the Trisuli, Buri Gandaki, Marsyandi, Seti, and Kali Gandaki join to form the Narayani River system, which drains to the Terai plain. They form one of the most important hydrographic network of the Himalayan range, west of the Kathmandu basin.
The Marsyandi watershed is superimposed on three main structural units (Fig. 2): the Tethyan Sedimentary Series, the Higher Himalayan Crystalline, and the Lesser Himalayan units. These structural units roughly coincide with the main geographic domains across the Himalayas of Nepal (Fig. 2). The Tethyan Sedimentary Series extends through the south Tibetan Plateau and the northern flanks of the Higher Himalayan summits. It consists of a thick stack of Paleozoic and Mesozoic sediments that are slightly metamorphosed and intruded by an early Mio-cene granitic body, the Manaslu Granite (e.g., Le Fort, 1986; Searle, 1999; Fig. 3). In these units, the dominant lithologies are limestone and schist, but fine sandstone and quartzite levels are frequent (Colchen et al., 1986). The core and southern flank of the Higher Himalayan topography correspond to the crystalline units of the Higher Himalayan Crystalline, which consists mainly of medium- to high-grade aluminous (Formation I) and calcic (Formation II) paragneisses and orthogneisses (Formation III; Fig. 3). To the south, the topography drops abruptly from eleva-tions greater than 6000 m in the Higher Himalaya to around 1000 m in the Lesser Himalaya. The rocks in the Lesser Himalayan units consist of low-grade metasediments (sandstones, phyl-lites, schists, quartzites of Pre-Cambrian age = mostly Kuncha Formation; Fig. 3) forming a large antiformal duplex structure. Just below the Main Central thrust, the northern part of the anti-cline is overlain by schists, micaschists, quartzite, and limestones metamorphosed in garnet to kyanite facies (e.g., Pêcher, 1989; Colchen et al., 1986; Schelling 1992). The southern part of the anticline, where metamorphism has been less intense, is overlain by the Mahabarat range, mostly in the eastern part of the Naray-ani watershed. The Mahabarat units are composed of schists and Cambrian to Eocene Tethyan sediments intruded by Late Cambrian to Ordovician granites. All these Himalayan units and sheets are overriding the Indo-Gangetic plain and have gener-ated thin-skinned tectonic deformation, giving rise to the Siwalik Hills, which form the most frontal Himalayan relief. The Siwalik or sub-Himalayan rocks are composed of easily erodible Neo-gene sandstones, siltstones, and conglomerates.
The boundaries between the different domains roughly coin-cide with major faults. These are from north to south: the South Tibetan Detachment, a gently dipping normal fault underlying the Tethyan Sedimentary Series (Burchfiel et al., 1992), the Main Central thrust, a ductile shear zone that separates the Lesser Hima-
layan units from the Higher Himalayan Crystalline (e.g., Le Fort, 1986), the Main Boundary thrust, which marks the limit between the sub-Himalaya and the Lesser Himalaya, and the Main Dun thrust and the Main Frontal thrust, which correspond to inner and southern thrusts associated with the sub-Himalayan folds.
Currently, the most active tectonic feature appears to be the Main Frontal thrust, which absorbs most of the convergence (~21 ± 1.5 mm/yr) between India and south Tibet, (Lavé and Avouac, 2000). However, important vertical movements also affect the Higher Himalaya, around 100 km north of the Main Frontal thrust. This phenomenon has been inferred to be the consequence of the ramp-flat geometry of the main detachment at depth, the Main Himalayan thrust, on which the main faults of the range connect (Lavé and Avouac, 2001). In the central Himalaya, uplift rates, inferred from fluvial incision rates, display strong variations across the range: they peak at 6–15mm/yr in the frontal Siwa-liks, drop to 0–2 mm/yr above the Main Dun thrust (Lavé and Avouac, 2000, 2001), and to 1–2.5 mm/yr across the Mahabarat, then decrease to around <0–1 mm/yr in the Lesser Himalaya, and finally rise again to values ranging between 2 and 5 mm/yr across the Higher Himalayan Crystalline (Lavé and Avouac, 2001; Burbank et al., 2003; Pratt-Sitaula et al., 2004). The south Tibetan region is characterized by a general extensional regime (Armijo et al., 1986) and probably by very low vertical motions. The hydrologic network of the Marsyandi drains across con-trasted uplifting and eroding areas, and sediment supply rates from the hillslopes are therefore suspected to vary strongly along Marsyandi course.
In response to the intense tectonic activity and sharp topographic gradients, the Marsyandi region is being actively eroded, and the erosion products are exported through the Marsyandi fluvial network toward the Indo-Gangetic plain and the Bengal Fan.
4. FIELD MEASUREMENTS IN MARSYANDI VALLEY
4.1. Sampling Sites and Geomorphic Objects
To address the issue of the sediment mass transfer in the Marsyandi watershed, we focused on two distinct geomorphic objects: the sources of coarse sediments delivered to the hydro-graphic network (~20 measurement sites) and the transported bedload exposed on gravel bars along the Marsyandi River and its tributaries (~40 measurement sites; Fig. 3).
Three types of sediment sources were considered, which deliver most of the coarse material producing bedload. First, we surveyed landslide deposits in the Marsyandi Valley and its surroundings. These probably represent the main process of hillslope erosion and the main source of sediment in this kind of active orogenic setting (Burbank et al., 1996; Hovius et al., 1997). Choosing a representative site was the most difficult task of the counting procedure because of the heterogeneity of land-slide deposits (Figs. 4B and 4C). We observed that the material usually becomes coarser downhill, probably because large blocks
II
I
I
I
IIIIII
II
I
III
II
III
II
I
II
II
I
I
I
II
II
II
III
II
III
III
II
III
I
II
II
II
I
II
I
IIIIIIIIIIIIII
IIIII
II
0 ▲ ▲ ▲ ▲
0 ▲
0 ▲ ▲ ▲ ▲ ▲
▲ 0
STD
MCTMCT
0 10 20 km3
Annapurna II
Annapurna IV7524
3
7937
MuglinMuglin
TurtureTurture
SyangeSyange
TalTal
PisangPisang
ManangManang
7937
NarayangadhNarayangadh
ChameChame
MDT
MBTMBTSiwaliks
MEASUREMENT SITES
Marsyandi gravel bar
Tributary gravel bar
Terrace deposits
Moraine
Landslide
Marsyandi catchment border
Besi SaharBesi Sahar
Manaslu8125
Manaslu8125
Annapurna IV7524
Annapurna IV7524
Annapurna IIAnnapurna II
Quaternary deposits:
TETHYAN SERIES
Limestones, Liassic
Quartzites, Rhetian
Limestones and schists, Scythian - Norian
Limestones, schists and quartzites,Silurian to Permian
Glacier
Limestones and schists, Cambrian - Ordovician
Manaslu Granite
Limestones and quartzites, Cambrian(Annapurnas yellow formation)
HIGH HIMALAYAN CRYSTALLINE
Orthogneiss, F.III
Calcic gneiss and marbles, F.II
Aluminous gneiss with kyaniteand/or sillimanite, F.I
LESSER HIMALAYAN UNITS
Schists, limestones, dolomites and quartzitesSchists, sandstones and quartzitesKuncha Formation
Seti RiverSeti
Dara
ndi
Daro
ndi
Chudi
Chudi
ChepeaChepe
PaudiPaudi
Nyadi
Nyadi
Dudh
Dudh
Naur Naur
Kali
Kali Gandaki
Gandaki
DordiDordi
MarsyandiMarsyandi
Marsyandi
Marsyandi
TrisuliTrisuli
HumreDhumre
Dharapani
Dharapani
HumdeHumde
BhratangBhratang
Khu
diK
hudi
AmboteAmbote
Undifferentiated glacial, fluvio-glacial and terrace deposits
40 ka / and 5 ka terrace deposits in LH
KhudiKhudi
N
S
W E
Figure 3. Geological map of the Marsyandi catchment, modified from Colchen et al. (1986). The different geomorphic objects surveyed in this study are also reported on the map: gravel bars along the Marsyandi River and its tributaries, moraines, landslides, and terrace deposits. The major faults are the South Tibetan Detachment (STD), the Main Central thrust (MCT), the Main Boundary thrust (MBT), and the Main Dun thrust (MDT). LH—Lesser Himalaya.
Changes of bedload characteristics along the Marsyandi River 149
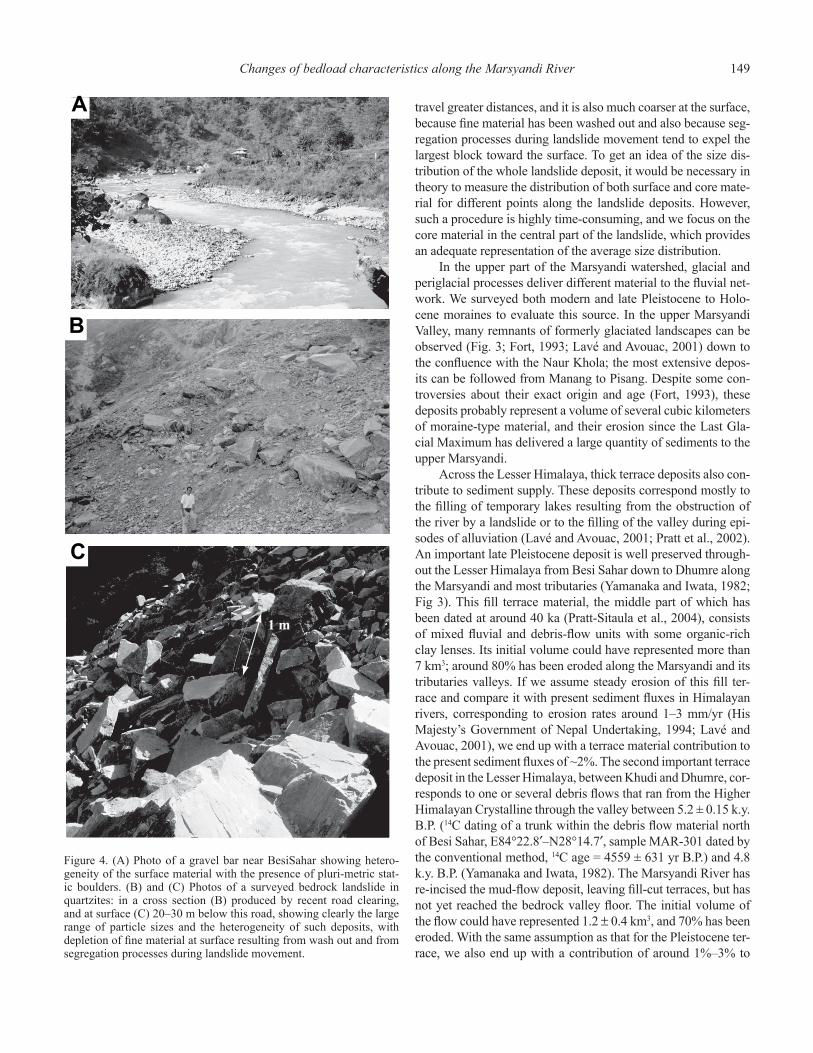
travel greater distances, and it is also much coarser at the surface, because fine material has been washed out and also because seg-regation processes during landslide movement tend to expel the largest block toward the surface. To get an idea of the size dis-tribution of the whole landslide deposit, it would be necessary in theory to measure the distribution of both surface and core mate-rial for different points along the landslide deposits. However, such a procedure is highly time-consuming, and we focus on the core material in the central part of the landslide, which provides an adequate representation of the average size distribution.
In the upper part of the Marsyandi watershed, glacial and periglacial processes deliver different material to the fluvial net-work. We surveyed both modern and late Pleistocene to Holo-cene moraines to evaluate this source. In the upper Marsyandi Valley, many remnants of formerly glaciated landscapes can be observed (Fig. 3; Fort, 1993; Lavé and Avouac, 2001) down to the confluence with the Naur Khola; the most extensive depos-its can be followed from Manang to Pisang. Despite some con-troversies about their exact origin and age (Fort, 1993), these deposits probably represent a volume of several cubic kilometers of moraine-type material, and their erosion since the Last Gla-cial Maximum has delivered a large quantity of sediments to the upper Marsyandi.
Across the Lesser Himalaya, thick terrace deposits also con-tribute to sediment supply. These deposits correspond mostly to the filling of temporary lakes resulting from the obstruction of the river by a landslide or to the filling of the valley during epi-sodes of alluviation (Lavé and Avouac, 2001; Pratt et al., 2002). An important late Pleistocene deposit is well preserved through-out the Lesser Himalaya from Besi Sahar down to Dhumre along the Marsyandi and most tributaries (Yamanaka and Iwata, 1982; Fig 3). This fill terrace material, the middle part of which has been dated at around 40 ka (Pratt-Sitaula et al., 2004), consists of mixed fluvial and debris-flow units with some organic-rich clay lenses. Its initial volume could have represented more than 7 km3; around 80% has been eroded along the Marsyandi and its tributaries valleys. If we assume steady erosion of this fill ter-race and compare it with present sediment fluxes in Himalayan rivers, corresponding to erosion rates around 1–3 mm/yr (His Majesty’s Government of Nepal Undertaking, 1994; Lavé and Avouac, 2001), we end up with a terrace material contribution to the present sediment fluxes of ~2%. The second important terrace deposit in the Lesser Himalaya, between Khudi and Dhumre, cor-responds to one or several debris flows that ran from the Higher Himalayan Crystalline through the valley between 5.2 ± 0.15 k.y. B.P. (14C dating of a trunk within the debris flow material north of Besi Sahar, E84°22.8′–N28°14.7′, sample MAR-301 dated by the conventional method, 14C age = 4559 ± 631 yr B.P.) and 4.8 k.y. B.P. (Yamanaka and Iwata, 1982). The Marsyandi River has re-incised the mud-flow deposit, leaving fill-cut terraces, but has not yet reached the bedrock valley floor. The initial volume of the flow could have represented 1.2 ± 0.4 km3, and 70% has been eroded. With the same assumption as that for the Pleistocene ter-race, we also end up with a contribution of around 1%–3% to
1 m
A
B
C
Figure 4. (A) Photo of a gravel bar near BesiSahar showing hetero-geneity of the surface material with the presence of pluri-metric stat-ic boulders. (B) and (C) Photos of a surveyed bedrock landslide in quartzites: in a cross section (B) produced by recent road clearing, and at surface (C) 20–30 m below this road, showing clearly the large range of particle sizes and the heterogeneity of such deposits, with depletion of fine material at surface resulting from wash out and from segregation processes during landslide movement.
150 M. Attal and J. Lavé
the present sediment fluxes. We therefore suspect that reworking of terrace deposits represents only a minor source of sediment into the Marsyandi. These two examples highlight the fact that temporary sediment storage in terraces and gravel bars and sub-sequent reworking do not significantly affect the long-term sedi-ment flux. Downstream fining by selective transport can there-fore hardly be effective in an actively eroded mountain range.
Along the Marsyandi and its tributaries, numerous gravel bars can be observed. With the exception of the narrow reaches across the Higher Himalaya, where they can be rare or poorly developed, the gravel bars are usually more than 100 m long and 20 m wide. As for most gravel rivers worldwide, gravel bar mate-rial presents clear surface coarsening. We therefore conducted measurements both on surface and subsurface gravels. When measuring subsurface gravels, the surface layer was removed to the thickness of the largest boulders before volumetric sam-pling. Gravel bars can also display large pebble size variations between their extremities (Fig. 4A). In order to keep consistency between sampling sites, we surveyed (wherever possible) a sim-ilar hydrodynamic setting, and we chose the central part of the gravel bars. Two or three sampling points were generally chosen on a line parallel to the river and at least ten meters distant to define the variability of the sediment characteristics across the central part of the bar. Following Parker and Klingeman (1982), we assumed that the material composing the gravel bars is repre-sentative of the bedload transported by the river during flooding stages. This issue will, however, be discussed more at length in the final sections.
4.2 Counting and Sampling Procedures
Counting and sampling procedures are inspired from pre-vious studies (see review and analysis by Kellerhals and Bray, 1971). We distinguished surface measurements, i.e., counting on lines or grid nodes, and volume measurements by weighing of a volumetric sample. Distributions obtained from these methods have been shown to be directly reliable (Kellerhals and Bray, 1971; Church et al., 1987; Displas and Sutherland, 1988). At each site, and for each method, two or three measurement stations were utilized. In order to display and compare size distributions from these different sampling or counting procedures, it was also necessary to define a common variable to describe pebble dimen-sion. We choose to consider the b-axis of the particles, i.e., their intermediate axis, and to perform geometric corrections when necessary (see more details in Appendix A).
Surface measurements were applied to gravel bar surfaces, landslide surfaces, terrace and moraine cross sections. We used both tape measure and photo counting methods. For the tape measure method, a line of 15 m was posed on the geomorphic object and particles were measured and lithologically identified every 50 cm. For the photo counting, particle size was measured at the 100 nodes of a regular numeric square grid. A comparison of the two methods is detailed in Appendix B.
Volumetric measurements were applied for subsurface mea-surements of the gravel bar, landslide, terrace, and moraine mate-rial: 100–250 kg of material were collected and sieved with 1, 2, and 4 cm square mesh sieves. Material coarser than 4 cm was sorted by lithology and particles were weighed separately. Frac-tions finer than 4 cm were weighed in classes corresponding to the mesh size. The size distribution for particles coarser than 1 cm was established in the field. The size distribution of the frac-tion finer than 1 cm was analyzed in the laboratory, using sieves and an optic laser method for fractions larger and finer than 1 mm, respectively.
On landslide and moraine cross sections (Figs. 5A and 5B), both surface and volumetric counting were used and generally provided similar D
50 values. The upper tail of the distribution
curves differ, however, because the surface methods include larger blocks than the volumetric method. The maximum block size on photos, which encompass 5–20-m-wide surface, reaches 2 m (Fig. 5A), but only 40 cm (≤50 kg) in our volumetric sam-pling. Accordingly, we consider that volumetric sampling pro-vided a reasonable estimate of the median size D
50 of the whole
material, but largely underestimated D90
values.Along the Marsyandi course, five main lithologies were
distinguished: limestones (including marbles), schists (includ-ing phyllites, sericites, micaschists), crystalline rocks (gneiss and granitic rocks), quartzites, and sandstones. Each structural unit drained by the Marsyandi River contains contrasting pro-portions of these different lithologies, a context helpful to iden-tify the particle provenance and thus favorable to study abra-sion processes, as discussed in section 2. From the source to the confluence with the Kali Gandaki, the river drains mostly lime-stones across the Tethyan Sedimentary Series, gneisses across the Higher Himalayan Crystalline, schists in the upstream part of the Lesser Himalaya, and sandstones, schists, and quartzites in its downstream part.
Visual identification of entire or freshly broken pebbles, with an eventual test for presence of carbonates with hydrochlo-ric acid was used to define sediment lithology. Gneissic pebble identification was the easiest one, and errors were probably very rare. In contrast, for the other lithologies, the identification of some pebbles was somewhat arbitrary in particular for “interme-diate” lithologies such as schistosed sandstones, quartzitic sand-stones (Kuncha Formation), or silicified limestones (Annapurnas Formation). However, identification errors or misleading choices concern only a few pebbles within the whole sampled volume at each site. Therefore, the relative error for dominant lithologies reaches only a few percent, but it may be important and eventu-ally reach 100% when the proportion of a lithology is lower than 5%–10%.
4.3 Sources Characteristics
Landslides occur along the entire valley but deliver a very wide range of size distribution to the fluvial network (Fig. 5A). Distribution curves obtained in distinct lithologies present glob-
Changes of bedload characteristics along the Marsyandi River 151
ally similar trends. The median size, D50
, of the material appears, however, to depend on the nature of rock outcropping in the area (Fig. 5A). D
50 varies between 37 and 74 mm for gneiss of the
Formation I, between 18 and 28 mm for gneiss of the Forma-tion II, between 21 and 74 mm for quartzites, and between 3 and 23 mm for schists. Other parameters, like the degree of fractura-tion and weathering of the bedrock, probably have a significant role, but were not measured for this study. Silt and sand frac-tions account for 15%–20% of the volume of landslide depos-its, except for a deep-seated landslide in schists, where strong
weathering could have substantially increased the proportion of fine material.
Moraines are located in the upper valley above ~2500 m elevation. In contrast to landslides, they provide a large propor-tion of very fine material (Fig. 5B), around 20%–30% of silt and a very low sand fraction (between 1/16 and 1 mm). D
50 values
range between 6 and 24 mm. The material is mainly composed of limestone fragments; the moraines we surveyed being located upstream of the South Tibetan Detachment. The fine mineralogi-cal structure of the rocks of these units may explain the diver-
Upper Trisuli (large photo)Mean curve used for model
Supraglacial deposits
Subglacial deposits
B
C
D
1 2 4 8 16 32 64 128 256 512
0%
10%
20%
30%
40%
50%
60%
70%
80%
90%
100%
7 8 9 10 11 12Particle size in - φ scale
(bottom values in millimeters)
-10 -9 -8 -7 -6 -5 -4 -3 -2 -1 0 1 2 3 4 5 6
Cumulated size distributions for landslides, Marsyandi Valley
SchistGneiss F. I and IIQuartzite Quartzite (large photos)Mean curve used for model
A
Figure 5. Cumulative size distributions for different sediment sources and gravel bars from subsurface measurements. (A) Bedrock landslides: the size of material provided by landslides is highly variable, with D
50 ranging between 3 and 74 mm. The size distribution appears to depend
on bedrock lithology: landslides initiated in quartzitic and gneissic units deliver coarser material than schist units. An average distribution curve for competent units (thick gray line) was computed without this finest distribution from schist units, but including photo counting to account for the coarse upper tail of the distribution. (B) Moraine deposits provide on average finer material, with D
50 varying between 6 and 24 mm. Curves
obtained from field measurements (mostly dump moraines) fall in the domain covered by supraglacial deposit spectra (gray shading; Campy and Macaire, 1989; Benett and Glasser, 1996). As for landslides, the coarse upper tail of the distribution obtained by photo counting has been included to derive an average distribution curve (thick gray line). (C) Terrace deposits are very heterogeneous, due to their mode of formation. They consist of a succession of sedimentary bodies superimposed during aggradation events. As a consequence, size distribution curves can have very distinct shapes and D
50 varies between 5 and 147 mm. (D) Gravel bars do not show such dispersion. Marsyandi and tributary gravel
bar curves show a similar trend with D50
values ranging between 20 and 100 mm. All the curves end at values of D lower than 400 mm (except for photo analysis curves), showing the limitation of the sampling method to take into account coarse material. Domains are TTS—Tethyan Sedimentary Series, LH—Lesser Himalaya, and HHC—Higher Himalayan Crystalline.
152 M. Attal and J. Lavé
gence observed for the silt fraction between our curves and the curves found for supraglacial material derived from crystalline rocks (shaded domains in Fig. 5B; Campy and Macaire, 1989; Benett and Glasser, 1996).
For the two hillslope sources, all the distribution curves derived from volumetric sampling end at values of D lower than 30 cm, revealing the limitations of our sampling method in accounting for coarse material. Nevertheless, the distribution derived from photo counting indicates that the upper tail of the curve is limited and that the missing coarsest fraction generally represents less than 10%.
It has to be noted that the distributions we measured on hill-slopes overestimate in some way the size of the material that will effectively become bedload material in the fluvial network. Many blocks are fractured, in particular through schistosity plans. After having reached the river channel by sliding or falling along the hillslope and traveling a few kilometers in the river, these blocks would probably have been split several times, and their size would have decreased dramatically.
4.4 Gravel bar Material Characteristics
When compared to source material, gravel bar material dis-plays much less dispersion (Fig. 5D). Most of the 12 complete size distributions (i.e., with the silt to gravel fractions finer than 1 cm) we measured along the Marsyandi River and its tributar-ies display similar curves. Sand and silt represent only 8–15% of the total volume of gravel bar sediments. Around half of the fine material present in the hillslope sources, plus all the products of blocks and pebble abrasion, are therefore evacuated directly as suspended and wash load, independent of the material travel-ing as bedload. Size and lithological distributions of gravel bar material have been established for ~30 sites distributed along the Marsyandi River from Manang to the confluence with the Trisuli in Mugling, and for 10 gravel bars on the main tributaries close to their confluence with the Marsyandi. Additional gravel bars were surveyed along the lower Trisuli and on the Narayani close to the Main Dun thrust.
4.4.1 Downstream Evolution of LithologiesThe downstream evolution of the lithological composi-
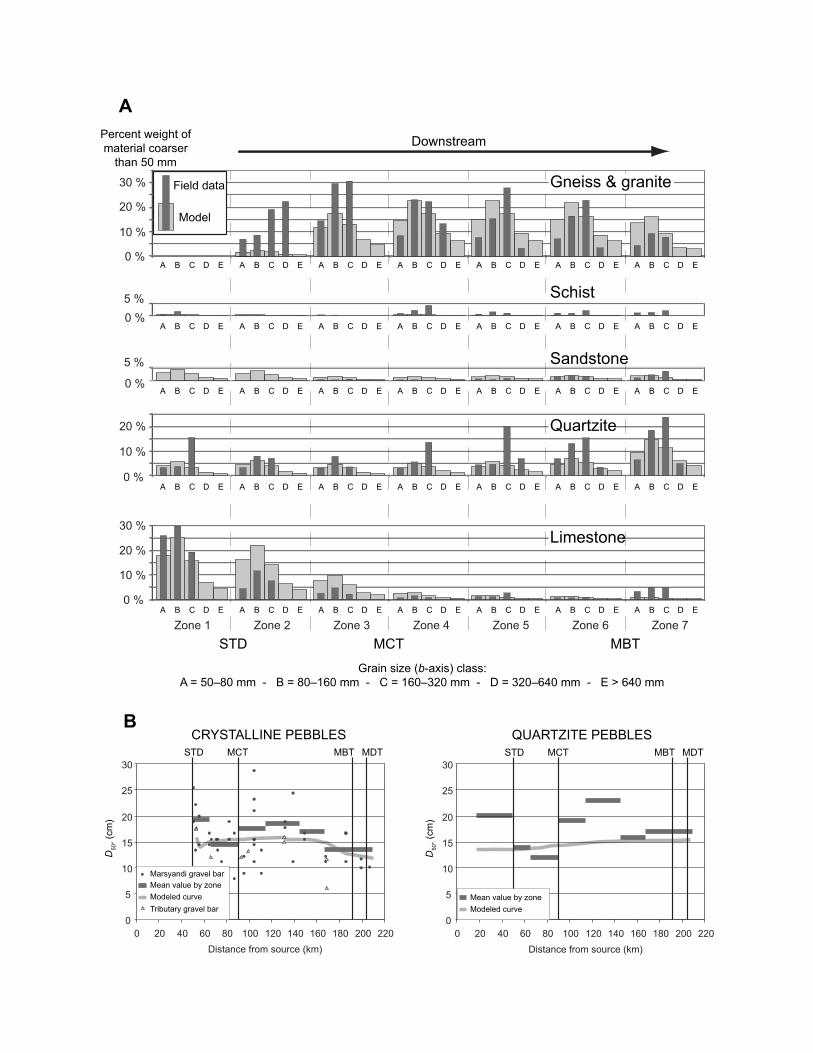
tion for both surface (Fig. 6B) and subsurface (Fig. 6A) pebble material (fraction > 5 cm) is remarkably consistent. From one site to the next, scattering is, however, important and can reach up to 40% for major lithologies and more than 100% for minor ones. This reflects more the poor statistics resulting from reduced sample sizes than the lateral input by the tributaries (Fig. 6A). The general trend for both diagrams conforms to the different geologic units crossed by the Marsyandi. As explained in sec-tion 3, the river drains across three main structural units, each of them having its proper lithological characteristics. The litho-logical composition of the gravel bar material reflects both the influence of sediment supply coming from these structural units and the different erodibilities related to each lithology. To illus-
trate these two processes, note for example, that the proportion of limestone decreases rapidly downstream from the South Tibetan Detachment, probably in response to a high erodibility of lime-stone (Kuenen, 1956) as well as an important dilution in gneissic pebbles, amplified by increasing local erosion and sediment sup-ply rates when crossing the Higher Himalaya. In contrast, the steady downstream increase in the proportion of quartzite, up to 50%–60% in the lower Trisuli and Narayani, despite minor proportions of quartzite in the different source units, reflects the much higher resistance to abrasion of quartzite pebbles relative to other lithologies (Kuenen, 1956; Bradley, 1970).
Gravel bar compositions also help to unravel several char-acteristics of the transported material. The lithologies that are poorly resistant to abrasion are expected to be present in low-order drainage systems, reflecting the composition of local sources, and to diminish in abundance downstream. This is the case for schists and sandstones: the schists represent important lithologies in the upper Tethyan series and in the Lesser Himala-yan units. The tributary in Sabche, the Paudi, and Chepe Kholas present a proportion of 15–40% of schists, illustrating the impor-tance of schists in the corresponding local sources. However, their proportion drops to <5% on average along the Marsyandi River. A similar pattern is observed for the proportion of sand-stones between the Paudi and Chudi Kholas on the one hand and the main stem of the Marsyandi on the other hand. Finally, some tributaries draining southern Tibet, like the Naur and Dudh Kholas, or the Marsyandi in Chame just below the South Tibetan Detachment trace, display surprising features—for all of them, the proportion of limestone is much lower than expected from the size of the contributing area in calcareous units. For example, the Dudh Khola gravel composition displays 60% of granitic peb-bles, 40% of gneissic pebbles, and almost no limestone pebbles, despite the fact that calcareous units represent a third of its con-tributing area. Such unexpected results could arise either from heterogeneous erosional behavior of the lithologies (limestones eroded mostly in sandy fractions or by chemical erosion, etc.) or more probably from stochastic behavior related to discrete sedi-ment supply events, like landslides or glacial lake outbursts (e.g., Benda and Dunne, 1997).
4.4.2 Downstream Evolution in Grain SizeDownstream profiles of the median size (D
50) of gravel bar
material (Fig. 7) are characterized by significant scatter, even more pronounced than for the lithological evolution. This scatter can exceed 100% of the median grain size from one site to the next, and even at the scale of a single gravel bar. We suspect that such scatter arises from the insufficient sample size and from the spatial variability in hydrodynamic conditions along and between gravel bars that lead to more- or less-intense local coarsening.
Despite the scatter, the general trend for subsurface samples is clear and opposite to what would be expected in gravel-bed rivers: there is no downstream fining, but downstream coarsen-ing, with three domains for which D
50 seems to remain more or
less uniform. At the boundaries between these domains, a sharp
Distance from Marsyandi source (km)0 50 100 150 200
Figure 6. Evolution of the lithologic average content for pebbles larger than 5 cm in gravel bar material along the Marsyandi River (average value issued from the two or three independent measurements on each gravel bar), (A) for the subsurface material and main tributaries, and (B) for the surface material. Important scattering from one point to the next is due to the insufficient size of the sampled volume. The global trend is, however, quite similar for surface and subsurface data: the lithological composition of the gravel bar material reflects both the influence of sedi-ment supply coming from these structural units and the different resistances to abrasion related to each lithology. Resistant rocks (quartzites) are over-represented compared to soft rocks (schist and sandstone). For surface measurements, disparities between Mezaki and Yabiku’s (1984) data and ours mostly concern sandstones and limestones and probably arise from distinct criteria for lithology identification (a good fit is obtained for the unambiguous gneissic pebbles). The major faults are the South Tibetan Detachment (STD), the Main Central thrust (MCT), the Main Boundary thrust (MBT), and the Main Dun thrust (MDT).
154 M. Attal and J. Lavé
increase of D50
occurs downstream. These domains correspond roughly to the main structural units. At this stage, it is thus tempt-ing to attribute such changes to some relationship between sedi-ment sources and geologic or morphotectonic units. We saw, for example, in the previous section, that moraine material is finer than landslide material: the increase in mean pebble size from southern Tibet to the Higher Himalayan gorges could, therefore, result from an increasing supply in landslide material. Similarly, it would be tempting to attribute the increase in pebble size south
of the Main Central thrust to an increasing signature of landslides initiated in quartzitic units, which are characterized by slightly coarser size distributions than for landslides initiated in the Higher Himalayan Crystalline gneissic units.
Additional observations can be made on the median pebble size of the gravel bar surface (Fig. 7B). D
50 values for surface
sample are systematically higher than those for subsurface sam-ples. Logically, they follow the same rough downstream coarsen-ing. However, the flat trend observed for subsurface D
50 across a
0
5
10
15
20
25
30
35
0 20 40 60 80 100 120 140 160 180 200 220
Distance from source (km)
STD MCT MBT MDT
Tape measure line
Photo analysis
Global trend for sub-surface D50 values
0
2
4
6
8
10
12
14
16
18
0 20 40 60 80 100 120 140 160 180 200 220
STD MCT MBT MDT
Marsyandi gravel barTributary gravel bar
Distance from source (km)
D50
(cm
)D
50 (c
m)
(1)
(2) (3)
(4)(6)
(7)
(8)
(9)
(1)
(5)
A
B
Figure 7. Evolution of the median size of gravel bar material along the Marsyandi River, for (A) the subsurface material and (B) for the surface material. Circle and vertical bars show the respective average value and range of values obtained from the two or three different sampling points on each measurement site. Downstream coarsening appears clearly. Subsurface D
50 seems to remain roughly constant across the main structural
units (trend drawn by thick gray dotted line); increases are abrupt and located roughly at the limit between these units. These trends are less vis-ible for surface D
50, due to a larger scatter. Surface values are systematically 1–4 times higher than subsurface ones, showing a coarsening of the
surface layer of the bars. Tributaries: (1) unnamed small tributaries, (2) Naur, (3) Dudh, (4) Nyadi, (5) Khudi, (6) Paudi, (7) Chepe, (8) Chudi, (9) Trisuli. The major faults are the South Tibetan Detachment (STD), the Main Central thrust (MCT), the Main Boundary thrust (MBT), and the Main Dun thrust (MDT).
Changes of bedload characteristics along the Marsyandi River 155
given structural unit is not observed for surface D50
, which varies across a wide range of values, between one to five times subsur-face D
50 values. At the crossing of the South Tibetan Detachment,
the difference in surface D50
is still visible, whereas no major change occurs going from the Higher Himalayan to the Lesser Himalayan domains. These observations suggest that there is no clear relationship between surface and subsurface size distribu-tion. The vertical coarsening-up observed on gravel bars is not uniform: it varies both along the course of the river and at the scale of a single bar, probably in response to variable local hydro-dynamic conditions.
4.4.3 Terrace Material and Temporal Variations in Transported Sediments
Size distribution in terrace deposits display larger dispersion than on gravel bars (Fig. 5C). This likely arises from the fact that terrace deposits correspond to local events in space and time, such as landslide dam filling, alluviation, or debris flows. The amplitude of the event influences the changes of the river hydro-dynamic variables and thus the characteristics of the fill. Even within a single terrace deposit, very large vertical and horizontal variations in size distribution of the material can be observed. As a consequence, individual measurement of D
50 in terrace material
varies between 6 and 160 mm.
To show possible temporal variations in pebble character-istics along the Marsyandi, we compared the size distribution in alluvial terrace deposits to that of the closest surveyed gravel bar (Fig. 8). First, we note that the median pebble sizes in ter-race material do not strongly differ, on average, from those in the gravel bars, and that they all cluster around 5 cm, except at the Nyadi Khola site, for which a mixed debris-flow–type origin cannot be excluded. Individually, the differences between terrace and gravel bar material are larger than 50%, but, in fact, are of the same order as the scatter observed from one gravel bar to the next. Differences in lithologic compositions between gravel bars and terraces are also within the observed scatter along the Marsyandi channel and do not suggest any major changes in sediment sources. The only noticeable exception is observed in Chame, few kilometers downstream of the South Tibetan Detachment trace, where we previously identified a strong anomaly in both the Marsyandi and Naur Khola gravel bars. Terrace deposit pro-portions include more lithologies representative of the Tethyan Sedimentary Series than the gravel bars, which are characterized by a marked over-representation of Higher Himalayan Crystal-line gneissic elements. As already argued, if the river network is supply-limited by discrete landslides, then important temporal variation can be expected, in particular in the low-order channels. Downstream, in the main stem, we expect that mixing becomes
LimestonesFigure 8. Comparison of median size and lithologic content of terrace depos-its and of their closest gravel bars. Ter-race deposits provide an insight into the material transported by the river in the past. Some differences can be observed between present-day deposits and fossil ones, but these differences are too small in regard to measurement uncertainties to be interpreted in terms of variations in sediment supply.
156 M. Attal and J. Lavé
sufficiently efficient to dampen these discrete signatures. Alter-natively, the variations in pebble characteristics in Chame could reflect important changes in spatial erosion and hydrodynamic regimes, due to the transient response to glacier retreat or advance since the late Pleistocene.
Finally, our measurements on terrace deposits and gravel bars confirm that spatial and temporal scatter, whether due to our measurement procedures, climatic variations, or some stochastic aspect of sediment supply and river transport, has more impact on the gravel size distribution than on the lithologic composition.
5. COMPARISON BETWEEN EXPERIMENTAL AND NATURAL ABRASION
In order to extend in a more quantitative way the data inter-pretations on gravel bars and sources in the Marsyandi Valley, we conducted experimental measurements on Himalayan lithologies and checked their consistency with our observations by means of a simplified integrative model.
5.1 Experimental Abrasion Rates of Himalayan Lithologies
Between three and ten rounded pebbles were sampled in the field for each of the most representative lithologies of the Marsyandi watershed. Pebbles came from active gravel bars: no obvious weathering rind was observed. Their b-axes ranged
from 4 to 10 cm, which roughly corresponds to the median pebble size along the Marsyandi. The pebbles were run into a circular flume (Attal and Lavé, 2003; Attal, 2003) designed to characterize pebble abrasion processes and rates. The run was conducted under a turbulent flow velocity of 2.3 m/s and aver-age shear stress of the order of 250 Nm–2. These conditions are close to the conditions prevailing in the Marsyandi River during annual peak discharge across the Lesser Himalaya. Because the dominant lithologies in the Marsyandi River are mostly resistant to abrasion, ~60 kg of alpine crystalline pebbles of similar size were added to 15 kg of pebbles of different Himalayan litholo-gies in order to obtain a bedload flux of 80 kg s–1m–1 or 0.03 m2s–1 by width unit. Weight loss by abrasion was quantified by weighing the dry Himalayan pebbles before and after the run. Traveling distances ranged between 2.3 and 7.0 km, according to run durations of 0.5–1.5 h and a mean pebble velocity of 1.3 m s–1. Abrasion coefficients are thus reported in % loss per kilo-meter (Table 1).
Weight loss values are relatively uniform (with relative standard deviations lower than 1) for resistant lithologies and for marbles. Quartzite abrasion rates are very low, ~0.15% per km. Granites and calcic gneisses (Formation II) have rates of 0.4% per km, but aluminous gneisses (Formation I) have rates three times higher: 1.4% per km. This difference is probably due to the presence in these gneisses of well-developed weak mica beds, which make the rock less resistant to abrasion. Each of the
398-09
TABLE 1. EXPERIMENTAL ABRASION RATES FOR DIFFERENT HIMALAYAN LITHOLOGIES
Abrasion rate (%.km–1)
Structural unit Lithology
Mean value 1 min max
TSS lower units (Paleozoic) Quartzitic sandstone 0.4 0.3 0.16 0.9
TSS lower units (Ordovician) Limestones 2.6 0.8 1.7 3.4
TSS lower units (Paleozoic) Annapurna limestone 0.5 0.2 0.3 0.7
Upper series of the LH, southern part of the anticlinorium
Schist 23 16 5.4 45
Siwaliks MDT Sandstone 6 5 1.4 13
Siwaliks MFT Sandstone 31 22 16 47 Note: Measurements were conducted in a circular flume (Attal and Lavé, 2003; Attal, 2003) with
4–8 cm pebbles (b-axis) sampled along the Marsyandi river. Some lithologies like limestone, gneiss, granite, or marble display roughly homogeneous values, in contrast to schist and sandstone, which present heterogeneous behavior to abrasion. This behavior depends on their degree of strengthening by diagenesis and/or metamorphism, their content in micas and phyllitic minerals and their degree of schistosity. TSS— Tethyan Sedimentary Series; HHC—Higher Himalayan Crystalline; LH— Lesser Himalayan units; MDT—Main Dun Thrust; MFT—Main Frontal Thrust.
Changes of bedload characteristics along the Marsyandi River 157
calcareous rock types have roughly uniform abrasion rates due to their fine and homogeneous structure at the pebble scale, but these rates are variable if we consider the limestone group as a whole; they vary from 0.5% per km for the Annapurna silicified limestones to 2.6% per km for the black limestones of the Ordo-vician Pisang Formation. These differences are probably linked to the various degrees of metamorphism and recrystallization of the rocks and to their various content in quartz.
Soft lithologies present an important dispersion in abrasion rates. For sandstone, abrasion rates and dispersion increase with decreasing degrees of metamorphism or diagenesis, because these processes contribute to strengthen rocks. The abrasion rates obtained experimentally are 0.4% for the Tethyan quartzitic sand-stones, 1.7% for the Lesser Himlayan sandstones of the Kuncha Formation, 6% and 30%, respectively, for the Tertiary sandstones from the Main Dun thrust zone and from the Main Frontal thrust zone. For schist pebbles, abrasion rates can vary by an order of magnitude according to their degree of weakness; this weakness is linked to their mica and phyllitic mineral content as well as to the intensity and spacing of cleavage planes (bedding, schis-tosity). Schists display on average very high weight loss values, between 7% and 23% per km. Due to their particular structure and mineralogical composition, schist pebbles are abraded very rapidly and often in a mode that rarely occurs for other litholo-gies: the pebble splits into two or three pieces of similar size.
For resistant lithologies, the average values are consistent with the results obtained for similar lithologies run in other abra-sion experimental devices (Schoklitsch, 1933; Kuenen, 1956), although they are slightly higher, by a factor 1–3, than these pre-viously published abrasion rates. For soft lithologies, our experi-mental abrasion rates are 4–20 times higher than previously pub-lished rates. We suggest that this is due to higher impact veloci-ties and thus to more efficient impact wear in our experimental flume than in the tumbling barrels that were often used in previ-ous studies.
In the following, we will be using our average experimental values, keeping in mind, however, that they cannot account for the large dispersion observed for some lithologies, and also that they possibly correspond to minimum values. Indeed, the pebbles of each lithologic class that we sampled to run in the experimen-tal device could not be fully representative of the hillslope mate-rial, because the most-fractured or least-resistant fraction of the source material already disappeared during fluvial transport and abrasion, and therefore is not included in the sampled pebbles.
5.2 Integrative Model for the Marsyandi Watershed
In a given river section, the sediment load size distribution results from the contribution from all the parts of the watershed, modulated by the local erosion rate (or hillslope sediment supply rate) and by size reduction processes. If we assume first that most of the material supplied by the hillslopes can be transported along the fluvial network whatever the initial size (except for very large blocks that represent a minor contribution to total sediment flux),
second that abrasion coefficients do not depend on hydrody-namic conditions or sediment flux, and third that we can neglect additional weight loss during the first traveled kilometers due to very efficient abrasion and edge rounding processes of angular pebbles (Krumbein, 1941; Kuenen, 1956; Pearce, 1971), then size reduction can be adequately represented by Sternberg’s law (equation 1) with a constant abrasion coefficient, like in section 2. Under these simplifying assumptions, the size distribution for the jth lithology can be written as an integral term on the upstream fluvial network (fn):
fj D p x f x De A x x dj
j
k jL x
( ) ( ) ( , ) ( ) ( )( )=
03 ε xx
A x x dx
fn
fn
∫∫
∫∫
( ) ( )
ε, (5)
where p xj( )
represents the local proportion of the jth lithology, A x( )
the local contributing area, ε( )x the corresponding average
erosion rate, kj the abrasion coefficient, L x( )
the distance along
the fluvial network between the sediment source and the consid-ered river section, and
f x Dj0 ( , )
the size distribution of the sediment supply from the hillslope to the river network in x
�, with
f x D dDjD
0 1∫ =( , )
.
Median size D50
is thus defined as the diameter for which:
f D dD f D dDj
D
D
jj
D
D
jmbl mbl
( ) ( )50 50
∫∑ ∫∑
= 1 2 , (6)
where Dmbl
represents the smallest gravel size traveling as bed-load. The proportion of the jth lithology for pebbles larger than D
m = 5 cm is expressed by:
P f D dD f D dDj j
Dmj
Dmj
=+∞ +∞
∫ ∫∑( ) ( ) . (7)
It should be noted that equation 5 is probably not appropriate for suspended load, which, in any event, is not considered here.
In an attempt to invert this integrative model for the abra-sion coefficient k
j for each lithology, we thus need three indepen-
dent data sets. First, we need the size distribution for the sources: we consider the average distribution of the ones we measured along the Marsyandi valley (thick gray line on Figs. 5A and 5B). We initially assume that landslides represent the main source of sediment supply and consider a uniform distribution curve, independent of lithology, which corresponds to the average size
84°E
28°N
0 2 4 6 8 10
Denudation rate (mm/yr)
A
28°N
84°E84°E
MFT
MBT
MCT
MFT
MBTMBT
MCTMCT
STDSTD
0 ▲ ▲
0
I
I
I
I
I
▲ ▲ ▲ ▲ 0 ▲ ▲
▲ ▲ ▲ ▲
▲
▲
▲
0 0 0 0 0
▲ ▲ ▲ ▲
▲ ▲ ▲ ▲ ▲ ▲
▲
▲ ▲ ▲ 0
▲ ▲ ▲
▲
▲
▲ ▲ ▲
▲ ▲ ▲ ▲
▲
▲ ▲ ▲ ▲
▲ ▲ ▲ ▲ ▲
0 00 0
0
I
I
I
I
I
I
▲ ▲ ▲ ▲ ▲ ▲ ▲
▲ ▲ ▲ ▲
▲
▲ ▲
▲ ▲ ▲ ▲ ▲
▲ ▲ ▲ ▲
▲ ▲ ▲ ▲ ▲ ▲
▲
▲ ▲ ▲ ▲
▲ ▲ ▲
▲ ▲ ▲
▲
▲ ▲
▲ ▲ ▲ ▲
▲ ▲ ▲ ▲
▲ ▲ ▲ ▲
STD
A'
Narayani
Narayani
Kali GandakiKali Gandaki
TrisuliTrisuli
25 km
0 50 100 150 200
5
0
10
Projected distance from MFT (km)
Inci
sion
and
den
udat
ion
rate
(mm
/yr)
1 2 3 4 5
A A'
Overlappingconfidencedomains
Narayani
Narayani
Kali GandakiKali Gandaki
TrisuliTrisuli
Marsyan
Marsyandi
Marsyan
Marsyandi
25 km
Marsyandi watershed
ELA during Last Glacial Maximum
Marsyan
Marsyandi
Marsyan
Marsyandi
Pliocene Quaternary
TSS upper units (Mes.)
TSS lower units (Pal.)
HHC gneisses
HHC Cambrian series
HHC Paleozoic series
Intrusive granites (Pal. /Cen.)
LH upper units (Pal. to Cen.)
LH lower units (Pal.)
Siwaliks
Gangetic plain
Changes of bedload characteristics along the Marsyandi River 159
distribution of landslide deposits (Fig. 5A). Additional supply by moraine material will be introduced only for the last tested model (section 5.3.2). Second, a lithologic map is required (Fig. 9A): based on previous geologic mapping (Colchen et al., 1986) and corresponding cross sections, rough proportions of each lithol-ogy are estimated for the main structural units (Table 2). Finally, a denudation map is required (Fig. 9B): as a first order proxy, we use an erosion map extrapolated from fluvial incision rates in central Nepal, assuming that incision rates are roughly in equi-librium with catchment erosion rates (Lavé and Avouac, 2001). Recent work in the Marsyandi Valley confirmed the gross pattern view of inferred downcutting and erosion rates along Marsyandi Valley (Burbank et al., 2003; Pratt-Sitaula et al., 2004) with high-est incision rates across the Higher Himalayan Crystalline, low rates across the Lesser Himalaya, and moderate rates across the Mahabarat and Main Dun thrust fold. In addition, suspended load measurements in east and central Nepal suggest that pres-ent denudation rates are roughly similar to long-term denudation rates (Lavé and Avouac, 2001). Finally, it has to be noted that only relative spatial variations in erosion rates are required by equation 5.
Because large uncertainties are associated with these data sets, we did not perform a formal inversion and preferred to explore different end-member models, in order to assess the roles
of abrasion coefficients and local hillslope sediment supply rates. To conduct such direct modeling, we extracted the fluvial net-work from the worldwide 30″ digital elevation model.
responding to models 10A–G, respectively) have been compared to the lithologic data for the Marsyandi (Fig. 10H), i.e., the litho-logic composition of the material coarser than 5 cm. First, we considered the relative surface proportion of each lithology out-cropping in the contributing area (Fig. 10A), i.e., the pebble distri-bution produced by a uniformly eroded landscape, in the absence of abrasion during pebble transport. As expected from a rapid look on the geologic map, the Tethyan series, Higher Himalayan Crystalline, and Lesser Himalayan units represent similar areas in the Marsyandi basin: in consequence, their dominant litholo-gies—limestones, gneisses, and schists, respectively—occur in similar proportions close to the confluence with the Trisuli. This result sharply contrasts with our observations and suggests that pebble abrasion and/or variations in sediment supply have to be incorporated. The second model therefore includes variations in sediment supply (Fig. 10B), but still excludes pebble abrasion. Increasing hillslope erosion in the Higher Himalayan Crystalline unit, according to the denudation map in Figure 9B, produces the observed proportional increase in gneissic pebbles, but is unable to predict the low concentrations in schists, the rapid downstream decrease in limestone where the river crosses the Higher Hima-layan Crystalline, and the net increase in quartzite. Including a uniform abrasion coefficient of 2%/km (Fig. 10C) helps to accen-tuate the decrease in limestone, but does not solve the misfits for the other lithologies. Introducing lithology-dependent abrasion coefficients, as evidenced by our experimental results on Himala-yan pebbles, therefore seems necessary (Fig. 10D). The average coefficients permit us to account for most of the observed con-centration curves along the Marsyandi, in particular the increase in quartzite and vanishing of schist pebbles, although the latter effect is overestimated by the model. On the other hand, we could
Figure 9. Maps of (A) lithology and (B) denudation rates used for the model. Lithologic map is extrapolated from Colchen et al. (1986). De-nudation map is derived from terrace record and fluvial Shields stress inversion along five transverse Himalayan rivers (Lavé and Avouac, 2001). Stacked incision curves for these rivers are presented in the lower left angle of the diagram; curves are projected on a N18° pro-file, roughly perpendicular to the Himalayan structures. Equilibrium line altitude (ELA) during Last Glacial Maximum has been consid-ered in model (10G; section 5.3) as the limit between an upper zone with sources dominated by moraine material and a lower zone with sources dominated by landslides. Domains are TTS—Tethyan Sedi-mentary Series, LH—Lesser Himalaya, and HHC—Higher Himalayan Crystalline. The major faults are the South Tibetan Detachment (STD), the Main Central thrust (MCT), the Main Boundary thrust (MBT), the Main Dun thrust (MDT), and the Main Frontal thrust (MFT).
398-09
TABLE 2. PROPORTION OF THE MAIN LITHOLOGIES IN THE DIFFERENT GEOLOGIC UNITS AND AVERAGE ABRASION COEFFICIENT USED IN THE MODELS
Granite Gneiss Schist, sericite, and micaschist
Quartzite Sandstone Limestone and marbles
Abrasion coefficient 0.4 1.3 16 0.15 2.0 2.0
Lithologic proportion (%)
TSS upper units - - 16 13 15 56
TSS lower units - - 20 10 10 60
Intrusive granites 100 - - - - -
HHC gneisses - 95 - 5 - -
LH upper units 0 0 55 20 10 15
LH lower units - - 55 10 35 - Note: See Figure 9A for correspondence. TSS— Tethyan Sedimentary Series; HHC—Higher
Changes of bedload characteristics along the Marsyandi River 161
neglect differential hillslope erosion rates and focus on differen-tial abrasion coefficients (Fig. 10E). As for model 10D , most of the concentration curves reasonably fit the observations along the Marsyandi. However, when compared to the data, the decrease in limestone proportions is not sharp enough, the proportion of the gneiss across the Higher Himalayan Crystalline is too low, and the proportion of sandstone in the Lesser Himalaya is too high. Therefore both processes, differential supply rates and abrasion coefficients, are necessary to explain the gross features of the observed lithologic evolution along the Marsyandi.
In section 2, it was argued from a simple analytic model that the downstream evolution of the pebble fraction in the sediment load strongly depends on the abrasion coefficient (Fig. 1B). When two or more lithologies with distinct resistance to abrasion are present in the catchment, it can easily be shown that the down-stream evolution in lithological proportion depends not only on the relative values of the abrasion coefficients but also on their absolute values. This prediction can be tested with the integrative model, by assuming the different abrasion coefficients multiplied by factors of 1/5 and 5, respectively. The first case, i.e., a decrease in abrasion efficiency, leads to a figure that is similar to model 10B, except for the schist, the abundance of which is reduced. The second case (Fig. 10F), i.e., an increase in abrasion effi-ciency, produces a rapid predominance of quartzite pebbles over all other lithologies in the Lesser Himalaya. Both scenarios can thus be rejected: the abrasion coefficients that our model requires to explain the data we collected along the Marsyandi River are roughly constrained, and they are of the same order as the experi-mental abrasion coefficient we obtained experimentally, although large uncertainties remain.
5.3.2 Size DistributionsWhen landslide material reaches the fluvial network, we
suspect that the finer fraction is rapidly washed out and travels as suspended load, and that the size distribution of the residual material becomes coarser. We have already observed in the size distribution curves (Fig. 5) that gravel bar material is indeed depleted in fine particles in comparison to the hillslope sources. In order to avoid any bias, only fractions traveling as bedload are considered here, and the median size will be computed for
the fractions larger than a cut-off value of 1 mm. For each pre-vious end-member model, the predicted downstream evolution of this truncated median size does not fit the observations (Fig. 11). First, all the models predict a uniform median size or a slight downstream decrease, in sharp contradiction with the data along the Marsyandi. Second, all the models underestimate the data trend by a factor of two, except in the Tethyan Sedimentary Series, where they overestimate gravel size.
Most of the highest parts of the landscape, above 4000 m, display important present-day and fossil glacial signatures. Such preservation of formerly glaciated landscapes suggests that the system has not yet returned to equilibrated fluvial landscape. In these areas, the present denudation rates could be different from the long-term rates. Moreover, sediment supply by landslides could represent a minor contribution relative to re-erosion of moraine material and debris produced by periglacial processes. Therefore, let us assume that in the upper part of the watershed, the hillslope sediment supply is better accounted for by the aver-age size distribution of moraine material (thick gray line on Fig. 5B). To do this simply, we consider that the equilibrium line alti-tude (ELA) during the Last Glacial Maximum (Duncan et al., 1998) defines the limit between hillslope supply dominated by landslides and by moraine-type material (Fig. 9B). Obviously, large glacial valleys have developed far below this line, like in the upper Marsyandi between Manang and Dharapani (Fort, 1993; Lavé and Avouac, 2001), down to probably 2000–2500 m (Fig. 2). However, it is beyond the scope of this paper to account for a precise location of glacial remnants: introducing in model 10G such a simplistic limit only provides a first-order view on the role of source distribution. Along the Marsyandi Valley, the lithologic composition is almost insensitive to this change, and differences in curves of models 10D and 10G are of the order of few percents or less (Fig. 10). In contrast, the downstream evolution of the median grain size reflects the introduction of finer size distribu-tions from moraine material in the upper part of the watershed. The modeled curve displays similar features to the observed data: low median sizes above the South Tibetan Detachment, interme-diate sizes across the Higher Himalayan Crystalline, and higher sizes across the Lesser Himalaya. We therefore propose that the downstream coarsening pebble sizes could arise from varying sediment sources along the Marsyandi Valley and that source characteristics can exert a strong control on the evolution of river sediments. Though it provides a more acceptable downstream trend, the model 10G still largely underestimates the median pebble size observed on the gravel bars in the Higher Himalayan Crystalline and Lesser Himalayan units. An explanation for this misfit will be discussed in the section 6.1.
5.3.3 Size Distribution for Individual LithologiesThe consistency of model 10G can be tested in more detail
through the size distribution in each lithology. To attenuate the large scattering in the data, we grouped the measurement sta-tions in seven zones according to their morphostructural posi-tion along the river (Fig. 12A), and summed their weight into a
Figure 10. Downstream evolution, along the Marsyandi River, of the lithologic content of bedload pebbles larger than 5 cm predicted by different end-member models (A to G), as compared to observed subsurface gravel bar material (H). Model A displays the lithologic surface proportion in the contributing watershed ( = uniform erosion and no abrasion); models B to F correspond to end-member models showing the influence of hillslope sediment supply rates and abra-sion coefficients. They were computed for a uniform size distribution (landslide-type) of hillslope sediment supply. In contrast, model G also includes hillslope sediment supply of moraine-type material in the upper part of the drainage basin. The major faults are the South Tibetan Detachment (STD), the Main Central thrust (MCT), the Main Boundary thrust (MBT), the Main Dun thrust (MDT), and the Main Frontal thrust (MFT).
162 M. Attal and J. Lavé
single virtual sample. Such a representation will help us to look more at the details and misfit of model 10G. First, as already discussed in section 4.4.1 for the southern Tibetan tributar-ies Naur and Dudh Khola (Fig. 6A), the gneiss/limestone ratio increases dramatically in that segment (zone 2), much more than predicted by the model. The differences of lithologic composition between gravel bar material and terrace deposit in Chame could suggest, however, that the present distribution in this zone of the upper Marsyandi Valley (zone 2) is a temporary situation. The sudden increase in crystalline pebbles may arise from a com-plex erosional pattern, in terms of volume and size distribution of the sources, due to the interplay between broadly distributed erosion of formerly glaciated landscapes and localized regres-sive erosion of the fluvial network that tries to reach equilibrium profiles. Alternatively, the anomalous lithologic composition of the downstream Chame gravel bars could reflect the stochas-tic behavior of sediment supply. The second misfit concerns the downstream increase of the quartzite/gneiss ratio, underesti-mated by our model. Several explanations can be proposed: an underestimation of the hillslope erosion rate in the Lesser Hima-laya, of the quartzite proportion in Lesser Himalayan units, or more likely of the abrasion coefficient for gneiss. The third misfit concerns the schists, underestimated by our model: this appears to be due to the fact that we both replaced dispersed values of abrasion coefficients (Table 1) by a single average value (a sim-
plifying assumption that can introduce a systematic bias since relation [equation 5] is nonlinear in k
j), and also to a systematic
misattribution in the field of micaceous sandstone to schist. Sim-ilarly, the attribution of fine sandstone with calcareous cement
0
2
4
6
8
10
12
14
16
0 20 40 60 80 100 120 140 160 180 200 220
Distance from source (km)
D50
(cm
)
STD MCT MBT MDT
Marsyandi gravel bar
Tributary gravel bar
model (C) = DD, K = 2 % /km, LD model (D) = DD, K(L), LD model (E) = UD, K(L), LDmodel (F) = DD, K(L) x 5, LDmodel (G) = DD, K(L), LD + MD
Figure 11. Downstream evolution, along the Marsyandi River, of the median size in the measured subsurface gravel bar material and in bedload as predicted by the different models. D
50 has been deter-
mined by removing particles finer than 1 mm to be directly comparable with mod-eled bedload D
50 values (particles finer
than 1 mm are considered as suspended load in the model). Vertical bars show the range of values obtained from different sampling points on each measurement site. Modeled curves: DD—differential denudation, UD—uniform denudation, K(L)—abrasion coefficient depending on lithology (experimental values), LD—landslide distribution for source, MD—moraine distribution for source. D
50 ob-
tained from the model are systematically smaller than field values. The two-sources model is the only one that achieves partial reproduction of the observed downstream coarsening, showing the importance of source characteristics in controlling river sediment characteristics. The major faults are the South Tibetan Detachment (STD), the Main Central thrust (MCT), the Main Boundary thrust (MBT), and the Main Dun thrust (MDT).
Figure 12. (A) Downstream evolution of the size distribution, aver-aged by zone, for subsurface gravel bar material coarser than 5 cm. Lithologies have been isolated and the contribution of each fraction is expressed in percent of the total weight of the material. Dark-gray columns correspond to field data and light-gray ones to the model 10G, with differential erosion rates, K depending on lithology, and two source distributions. Under-representation of coarsest fractions by field measurement methods appears clearly. (B) Downstream pro-files of D
50* for crystalline and quartzite pebbles larger than 5 cm in
sub-surface gravel bar material along the Marsyandi River. Dark gray lines correspond to the mean values by zone for the field data and light gray lines to modeled data. The major faults are the South Tibetan Detachment (STD), the Main Central thrust (MCT), the Main Bound-ary thrust (MBT), and the Main Dun thrust (MDT). Zone 1—Tethyan Series; Zone 2—Upper Higher Himalayan Crystalline (between STD and Dudh Khola); Zone 3—Lower Higher Himalayan Crystalline (between Dudh Khola and MCT); Zone 4—Upper Lesser Himalaya (between MCT and Dordi Khola); Zone 5—Middle Lesser Himalaya (between Dordi and Chudi Khola); Zone 6—Lower Lesser Himalaya (between Chudi Khola and the confluence with the Trisuli River); Zone 7—Trisuli River across the Mahabarat (between the confluence with the Marsyandi and Narayangadh).
0 %
10 %
20 %
30 %
A B C D EA B C D E A B C D E A B C D E A B C D E A B C D E A B C D E
Percent weight of material coarser
than 50 mm
0 %
10 %
20 %
30 %
A B C D EA B C D E A B C D E A B C D E A B C D E A B C D E A B C D E
0 %5 %
A B C D EA B C D E A B C D E A B C D E A B C D E A B C D E A B C D E
0 %
5 %
A B C D EA B C D E A B C D E A B C D E A B C D E A B C D E A B C D E
Zone 1 Zone 2 Zone 3 Zone 4 Zone 5 Zone 6 Zone 7
0 %
10 %
20 %
A B C D EA B C D E A B C D E A B C D E A B C D E A B C D E A B C D E
Grain size (b-axis) class:A = 50–80 mm - B = 80–160 mm - C = 160–320 mm - D = 320–640 mm - E > 640 mm
164 M. Attal and J. Lavé
to limestone could explain the complete absence of sandstone in our data along the upper Marsyandi.
Finally, the histograms of Figure 12A show that the observed distribution peaks are systematically displaced toward coarser fraction for quartzite and gneissic pebbles in comparison to the model. However, both lithologies show surprisingly good agree-ment between modeled and measured D
50* (Fig. 12B), where
D50*
corresponds to the D50
value determined for the fraction coarser than 5 cm. This result suggests firstly that the shift in peak distribution in the field data histograms compensates for the absence of the largest pebble size, which is poorly taken into account in the field measurements (see discussion in section 4.2 on procedures bias for the coarsest fraction), and second that most of the misfit observed in Figure 11 between modeled and measured D
50 is related to a depletion in the gravel fraction (1–50
mm) in bar material compared to the model.
6. DISCUSSION
6.1 Why is Gravel bar Material Coarser than Hillslope Material Supplied to the Fluvial Network?
A major remaining unanswered question is why the gravel bar material is generally coarser than the source material? In the absence of comparable studies that would have stressed a simi-lar problem, we can envisage several hypotheses. The apparent discrepancy might arise first from our data set, second from our model of pebble abrasion, and third from the misleading hypothesis that gravel bar material is representative of the bed-load material.
The main weakness of our sampling procedure relates to the insufficient volume we analyzed in each station. As already dis-cussed in section 4.2, the size distribution obtained by volumetric sampling is prone to large uncertainties and leads to a systematic cut-off for the coarsest fraction. The observed distributions are characterized by a systematic absence of boulders larger than 0.4 m (Fig. 5), in contrast with what is predicted by the integrative model. However, a few joint volumetric and surface analyses in sections indicate that D
50 values are not too sensitive to this cut-
off. On gravel bars, the counting procedure cannot in any case be the source of the coarsening effect relative to hillslope material, because the bias would play in the opposite sense. In contrast, for landslide deposits, this bias could lead to an underestimation of the median size of the distributions. However, even distribu-tions from photo counting do not display median sizes larger than 80 mm. Despite a low number of measurement sites in landslide deposits, it would be surprising that all the measurements could be finer than average material from landslide deposits. By pref-erentially choosing the core of the landslide deposits, we could have missed the coarsest fractions that are concentrated both at the surface and downhill part of the deposit. Clarifying this point would require additional detailed studies of the size dis-tribution of the bulk of a landslide. Finally, it should be noted that the downstream evolution in size distribution and D
50* (Fig.
12B) does not indicate any major differences between gneiss and quartzite pebbles, even in the Lesser Himalaya where hillslope supply of gneissic pebbles has stopped. This observation argues against the fact that the coarsening observed in gravel bars across the Lesser Himalaya could result from a major change in source characteristics in the Lesser Himalaya. Two additional observa-tions corroborate this conclusion: first, the size distributions for landslides initiated in Higher Himalayan Crystalline gneissic (Formation I) units and Lesser Himalayan quartzitic units do not appear to differ significantly; and second, the gravel bar material along the tributaries that drain the Lesser Himalayan units do not show coarser material than along the Marsyandi.
In our model, we assumed that abrasion coefficients are independent of particle size. For unimodal size distribution, experimental results (Kuenen, 1956; Attal, 2003) indicate that the abrasion coefficient increases with particle size. However, for mixed pebble size distributions, very preliminary results obtained in our abrasion experimental device suggest that the abrasion coefficient is in fact inversely proportional to particle size (Attal, 2003), probably because shocks with larger impacting pebbles strongly enhance relative weight loss of small impacted pebbles, either by abrasion, crushing, or splitting. In this case, abrasion during transport could lead to a rapid depletion in gravel and small pebble fractions, and therefore to a coarsening of the particles traveling as bedload. This hypothesis, however, needs a more quantitative support from future experimental work.
Up to now, we assumed that subsurface gravel bar material is representative of the bedload material. This hypothesis, sup-ported by flume experiments (e.g., Parker and Klingeman, 1982), is closely tied to the notion of equal mobility transport in gravel rivers. Wilcock and Southard (1989) showed that these results are strongly dependent on the experimental device and that sediment-recirculating flumes lead to distinct distribution of subsurface material and bedload. However, they also suggested that natural systems might behave like a sediment-fed flume with the equal mobility scenario. We are not aware of many field studies on mountain rivers that try to compare size distributions of bedload during peak flow and of gravel bar material at low stage. Haber-sack and Laronne (2001) made such a comparison for a Swiss mountain river and found that subsurface material was much coarser than bedload at intermediate- to high-flow stages; unfor-tunately, they did not conduct sampling during the peak discharge. Experimental results, even in recirculating flumes (Wilcock and McArdell, 1997; Wilcock, 1997), indicate that full mobility of all pebble sizes is met when the average shear stress reaches three times the critical shear stress to set the median pebble size in motion. However, this criterion is not completely fulfilled by the coarsest fraction, and even with full mobility, the coarse fraction does not reach an equal mobility, i.e., the bedload transport rate decreases for large pebble size (Wilcock and McArdell, 1997). This last point implies that large pebbles travel at lower veloc-ity than small pebbles. As a consequence, the residence time of the coarse pebbles from hillslopes to the high-order channels has to be longer: at low stage, when all pebbles are at rest on the
Changes of bedload characteristics along the Marsyandi River 165
gravel bars, the coarse fractions are therefore over-represented compared to the instantaneous bedload flux during peak flow or bedload motion conditions (Fig. 13). Along the Marsyandi chan-nel and gravel bars, fluted blocks several meters in size attest that the largest blocks are almost immobile (Fig. 4A). This suggestion of differential travel velocities is equivalent to considering that there is a continuous decrease in velocity from a maximum for small and median sizes to almost 0 for the coarsest size.
More generally, we do not know exactly how gravel bars or channel bottom exchanges subsurface material with bedload via its surface layer (Parker, 1991) and how a gravel bar is built from the bedload material. From experimental results, we can suspect that these exchanges between gravel bar material and bedload depend on hydrodynamic conditions, in particular on fluvial shear stress during transporting conditions (Parker, 1990; Wil-cock and McArdell, 1997). At high shear stress conditions, full mobility conditions would favor the equivalence in pebble size distributions between bedload and subsurface gravel bar material, whereas at intermediate shear stress conditions, the subsurface material would be coarser than the bedload. Along the Marsyandi River, the shear stress profile (Lavé and Avouac, 2001) would be consistent with such a view: the shear stress values prevail-ing across the Lesser Himalaya are much lower than across the Higher Himalayan Crystalline and would lead to coarser median pebble size for gravel bars (Fig. 14). In conclusion, as long as equal mobility conditions have not been fully met during peak flows in mountain rivers, we can cast doubt about the fact that subsurface gravel bar material can be used as a representative proxy of bedload material. In the Marsyandi Valley, the discrep-
ancy observed between sources and gravel bar material could arise from such a biased hypothesis.
6.2 Pebble Abrasion, Sediment Supply, and Transport Modalities Across Active Orogens
In previous studies of pebble size evolution along rivers, experimentally derived abrasion coefficients were not able to explain downstream fining. Several explanations were proposed for this observation: (1) in settings where deposition is occurring, selective transport is a more efficient downstream fining process than abrasion (Brierley and Hickin, 1985; Parker, 1991; Paola et al., 1992; Brewer and Lewin, 1993; Surian, 2002); (2) when long-term gravel storage in gravel bars and terraces occurs, the role of weathering could have a major impact by increasing abra-sion coefficients (Bradley, 1970; Jones and Humphrey, 1997); (3) an underestimation of abrasion coefficients in experimental mills has also been advocated, because of miscalculation of travel-ing distances (Mikos and Jaeggi, 1995) or because experimental devices do not reproduce saltating pebble trajectories (Kodama,
D
NS(D)(%)
D
NBL(D)(%)
D
NGB(D)(%)
Ψ(x)
D
NBL(D)(%)
Ψ(x + dx)∆Ψ
Averagesources =
Ψ(D) = N(D) x v(D)
v(D)
She
ar s
tress
(N
/m2 )
TSS HHC LH
A
B
0
2
4
6
8
10
12
14
16
18
0 20 40 60 80 100 120 140 160 180
STD MCT
Marsyandi gravel barTributary gravel bar
Distance from source (km)D
50 (c
m)
0
250
500
750
1000
1250
1500
1750
2000
Figure 14. (A) Shear stress profile computed for the 10 yr return peak flow conditions adapted from Lavé and Avouac (2001). Shear stress values display a maximum across the Higher Himalaya: here, full mobility conditions would favor the equivalence of size distribution between bedload and subsurface gravel bar material. In the Lesser Himalaya, low shear stress values may explain the observed coarsen-ing of gravel bar material, in particular the median size of subsur-face material (B). The major faults are the South Tibetan Detachment (STD) and the Main Central thrust (MCT). Domains are TTS—Teth-yan Sedimentary Series, LH—Lesser Himalaya, and HHC—Higher Himalayan Crystalline.
Figure 13. Differential motion diagram: for a given pebble size D, bed-load flux Ψ(D) across a river segment is equal to the number N(D) of particles of size D multiplied by their average traveling velocity v(D). If particles move at the same velocity independent of their size, bed-load size distribution N
BL(D) is equal to the size distribution N
GB(D)
of the sediment stored on gravel bars and channel bottom at low-flow stage. If large particles move slower than small ones, sediments stored on gravel bars at low flow are coarser than bedload. For the sake of simplicity, no significant abrasion has been considered in this diagram, and, consequently, bedload size distribution N
BL(D) is equal to the size
distribution NS(D) of the hillslope sources of material.
166 M. Attal and J. Lavé
1994b). In the case of active orogens, like the central Himala-yas, the two first explanations can be discarded. Even if there is a factor 1–20 above previous estimates (e.g., Kuenen, 1956), the increase in abrasion coefficient by two orders of magnitude required to explain field downstream fining (Kodama, 1994b) is not observed in our experimental measurements, which more or less reproduce the hydrodynamic conditions along the lower Marsyandi during a decadal flood. Thus, our study shows that downstream fining cannot provide a direct and visual estimate of pebble abrasion rate. First, grain size distributions result both from downstream abrasion processes and from the hillslope sup-ply in fresh material: the mean pebble size fining rate is therefore not expected to reflect pebble abrasion rate in a straightforward manner, except in few cases when abrasion coefficients are low (when the asymptotic behavior described in section 2 is not yet reached), or when the sediment source is restricted to the upper part of the watershed. Second, in many morphotectonic settings, as in the Marsyandi Valley, the size distribution of hillslope source material, and/or erosion rates are spatially nonuniform. In addition, the different lithologies exposed in the watershed can have very distinct abrasion coefficients. These complexities make the downstream evolution in grain size ever more difficult to interpret. Finally, it is suspected that the pebble size distribu-tion on gravel bars does not exactly reflect the bedload distri-bution and could depend on hydrodynamic conditions, and thus lead to erroneous interpretation. We therefore strongly suspect that the size distribution and median pebble size on gravel bars do not constitutes pertinent variables when studying pebble abra-sion in active orogens.
Instead, on the basis of the Marsyandi River case study, we propose that the lithologic content of gravel bars bar material rep-resents a much more sensitive tool to unravel pebble abrasion coefficients. Lithologic content is only weakly sensitive to sam-pling procedure (Figs. 6A and 6B) and to hydrodynamic condi-tions. It also seems only weakly sensitive to the size distribution of hillslope source material. However, it requires having a rough map of the erosion rates, as well as of the exposed lithologies. Ultimately, these parameters have to be included into an integra-tive model, and inverse models have to be run to adjust the differ-ent abrasion coefficients. According to the Marsyandi case study, the inversion results are sensitive to: (1) the estimate of lithologic content in the different geologic units, and the manner vertical proportions from geologic cross sections are transformed into surface proportions; (2) the lithologic sorting criteria, which has to coincide with those described in regional geologic maps and cross sections; and (3) the estimate of the local hillslope supply rates at a relevant temporal scale, i.e., of the order of the average time required by a pebble to travel from its hillslope source to the outlet of the range.
Following the above procedure in the Marsyandi Valley, but using experimental abrasion coefficients, it can be shown that our observations are fully consistent with a simple model in which abrasion is the only factor of downstream fining, as expected in a uniformly eroding landscape. Even the predicted ratio of bedload
to total sediment flux, between 12% and 18% for the major rivers at the outlet of the Himalayan range (Fig. 15), is in reasonable accord with values usually assumed by engineers when planning dam construction in active mountains setting. These ratios obvi-ously represent a maximum, since other hillslope sources deliv-ering mostly fine-grained material (e.g., soil erosion, shallow landslides) have not been included in model sediment budgets, and also because a higher proportion of fine material produced by landslides occurring in schist units is not incorporated (Fig. 5A).
Finally, according to our results, the best strategy for studying abrasion along the fluvial network in an active orogen is to look at the lithologic composition of the surface material, because it is roughly similar to the subsurface material but easier to study.
Our work also shows that moraines and landslides deliver different sediment size distributions to the river network, as sug-gested both by direct measurements on sediment sources and by the smaller pebble sizes along the upper Marsyandi reaches. Even landslide deposit characteristics can vary greatly between schist and quartzite sources (Fig. 5A). The sediment supplies from the hillslope can thus be subject to important spatial variations, due to distinct erosion processes, or distinct lithologies. These varia-tions have a direct incidence on the bedload ratio and on the size of the particles transported by the river network, and therefore on the balance between sediment load and river carrying capacity. In recent years, several investigators have argued that sediment flux, and in particular the balance between bedload and carrying capacity, strongly influences the rate and mode of fluvial incision into bedrock (Sklar and Dietrich, 1998, 2001; Howard, 1998; Hancock et al., 1998; Whipple and Tucker, 2002). However, the downstream loss of mass for the bedload fraction is not taken into account by most of the models developed. At the scale of the Marsyandi or Narayani basins, our model results indicate a bedload ratio decrease by a factor ~5 between the source and the mountain front (Fig. 15). This bedload ratio can be crudely
Figure 15. Bedload proportion relative to the total sediment flux pre-dicted by our integrative model (10G) with differential denudation rates, abrasion coefficients from experimental studies, and two dis-tinct hillslope source size distributions. The average proportion of material coarser than 1 mm in landslide and moraine material are also represented.
00,10,20,30,40,50,60,70,80,9
1
100 1000 10000 100000
Bed
load
pro
porti
on (Q
b /Qs )
Drainage area (km2)
LandslidesMoraines
Changes of bedload characteristics along the Marsyandi River 167
approximated by a power law with an exponent −0.2. This down-stream decrease in bedload is significant enough to be introduced in transport-limited or mixed-tools fluvial incision models, and in landscape evolution models. Thus, exponent values close to –0.5, as implicitly assumed by Whipple and Tucker (2002) in order to explore the behavior of detachment-limited incision models, appear to be too low in view of our results along the Marsyandi Valley. Moreover, the non-monotonous behavior of the bedload ratio curve, due to change in lithology, sources, and local hill-slope supply rates can eventually produce, in a given setting, sev-eral channel segments where the river would be alternately more detachment- or transport-limited.
The variations in proportion of fine sediment and median size of the sediment supply between moraines and landslide material may also have a profound impact on river behavior in response to glacial-interglacial climatic changes. The proportions of both types of material are expected to vary strongly with climate and the advance or retreat of glaciers. These changes in load size characteristics, in addition to variations in discharge or sediment flux, could in particular have a nontrivial impact on the building of alluvial or avalanche fans or on terrace formation downstream of formerly glaciated valleys (Hancock and Anderson, 2002; Pratt-Sitaula et al., 2004). On the other hand, a recent study in the San Gabriel Mountains (Lavé and Burbank, 2004) suggests a progressive replacement of shallow erosion processes (dry and wet raveling, soil slip, shallow landslides, etc.) by more deep-seated landslides when erosion and uplift rates increase in active mountains. In such a scenario, the ratio of coarse to fine material and the median size of the coarse material delivered by hillslopes to the fluvial network are expected to increase dramatically around this transition and to affect fluvial downcutting modali-ties. Similarly, when a landscape is rejuvenated with regressive erosion propagating upstream and triggering more landslides, the increased supply of coarser sediment from the hillslopes can represent a negative feedback to river incision and landscape ero-sion. If such processes and catena could be confirmed and quan-tified in more detail, they would represent additional coupling between hillslopes and the fluvial network, which possibly have been underestimated until now.
6.3 Pebble Abrasion Coefficients, Bedrock Erodibility, and Mountain Denudation
The differences in abrasion coefficients obtained experi-mentally, roughly corroborated by the comparison between integrative model results and data along the Marsyandi, are con-sistent with the differences of erodibility coefficients derived from river profiles and terrace incision rates along Himalayan rivers (Lavé and Avouac, 2001). For the main structural units, the ratio between the average pebble abrasion coefficients is of the same order as the ratio between average bedrock erodibility coefficients. The abrasion rates and bedrock erosion efficiency are both 10–20 times lower for gneiss than for the Siwalik sand-stones, and roughly of the same order for Higher Himalayan
Crystalline and Lesser Himalayan units, if we assume that the average bedrock erodibility is partially constrained by the most resistant lithologies outcropping in the channel (Foley, 1980), i.e., quartzites and sandstone for the Lesser Himalaya. This would suggest that fluvial incision rates and river geometry are quite sensitive to the incised lithologies, as has been suggested by Sklar and Dietrich (2001), and that abrasion by bedload would be the dominant process of river incision. Indeed, except if there is a causal relationship between lithologic abrasion coefficient and the degree of fracturation, a mechanism like plucking would not be sensitive to the incised lithologies in the same manner as observed from pebble abrasion. Thus, lithologies have a dual role: first, because they control source characteristics, bedload fraction, pebble size distribution, and abrasion rate during flu-vial transport, the lithologies of the contributing area have a long-distance effect on the bedload flux and mobility, i.e., on the coverage effect of the channel bottom and thus on the exposure of bedrock to abrasion and plucking; second, the local lithology directly impacts the detachment rate when bedrock is exposed (local effect).
According to our abrasion data (Table 1), abrasion coeffi-cients in natural lithologies can vary by more than two orders of magnitude. This can have fundamental consequences on tec-tonic-erosion coupling, on the equilibrium elevation of moun-tain ranges, and on the rate of topographic decrease for moun-tains and relief after tectonic cessation. Granitic cores in ranges would help to maintain high elevation, even with subdued uplift. In contrast, schist massifs or thin-skinned tectonic folds com-posed dominantly of weak sandstone can respond to high uplift rates without developing high topography and a steep fluvial network. These soft lithologies are therefore more able to cope with high uplift rates and to maintain a dynamic equilibrium with high erosion rates. This could explain why mountains char-acterized by moderate tectonic activity (Alps, Kyrgyz Ranges) can maintain topographies as high as very active schist- and sediment-dominated ranges (Southern Alps, Taiwan Range).
7. CONCLUSIONS
To our knowledge, this contribution represents the first attempt to study jointly hillslope sediment supply and gravel bar material at the scale of a 4000 km2 basin, and to couple them in an integrative model. Despite questions being left because of uncertainties in measurements, this kind of approach brings new insights on sediment evolution along the fluvial network in active orogens. We highlight below the important implications of our study in the Marsyandi Valley and some avenues for further investigations.1. Many former studies on downstream evolution of pebble
size and lithologic composition have focused on unravel-ing the respective roles of selective sorting and abrasion, in particular looking at apparent fining rates. However, this study, like Heller et al. (2001), shows that, except in particular settings, the pebble size evolution is not a very
168 M. Attal and J. Lavé
relevant variable: in active orogens, particle size is more sensitive to the size distribution of the local hillslope sediment supply and to their temporal variations than to abrasion processes. Moreover, we strongly suspect that the subsurface grain size distribution on gravel bars is significantly coarser than the average bedload size dis-tribution, in contradiction with the assumption derived from the equal mobility concept in high-energy rivers. In the Marsyandi Valley, the erosion and transport pro-cesses have led to a paradoxical downstream coarsening of the gravel bar material. In addition, this material is found to be coarser than the sediments delivered to the fluvial network from the hillslopes. Gravel bar material in active tectonic settings would therefore represent a poor estimator for average downstream evolution of the transported bedload. In contrast, pebble abrasion can be more easily evidenced by the downstream evolution of the lithologic composition of gravel bars, because its measure displays larger variations and is less sensitive to methodological bias and hillslope sediment supply.
2. As expected from theoretical considerations for active orogens, it is not necessary to invoke selective sorting processes to explain the downstream lithologic and size evolution of pebbles along an incising river system. In addition, and in contrast with former studies, the abra-sion coefficients required by our simple integrative model of downstream sediment evolution are consistent with experimentally derived abrasion coefficients.
3. The differences in abrasion coefficients are comparable with differences in erodibility coefficients as derived from bedrock incision (Lavé and Avouac, 2001), sug-gesting that abrasion could be the dominant process in bedrock river incision. Depending on lithology, the abrasion coefficient can vary by more than two orders of magnitude: the eroded lithology could therefore have a major influence on the denudation and tectonic history of active orogens, as well as on postorogenic decay.
4. Finally, our study shows that hillslope sediment sup-ply (landslides, moraines, etc.) may have a major sig-nature in the downstream evolution of pebble size and suspended/bedload ratio. Recent theoretical and experi-mental investigations have stressed the importance of sediment supply and size in controlling bedrock incision rates. The variations in size distribution from hillslope sediment supply could therefore have important impli-cations on river profile development and on the response of the fluvial network to glacial-interglacial fluctuations. They could also introduce some additional internal cou-pling between hillslopes and the fluvial network.
ACKNOWLEDGMENTS
We are most grateful to Tank Ojha and “Himalayan Experi-ence” for the help and technical support in the organization of the
field surveys. The manuscript benefited from thorough comments and syntax corrections by Pieter van der Beek and Alexander Whittaker. We are indebted to Douglas Burbank for having finan-cially supported our field work through National Science Foun-dation Continental Dynamic Program (grant ERA-99-09647). Experimental and modeling work conducted at the Laboratoire de Géodynamique des Chaînes Alpines was supported by the Institut National des Sciences de l’Univers programs “coup de pouce” and Programme National de Recherches en Hydrologie.
APPENDIX A: B-AXIS AND CORRECTION FACTORS OF PEBBLE DIMENSION
Appendix A.1.
In order to display and compare size distributions from our differ-ent sampling and/or counting procedures, we defined a common vari-able for pebble dimension. We choose to consider the b-axis of the particles, i.e., their intermediate axis. For each sampling procedure, we therefore derived a specific correction factor to convert the measured pebble size into the corresponding b-axis value. On tape measure line, the b-axis was directly measured on particles with a caliper. For the photo determination, we consider that most pebbles are imbricated and that the (a-b)-axes section is roughly horizontal. In this case, the b-axis corresponds to the smallest visible axis on photos. However, pebbles are often partly buried and some (a-b)-axes section strongly deviate from the horizontal. For these reasons, the b-axis tends to be underes-timated on photos.
For subsurface samples, we used square mesh sieves. If the (b-c)-axes section was a circular one, sieving would give direct results. Unfortunately, it is rarely the case and sieving tends to underestimate the b-axis value of pebble sizes, due to the fact that particles with the b-axis longer than the mesh size can pass through the sieve. To correct the result from this effect, we used measurements of b- and c-axis real-ized on tape measure lines. About 1000 pebbles were measured, 15–60 pebbles per site. Maximum value of b/c was 6.2, mean value per site ranged between 1.5 and 2.5. For the whole pebble set, the average value of b/c was 1.9. This value corresponds to an underestimation of the b-axis by sieve dimension of 25% (see calculation in Appendix A.2.). No trend appears along the river course, showing that global pebble shape does not change significantly. For subsurface particles coarser than 4 cm, each particle was weighed. The b-axis was deter-mined by considering a sphere with a density of 2700 kg/m3. The error is thus directly linked to the shape of the particle: the b-axis is overesti-mated for an elongated pebble, whereas it is underestimated for a platy pebble. From the measures made on the same 1000 pebbles, the ratio r
b
= b/(abc)1/3 was calculated, with (abc)1/3 corresponding to the diameter of the sphere of equivalent volume, i.e., the b-axis deduced from the weight of the pebble. Values for r
b varied between 0.7 (elongated) and
1.8 (platy), the average values for the different stations ranged between 1.0 and 1.2. For the whole pebble set, the average value of r
b was 1.1.
Weighing pebbles led thus to an average underestimation of the b-axis of 10%. Like for the ratio b/c, the data did not show any significant downstream variations in pebble shape.
All the D50
values presented in the text body and figures corre-spond to an equivalent b-axis value, which has been calculated from our field measurements according to the above corrections.
Appendix 169
Appendix A.2
To calculate the maximum b-axis value of an elliptic pebble that passes through a square, we consider the parametric equation for a mesh of size s: y = -x + m, (8)where m
s=2
.
The equation describing the pebble is:
x
b
y
c
2
2
2
2
14
+ = , (9)
and its ellipse eccentricity kbc
= .
The parametric equation of the contact points between an elliptic pebble and the mesh is thus given by equations 8 and 9, and leads to a second-order polynomial equation:
(4 + 4k2) x2 – (8k2m²) x + (4k2m2 – b2 – (8k²m) x + (4k²m² – b²) = 0, (10)The solution for which is b
km
k
k
ks=
+=
+
2
1
2
12 2.
APPENDIX B: COMPARISON OF THE MEDIAN SIZE D
50 OBTAINED FROM TAPE MEASURE AND PHOTO
COUNTING
D50
values obtained by tape measure lines are systematically larger than D
50 values obtained by photo analysis. Several factors
relative to photo counting contribute to this systematic bias: first, the dimensions of partially hidden pebbles are underestimated; second, if the pebble is not oriented with its longest axis close to the horizon-tal, then measuring the shortest visible dimension also leads to an underestimation of the intermediate axis of the pebble; third, the area covered by a photo is generally 2 m wide, whereas tape measure lines are deployed on 15 m. The tape measure method therefore allows us to consider coarser particles than the photo method and leads to more representative results for the coarse fraction.
REFERENCES CITED
Armijo, R., Tapponnier, P., Mercier, J.L., and Han, T.L., 1986, Quaternary extension in southern Tibet: Field observations and tectonic implica-tions: Journal of Geophysical Research, v. 91, p. 13,803–13,872.
Attal, M., 2003, Erosion des galets des rivières de montagne au cours du transport fluvial: Étude expérimentale et application aux réseaux hydrographiques d’orogènes actifs [Ph.D. thesis]: Grenoble, France, Université J. Fourier, 279 p.
Attal, M., and Lavé, J., 2003, Pebble and bedrock abrasion during fluvial transport in active orogenic context: Experimental study and applica-tion to natural hydrographic networks: European Geophysical Society–American Geophysical Union–European Union of Geosciences Joint Assembly, Nice, France, Geophysical Research Abstracts, v. 5, p. 470.
Avouac, J.P., and Burov, E., 1996, Erosion as a driving mechanism of intra-continental mountain growth: Journal of Geophysical Research, v. 101, p. 17,747–17,769, doi: 10.1029/96JB01344.
Baldwin, J.A., Whipple, K.X., and Tucker, G.E., 2003, Implications of the shear stress river incision model for the timescale of postorogenic decay of topography: Journal of Geophysical Research, v. 108, no. B3, 2158, doi: 10.1029/2001JB000550.
Beaumont, C., Fullsack, P., and Hamilton, J., 1992, Erosional control of active compressional orogens, in McClay, K.R., ed., Thrust tectonics: London, Chapman and Hall, p. 1–18.
Benda, L., and, Dunne, T., 1997, Stochastic forcing of sediment routing and storage in channel networks: Water Resources Research, v. 33, p. 2864–2880.
Benett, M.R., and Glasser, N.F., 1996, Glacial geology: Ice sheets and land-forms: New York, John Wiley and Sons, 376 p.
Bradley, W.C., 1970, Effect of weathering on abrasion of granitic gravel, Colorado River (Texas): Geological Society of America Bulletin, v. 81, p. 61–80.
170 M. Attal and J. Lavé
Brewer, P.A., and Lewin, J., 1993, In-transport modification of alluvial sedi-ment: Field evidence and laboratory experiments: Special Publication of the International Association of Sedimentologists, v. 17, p. 23–35.
Brierley, G.J., and Hickin, E.J., 1985, The downstream gradation of particle sizes in the Squamish River, British Columbia: Earth Surface Processes and Landforms, v. 10, p. 597–606.
Burbank, D.W., Leland, J., Fielding, E., Anderson, R.S., Brozovic, N., Reid, M.R., and Duncan, C., 1996, Bedrock incision, rock uplift and threshold hillslopes in the northwestern Himalayas: Nature, v. 379, p. 505–510, doi: 10.1038/379505a0.
Burbank, D.W., Blythe, A.E., Putkonen, J.K., Pratt-Sitaula, B.A., Gabet, E.J., Oskin, M.E., Barros, A.P., and Ojha, T.P., 2003, Decoupling of erosion and precipitation in the Himalayas: Nature, v. 426, p. 652–655, doi: 10.1038/nature02187.
Burchfiel, B.C., Zhiliang, C., Hodges, K.V., Yuping, L., Royden, L.H., Chan-grong, D., and Jiene, X., 1992, The South Tibetan detachment system, Himalayan orogen: Extension contemporaneous with and parallel to shortening in a collisional mountain belt: Geological Society of Amer-ica Special Paper 269, 41 p.
Campy, M., and Macaire, J.J., 1989, Géologie des formations superficielles: Géodynamique–faciès–utilisation: Paris, Masson, 433 p.
Church, M., McLean, D.G., and Wolcott, J.F., 1987, River bed gravels: Sam-pling and analysis, in Thorne, C.R., Bathurst, J.C., and Hey, R.D., eds., Sediment transport in gravel bed rivers: New York, John Wiley and Sons, p. 43–79.
Colchen, M., Le Fort, P., and Pêcher, A., 1986, Annapurna-Manaslu-Ganesh Himal 1/200,000e geological map: Paris, Editions du Centre National de la Recherche Scientifique, 136 p., scale 1:200,000.
Displas, P., and Sutherland, A.J., 1988, Sampling techniques for gravel sized sediments: Journal of Hydraulic Engineering, v. 114, no. 5, p. 484–501.
Duncan, C.C., Klein, A.J., Masek, J.G., and Isacks, B.L., 1998, Comparison of late Pleistocene and modern glacier extents in central Nepal based on digital elevation data and satellite imagery: Quaternary Research, v. 49, p. 241–254, doi: 10.1006/qres.1998.1958.
Foley, M.G., 1980, Bed-rock incision by streams: Geological Society of Amer-ica Bulletin, v. 91, p. 2189–2213, doi: 10.1130/0016-7606(1980)91<577:BIBSS>2.0.CO;2.
Fort, M., 1993, Etude géomorphologique d’une chaîne de collision intraconti-nentale: Memoire de Thèse de l’Université de Paris VII, 700 p.
Goede, A., 1975, Downstream changes in the pebble morphometry of the Tambo River, eastern Victoria: Journal of Sedimentology and Petrol-ogy, v. 45, p. 704–718.
Habersack, H.M., and Laronne, J.B., 2001, Bed load texture in an alpine gravel bed river: Water Resources Research, v. 37, no. 12, p. 3359–3370, doi: 10.1029/2001WR000260.
Hancock, G.S., and Anderson, R., 2002, Numerical modeling of fluvial strath-terrace formation in response to oscillating climate: Geological Society of America Bulletin, v. 114, p. 1131–1142, doi: 10.1130/0016-7606(2002)114<1131:NMOFST>2.0.CO;2.
Hancock, G.S., Anderson, R., and Whipple, K.X., 1998, Beyond power: Bed-rock river incision process and form, in Tinkler, K., and Wohl, E.E., eds., Rivers over rock: Fluvial processes in bedrock channels: American Geophysical Union Geophysical Monograph 107, p. 35–60.
Heller, P.L., Beland, P.E., Humphrey, N.F., Konrad, S.K., Lynds, R.M., McMil-lan, M.E., Valentine, K.E., Widman, Y.A., and Furbish, D.J., 2001, Para-dox of downstream fining and weathering-rind formation in the lower Hoh River, Olympic Peninsula, Washington: Geology, v. 29, p. 971–974, doi: 10.1130/0091-7613(2001)029<0971:PODFAW>2.0.CO;2.
His Majesty’s Government of Nepal Undertaking, 1994, Nepal Electricity Authority, Engineering Directorate Investment Department: Middle Marsyandi Hydroelectric Project, August (1994), 122 p.
Hovius, N., Starck, C.P., and Allen, P.A., 1997, Sediment flux from a moun-tain belt derived by landslide mapping: Geology, v. 25, p. 231–234, doi: 10.1130/0091-7613(1997)025<0231:SFFAMB>2.3.CO;2.
Howard, A.D., 1998, Long profile development of bedrock channels: Interac-tion of weathering, mass wasting, bed erosion, and sediment transport, in Tinkler, K., and Wohl, E.E., eds, Rivers over rock: Fluvial processes in bedrock channels: American Geophysical Union Geophysical Mono-graph 107, p. 237–260.
Howard, A.D., and Kerby, G., 1983, Channel changes in badlands: Geologi-cal Society of America Bulletin, v. 94, p. 739–752, doi: 10.1130/0016-7606(1983)94<739:CCIB>2.0.CO;2.
Howard, A.D., Dietrich, W.E., and Seidl, M.A., 1994, Modeling fluvial ero-sion on regional to continental scales: Journal of Geophysical Research, v. 99, p. 13,971–13,986, doi: 10.1029/94JB00744.
Jones, L.S., and Humphrey, N.F., 1997, Weathering-controlled abrasion in a coarse-grained, meandering reach of the Rio Grande: Implications for the rock record: Geological Society of America Bulletin, v. 109, p. 1080–1088, doi: 10.1130/0016-7606(1997)109<1080:WCAIAC>2.3.CO;2.
Kellerhals, R., and Bray, D.I., 1971, Sampling procedure for coarse fluvial sed-iments: Journal of Hydraulic Engineering, v. 97, no. 8, p. 1165–1180.
Knighton, A.D., 1982, Longitudinal changes in the size and shape of stream bed material: Evidence of variable transport conditions: Catena, v. 9, p. 25–34, doi: 10.1016/S0341-8162(82)80003-9.
Kodama, Y., 1994a, Downstream changes in the lithology and grain size of fluvial gravels, the Watarase River, Japan: Evidence of the role of abra-sion in downstream fining: Journal of Sedimentary Research, v. A64, p. 68–75.
Kodama, Y., 1994b, Experimental study of abrasion and its role in produc-ing downstream fining in gravel-bed rivers: Journal of Sedimentary Research, v. A64, p. 76–85.
Koons, P.O., 1989, The topographic evolution of collisional mountain belts: A numerical look at the Southern Alps, New Zealand: American Journal of Science, v. 289, p. 1041–1069.
Krumbein, W.C., 1941, The effects of abrasion on the size, shape and round-ness of rocks fragments: The Journal of Geology, v. XLIX, p. 482–520.
Kuenen, Ph.H., 1956, Experimental abrasion of pebbles: 2. Rolling by cur-rent: The Journal of Geology, v. 64, p. 336–368.
Kukal, Z., 1990, The rate of geological processes: Earth-Science Reviews, v. 28, 284 p.
Lavé, J., and Avouac, J.P., 2000, Active folding of fluvial terraces across the Siwaliks Hills (Himalayas of central Nepal): Journal of Geophysical Research, v. 105, p. 5735–5770, doi: 10.1029/1999JB900292.
Lavé, J., and Avouac, J.P., 2001, Fluvial incision and tectonic uplift across the Himalaya of central Nepal: Journal of Geophysical Research, v. 106, p. 26,561–26,592, doi: 10.1029/2001JB000359.
Lavé, J., and Burbank, D, 2004, Erosion rates and patterns in the Transverse Ranges (California): Journal of Geophysical Research, v. 109, doi: 10.1029/2003JF000023.
Le Fort, P., 1986, Metamorphism and magmatism during the Himalayan col-lision, in Coward, M.P., and Ries, A.C., eds, Collision tectonics: Geo-logical Society [London] Special Publication 19, p. 159–172.
Mezaki, S., and Yabiku, M., 1984, Channel morphology of the Kali Gandaki and the Narayani Rivers in central Nepal: Journal of Nepal Geological Society, v. 4, p. 161–176.
Mikos, M., and Jaeggi, M.N.R., 1995, Experiments on motion of sediment mixtures in a tumbling mill to study fluvial abrasion: Journal of Hydrau-lic Research, v. 33, p. 751–772.
Molnar, P., and England, P., 1990, Late Cenozoic uplift of mountain ranges and global climate change: Chicken or egg?: Nature, v. 346, p. 29–34, doi: 10.1038/346029a0.
Paola, C., Parker, G., Seal, R., Sinha, S.K., Southard, J.B., and Wilcock, P.R., 1992, Downstream fining by selective deposition in a laboratory flume: Science, v. 258, p. 1757–1760.
Parker, G., 1990, Surface-based bedload transport relation for gravel rivers: Journal of Hydraulic Research, v. 28, no. 4, p. 417–436.
Parker, G., 1991, Selective sorting and abrasion of river gravel. I. Theory: Journal of Hydraulic Engineering, v. 117, no. 2, p. 131–149.
Parker, G., and Klingeman, P.C., 1982, On why gravel bed streams are paved: Water Resources Research, v. 18, no. 5, p. 1409–1429.
Pearce, T.H., 1971, Short distance fluvial rounding of volcanic detritus: Jour-nal of Sedimentary Petrology, v. 41, p. 1069–1072.
Pêcher, A., 1989, The metamorphism in the central Himalaya: Journal of Metamorphic Geology, v. 7, p. 31–41.
Pratt, B., Burbank, D.W., Heimsath, A., and Ojha, T., 2002, Impulsive allu-viation during early Holocene strengthened monsoons, central Nepal, Himalaya: Geology, v. 30, no. 10, p. 911–914, doi: 10.1130/0091-7613(2002)030<0911:IADEHS>2.0.CO;2.
Pratt-Sitaula, B., Burbank, D.W., Heimsath, A., and Ojha, T., 2004, Land-scape disequilibrium on 1,000–10,000 year scales, Marsyandi River, Nepal, central Himalaya: Geomorphology, v. 58, p. 223–241, doi: 10.1016/j.geomorph.2003.07.002.
Schelling, D., 1992, The tectonostratigraphy and structure of the eastern Nepal Himalaya: Tectonics, v. 11, p. 925–943.
Changes of bedload characteristics along the Marsyandi River 171
Schoklitsch, A., 1933, �ber die Verkleinerung der Geschiebe in Flussl�ufen,, A., 1933, �ber die Verkleinerung der Geschiebe in Flussl�ufen,A., 1933, �ber die Verkleinerung der Geschiebe in Flussl�ufen,, 1933, �ber die Verkleinerung der Geschiebe in Flussl�ufen,1933, �ber die Verkleinerung der Geschiebe in Flussl�ufen, Akademie Wissenschaft Wien, Mathematik-naturwissenschaft (Pro-ceedings of the Vienna Academy of Science), Section IIa: Sitzungsber, v. 142, p. 343–366 (in German).
Searle, M.P., 1999, Extensional and compressional faults in the Everest-Lho-tse massif, Khumbu Himalaya: Journal of the Geological Society of London, v. 156, p. 227–240.
Shaw, J., and Kellerhals, R., 1982, The composition of recent alluvial gravels in Alberta river beds: Alberta Research Council Bulletin, v. 41, 151 p.
Sklar, L., and Dietrich, W.E., 1998, River longitudinal profiles and bedrock incision models: Stream power and the influence of sediment supply, in Tinkler, K., and Wohl, E.E., eds., Rivers over rock: Fluvial processes in bedrock channels: American Geophysical Union Geophysical Mono-graph 107, p. 237–260.
Sklar, L.S., and Dietrich, W.E., 2001, Sediment and rock strength controls on river incision into bedrock: Geology, v. 29, p. 1087–1090, doi: 10.1130/0091-7613(2001)029<1087:SARSCO>2.0.CO;2.
Sklar, L.S., and Dietrich, W.E., 2004, A mechanistic model for river incision into bedrock by saltating bed load: Water Resources Research, v. 40, W06301, doi:10.1029/2003WR002496.
Sternberg, H., 1875, Untersuchungen �ber L�ngen- und Querprofile geschieb-, H., 1875, Untersuchungen �ber L�ngen- und Querprofile geschieb-H., 1875, Untersuchungen �ber L�ngen- und Querprofile geschieb-, 1875, Untersuchungen �ber L�ngen- und Querprofile geschieb-1875, Untersuchungen �ber L�ngen- und Querprofile geschieb-f�hrender Fl�sse: Zeitschrift f�r Bauwesen, v. 25, p. 483–506. Zeitschrift f�r Bauwesen, v. 25, p. 483–506.Zeitschrift f�r Bauwesen, v. 25, p. 483–506., v. 25, p. 483–506.v. 25, p. 483–506., p. 483–506.p. 483–506..
Surian, N., 2002, Downstream variation in grain size along an Alpine river: Analysis of controls and processes: Geomorphology, v. 43, p. 137–149, doi: 10.1016/S0169-555X(01)00127-1.
Whipple, K.X., and Tucker, G.E., 2002, Implications of sediment-flux-depen-dent river incision models for landscape evolution: Journal of Geophysi-cal Research, v. 107, no. B2, doi: 10.1029/2000JB000044.
Whipple, K.X., Kirby, E., and Brocklehurst, S., 1999, Geomorphic limits to climatically induced increases in topography relief: Nature, v. 401, p. 39–43, doi: 10.1038/43375.
Wilcock, P.R., 1997, The components of fractional transport rate: Water Resources Research, v. 33, no. 1, p. 247–258, doi: 10.1029/96WR02666.
Wilcock, P.R., and McArdell, B.W., 1997, Partial transport of a sand/gravel sediment: Water Resources Research, v. 33, no. 1, p. 235–245, doi: 10.1029/96WR02672.
Wilcock, P.R., and Southard, J.B., 1989, Bed load transport of mixed size sediment: Fractional transport rates, bed forms, and the development of a coarse bed surface layer: Water Resources Research, v. 25, no. 7, p. 1629–1641.
Willett, S.D., 1999, Orogeny and orography: The effects of erosion on the structure of mountain belts: Journal of Geophysical Research, v. 104, p. 28,957–28,981, doi: 10.1029/1999JB900248.
Willgoose, G., Bras, R.L., and Rodriguez-Iturbe, J., 1991, A coupled chan-nel network growth and hillslope evolution model, 1. Theory: Water Resources Research, v. 27, p. 1671–1684, doi: 10.1029/91WR00935.
Yamanaka, H., and Iwata, S., 1982, River terraces along the Middle Kali Gan-daki and Marsyandi Khola, central Nepal: Journal of the Nepal Geo-logical Society, v. 2, p. 95–111.