24
Trade patterns in the coal market Eoghan Cunningham, CEO - globalCOAL
| Date post: | 13-Jul-2015 |
| Category: |
Economy & Finance |
| Upload: | jenny-kent |
| View: | 479 times |
| Download: | 1 times |

Trade patterns in the coal market
Eoghan Cunningham, CEO - globalCOAL

Copyright © by globalCOAL 2001 - 2014
For today’s discussion…
• Changing trade flows
• Changes in the derivatives market
• Changing nature of market participants
• Conclusions

Changes in trade flows
Copyright © by globalCOAL 2001 - 2014
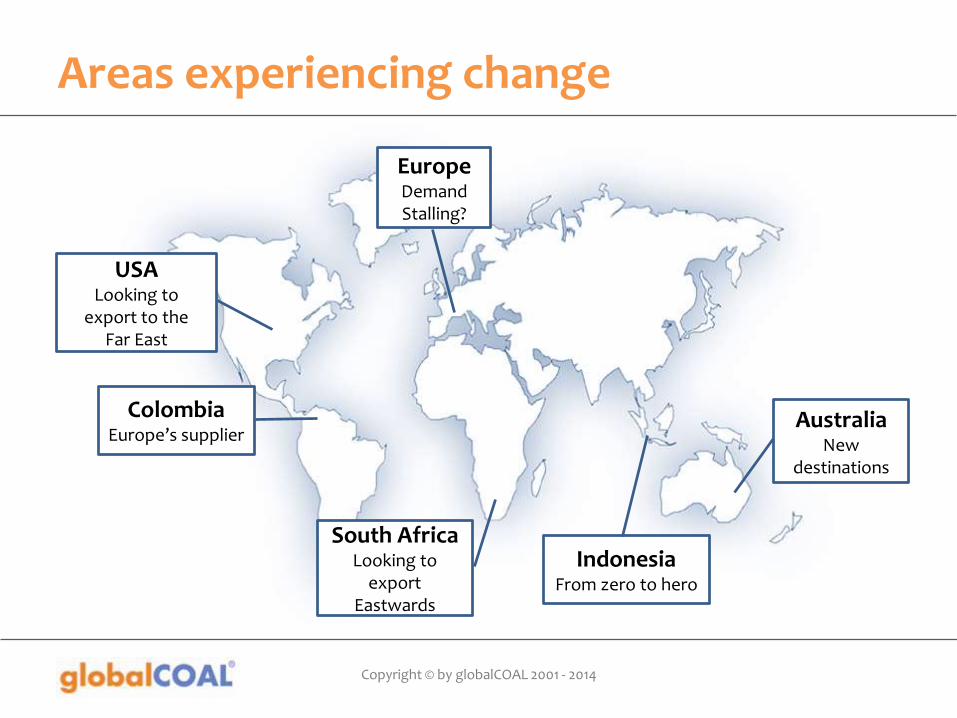
Areas experiencing change
EuropeDemand Stalling?
AustraliaNew
destinations
IndonesiaFrom zero to hero
South AfricaLooking to
export Eastwards
ColombiaEurope’s supplier
USALooking to
export to theFar East

Copyright © by globalCOAL 2001 - 2014
Europe stalls…
0
200
400
600
800
1,000
1,200
1,400
1,600
2005 2010 2015 2020 2025 2030 2035 2040
Mil
lio
n t
on
ne
s
Pacific
Atlantic
Sources: globalCOAL, Euracoal, IHS McCloskey
Atlantic vs Pacific Steam Coal Imports, 2005-2040

Copyright © by globalCOAL 2001 - 2014
South Africa turns to the East
Sources: globalCOAL, IHS McCloskey
0
10
20
30
40
50
60
70
80
90
100
2005 2010 2015 2020 2030 2040
Mil
lio
n t
on
ne
s
Atlantic
Pacific
Richards Bay Coal Terminal Thermal Coal Exports by Destination, 2005-2040

Copyright © by globalCOAL 2001 - 2014
South Africa turns to the East
0
5
10
15
20
25
30
35
40
45
2006 2007 2008 2009 2010 2011 2012 2013 2014*
Mil
lio
n t
on
ne
s
Taiwan
China
India
Sources: globalCOAL, IHS McCloskey
Richards Bay Coal Terminal Thermal Coal Exports to Key Asian Destinations, 2006-2014
*2014 annualised from Aug’14

Copyright © by globalCOAL 2001 - 2014
Australia diversifies
0
20
40
60
80
100
120
140
160
180
200
2000 2001 2002 2003 2004 2005 2006 2007 2008 2009 2010 2011 2012 2013 2014*
Mil
lio
n t
on
ne
s
China
Taiwan
South Korea
Japan
Sources: globalCOAL, IHS McCloskey
Australian Thermal Coal Exports by Major Asian Destination, 2000-2014
*2014 annualised from Aug’14

Copyright © by globalCOAL 2001 - 2014
Where to for Indonesia?
0
100
200
300
400
500
600
700
2000 2005 2010 2015 2020 2025 2030 2035 2040
Mil
lio
n t
on
ne
s
Sources: globalCOAL, IHS McCloskey
Growth of Total Indonesian Coal Exports, 2000-2040

Copyright © by globalCOAL 2001 - 2014
Where to for Indonesia?
Sources: globalCOAL, IHS McCloskey
Indonesian Coal Exports by Product, 2000-2014
Lignite
Sub-bit & other
Bituminous
*2014 annualised from Jun’14
0
50
100
150
200
250
300
350
400
450
2000 2001 2002 2003 2004 2005 2006 2007 2008 2009 2010 2011 2012 2013 2014*
Mil
lio
n t
on
ne
s
Sub-bituminous, Lignite & Other
Bituminous

Copyright © by globalCOAL 2001 - 2014
Where to for Indonesia?
0%
10%
20%
30%
40%
50%
60%
70%
80%
90%
100%
2000 2001 2002 2003 2004 2005 2006 2007 2008 2009 2010 2011 2012 2013 2014*
Sources: globalCOAL, IHS McCloskey
Indonesian Coal Exports by destination, 2000-2014
*2014 annualised from Jun’14
South Korea
Taiwan
JapanIndia & Pakistan
China
Other
?

Copyright © by globalCOAL 2001 - 2014
US prospects as a supplier
0
10
20
30
40
50
60
2000 2001 2002 2003 2004 2005 2006 2007 2008 2009 2010 2011 2012 2013 2014*
Mil
lio
n t
on
ne
s
Total US Coal Exports, 2001-2014
Sources: globalCOAL, IHS
Evolution of US Coal Exports by Destination, 2005-2035
0
10
20
30
40
2005 2015 2025 2035
Mil
lio
n t
on
ne
s
Pacific
Atlantic
*2014 annualised from Aug’14

Copyright © by globalCOAL 2001 - 2014
Colombia
Total Colombian Steam Coal Exports by Destination, 2000-2014
0
20
40
60
80
100
120
2000 2005 2010 2015 2020 2025 2030 2035 2040
Mil
lio
n t
on
ne
s
0
20
40
60
80
100
2000 2001 2002 2003 2004 2005 2006 2007 2008 2009 2010 2011 2012 2013 2014*
Mil
lio
n t
on
ne
s
Sources: globalCOAL, IHS
Europe
Far EastAmericas
*2014 annualised from Sep’14
Evolution of Colombian Coal Exports, 2000-2040

Changes in the derivatives market

Copyright © by globalCOAL 2001 - 2014
2014 derivatives market snapshot
API#22.5Bt
API#4500Mt
NEWC278Mt
API#834Mt
S/B Indo18Mt

Copyright © by globalCOAL 2001 - 2014
Significant growth in derivatives
*2014 annualised from Sept’14
Sources: globalCOAL, ICE, CME, SGX, EEX, FSA, LEBA
Growth in Coal Derivatives Volume, 2001-2014
0
500
1,000
1,500
2,000
2,500
3,000
3,500
4,000
2001 2002 2003 2004 2005 2006 2007 2008 2009 2010 2011 2012 2013 2014 *
Mil
lio
n t
on
ne
s
∆+6.6%

Copyright © by globalCOAL 2001 - 2014
Growth in clearing vs OTC
*2014 annualised from Sept’14
Sources: globalCOAL, ICE, CME, SGX, EEX, FSA, LEBA
Cleared and OTC Derivatives Volumes Growth, 2001-2014
0%
10%
20%
30%
40%
50%
60%
70%
80%
90%
100%
0
500
1000
1500
2000
2500
3000
3500
4000
2001 2002 2003 2004 2005 2006 2007 2008 2009 2010 2011 2012 2013 2014 *
% C
lear
ed
Mil
lio
n t
on
ne
s
Cleared OTC % Cleared (right axis)
Copyright © by globalCOAL 2001 - 2014
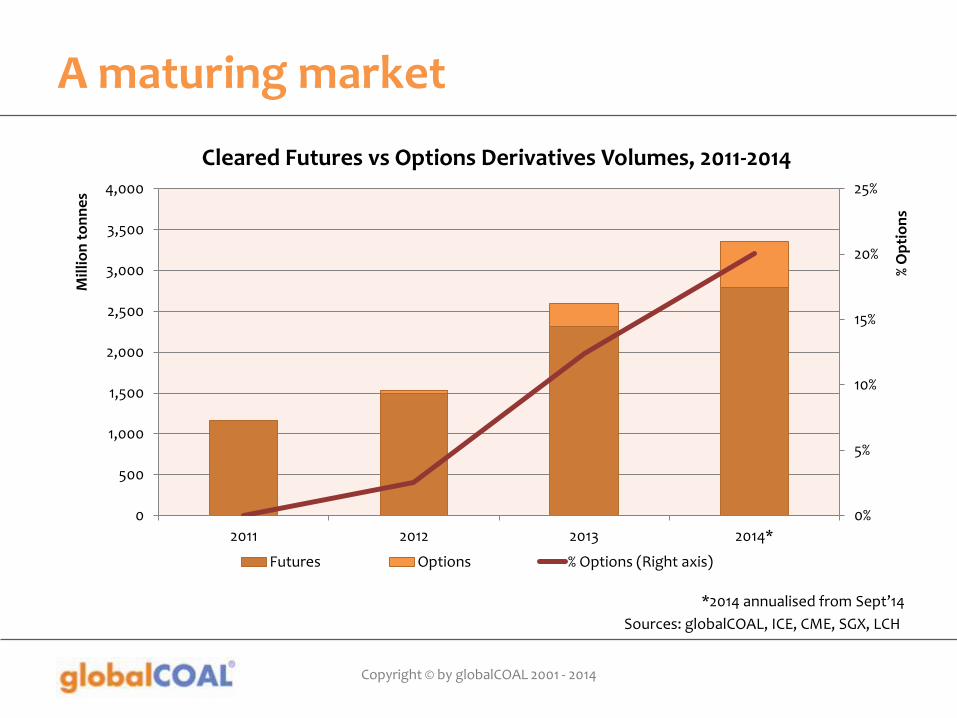
A maturing market
0%
5%
10%
15%
20%
25%
0
500
1,000
1,500
2,000
2,500
3,000
3,500
4,000
2011 2012 2013 2014*
% O
pti
on
s
Mil
lio
n t
on
ne
s
Futures Options % Options (Right axis)
*2014 annualised from Sept’14
Sources: globalCOAL, ICE, CME, SGX, LCH
Cleared Futures vs Options Derivatives Volumes, 2011-2014

Copyright © by globalCOAL 2001 - 2014
Pacific lag
Sources: globalCOAL, ICE, CME, SGX, LCH, Euracoal
Atlantic Market Pacific Market
0
500
1,000
1,500
2,000
2,500
3,000
Physical Financial
Mil
lio
n t
on
ne
s
0
500
1,000
1,500
2,000
2,500
3,000
Physical Financial
Mil
lio
n t
on
ne
s

Copyright © by globalCOAL 2001 - 2014
Commodity churn ratios
0
20
40
60
80
100
120
140
160
180
200
220
Pacificcoal
All coal Atlanticcoal
Cocoa Coffee Wheat Gas Oil Copper Crude Oil Henry HubGas
Sources: globalCOAL & others
Various Commodity Churn Ratios

The changing nature of market participants

Copyright © by globalCOAL 2001 - 2014
Financial institutions withdraw
Source: globalCOAL
Percentage of globalCOAL Volume by Participant Type, 2006-2014
0%
10%
20%
30%
40%
50%
60%
70%
2006 2007 2008 2009 2010 2011 2012 2013 2014
Rise of the commodity trader
Withdrawal of the Banks
Utility Traders Miners & Others

Copyright © by globalCOAL 2001 - 2014
Some conclusions…
• As European demand stalls, trade turns towards growth markets in the East
• Market preference for cleared derivatives increases as appetite for exposure to risk continues to decline
• Pacific trade in derivatives continues to trail Atlantic market
• Changing nature of market participants as banks depart commodity markets and commodity traders increase activity


