27
Changing the paradigm regarding health benefits incentives

Changing the paradigm regarding health benefits incentives
2 September 20, 2016
Our Presenter
Bruce Sherman, MD, FCCP, FACOEM Medical Director, Population Health Management Xerox HR Services

3 September 20, 2016
Overview of current incentives approaches and less-than-successful outcomes
Why current incentive approaches don’t work so well
Paradigm change – the science behind changing the incentives approach
Applying new learnings – incentives redesigned
Presentation
Outline

Natural Flow of Health Risk Status
Modified from Edington, AJHP. 15(5):341-349, 2001.
Medium Risk
10,670 (24.6%)
11,495 (26.5)
4,691 (10.8%)
5,226 (12.1%)
4,546 (42.6%)
2,373 (50.6%)
27,951 (64.5%)
26,591 (61.4%)
21,750 (77.8%)
High Risk (>4 risks)
Low Risk (0 - 2 risks)
678 (14.4%) 892 (3.2%)
Average of three years
between measures.
4 September 20, 2016
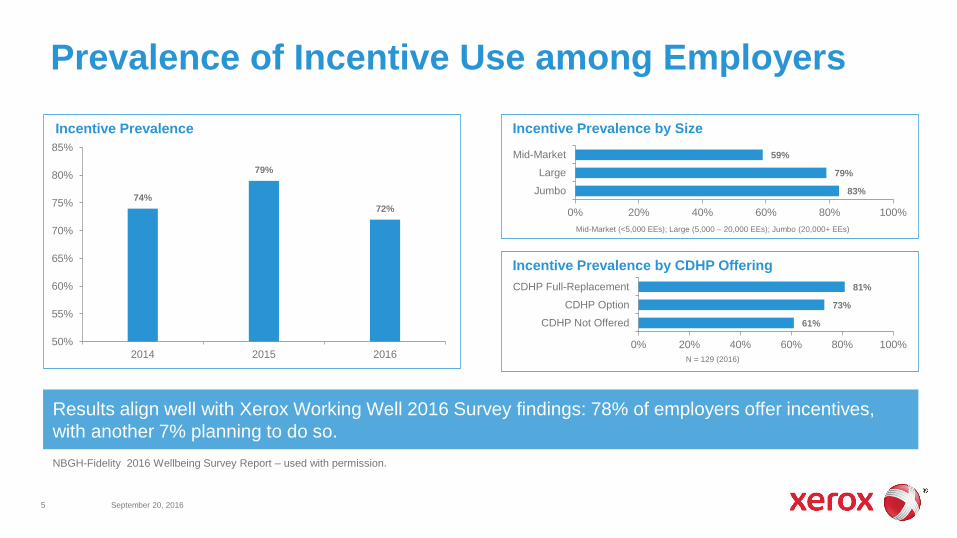
Prevalence of Incentive Use among Employers
5 September 20, 2016
74%
79%
72%
50%
55%
60%
65%
70%
75%
80%
85%
2014 2015 2016
Incentive Prevalence
Results align well with Xerox Working Well 2016 Survey findings: 78% of employers offer incentives,
with another 7% planning to do so.
83%
79%
59%
0% 20% 40% 60% 80% 100%
Jumbo
Large
Mid-Market
Incentive Prevalence by Size
Mid-Market (<5,000 EEs); Large (5,000 – 20,000 EEs); Jumbo (20,000+ EEs)
Incentive Prevalence by CDHP Offering
N = 129 (2016)
61%
73%
81%
0% 20% 40% 60% 80% 100%
CDHP Not Offered
CDHP Option
CDHP Full-Replacement
NBGH-Fidelity 2016 Wellbeing Survey Report – used with permission.

Employee Incentive Average Decreases, While Median Increases
6 September 20, 2016
$678
$630
$650
$- $100 $200 $300 $400 $500 $600 $700
Jumbo
Large
Mid-Market
$594
$693 $651
$500 $500
$600
$-
$100
$200
$300
$400
$500
$600
$700
$800
2014 2015 2016
Average Median
NBGH-Fidelity 2016 Wellbeing Survey Report – used with permission.
Employee Incentive Amount
Fewer employers are offering large incentive dollars, but many offering amounts near $600.
Employee Average Incentive by Size
Mid-Market (<5,000 EEs); Large (5,000 – 20,000 EEs); Jumbo (20,000+ EEs)
Employee Average Incentive by CDHP Offering
N = 93 (2016)
$423
$662
$774
$- $100 $200 $300 $400 $500 $600 $700 $800
CDHP Not Offered
CDHP Option
CDHP Full-Replacement

• Highest-risk sub-populations are least likely to engage
• Most incentive designs don’t generate sufficient motivation
• Focus is on what’s important for lowering healthcare costs, not what’s important for individuals
• We’re designing benefits incentives for people like us, not those who will most likely benefit
Why Current Incentives Don’t Work So Well
7 September 20, 2016
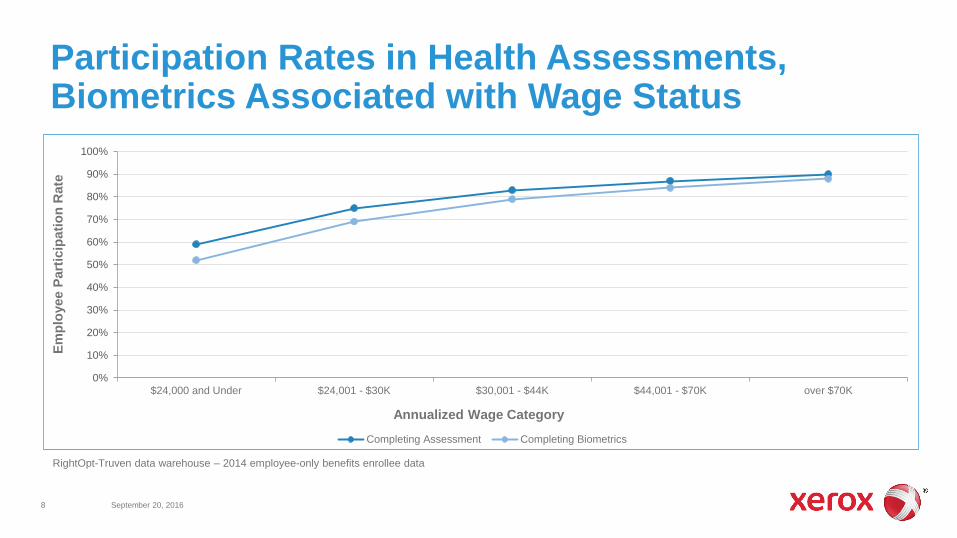
Participation Rates in Health Assessments, Biometrics Associated with Wage Status
8 September 20, 2016
0%
10%
20%
30%
40%
50%
60%
70%
80%
90%
100%
$24,000 and Under $24,001 - $30K $30,001 - $44K $44,001 - $70K over $70K
Completing Assessment Completing Biometrics
Annualized Wage Category
Em
plo
yee P
art
icip
ati
on
Ra
te
RightOpt-Truven data warehouse – 2014 employee-only benefits enrollee data

Factors that Stress People most Intensely
9 September 20, 2016
The Consumer Health Mindset Survey. Aon/NBGH/the futures co. , 2016.
What does this mean for prioritization of personal health issues?
24%
27%
31%
32%
37%
40%
42%
43%
50%
0% 5% 10% 15% 20% 25% 30% 35% 40% 45% 50%
Family Changes
Personal Health Condition
Health Condition of Family
Personal/Family Commitments
Influence/Control Over Work
Work Relationship
Work Schedule
Work Changes
Financial Situation
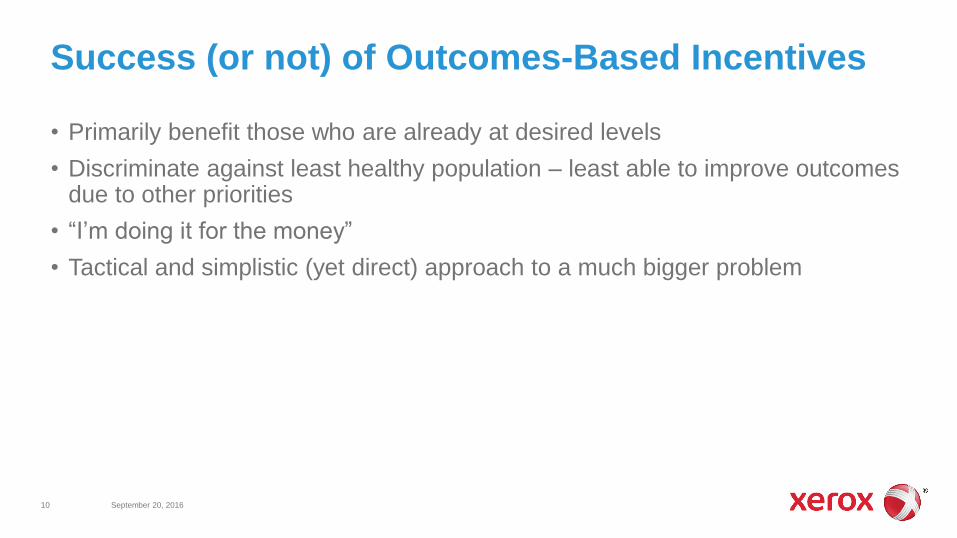
• Primarily benefit those who are already at desired levels
• Discriminate against least healthy population – least able to improve outcomes due to other priorities
• “I’m doing it for the money”
• Tactical and simplistic (yet direct) approach to a much bigger problem
Success (or not) of Outcomes-Based Incentives
10 September 20, 2016

Paradigm Change The Science Behind Changing the Incentives Approach
11 September 20, 2016
• Scarcity
• Wellbeing through the eyes of Abraham Maslow
• The role of health care consumerism
• Tactical, issue-focused – or more systematic?
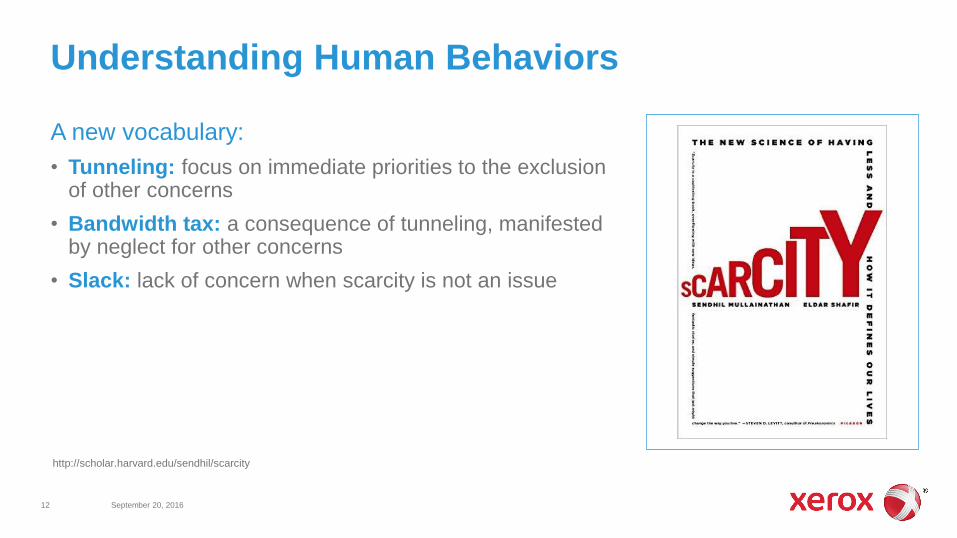
A new vocabulary:
• Tunneling: focus on immediate priorities to the exclusion of other concerns
• Bandwidth tax: a consequence of tunneling, manifested by neglect for other concerns
• Slack: lack of concern when scarcity is not an issue
Understanding Human Behaviors
12 September 20, 2016
http://scholar.harvard.edu/sendhil/scarcity
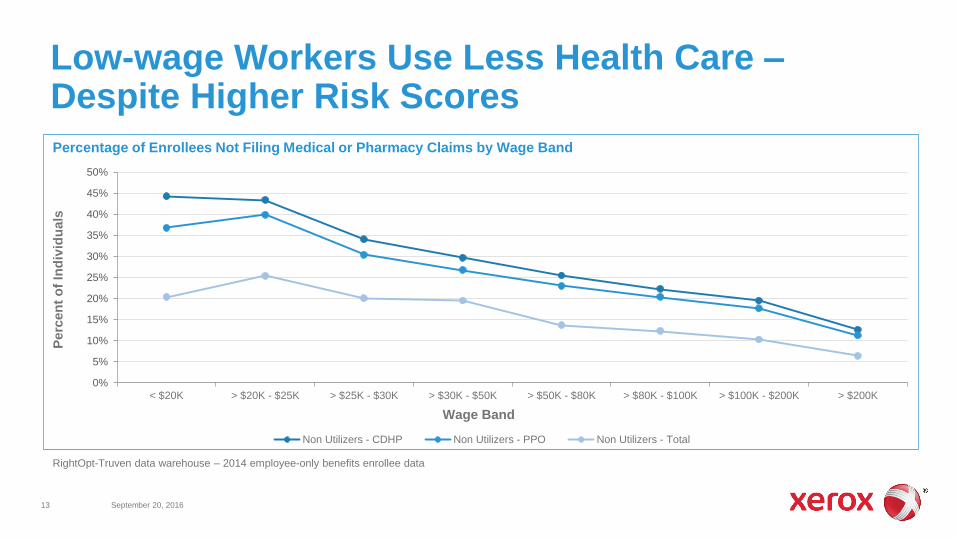
Low-wage Workers Use Less Health Care – Despite Higher Risk Scores
13 September 20, 2016
0%
5%
10%
15%
20%
25%
30%
35%
40%
45%
50%
< $20K > $20K - $25K > $25K - $30K > $30K - $50K > $50K - $80K > $80K - $100K > $100K - $200K > $200K
Non Utilizers - CDHP Non Utilizers - PPO Non Utilizers - Total
Wage Band
Perc
en
t o
f In
div
idu
als
Percentage of Enrollees Not Filing Medical or Pharmacy Claims by Wage Band
RightOpt-Truven data warehouse – 2014 employee-only benefits enrollee data
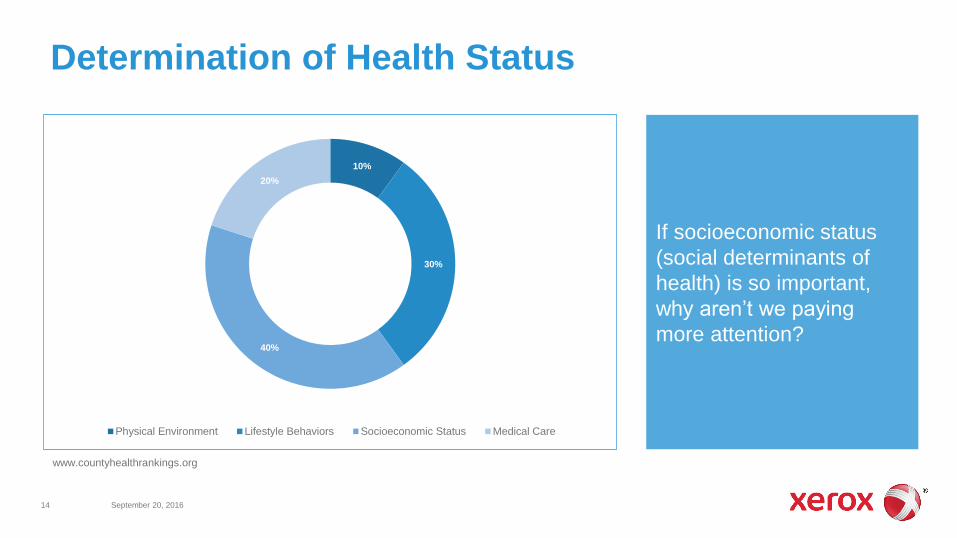
Determination of Health Status
14 September 20, 2016
www.countyhealthrankings.org
If socioeconomic status
(social determinants of
health) is so important,
why aren’t we paying
more attention?
10%
30%
40%
20%
Physical Environment Lifestyle Behaviors Socioeconomic Status Medical Care

Social Determinants of Health Health Care Cost Connection
15 September 20, 2016
• Social determinants of health are associated with health status and wellbeing
• Unhealthy behaviors and health risks lead to chronic conditions
• Chronic conditions drive health care utilization
• Health care utilization drives health care costs
1 www.cdc.gov/chronicdisease/resources/publications/AAG/chronic.htm
2 The Costs of Unhealthy Behaviors. WELCOA, 2007
Social Determinants
Unhealthy Behaviors
Chronic Conditions
Health Care Utilization
Health Care Costs
More than 75% of health
care costs originate from
individuals with chronic
conditions1.
About 70% of health care
costs are due to unhealthy
behaviors2.

16 September 20, 2016
Maslow’s hierarchy of needs… … applied to health benefits
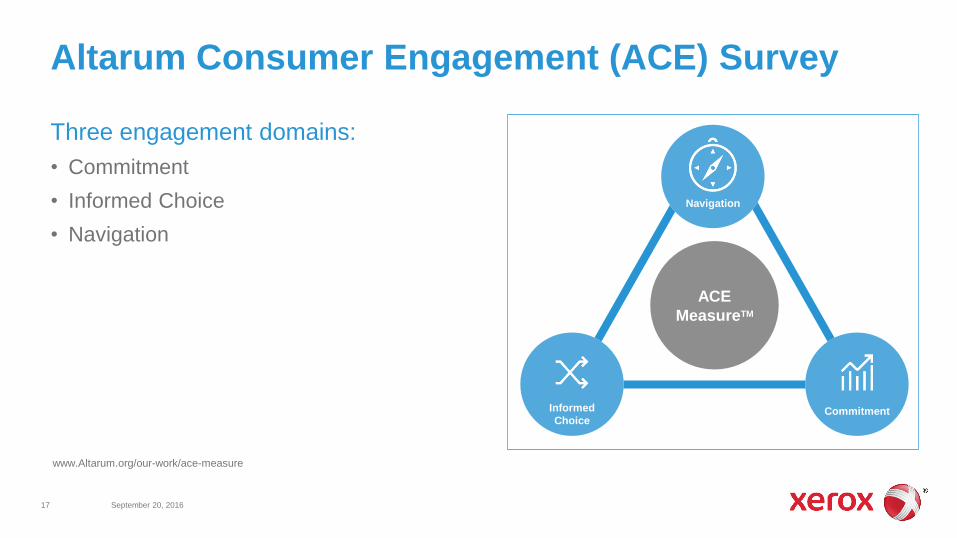
Three engagement domains:
• Commitment
• Informed Choice
• Navigation
Altarum Consumer Engagement (ACE) Survey
17 September 20, 2016
www.Altarum.org/our-work/ace-measure
Navigation
Commitment Informed
Choice
ACE
MeasureTM

Consumerism Engagement Matters
18 September 20, 2016
Health Affairs, 2015
84%
57%
36%
48%
33%
27%
0%
10%
20%
30%
40%
50%
60%
70%
80%
90%
Have a Healthy BMI Ask About Cost Use Cost TransparencyTools
Most Engaged Column2
Informed Choice Commitment Navigation
www.Altarum.org/our-work/ace-measure
Applying New Learnings Incentives Redesign
19 September 20, 2016
• Meet individuals where they are
• A seemingly simple solution (e.g., outcomes-based incentives) may not work
• Incentives use should be data-driven, targeting well-being and clinical gaps
• Think more broadly about addressing core wellbeing needs and priorities, as well as promoting healthcare consumerism engagement
• Integrate wellness/wellbeing and health benefits (VBID) incentives to optimize population health outcomes
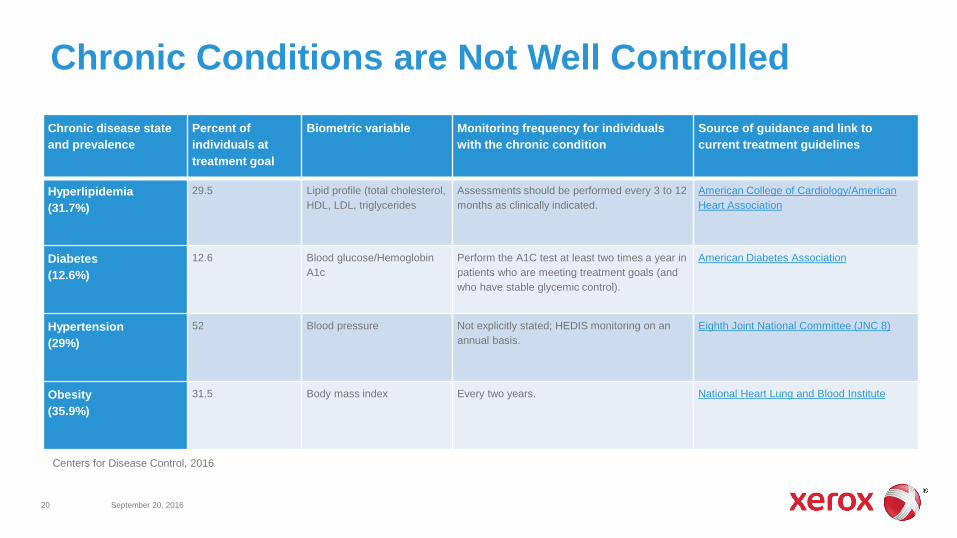
Chronic Conditions are Not Well Controlled
20 September 20, 2016
Centers for Disease Control, 2016
Chronic disease state
and prevalence
Percent of
individuals at
treatment goal
Biometric variable Monitoring frequency for individuals
with the chronic condition
Source of guidance and link to
current treatment guidelines
Hyperlipidemia
(31.7%)
29.5 Lipid profile (total cholesterol,
HDL, LDL, triglycerides
Assessments should be performed every 3 to 12
months as clinically indicated.
American College of Cardiology/American
Heart Association
Diabetes
(12.6%)
12.6 Blood glucose/Hemoglobin
A1c
Perform the A1C test at least two times a year in
patients who are meeting treatment goals (and
who have stable glycemic control).
American Diabetes Association
Hypertension
(29%)
52 Blood pressure Not explicitly stated; HEDIS monitoring on an
annual basis.
Eighth Joint National Committee (JNC 8)
Obesity
(35.9%)
31.5 Body mass index Every two years. National Heart Lung and Blood Institute
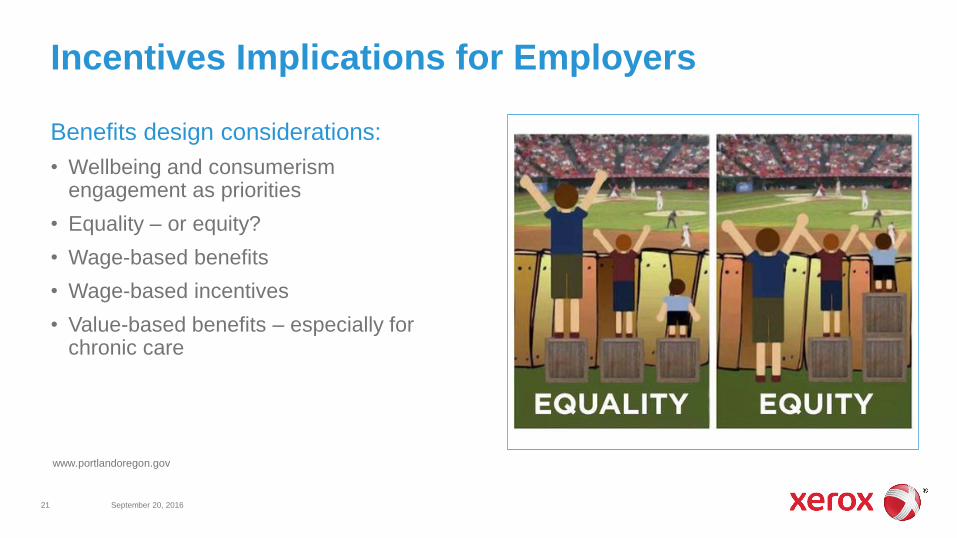
Benefits design considerations:
• Wellbeing and consumerism engagement as priorities
• Equality – or equity?
• Wage-based benefits
• Wage-based incentives
• Value-based benefits – especially for chronic care
Incentives Implications for Employers
21 September 20, 2016
www.portlandoregon.gov
Basic principles:
• Adopt a ‘big picture’ view of health/wellbeing to inform incentives use
• Design incentives for the populations that can benefit the most
• Provide incentives for what those individuals value – and ensure that the incentives have value
• Target as specifically as possible to maximize value
• Alignment with organizational culture is essential
Information to Action Incentive Design Considerations for Employers
22 September 20, 2016
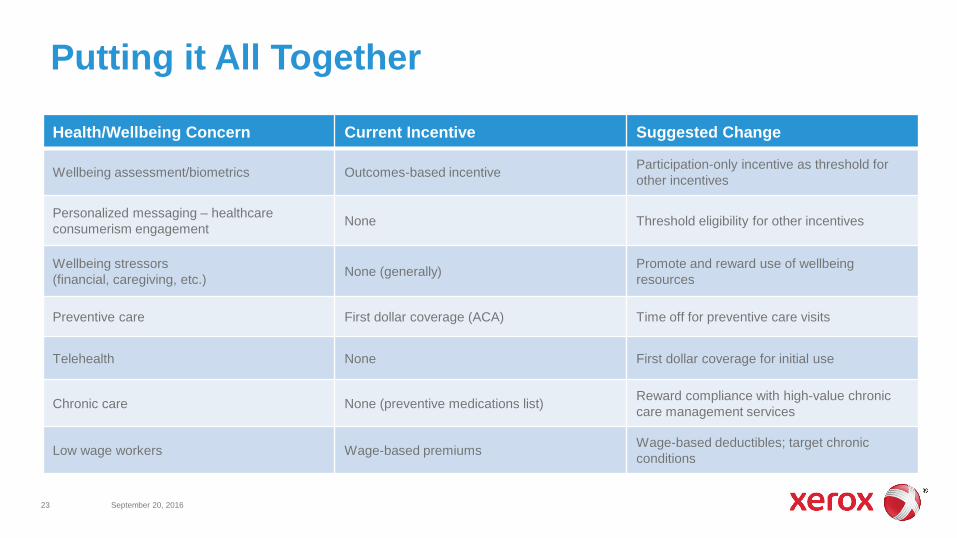
Putting it All Together
23 September 20, 2016
Health/Wellbeing Concern Current Incentive Suggested Change
Wellbeing assessment/biometrics Outcomes-based incentive Participation-only incentive as threshold for
other incentives
Personalized messaging – healthcare
consumerism engagement None Threshold eligibility for other incentives
Wellbeing stressors
(financial, caregiving, etc.) None (generally)
Promote and reward use of wellbeing
resources
Preventive care First dollar coverage (ACA) Time off for preventive care visits
Telehealth None First dollar coverage for initial use
Chronic care None (preventive medications list) Reward compliance with high-value chronic
care management services
Low wage workers Wage-based premiums Wage-based deductibles; target chronic
conditions
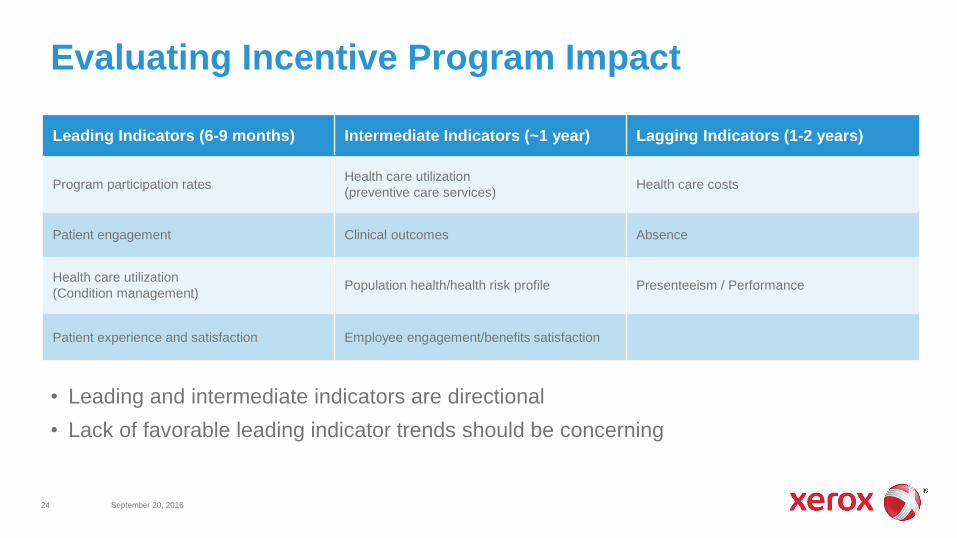
Evaluating Incentive Program Impact
24 September 20, 2016
• Leading and intermediate indicators are directional
• Lack of favorable leading indicator trends should be concerning
Leading Indicators (6-9 months) Intermediate Indicators (~1 year) Lagging Indicators (1-2 years)
Program participation rates Health care utilization
(preventive care services) Health care costs
Patient engagement Clinical outcomes Absence
Health care utilization
(Condition management) Population health/health risk profile Presenteeism / Performance
Patient experience and satisfaction Employee engagement/benefits satisfaction
• We need to stop thinking about designing health benefits for what we value, and focus on broader population needs
• Individual wellbeing is foundational to effective/appropriate health care services use – provide incentives to address symptoms
• Target most disadvantaged groups to optimize incentives use
• Integrate incentives and value-based benefit design to maximize value – especially for chronic condition care
• Misalignment with organizational culture will likely result in failure
Summary
25 September 20, 2016

26 September 20, 2016
Bruce Sherman, MD, FCCP, FACOEM Medical Director, Population Health Management [email protected]
Questions
© 2016 Xerox Corporation. All rights reserved. Xerox® and Xerox and Design® are trademarks of Xerox Corporation in the United States and/or other countries. BR19845


