1
Chapter 1: Problem Statement
What influences people’s health behavior? Cockerham, Rutten and Abel (1997)
discuss the influences on health lifestyles, and point to the importance of choices from
options available according to their social locations and subsequent life chances. At the
other end, when health behaviors involve the use of formal services, the quality of care
received will also be important for continued use of these services. As a result, possible
choices, life chances, and quality of care should be considered in explaining why people
use such health services as family planning.
Family planning services play a major role in providing women with a range of
services, including reproductive health care and consultation on family planning matters.
Dobie, Gober and Rosenblatt (1998) argue that the availability of family planning
services is associated with fewer unplanned pregnancies, abortions, low-birth-weight
babies, and births with late or no parental care, infant deaths and neonatal deaths. In
order to encourage attendance, those clinics run by Planned Parenthood and health care
departments provide services at reduced fees or no cost to disadvantaged women based
on income. However, not all women take advantage of these opportunities. In rural areas,
particularly in Appalachia, women do not make as much use of these services as in urban
areas (Edwards, Shuman and Glenn, 1996).
The Appalachian region has been noted in the past for its slower social, -and
economic development, and unique culture in comparison to the rest of the nation
(Hochstrasser, Donald and Gairola, 1991). Indeed, Appalachia has been described as a
peripheral region in a core country (Couto, 1988). Businesses are small and salaries tend
to be lower than in urban areas. Forty percent of all rural families fall into the category
2
of working poor, defined as employed people who do not have health insurance benefits
and cannot afford to purchase it (Bushy et al., 1998). Women are mostly employed in
unstable, low-paid, or part-time jobs. Many women with children are jobless due to the
high cost or lack of access to childcare; they may also lack transportation to get to work
(Oberhauser, 1995).
Based on previous studies, common characteristics of women in Appalachian
region include being poor, married, and with children. They also tend to be poorly
educated, and work as homemakers, service workers, or laborers (Bushy, 1998; Edwards
et al., 1996; Oberhauser, 1995; Piccinino and Mosher, 1998).
Studies of the Appalachian region show that Appalachian women are less healthy
than women in urban areas; in addition, access to and utilization of health care and family
planning services are lower among Appalachian women. Hence, providing low-income
rural women with contraceptive care remains a problem and a main objective of family
planning services for a variety of reasons. First, such services are often unavailable in the
town of county where they live. Rural Appalachia is a poor region and often doctors or
other specialized personnel are reluctant to locate in the region partly due to a lower pay
(Hartlage, Breaux, Gehlert and Fogg, 2001). As a result, fewer women from rural areas
get a clinical breast examination, mammogram, or a Pap test as compared to women from
urban settings (Edwards et al., 1996). Transportation is another frequently cited reason
for not using family planning in rural areas. Transportation obstacles for rural women
include long distances to see health care providers, poor road conditions, and lack of both
dependable vehicles and public transportation (Bushy, et al, 1998: 54). In addition, even
if family planning services are available in rural areas, women still avoid using these
3
clinics. Poorer women do not have health insurance coverage and as a result, their out-of
pocket expenses increase (Edwards et al. 1996).
Other barriers emerge as a result of more traditional and conservative views that
Appalachian men and women hold about family planning (Wilson, Peterson and Wilson,
1993). Gender roles remain very traditional. Partly as a consequence, rural women have
low levels of educational attainment (Wilson et al 1993; Oberhauser 1995). Further,
many of them engage in household labor only and remain economically dependent upon
their husbands. Women who want to engage in paid employment face disapproval from
their husbands as this detracts from women’s time to be a caregiver of family members
(Edwards et al 1996). Hence, adhering to a traditional gender ideology creates additional
obstacles to access to family planning services. Instead of focusing on health, women
center on family problems, such as marital relationships or intergenerational living
situations (Bushy 1998). According to Beaver (1986), close family systems and support
networks in the community make Appalachian women reluctant to establish ties with
outsiders. Hence, those who have an unplanned pregnancy or sexually transmitted
disease avoid physicians for fear of losing their confidentiality.
Aside from those factors directly related to Appalachia, research has also
pinpointed other factors that influence service use in relation to contraceptive use and
family planning. Williams et al (2000) argue that client satisfaction is key to clients’
decisions to use and to continue using services. Access to family planning services is one
key to client satisfaction, and includes such things as clinic hours, clinic location, fees,
and waiting for care.
4
Other factors that are related to quality of family planning services include staff
competence, confidentiality, and cost of services. For instance, Severy et al (1990) found
that for rural women it is very important that staff members be trustworthy, friendly,
understanding and not bossy, as well as trained and competent. In addition, they found
that women’s perceived lack of privacy and potential embarrassment in talking to staff
created difficulties in attending family planning services. These findings are consistent
with Williams et al (2000) who found that lack of privacy, personal courtesy, and lack of
an opportunity to ask questions led to dissatisfaction among women using family
planning services. Finally, Judith Bruce (1990) developed a quality of care framework,
which is an extension of a framework by Donabedian (1980, 1988). She argues that the
critical elements of family planning programs for good quality care include: choice of
methods, information given to users, technical competence, interpersonal relations,
follow-up or continuity mechanisms, and appropriate constellation of services (Bruce,
1990:63).
The goal of this study is to assess the quality of family planning services for, and
factors influencing client satisfaction of Appalachian women in the southwestern part of
Virginia. This region includes five counties, areas typically designated as part of the
Appalachian region. I will conduct interviews with family planning clinic managers to
collect data on their experience in rural areas, their understanding of local traditions,
norms, and obstacles preventing contraceptive use among women, the qualifications and
training of their staff members, and others. I will also administer a survey to clients to
obtain their perceptions and feelings about the services provided to them. My goal is to
reconcile responses wherever possible, and furthermore, to identify differences between
5
information provided by clinic staff and managers and the perceptions of clients. To do
so, I will address the following questions: (1) How satisfied are Appalachian women with
the family planning services they receive? (2) What factors influence their satisfaction?
Are there differences in these factors between Appalachian women and non-Appalachian
women in receiving these services? (3) Does staff training in relation to Appalachian or
rural lifestyles influence Appalachian women’s satisfaction? Finally, (4) Do perceptions
of providers about their services match the perceptions of their clients? These questions
should help determine the needs of rural Appalachian women in receiving family
planning services and the extent to which Appalachian women have special needs. To
address these questions, I will survey clientele at five public clinics and one not-for profit
clinic. I will also conduct brief interviews with health care providers and central staff at
these agencies.
Because research has shown that women in rural areas are very dependent on
family planning services, an assessment of current services would be valuable to policy-
makers in allocating funds to rural Virginia. While my focus will be on a particular group
– Appalachian women – and only one health care service – family planning – this
research should enhance our understating of the ways in which health lifestyles and the
quality of care form a context how and why people use health services.
6
Chapter 2: Review of the Literature
The purpose of this chapter is to introduce some of the literature on family
planning services in Appalachia. The first section discusses women in Appalachian rural
areas and their dependency on family planning clinics. The second section presents
studies that have focused on various obstacles that prevent Appalachian women from
using family planning services. Finally, I use this literature review and theoretical
considerations to present my research questions.
Health Lifestyles Model
What influences people’s health behavior? Using the works of Simmel, Weber,
and Bourdieu on lifestyles, Cocherham et al (1997) developed a model to explain factors
that affect health lifestyles. They consider the cultural and socioeconomic (life chances)
determinants of lifestyle and the importance of realistic options (life choices) for living in
ways that maybe more health enhancing. Their concept of lifestyle means ways or styles
of living that are not the same for all people. As Cocherham et al put it, “life styles are
opportunity structures that people adopt for the gains they feel they can acquire, which
included both a material form to their self-identity and an anchor in a particular social
constellation of style and activity” (337). As a result, life chances and life choices should
be considered in explaining health practices, including why people use family planning
services.
Rural Women and Health
In rural and economically isolated areas, people tend to be less healthy than in
urban areas. Rural people also have less access to and less utilization of health care and
7
family planning services. One reason is the non-availability of such services in the town
or county where they live. The entire Appalachian area has a shortage of health
personnel, especially physicians, perhaps because the pay is lower than in other more
prosperous regions of the country (Hartlage et al. 2001). Other problems with the use of
family planning services emerge due to the lack of transportation services. Therefore,
Purnell (2003:87) suggests that “offering transportation on a regular schedule and by
appointment may improve access [to health services]”.
In terms of health in rural areas, research reveals alarming rates of disease and
high-risk behaviors. For instance, Huttlinger et al (2004) surveyed 922 rural households
representing 2,188 people, with regard to the availability, need, and access to heath care
services. Their findings revealed higher rates of chronic illnesses, such as heart disease
and hypertension, than the rest of Tennessee, a large number of people without health
insurance and prescription drug coverage, and an overall perception of fair-to-poor health
status. The study also revealed the large number of people who were in need of dental
and visual care and preventive health services; who were dealing with depression at
home; and who were sharing their prescription for medications with others.
Similarly, Edwards et al (1996) examined health risk factors and physical
ailments among rural Appalachian women. They explored 50 randomly selected charts
of white Appalachian women between the ages of 40 and 64 from a population who
chose to participate in a health-screening program between 1992 and 1993. The risk
factors found with greatest frequency in the sample included cigarette smoking, history of
lung disease, physical inactivity, total cholesterol greater than 240, systolic blood
pressure greater than 140 and diastolic greater than 90, history of hypertension, and
8
obesity greater than 20 percent. Higher numbers of risk factors were correlated with
lower levels of education. In relation to family planning services, Edwards et al (1996)
found that 38 percent of Appalachian women had received a clinical breast examination
by a professional provided, compared to 59 percent regionally. Twenty percent had
received a mammogram and 30 percent had received a Pap test, compared to 52 percent
and 57 percent respectively.
In summary, both studies suggest that rural areas, especially in Appalachia, need
increased health services. Health care specialists and low-cost prescriptions along with
affordable health insurance are of major importance.
The Role of Family Planning Services in Rural Areas
Previous research has shown that the benefits of family planning services in rural
areas are enormous for those trying to regulate fertility or deal with reproductive health
issues. Furthermore, in many poor rural areas, family planning services are sometimes
the only source of specialized reproductive health care (Frost et al, 2001). Grady et al
(1993) argue that the number of family planning clinics in a community has a significant
positive effect on the level of contraceptive protection a woman chooses. Further, they
suggest that numerous family planning services help women gain access to information
about contraception and choose an effective method at a lower cost, which is crucial for
rural women. The presence of family planning clinics lowers the number of abortions as
alternative birth control methods are introduced to women. Similarly, Dobie et al
(1998:141-142) argue that the availability of family planning services is associated with
fewer unplanned pregnancies, abortions, low-birth-weight babies; fewer births with late
or no prenatal care, and fewer infant deaths and neonatal deaths. Frost’s (2001) findings
9
suggest that women who attend family planning clinics obtain a wider range of services
than do women whose primary source of care is private providers. The services offered
by family planning services include pelvic examinations and Pap tests to screen for
cervical cancer as well as a variety of sexually transmitted diseases.
Thus, family planning clinics in economically poor and relatively isolated areas
are vital in providing women access to essential information on birth control and various
health services that would be difficult to obtain otherwise.
Poverty and Gender
Since the 1870s, Americans have viewed Appalachia as a strange land inhabited
by a peculiar people (Shapiro, 1977). Among some of the many images associated with
Appalachia are those of poorly dressed, emaciated, barefooted, mostly white, rural
children and adults beside cabin porches (Lohmann, 1990). The Appalachian region
developed as a unique subculture with its own family structure, language, culture and
values. Mainstream society views the high poverty rates and subsistence living in
Appalachia as normal and therefore, tied into a “culture of poverty”. This self-serving
ideology portrayed the mountaineers’ culture, mores, and value systems as inferior to
those of modern Americans. (Tickamyer and Tickamyer, 1986). Indeed, higher than
average poverty rates and high rates of mortality and poor health make Appalachia one of
the most vulnerable areas in the United States.
Studies of poverty in the Appalachian region tie the economic situation in rural
America to a limited opportunity structure resulting from past social and economic
development policies and current economic transformation. For instance, Tickamyer and
Duncan’s (1990) research on several communities in rural areas reveals that poor areas
10
lack stable employment, opportunities for mobility, and investment in community. As a
result, these poor communities become increasingly economically and socially isolated.
Tickamyer and Tickamyer (1986) tie Appalachian poverty with the structure of the local
economy, the type of employment opportunities, and the degree of isolation that make
economic opportunity scarce. Another perspective on Appalachian poverty comes from
Simon (1981), who thinks of poverty in terms of domestic capitalism. Hence, he
compares Appalachia with “underdeveloped” regions in Africa and Asia. Similarly,
Couto (1988) depicts Appalachia as peripheral region in a core country that is constantly
exploited by outside sources.
Poverty in Appalachia came along with the economic transformations that took
place between the 1890s and 1930s. The process of economic change towards a market-
orientation in the U.S. led to the massive exploitation of the region’s rich and valuable
raw materials. Since the 1950s, the Appalachian coal industry became a major source of
employment in the region and assumed a paternalistic stance in relation to employees.
Being dependent upon mining wages, a mountaineer Appalachian was no longer self-
sufficient (Duncan, 1986). Later in 1980s fluctuations in the coal market and the
automation of many mining activities led to unemployment and the migration of the
mountaineers to various cities in search for jobs (Gorham, 1992). All these drastic
changes created a class of ‘new poor’ that live below the poverty level in these rural
areas.
Although the region is poor as a whole, significant gender differences in terms of
poverty and economic vulnerability exist. Consistently, rural women earn less money,
have less access to job opportunities, and are employed in insecure, low-paid, or part-
11
time jobs. For instance, Latimer (2000) found that although Appalachian residence has a
depressive effect on incomes of males and females, female workers are more
economically vulnerable than their male counterparts. In addition, the Appalachian
women in her sample had higher average family sizes and were more likely to be married
than women outside the region. Their larger family sizes increase the need for additional
income. However, higher unemployment levels make it more difficult to increase work
hours. Thus, the author concludes, “economic vulnerability has the potential to make
women the primary group absorbing the costs of economic fluctuations and economic
restructuring” (2000:354).
A unique economic structure also contributes to persistent inequality between
males and females. Rural communities have a greater numbers of small, intergenerational
family businesses such as grocery stores, service stations, banks, dairy services,
pharmacies, farms, and ranchers. Salaries tend to be lower, and unemployment and
underemployment rates are higher (Bushy, 1998). Employment outside the home often
contradicts the traditional role of a woman as a caregiver of family members (Edwards et
al 1996). As Tickamyer and Tickamyer argued,
The more traditional the community and family life, the more limited the
opportunities for employment and income generating activities, the harder
hit will be those groups in the population who are least economically independent
(Tickamyer and Tickamyer 1991:314).
Moreover, many women’s work is considered less valuable since they never
pursued higher education or skills. For instance, Oberhause (1995) discusses recent
decline of Appalachian incomes due to the loss of traditional male jobs in the mining and
manufacturing sectors. Insecure, low-paid, or part-time jobs make women more
dependent on multiple sources of income, including the home-based production of goods
12
and services for sale in the formal and informal sectors. Furthermore, when a husband is
unemployed, homework activities become the only means of support of the entire family.
Yet, homework is not viewed as “real work” and therefore, women are still expected to
hold a paid job in the formal economy and perform household duties.
Job insecurity and low incomes translate into a lack of health insurance. The high
rate of unemployment in Appalachia means that many people cannot afford basic health
care. Thus, many poorer women must increase their out-of pocket expenses to obtain
family planning services (Edwards et al. 1996). Several studies showed that low incomes
negatively affect the use of family planning services (Purnell, 2003). For instance,
Piccino and Mosher (1998) found that the decline in pill use from 1988 to 1995 was quite
dramatic – from 36 percent to 24 percent -- among low-income women, but was not
significant in higher income groups. The study by Hartlage et al (2001) produced similar
results – higher income predicted use of the oral contraceptives.
Rural Women and Education
Education also influences the use of family planning services. Below, I explore
the current educational situation in Appalachia.
The original immigrants to the Appalachian region were highly educated.
However, limited access to formal education resulted in the isolation of later generations
and fewer educational opportunities. This isolationism led to cultural lag. In Appalachia,
education beyond the elementary level is not viewed as necessary to earning a living in
their traditional occupations. Physical work is understood as real work, while book
learning is less valued. Moreover, the Appalachian educational system suffers from a
13
lack of appropriate funding and programs for rural schools and teacher layoffs (Crouch,
1992; Purnell, 2003; DeYoung 1995).
Rural women find it even more difficult to pursue education than do their male
counterparts. Wilson et al. (1993) cite the widespread poverty, unemployment, and
persistent economic problems in rural Appalachia as the greatest obstacles to attainment.
Young Appalachian women than other women frequently attend poorer schools, receive
inadequate information about employment options, and are exposed disproportionately to
role models with low educational attainment. Finally, compared to their male
counterparts, regardless of when women in Appalachia marry and have children, they
often face pressure to accept the secondary importance of their own occupational goals
and to assume less prestigious jobs. In addition, the traditional Appalachian household
continues to be patriarchal. Hence, it places greater emphasis on traditional gender roles,
which tend to view education for women as relatively unimportant. Instead, women’s
responsibilities usually include nurturing and coordinating domestic activities (Bushy,
1998).
Thus, Wilson et al. (1993) find that low-income females from rural Appalachia
are likely to subscribe to traditional gender roles, regardless whether they have married or
have become mothers by early adulthood. Due to strong familistic values in rural
Appalachia, many women are unwilling to move away from their families and familiar
surroundings to seek better job opportunities.
14
Culture and its Implication to family planning services
As the discussions concerning poverty and education indicate, Appalachian
culture presents additional obstacles to women’s use of family planning services.
Even though no two places are the same, some common cultural patterns can be
found across the Appalachian region. Typically, Appalachian people tend to be
individualistic, self-reliant, and proud. They find satisfaction in doing things for
themselves – like making a dress or a chair, building a house, repairing an automobile, or
playing a banjo. Appalachians do not like to ask others for help; this helps explain why it
is hard for them to seek formal health care (Jones, 1972). Health is perceived as an
individual responsibility, and hence, Appalachians visit health-care providers only in
cases when their condition has become severe.
Many values and beliefs of Appalachians have religious origins (Jones, 1972),
which have implications for family structures. The traditional Appalachian household is
patriarchal (Purnell, 2003). Domestic activities including child rearing, or family
nurturers are considered “women’s work”, whereas, men are responsible for financially
supporting the family. Many rural women describe their ideal life style as being married
with children and without employment outside of the home. Women that do want to earn
income outside home often meet disapproval from their family (Edwards et al, 1996;
Bushy, 1998). Further, the importance of children to the Appalachian family means that
motherhood increases a woman’s status in the church and in the community. Thus, large
families are common in the Appalachian region. Nuclear and extended families are also
very important in Appalachian culture, and relatives often live in close proximity. Elders
live close to or with their children when they are no longer able to take care of
15
themselves. Finally, rural women interact with people from their own community and
feel reluctant to establish ties with outsiders (Purnell, 2003).
Appalachian cultural norms and behavior have several implications for health care
access and utilization of family planning services. In a study on family health in rural
Appalachia, Denham asked the participants to describe family health. Most participants
explained family health as the absence of illness and disease. One should stay free from
illness in order to work and perform daily routines. For instance, one of the participants
explained: “Health to me is… is your body doing what it’s always done ever since you
were born… performing the way it should and not being sick all of the time”. Purnell
(2003) finds similar attitudes about health status. He concludes that Appalachians are
less concerned about their overall health status than non-Appalachians. They do not view
disease as a problem unless it interferes with one’s functioning. Further, Purnell notes
that initial seeking behaviors typical for people in the Appalachian region involve either
self-care practices learned from mothers or treatment provided by mothers or other
females in the kin network. Similarly, Denham (1996:308) notes that “the mother is the
primary health care decision maker, director, provider, and coordinator of health”. If
symptoms persist, Appalachians might use over-the counter medicine or somebody else’s
medicine that had experienced similar symptoms. Only after all these attempts fail do
Appalachians seek local health-care providers. Hence, when illness occurs, rural
residents prefer someone that they know and trust.
Thus, establishing trust with the health-care provider is especially important for
rural women that seek family planning services. However, physicians and other health-
care professionals are often seen as outsiders. Still, once the person gets to know and trust
16
the health-care provider, the provider is given much respect. In addition, with respect to
family planning services, fertility issues and sexual activity are very sensitive topics in
the region. Rural women who have an unplanned pregnancy or sexually transmitted
disease avoid physicians because they fear losing confidentiality. Thus, it is very
important for the health-care provider to be familiar with the cultural patterns of rural
women in order to assist them.
Beyond economic standing and culture, the quality of services provided also
shape the use of family planning services. In the next section, I explore those aspects of
family planning services that research has identified as important for continued use.
Quality of Services
Quality of services is a major determinant of family planning use. Bertrand et al
(1995) argue that “improving the quality of services results in larger numbers of clients
seeking out these services and adopting contraceptive use in a sustained manner”.
Several scholars have tried to assess the quality of family planning services. For
instance, Severy and McKillop (1990) examined women’s attitudes toward and
perceptions of family planning services by using an expectancy-value questionnaire.
Along with doctor’s care, nurse’s care, waiting time, accessibility and comfort, the
authors also examined the clients’ perceptions that use the services. They found that for
women it is very important that “staff members be trustworthy, friendly, understanding
and not bossy” as well as “trained and competent” (156). In addition, they found that
lack of privacy, potential embarrassment in talking to the staff, and absence of a doctor
decreased use of family planning services.
17
Bertrand et al (1995) discuss the importance of access, quality of care and medical
barriers for using family planning programs. According to the authors, access can
determine whether or not the individual makes contact with the family planning provider,
whereas quality of care can affect the client’s decision to use family planning services.
Medical barriers include policies and practices that might prevent clients from receiving
the contraceptive method of their choice or “impose unnecessary process barriers to
access family planning services” (64). The authors define access as “the degree to which
family planning services and supplies may be obtained at a level of effort and cost that is
both acceptable to and within the means of a large majority of the population” (65).
Williams et al (2000) argue that client satisfaction determines clients’ continued
use of services. Access defined as clinic hours, clinic location, fees, and time spent
waiting is directly related to satisfaction of clients. Other factors that influence quality of
family planning services include staff competence, confidentiality, and cost of services.
These findings also reveal that lack of privacy, personal courtesy, and lack of an
opportunity to ask questions led to dissatisfaction among women using family planning
services.
Based on case studies in the developing countries, such as Latin America,
Bangladesh, and Sierra Leone, Judith Bruce introduces a more complete model on the
quality of family planning services (1990). Her framework for assessing quality from the
client’s perspective consists of six aspects of family planning services – choice of
methods, information given to clients, staff’s technical competence, interpersonal
relations, mechanisms to encourage continuity, and finally appropriate constellation of
services. The author argues that the improvements in various dimensions of care result in
18
clients’ satisfaction and programs becoming more effective. Thus, programs that take
clients’ view of their health and contraceptive knowledge into account positively
influence contraceptive use.
In summary, I have shown in this literature review the importance of the quality
of family planning services in rural areas of Appalachia. Several perspectives on the
quality of care present the necessity of looking at practical factors of access, availability,
as well as the perceptions of clients to the services they receive. However, as Cockerham
et al (1997) assert, health lifestyles are also influenced by socially defined life chances.
For these reasons, I utilize the quality of care framework together with the cultural
context of Appalachian region derived from the literature review. To do so, I will
address the following questions: (1) How satisfied are Appalachian women with the
family planning services they receive? (2) What factors influence their satisfaction? Are
there differences in these factors between Appalachian women and non-Appalachian
women in receiving these services? (3) Does staff training in relation to Appalachian or
rural lifestyles influence Appalachian women’s satisfaction? Finally, (4) Do perceptions
of providers about their services match the perceptions of their clients? Answers to these
questions will enhance our understanding of the extent to which Appalachian women’s
needs are similar to or different from other women, especially those with low incomes.
They will also help us understand the needs of Appalachian women in receiving family
planning services. The next chapter will address design and method of the study.
19
Chapter 3: Methodology
Data and Sample
To address my research questions, I use a combination of quantitative and
qualitative approaches. A qualitative approach, in which one is able to engage in open-
ended interviews with both clients and staff, would be appropriate for understanding the
processes underlying the health behavior of women. In terms of staff, little research exists
on how they view Appalachian women, or their attempts to engage in family planning.
Interviews would allow me to determine staff perceptions of clients and issues in a
manner that is not predetermined, while also allowing me to see how well their views
match clients’. Interviews with clients would also give me a better understanding of the
culture of the women under study as I could ask more questions that are open-ended and
probe further. However, due to confidentiality issues at the research sites, I was not able
to conduct in-person interviews with clients. At the same time, the present literature has
documented ways to measure client perceptions quantitatively. Thus, I adopt an
alternative approach of distributing surveys to the clients.
According to those who manage the clinics, in a typical month, around 150
women visit the clinics for a variety of reasons, of which family planning is just one.
Hence, in two months’ time, my expected sample size is 150-200 women.
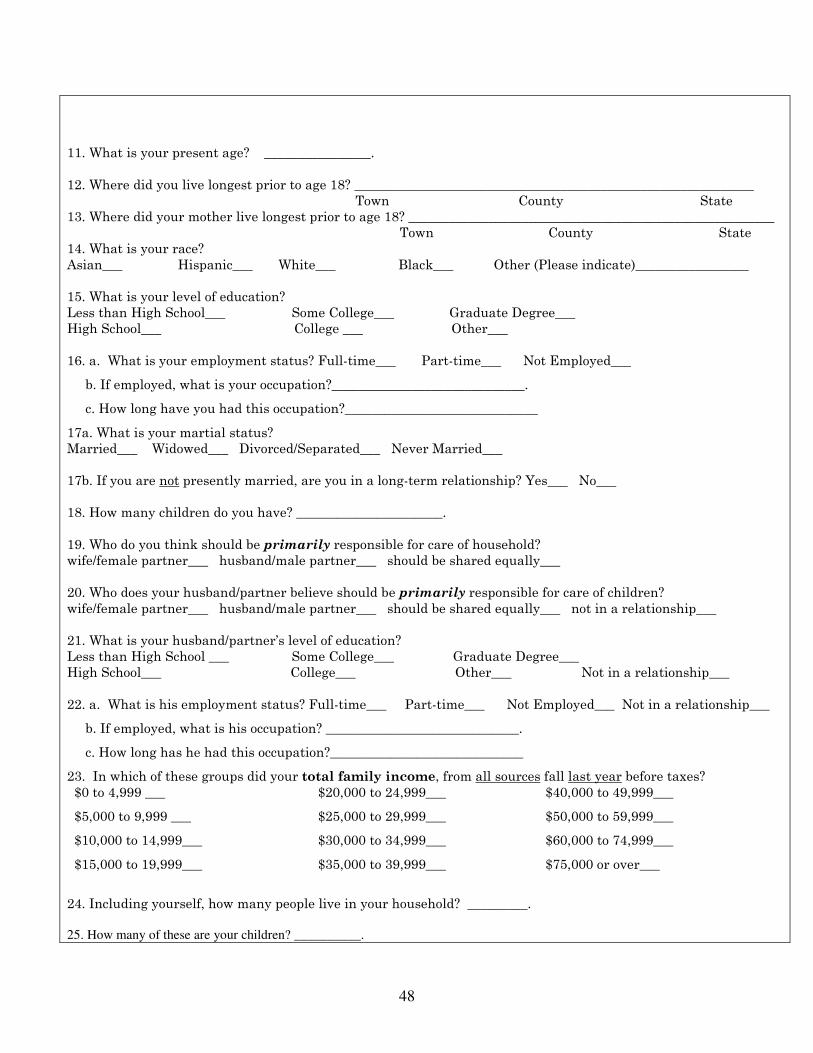
Women who visit the clinics are asked to fill out a self-administered questionnaire
while they are waiting to be attended. Pre-testing indicates that it takes approximately 15
minutes to complete a survey. The questionnaire is composed of both original questions
suggested by the literature and questions taken from previous studies that cover women’s
experience in receiving family planning services, as well as demographic characteristics
20
(e.g., Severy et al, 1990; Bruce, 1990). It consists of closed-ended questions. Based on
the recommendations from the clinic managers, I constrained the length of the
questionnaire and tried to formulate the best measures possible in a two-page survey. A
copy of the survey is contained in Appendix A.
As stated earlier, one of my study’s goals is to reconcile responses wherever
possible between information provided by the managers and staff at the clinics, and
clients. Thus, I conduct interviews with managers and staff as well.
Managers at the clinics have given permission for these interviews to take place. I
collect data on their training, experiences in rural areas, their understanding of local
traditions, norms, and obstacles preventing contraceptive use among Appalachian
women, the qualifications and training of their staff members (in general and in relation
to Appalachian women), and finally, their perceptions of the family planning services. In
this way, I am able to obtain information on the perceived strengths and weaknesses of
each clinic and their views as to how things can be improved to meet the needs of
Appalachian women. These perspectives are compared against questionnaire responses
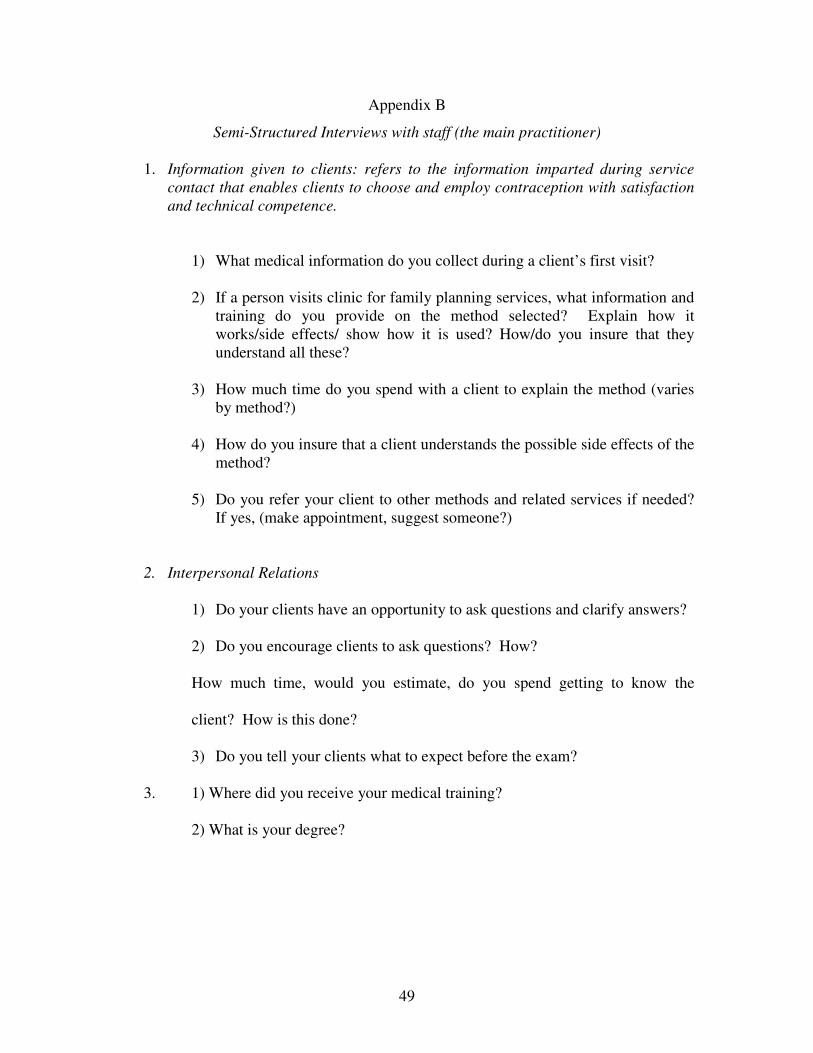
from the clients. I intend to interview 7 managers and about 10 staff members. The
interviews should take about 30 minutes to complete (Copies of the interviews are in
Appendix B and C).
All questionnaires have received human subjects’ approval from the Institutional
Research Board at Virginia Tech.
Variables
In this section, I present the variables I use in the study and how I operationalize
them using the client survey.
21
Dependent Variables:
Overall Satisfaction: a categorical variable that has the values 0=not satisfied;
1=somewhat unsatisfied; 2=somewhat satisfied; 3=satisfied.
Satisfaction Index: This variable addresses clients’ overall satisfaction with services. I
construct a composite index, which consists of the Likert-type statements on a four-point
scale: “disagree” (1), “somewhat disagree” (2), “somewhat agree” (3), and “agree” (4).
The following statements are included in the measure:
a) I find the waiting room comfortable;
b) I find the staff friendly;
c) I find the staff well trained;
d) I have enough privacy during my visit;
e) I feel that the main practitioner spends time to get to know me;
f) I feel I can discuss my concerns with the practitioner;
g) I feel I can trust the practitioner;
h) The practitioner tells me what to expect before the examination;
i) I feel that the use of the family planning method was clearly explained to me;
j) I was informed about possible side effects of the family planning method;
Quality of Care: This variable is meant to assess quality of the family planning services.
To measure this, I construct a quality of care index, which is a subset of the satisfaction
index. The following statements are included in the measure:
a) I find the waiting room comfortable;
c) I find the staff well trained;
h) The practitioner tells me what to expect before the examination;
i) I feel that the use of the family planning method was clearly explained to me;
j) I was informed about possible side effects of the family planning method;
22
The higher the index score, the more satisfied women should be with the quality of
services. Summed scores will range from 5 (disagreement with all statements) to 20
(total agreement with all statements).
Staff Interaction: This variable indicates how clients feel about their interactions with
staff. To measure this, I construct a composite index, which consists of the Likert-type
statements on a four-point scale: “disagree” (1), “somewhat disagree” (2), “somewhat
agree” (3), and “agree” (4). The following statements are included in the measure:
b) I find the staff friendly;
d) I have enough privacy during my visit;
e) I feel that the main practitioner spends time to get to know me;
f) I feel I can discuss my concerns with the practitioner;
g) I feel I can trust the practitioner;
The higher the index score, the more satisfied the women should be with their interaction
with staff. Summed scores will range from 5 (disagreement with all statements) to 20
(total agreement with all statements).
Independent Variables:
I look at several measures of Access to Family Planning services:
Distance: this is a continuous variable. It measures the distance the client has to travel to
the clinic is based on the question, “How long does it take you to get here?”
Means of Transportation: this is a categorical variable, which is based on the question,
“How do you get to the clinic?” Responses include “I walk”, “I drive”, “I get a ride from
someone”, “I take a bus”, and “Other”.
Appointment: three variables measure the ease of appointments. The first variable is a
categorical variable, and is based on the question, “Do you have to make an appointment
23
prior to coming to the clinic or can you just walk in?” Responses include “I have to make
an appointment” and “I can walk in”. The second variable is also categorical, and is
based on the question, “Could you make an appointment on the first try?” Responses are
simply “yes” or “no”. Finally, the third variable is continuous, and is based on the
questions, “How many times did you call for an appointment?”
Waiting time: this is a continuous variable, which is based on the question, “Once in the
clinic, how long do you have to wait before you are seen?”
Demographic Variables:
Appalachian Residence: the residence of the respondent is based on the question, “Where
were you born?” and “Where have you lived longest?” Based on their residence, I will
code this variable as 0=Appalachian and 1=non Appalachian.
Age: this continuous variable is based on the age of the respondent, which was assessed
by simply asking the respondent to not their age.
Race: this is a categorical variable, based on the question, “What is your race?” The
question will be coded according to the five response categories given, as follows:
0=White, 1=Black, 2=Hispanic, 3=Asian, 4=Other.
Education: this categorical variable is based on the question, “What is the highest degree
you earned in school?” Responses included “Less than High School”, “High School”,
“Some College”, “College”, “Graduate Degree”, and “Other”.
Employment Status: this categorical variable is based on the question, “What is your
employment status?” Respondents could answer “Full-time”, “Part-time”, and “Not
employed”.
24
Marital Status: this categorical variable is coded according to the response categories
given as follows: 1=married; 2=widowed or divorced and not in a long-term relationship;
3=never married and not in a long-term relationship; 4=not married but in a long-term
relationship.
Income: this variable is continuous and is based on the question, “In which of these
groups did your total family income, from all sources fall last year before taxes?”
Husband/Partner’s Employment Status: this variable is categorical and is based on the
question, “What is your husband/partner’s employment status?” Responses include “Full-
time”, “Part-time”, and “Not employed”.
Husband/Partner’s Education: this variable is categorical and is based on the question,
“What is the highest degree your husband/partner earned in school?” Responses include
“Less than High School”, “High School”, “Some College”, “College”, “Graduate
Degree”, and “Other”.
Analytic Strategy
The first question this study asks is “How satisfied are Appalachian women with
the family planning services they receive?” To answer this question, I begin with my
main dependent variable, which is “Overall, how satisfied are you with the services you
receive here?” I run cross-tabulations to determine whether Appalachian background
matters. I also use demographic information to indicate whether location of the clinic
affects women’s satisfaction with the family planning services.
The second and third questions I ask are, “What factors influence their
satisfaction?” “Are there differences in these factors between Appalachian women and
25
non-Appalachian women in receiving these services?” In addition, I ask “Does staff
training in relation to Appalachian or rural lifestyles influences Appalachian women’s
satisfaction?” I analyze these questions using regression analysis. I plan to estimate a
number of equations.
1. Satisfaction = α + β (Appalachian) + ε
2. Satisfaction = α + β (Appalachian) + γ(Demographic) + ε
3. Satisfaction = α + β (Appalachian) + γ(Demographic) + δ(Access)+ ε
4. Satisfaction = α + β (Location) + ε
5. Satisfaction = α + β (Location) + γ(Demographic) + ε
6. Satisfaction = α + β (Location) + γ(Demographic) + δ(Access)+ ε
Similar equations will be used for the Quality of Care and Staff Interpersonal
Relations with Clients’ indices.
The fourth question is, “Do perceptions of providers about the quality of services
match the perceptions of their clients?” To answer this question, I use the information
from the client survey and match it with the information provided by the staff and
directors of the clinics. During interviews with the staff, in addition to general discussion
of their clinics and clientele, I also ask them to respond to the same statements that the
clients are asked. This allows me to match the client information with the information
received from the staff and directors interviews. I also collect data on staff experiences in
rural areas, their understanding of local traditions, norms, and obstacles preventing
contraceptive use among women, the qualifications and training of their staff members,
and finally, their perceptions of the family planning services. This complementary
information helps me understand the potential problems with the family planning services
26
as well as the areas that need improvements. Finally, before proceeding to analysis, I
have developed several hypotheses based on the literature review.
Hypothesis 1: I expect that Appalachian women will be less satisfied with the quality of
family planning services than non-Appalachian women. According to the literature, it is
more difficult for rural women to establish trust with the health-care providers, as health-
care professionals are often viewed as outsiders in rural communities.
Hypothesis 2: Women that have problems with access to family planning services will be
less satisfied with the services. More specifically, women that have to travel a long time
to the clinic are expected to be less satisfied with the services. Furthermore, women that
have to depend on others to get to the clinic or use a bus will be less satisfied with the
services. Having to make an appointment before coming to the clinic, or not being able
to make an appointment on the first try will also decrease satisfaction with the services.
Finally, waiting long before a practitioner sees women will decrease clients’ satisfaction
with the services.
Hypothesis 3: Interpersonal relations with the staff that fit with culture would lead to
greater satisfaction with the services. Thus, the health-care providers who are familiar
with the cultural patterns of rural women will appeal to them more than those who are
not.
27
Chapter Four: Results
The findings of this study are presented in four parts. I first present descriptive
statistics of the study. Second, I discuss issues pertaining to satisfaction and quality of
family planning services. Next, I present results from qualitative interviews with
managers and staff. Finally, I discuss major findings and limitations of the study.
Locations
All six clinics are non-profit, family planning clinics in rural areas that have
sliding-scale fees. Five of these clinics – clinics A, B, C, D, and E – are affiliated with
each other; the last one, clinic F, is under different management. Two of these clinics –
clinics D and F – tend to be used by a more diverse client base, including students, those
new to area, and women with higher levels of education, as well as Appalachian/rural
women.
Data Limitations
One of the major limitations with administering a survey was missing data.
Women that came to the clinic for the first time could not answer questions pertaining to
their satisfaction with the services, and there were more first-timers than anticipated.
Furthermore, women tended to skip questions on demographic characteristics, such as
residence, marital status, husband/partner’s educational and employment status, and
income. For cross-tabulation analysis, I decided to exclude women that are first-time
users of the family planning services.
28
Descriptive Statistics
Before examining my hypotheses, it is useful to give an overview and summary of
the data collected in various locations. In addition to information on satisfaction with
family planning services, the survey also includes demographic variables, such as
residence, age, race, education, employment status, marital status, husband/partner’s
employment status, and husband/partner’s education.
First, the final number of surveys collected is 210. Of these, 43 were collected in
A, 49 in B, 28 in C, 17 in D, 19 in E, and 54 in F. Of these 27 are first-time users.
From the entire sample, 66% of women are Appalachian and 25% of women are non-
Appalachian (9% did not answer the question). The majority of non-Appalachian women
visit clinics F (58.8%) or D (33.3%); these are the two clinics that draw more college
students. The age range of women visiting family planning services goes from 13 to 54
years of age, with mean age being 25.
White residents comprise 83.8% of the total population and other races comprise
13.8%. The findings from my survey indicate that 40% of women are not employed,
followed by 28.6% who are part-time employed, and only 27.1% who are full-time
employed. The highest number of women who are not employed visit clinics A and B
(see Table 1). However, some of the women that are not employed are between 13 and
17 years of age, and still attend high school (see Table 2).
It is interesting to note the prevalence of low-paid jobs among women in the
sample. From those that are full or part-time employed, most women work jobs as
cashier, customer service representatives, factory workers, waitresses, hairdressers, and
the like. One reason for that may be low level of education. Just over one-third of the
29
women do not have education beyond high school: 4.8% have less than high school
education, 30% have a high school diploma, 25.7% have some college education,
followed by 17.6% of women with college education, and only 6.7% with a graduate
degree. Most women with some college or college degree come from clinics F and D:
again, college student populations are higher here (See Table 3).
Their husbands/partners have a better employment situation – 42.4% of them are
full-time employed, 10.5% are part-time employed, and only 13.3% are not employed.
However, most of them also work in low-wage jobs, such as mechanic, cook, dishwasher,
technician, clerk, welder, and the like (the rest are missing). The economic structure of
the Appalachian region, which is often characterized by small, intergenerational family
businesses, does not present many opportunities for careers. Salaries tend to be lower,
and unemployment and underemployment rates are higher (Bushy, 1998).
The demographic characteristics describe women in the study as poorly educated
with few opportunities for jobs and professional careers. However, it is not possible to
know how many respondents are students. If these data do not include many students,
these findings are consistent with previous literature review, which portrays women as
being poor, and work as homemakers, services workers, or laborers (Bushy, 1998;
Edwards et al, 1996; Oberhauser, 1995; Piccinino and Mosher, 1998).
Accessibility
The main goal of this study is to assess the level of satisfaction with family
planning services in Southwest Virginia. Before I present results regarding satisfaction, I
consider some issues that may have an impact on how women perceive the quality of
30
services. Obviously, one critical element in the provision of any type of service is
accessibility. In Appalachia, in particular, this is especially important as income tends to
be relatively low, and public transit is almost non-existent.
In the survey, I included several questions to measure accessibility. Women were
asked how they get to family planning services, whether or not they have to make an
appointment prior to their visit, whether or not they can make an appointment on the first
try, and how long they have to wait before they are seen.
From the responses, it became apparent that transportation remains one of the
greatest obstacles to family planning services in the region. Even though the majority of
women drive to the clinics (80.6%), 14.4% of them have to get a ride from someone else,
and 4.4% have to walk. Lack of transportation is most prevalent in clinics A and C:
27.8% have to get a ride from someone else to clinic A; 27.3% must do so to visit C (See
Table 4).
In most places, women have to make an appointment before coming to a clinic.
Only 11.4% of women from clinic A, 14.6% from B, and 2.1% from F report that they
can just walk in (See Table 5). However, when asked about whether they can make an
appointment on the first try, most women (93.8%) report that they are able to do so (See
Table 6). The mean waiting time before a woman is seen in a clinic varies by location; in
clinics A, B and C women have to wait longer, over half an hour, than in other places.
Average times range from 15 minutes to over half an hour (See Table 7).
From these results, we can conclude that accessibility is more problematic in
clinics A, B and C, where women do not have transportation to get to the services, and
the mean waiting time is very long.
31
Satisfaction with Family Planning Services
Question 1: “How Satisfied are Women with the family planning services that they
receive?”
The results of this study indicate that the overwhelming majority of women (86%)
that come to the clinics are satisfied with family planning services. Among the
respondents, 92.4% are willing to come back to the services, and 96.7% would
recommend these services to their friends or relatives.
Since there is so little variation in overall satisfaction (“Overall, how satisfied are
you with the quality of care you receive?”) I decided to employ the satisfaction index as
my main dependent variable. This index was comprised of responses to the following
statements: I find the waiting room comfortable; I find the staff friendly; I find the staff
well trained; I have enough privacy during my visit; I feel that the main practitioner
spends time to get to know me; I feel I can discuss my concerns with the practitioner; I
feel I can trust the practitioner; The practitioner tells me what to expect before the
examination; I feel that the use of the family planning method was clearly explained to
me; I was informed about possible side effects of the family planning method. Scale
score ranges from 10 to 40, where low scores indicate dissatisfaction with the family
planning services and high scores indicate satisfaction with the family planning services.
A reliability test of the scale produced a Cronbach’s alpha coefficient of .85.
Using mean satisfaction score with the family planning services, I checked
whether there are differences in responses by Appalachian/non-Appalachian background,
location of the services, women’s educational level, employment, and marital status. It
turns out that Appalachian women (36.2) are about as satisfied with the family planning
32
services as non-Appalachian women (37.9) (See Table 8). Satisfaction by clinic did not
vary much; scores ranged from 35.4 to 39, and are not very different. However, clinic F,
at 35.4, appears to differ from the rest (See Table 9). Women with less education are
more satisfied with the services. However, satisfaction by education did not vary much
either; scores ranged from 35.9 to 39.2 (See Table 10). Employment status does not
affect satisfaction very much, as women with full-time employment have mean
satisfaction score of 38.1 as compared to part-time (36.8) or unemployed women (37.5)
(See Table 11). Similarly, marital status does not affect satisfaction a lot (See Table 12).
However, married women are more satisfied with family planning services than other
groups (See Table 12).
Next, I apply regression analysis in order to check the effect of each of these
variables on satisfaction.
Questions 2 and 3: “Are there any significant differences in satisfaction with the
family planning services between Appalachian and non-Appalachian women?”
”Does staff training in relation to Appalachian or rural lifestyles influence
Appalachian women’s satisfaction?”
I had hypothesized that Appalachian women will be less satisfied with the family
planning services. For rural women it is more difficult to establish trust with the health-
care providers, as health-care professionals are often viewed as outsiders in rural
communities. Thus, before we control for variables that potentially affect satisfaction, we
start with a simple regression of satisfaction index on a dummy for Appalachian
background. The equation of the model is
33
Satisfaction = α +β (Appalachian)+ε
This is just a simple correlation measure to which we can attach standard errors. Model
A in Table 13 presents the results of this regression. The coefficient on the Appalachian
dummy is significant (p<.001) and its value is 1.79. Contrary to expectations, however,
Appalachian women report a significantly higher satisfaction with the family planning
services than non-Appalachian women.
Next, I control for age, marital status, education, and employment status. The
equation of the model is
Satisfaction = α +β (Appalachian)+γ (Demographics) +ε
After adding these control variables, Appalachian background is still significant.
Additionally, women with some college have a lower satisfaction score when compared
with those with high school. This seems a little bit puzzling, considering that women
with college and graduate degrees do not report a significantly different satisfaction
score. It also appears that satisfaction increases significantly with age, such that older
women are more satisfied with the family planning services (See Table 14).
Results are not too different for these variables when we add control variables for
access to clinic (Table 15, Model C). The equation of the model is
Satisfaction = α +β (Appalachian)+γ (Demographics) + δ (Access)+ε
Appalachian background remains significant, as well as age (See Table 15).
In an alternative set of models, instead of using Appalachian background as one
of the regressors, I use location of the clinics to see if Appalachian women at these
locations are more satisfied with the services. Hence, Model A in Table 16 shows
regression of the satisfaction score on a set of location dummies. Because it is under
34
different management, it appears to have the most different clientele, I use clinic F as the
reference location. Hence, the dummy coefficient shows the differences between the
other locations and clinic F and whether these differences are significant. It is interesting
to see that the reported satisfaction scores in all other locations are significantly higher
than the ones in F. To investigate this further, I add other controls, such as demographic
controls in Model B and accessibility controls in Model C (See Tables 17-18). Location
remains statistically significant, while at the same time, other control variables are not.
Location is thus the main determinant of satisfaction, and Appalachian background is not
such an important predictor of satisfaction. Hence, location captures all the differences in
satisfaction scores and explains variation in the main dependent variable.
Next, I am interested in knowing whether quality of the family planning services
affects women’s satisfaction. To address this, I run regression equations similar to those
in Tables 13-15. Tables 19, 20, and 21 show the regressions for a quality of care index
on the various demographic and access variables. The index was composed of the
responses to the following statements: I find the waiting room comfortable; I find the
staff well trained; the practitioner tells me what to expect before the examination; I feel
that the use of the family planning method was clearly explained to me; I was informed
about possible side effects of the family planning method. Scale score ranges from 5 to
20. It is interesting to see that when it comes to perceptions of quality significant
differences are reported in Model A between Appalachian and non-Appalachian women.
Marital status is significant in Models B and C (Tables 20 and 21): women that are not
married and not in a long-term relationship appear to be less satisfied with the services in
comparison to married women. Furthermore, women with some college degree report
35
lower satisfaction scores. The reason for that may be that women with more education are
more critical of the services that they receive. This may be due to the fact that some
respondents are college students and come from backgrounds where they received private
services. Also, education is an indicator of class, and again may suggest having gone to
private family planning services in the past. This previous experience allows them to
compare the quality of services in private clinics with the services they receive in public
clinics. Finally, accessibility appears to be a significant determinant of satisfaction.
Women that have to wait long to be seen by a practitioner, or get a ride to a clinic from
someone else, report lower satisfaction with the family planning services.
Similar to Tables 16-18, we also run a quality satisfaction index on location
dummies and other variables (See Tables 22-24). The results presented here are
consistent with those reported in Tables 16-18. That is, differences between clinic F and
some of other locations remain significant.
Finally, I address the question of how staff interaction affects women’s
satisfaction with the family planning services. In Tables25, 26 and 27, I run regression of
staff interaction with their clients on demographic and access variables. The staff
interaction index was comprised of the responses to the following statements: I have
enough privacy during my visit; I find the staff friendly; I feel that the main practitioner
spends time to get to know me; I feel I can discuss my concerns with the practitioner; I
feel I can trust the practitioner. The score ranges from 5 to 20. In Model A it turns out
that Appalachian women view staff interaction more favorably than non-Appalachian
women. However, after adding demographic and access variables in Models B and C,
Appalachian background is no longer significant. It also appears that with age, women
36
are more satisfied with staff. Women with college or graduate degree appear to be less
satisfied with the staff. In terms of accessibility, women that have to wait long before
they see a practitioner are less satisfied with the staff. Similar to previous results, in
comparison to F, women at other locations are more satisfied with the staff.
Question 4: “Do perceptions of providers about their services match the perceptions
of their clients?”
Based on the client data, overall, Appalachian women believe they receive good
care in family planning services. They also think that the staff is professional and
properly trained.
One major problem seems to be access to services. Women report difficulties
getting to the clinic or having to wait a long time before a practitioner sees them.
Differences were also seen in reported satisfaction between various locations. As it
turned out, clients in the affiliated clinics A-E, - were more satisfied with the services
than were those who attended clinic F. Particularly,- at clinic F, with its more diverse
college student population-, it is likely that some of these women have gone to private
family services in the past.
To see how closely clients and staff perceptions match and to investigate some
potential issues that women visiting these clinics face, I conducted interviews with the
managers and staff from the clinics where survey data were collected.
From the interviews with the managers and staff, it appears that the staff enjoyed
their work. They say that they are professional, patient, and considerate of their clients’
needs. The staff sees themselves as more than just healthcare practitioners who only
37
have an effect at one point in time. They want to educate women and promote good
health habits.
Rightly or wrongly, staff perceive Appalachian women to be poor, with little or
no education and with relatively more health problems than women from other regions.
Speaking of Appalachian women, one nurse noted,
It may be very disheartening to interview a woman in her 20s that has a full
mouth of dentures. And this is her environment and situation that brings her to
the place. It will probably require for her more time in the clinic setting as she
has more issues related to economics, relationships (men that have a lot of
problems), and socioeconomic problems.
Staff also describe Appalachian women as more private and proud than non-
Appalachian women. They see Appalachian women as rooted in the community and their
rural setting, and see that it is difficult for them to establish trust with people outside their
family or community. As one nurse put it,
They are more, I do not want to say, backward, [but] more uncomfortable in
asking for things, more private. If something bad happens in the family,
it stays in the family. They do not want to step out…
However, and perhaps despite these views, staff’s professionalism, knowledge of
local culture, traditions, and norms, and dedication to their work, clients in the study
seem comfortable coming to the clinics and discussing problems with the staff. This may
be a result of the fact that many staff were born and raised in the area and went to local
universities to receive their nursing degree. This appears to prepare them to work with the
Appalachian women in this study, as well as with lower-income and rural women in
general. According to one of the nurses,
… We serve many good rural poor people. I think they like us. And I think they
trust our clinic. They spend more time with the rural people more than in private
settings. In the private sector there is no such diversity. Rural people pick out
38
doctors that are comfortable with this kind of population. And our doctors are
much more open to this kind of clientele.
Of course, the extent to which staff’s views and background influence
Appalachian women’s attendance at these clinics is unknown as only returning
respondents answered questions about satisfaction. Thus, it is possible that those who
were dissatisfied did not return, and their number is unknown.
Staff also indicated some of the obstacles to family planning that they believe
Appalachian women experience. One major problem unanimously mentioned by the staff
is transportation, and issue that was significant in the client survey as well: many of the
women either have to get a ride from someone, or walk to the clinic, as public
transportation is not available.
Financial difficulties also were commented upon staff. From the survey, I found
that the majority of women are not employed and live in the households with relatively
low income. In private settings these women have to pay upfront for services they
receive. Hence, even though the clinics are trying to help these women by offering a
sliding scale for prices, it is still problematic for many clients. As one nurse noted,
Probably the biggest barrier would be, number one, they do not know we are here,
and when we operate. They do not have money, or resources; they try to seek our
medical services that are free. Preventative services are on the back shelf. They
are not thinking prevention and they are living in the here and now. And many
women do not know that these services exist.
Furthermore, to receive the discount, women have to show proof of income.
Some women cannot get this information from their partners. And once they receive a
medical bill, according to the staff, they do not come back to the clinic. Also, there is a
problem with eligibility for the teenage population. Many teenagers that come to the
39
clinic do not want their parents to know about it. However, in order to get a discount,
they need to show the proof of their parents’ income. As one nurse put it,
…And for incomes, those teenagers that live between lines, they do not think that
their parents support them and their parents’ income has to be included…
I was also interested in staff perceptions concerning why Appalachian women
may not attend clinics, as this also indicates staff’s perceptions of Appalachian culture
and obstacles to family planning. The staff reported that many women do not come to the
services because of confidentiality issues. In this region, according to staff, - women live
in small communities. For instance, women that come to the family planning services to
treat an STD feel afraid that their friends or relatives may find out about it. Some women
will even travel to a clinic in a different county to avoid confidentiality issues. As one
nurse noted, “A woman that has an STD does not want to come here because she knows
everyone”. Similarly another nurse noted,
Rural people are more prideful. They have a lot of things going on but they will
not tell you because of pride. They need to trust you first; they need to get to
know you first before they come to you. If they come back, you will eventually
gain their trust. Because it is small, rural, they do not want neighbors to know, as
it may be a problem. In a small town, the teenager does not want people to know
she is pregnant, whereas in your cities, they do not care.
Also, staff believe that many rural women are unaware of existing services. As
one of the nurses put it,
… many women do not know that the services exist. And if they know they exist,
they may have had bad experiences somewhere else, and they think we are like
everybody else. They are afraid we may not have respect or dignity. We are
always looking for ways to identify women at risk that can benefit from the
services. I believe the word of mouth means a lot.
However, since my survey was only administered to those who attend family
planning services, I cannot know how accurate this perception is.
40
As is true with the provision of any type of service, there is always room for
improvement. In particular, some recommendations of the staff were with regard to
accessibility. A couple of staff members mentioned how useful and helpful it would be
to have a mobile clinic, which could travel to remote areas on the regular basis. As one
nurse noted,
Well, ideally, and this is not going to happen, is to have some kind of
transportation [provided by a clinic] or to have a clinic in the outlying area. A
mobile clinic would allow us to go to different places and do pelvic exam.
However, it all comes down to money.
Anther recommendation was to have more extended hours as well as days when
women can visit the clinic.
If I could improve something about this clinic it would be to offer our services
more frequently. I would like for us to be able to expand the family planning
program and truly offer services more frequently than once a week… Ideally, I
think if we could expand our hours and do our clinic more frequently than once a
week that would be certainly an opportunity to see more people.
From the qualitative interviews, it appears that staff is doing a good job at
assisting the rural Appalachian women who visit the clinics. However, as in client
survey, staff reported problems with access to family planning services, such as
transportation, unawareness of women of existing services, financial difficulties, and the
need of more days and hours of clinic operation.
41
Chapter Five: Discussion
Using the Health Lifestyles Model in the study of family planning services in
rural areas, I have argued that the cultural and socioeconomic determinants of lifestyle,
influence life chances and are thus important in explaining why or why not women are
satisfied with the family planning services (Cocherham et al, 1997). The unique history,
economic structure, beliefs and traditions of the Appalachian region provide a basis for
identifying a particular culture and people’s life chances. By understanding the context of
a setting, policies can be targeted at improving the quality of family planning services in
rural areas of Appalachia.
Culture is a signifier of women’s life chances, or in other words, their abilities to
enjoy the “good things” in life. However, because traditional gender roles are common in
Appalachian culture, women in the study are disadvantaged by their gender, as well as by
class. Together, gender and class can impede access to family planning services, the
ability to choose services, and switch to a different provider if not satisfied with the
current services. Many Appalachian women remain economically dependent upon their
husbands, and have low levels of educational attainment. They are reluctant to pursue
careers, and instead, become caregivers of family members. Adhering to a traditional
gender ideology creates obstacles to access to family planning services. Having to depend
on their husbands or partners for transportation, rural Appalachian women have trouble
with access to family planning services. At a more personal level, Appalachian women
may have difficulties establishing trust with health-care providers, which might affect
their perception of the quality of family planning services.
42
The goal of this research was to assess the quality of family planning services in
rural areas of Southwest Virginia. As was mentioned above, culture plays a significant
role, as it may affect access to and perceptions about the quality of services. Therefore,
the main question that I address is how satisfied Appalachian women are with the family
planning services. To take culture into account, I investigate some of the factors that may
influence their satisfaction. To determine the importance of these factors, in particular
with respect to Appalachian culture, I compare Appalachian and non-Appalachian
women. Furthermore, I consider whether training in relation to Appalachian or rural
lifestyles influences Appalachian women’s satisfaction. Finally, I want to know if
perceptions of providers about their services match the perceptions of their clients. These
questions seek to assess how and if the cultural and socioeconomic aspects of rural
Appalachian women’s lives influence their experiences of receiving family planning
services.
Several important observations came out of this research. The demographic
characteristics of the women in the study, as a group, are consistent with the previous
literature review, which describes them as being poorly educated and work as
homemakers, service workers, or laborers (Bushy, 1998; Edwards et al, 1996;
Oberhauser, 1995; Piccinino and Mosher, 1998). At the same time, it is possible that my
data are somewhat skewed because some of the respondents are college students. Still,
the presence of college students also increases the educational level of the entire sample,
so it is likely that the overall educational level is quite low. The real issue is whether or
not the employment levels I found were characteristic of the region, as students are less
43
likely to work for pay and may thus deflate the employment level of the women in the
survey.
Through interviews with the staff and managers, and client surveys, I find that the
majority of women are satisfied with the family planning services. Moreover,
Appalachian women appear to be more satisfied with the services than non-Appalachian
women, which contradicts my hypothesis. This could be because many staff were born
and raised in the area and went to local universities to receive their nursing degree. This
appears to prepare them to work with Appalachian women, as well as lower-income and
rural women in general. At the same time, the fact the survey was conducted among those
who were returning to the clinic means that I cannot be sure how many were dissatisfied
and thus would not come back.
The location of the clinics turned out to be significant in relation to satisfaction
with the family planning services. At clinic F, with its more diverse college student
population, women report lower satisfaction with the family planning services than at
other clinics. One reason for that may be that more of these women have gone to private
family planning services in the past than is true of the other clinics. This previous
experience allows them to compare the quality of services in private clinics with the
services they receive in either public or not-for- profit clinics.
In addition, I found that Appalachian women are more satisfied with the services
than non-Appalachian women, which contradicts my hypothesis. The reason for that may
be similar to the above: that non-Appalachian women that come to the services tend to be
more educated, and hence, more critical of the services that they receive. In this sense,
education is a proxy for social class, and indicates a greater likelihood of having been
44
able to afford private services in the past. Services at private clinics could in fact be seen
to be better. But it is also worth noting that services at private-profit establishments carry
none of the stigma often associated with sliding-scale or free services that are often
associated with welfare.
Accessibility remains one of the major problems and obstacles to the family
planning services. In this study, women that report long waiting time and lack of
transportation have lower satisfaction scores with the services. Having to wait long time
before a woman sees a practitioner and/or to depend on others to get to the clinic creates
inconveniences and translates in lower satisfaction with the services. These findings from
the surveys are consistent with the interviews, where staff unanimously identified
transportation as the biggest obstacle to the use of the family planning services. In
addition, the staff reported several areas that they would like to see improved, such as an
implementation of the mobile clinic, extended hours of the clinic operation, as well as
days when women can visit the clinics. Thus, expanding access to services requires more
than simply opening the clinics.
Despite finding that Appalachian women are generally satisfied with the family
planning services they receive, the findings of this study are generally in line with the
theory advanced earlier. Socioeconomic characteristics affected women’s life chances,
with respect to their satisfaction with family planning services. From the data analysis, I
see that accessibility is a major issue for many women, as they need to get rides from
their husbands or their relatives to clinic. Life chances also affect women’s perceptions of
the services that they receive. Not being able to afford private services, many
Appalachian women report higher satisfaction with the services than non-Appalachian
45
women. The reason for this could simply be the fact that Appalachian women may not
have any basis for comparison.
This study has several limitations. One limitation is the fact that I was not able to
conduct in-person interviews with the clients, which would have been ideal. Instead,
because the surveys were self-administered, missing data and inaccuracies were
encountered. Given this and the fact that the data were collected from six clinics, a larger
sample might have provided findings that are more reliable. Another limitation is the
selectivity problem. In other words, the study considers women returning to the clinic.
Hence, the satisfaction scores may be biased upward since women that may have not
been happy with the service, - could have already switched to another provider or have
ceased using these services altogether. Because it was feared that respondents were less
likely to fill out surveys after their appointment, clinic managers felt women should fill
out surveys before a practitioner attended them, while they were waiting to be seen.
However, if the surveys had been administered immediately after their visit, I would have
had better satisfaction data, in the sense that I would have collected data from those who
returned as well as those whom might never return.
Also, based on the recommendations from the clinic managers, I constrained the
length of the questionnaire to a two-page survey that could be run front and back on a
single page. While this might have prompted more women to fill it out, a longer survey
would have allowed me to ask questions that are more detailed about the services. The
shorter survey also constrained my ability to ask questions about gender ideology, and
this variable ultimately could not be included in the analysis.
46
Finally, the constraints of the survey lengthy led to the exclusion of questions that
might have allowed me to separate out student respondents from those who were not in
school, including college students. Since I had data on whether or not the latter were
Appalachian, this did not influence my ability to look at this variable. However, it did
affect my ability to look at some other variables, such as employment, as well as discern
to what extent differences across locations were due to college students.
The next phase of this research should include the in-depth interviews with
women that visit the clinics. There may be additional factors that influence women’s
satisfaction with the family planning services, which have not been considered in this
study. Personal interviews could help explore it further. Additionally, with regards to
satisfaction, I would like to look at income and gender role variables and how they
influence satisfaction.
47
Appendix A (Client Survey)
1. a. Is this your first visit here? Yes___ No___
b. If not, for how long have you been visiting this clinic? ________________.
2. What is the reason for your visit?
Pap Smears___ Diaphragm ___ IUD___
Oral Contraceptives___ Depo Provera ___ Morning-after Pill___
3. a. How long does it take you to get here? (In minutes) _________.
b. How do you get here? I walk ___ I drive___ I get a ride from someone___ I take the bus___ other___
4. a. Do you have to make an appointment prior to coming to the family planning clinic or can you just walk in?
I have to make an appointment___ I can walk in___
b. Could you make an appointment on the first try? Yes___ No___
c. If appointment, how many times did you call for an appointment? _________________________.
5. a. Once in the clinic, how long do you have to wait before you are seen? (In minutes) ________________.
6. Please circle how much you agree with these statements about your visit to the family planning clinic
This is my first visit here ______ (if yes, skip to question 7).
a. I find the waiting room comfortable Disagree Somewhat disagree Somewhat agree Agree
b. I find the staff friendly Disagree Somewhat disagree Somewhat agree Agree
c. I find the staff well trained Disagree Somewhat disagree Somewhat agree Agree
d. I have enough privacy during my visit Disagree Somewhat disagree Somewhat agree Agree
e. I feel that the main practitioner spends
time to get to know me
Disagree Somewhat disagree Somewhat agree Agree
f. I feel I can discuss my concerns with the
practitioner
Disagree Somewhat disagree Somewhat agree Agree
g. I feel I can trust the practitioner Disagree Somewhat disagree Somewhat agree Agree
h. The practitioner tells me what to expect
before the examination
Disagree Somewhat disagree Somewhat agree Agree
i. I feel that the use of the family planning
method was clearly explained to me.
Disagree Somewhat disagree Somewhat agree Agree
j. I was informed about possible side effects
of the family planning method
Disagree Somewhat disagree Somewhat agree Agree
7. In your opinion, are there things that can be improved at this clinic? If so, what? Check all that apply:
prices___ services availability___ location___ staff___ clinic hours ___ other (please specify)_______
8. Overall, how satisfied are you with the quality of care you receive here?
not satisfied___ somewhat unsatisfied ___ somewhat satisfied ___ satisfied___ my first visit___
9. How willing would you be to come to this clinic again?
Not willing ___ Somewhat unwilling ____ Somewhat willing ____ Willing ____
10.Woud you recommend this clinic to your friends? Yes___ No____
48
11. What is your present age? ________________.
12. Where did you live longest prior to age 18? ____________________________________________________________
Town County State 13. Where did your mother live longest prior to age 18? _______________________________________________________
Town County State
14. What is your race?
Asian___ Hispanic___ White___ Black___ Other (Please indicate)_________________
15. What is your level of education?
Less than High School___ Some College___ Graduate Degree___
High School___ College ___ Other___
16. a. What is your employment status? Full-time___ Part-time___ Not Employed___
b. If employed, what is your occupation?_____________________________.
c. How long have you had this occupation?_____________________________
17a. What is your martial status?
Married___ Widowed___ Divorced/Separated___ Never Married___
17b. If you are not presently married, are you in a long-term relationship? Yes___ No___
18. How many children do you have? ______________________.
19. Who do you think should be primarily responsible for care of household?
wife/female partner___ husband/male partner___ should be shared equally___
20. Who does your husband/partner believe should be primarily responsible for care of children?
wife/female partner___ husband/male partner___ should be shared equally___ not in a relationship___
21. What is your husband/partner’s level of education?
Less than High School ___ Some College___ Graduate Degree___
High School___ College___ Other___ Not in a relationship___
22. a. What is his employment status? Full-time___ Part-time___ Not Employed___ Not in a relationship___
b. If employed, what is his occupation? _____________________________.
c. How long has he had this occupation?_____________________________
23. In which of these groups did your total family income, from all sources fall last year before taxes?
$0 to 4,999 ___ $20,000 to 24,999___ $40,000 to 49,999___
$5,000 to 9,999 ___ $25,000 to 29,999___ $50,000 to 59,999___
$10,000 to 14,999___ $30,000 to 34,999___ $60,000 to 74,999___
$15,000 to 19,999___ $35,000 to 39,999___ $75,000 or over___
24. Including yourself, how many people live in your household? _________.
25. How many of these are your children? __________.
49
Appendix B
Semi-Structured Interviews with staff (the main practitioner)
1. Information given to clients: refers to the information imparted during service
contact that enables clients to choose and employ contraception with satisfaction
and technical competence.
1) What medical information do you collect during a client’s first visit?
2) If a person visits clinic for family planning services, what information and
training do you provide on the method selected? Explain how it
works/side effects/ show how it is used? How/do you insure that they
understand all these?
3) How much time do you spend with a client to explain the method (varies
by method?)
4) How do you insure that a client understands the possible side effects of the
method?
5) Do you refer your client to other methods and related services if needed?
If yes, (make appointment, suggest someone?)
2. Interpersonal Relations
1) Do your clients have an opportunity to ask questions and clarify answers?
2) Do you encourage clients to ask questions? How?
How much time, would you estimate, do you spend getting to know the
client? How is this done?
3) Do you tell your clients what to expect before the exam?
3. 1) Where did you receive your medical training?
2) What is your degree?
50
Cultural Information:
1) Have you had experience working with women’s health issues elsewhere?
(where?)
2) In general, how well equipped do you think you are for interacting with
Appalachian and rural women?
3) Did you receive training, which included an emphasis on Appalachian
women? On rural women? If so, what does this training include?
4) What differences, if any, do you perceive between rural Appalachian women
and other women who use this clinic?
5) In your opinion, what are the main obstacles that prevent rural women from
using family planning services?
6) In your opinion, what can be done to encourage rural women to use these
services?
7) What areas of this clinic would you improve to attract more Appalachian
women?
51
Appendix C
Semi-Structured Interviews with directors
Choice of Methods: refers both to the number of contraceptive methods offered on a reliable basis and
their intrinsic variability.
1. Please indicate which of the following services you provide at this time, (please check yes or no for each) and
cost of each service.
Women’s Health
Pap smears � Yes � No
Family Planning Services
Oral contraceptives � Yes � No
Diaphragm � Yes � No
IUD � Yes � No
Depo Provera � Yes � No
Morning-after pill � Yes � No
Questions that can be asked in addition:
1) If any of these services are not provided, why not?
2) Are there choices for women who wish to limit hormonal contraceptive use?
2. Technical competence
1) Do you measure client satisfaction? If so, how?
� Periodic survey
� Occasional survey
� Exit survey
� We do not keep track
� Other______________.
I am going to ask each of the following questions of EACH TYPE of staff member
(because the answers will vary).
1) Can you tell me/describe the different staff members at the clinic?
2) What are the strengths of the staff in working with clients?
3) Have you received any complaints about your staff members? If yes, what kinds
of complaints? Not so much individual, but issues that arise as problematic?
52
4) What educational level is required for the clinic staff?
5) What (if any) additional training is required for the clinic staff?
6) How do you ensure quality of care?
4. Interpersonal Relations
1) Do your clients have an opportunity to ask questions and clarify answers?
If yes, how is this done?
1) Do the main practitioners encourage clients to ask questions? If yes, how is this
done?
2) How would you describe the practitioner’s interaction with clients? Is it strictly
professional, friendly, etc.? What is their source of information about this
(policies, periodic checks, etc., client satisfaction survey?
3) Do they ensure privacy for their clients? If so, how?
4) Do the main practitioners spend some time to get to know the client? If so,
how?
5) Do you get complaints that some practitioners take control?
6) Does the main practitioner tell clients what to expect before the examination?
7) Does the main practitioner explain the family planning method to clients?
8) Does she/he inform the clients about the possible side effects?
5. Mechanisms to encourage continuity – can involve well-informed users managing
continuity on their own or formal mechanisms within the program.
1) What percent of your clients were regular clients last year?
2) Do you try to ensure continuity of services? How? (follow-up care, advertisement
of services, community-based programs)? Why or why not?
53
6. Appropriate Constellation of Services – refers to situating family planning
services so that they are convenient and acceptable to clients.
1) What area do you cover?
2) What are your hours of operation?
3) Do you feel that these hours are sufficient? If no – why not?
4) Do you think more facilities like this are needed?(length of time to wait for an
appointment from time of initial contact)
Cultural questions:
1) Has the staff worked with women’s health elsewhere? (where?)
2) What differences, if any, do you perceive between rural Appalachian women and
other women who come to the clinic?
3) In general, how well equipped do you think staff is for interacting with
Appalachian and rural women?
4) To what extent is staff trained to deal with cultural diversity?
5) Does this training include an emphasis on Appalachian women? On rural
women? If so, what does that training include?
6) In your opinion, what are the main obstacles that prevent rural women from using
family planning services?
7) In your opinion, what can be done to encourage rural women to use these
services?
8) What areas of this clinic would you improve to attract more Appalachian women?
54
Appendix D
IRB
Title of Project: Evaluation of Family Planning Services in Rural Virginia
Principal Investigator: Valentina Lukyanova
The respondent is asked to participate in the survey conducted at family planning
clinics by Valentina Lukyanova. The participation in this study is voluntary.
Purpose of the study
The goal of this study is to assess the perceived quality of family planning
services in rural areas of Virginia. Previous research has shown that women in rural areas
are very dependent on family planning services. Hence, an assessment of current services
would be valuable to policy-makers in allocating funds to rural Virginia. Through
interviews with office managers and directors at the clinics I will collect information
concerning their services and perceptions of women’s needs and through interviews with
clients, I will obtain their perceptions and feeling about the services provided to them.
The goal is to reconcile responses wherever possible, and furthermore, identify
differences between facts provided by the clinics and perceptions of clients. Such an
approach should help determine the needs of rural women in receiving family planning
services.
Duration and Location
The respondent’s participation in the questionnaire will last about 15 minutes and
will be conducted at the family planning clinics (A, B, C, D, E, and F).
Procedures
I will collect the data from women who seek family planning services in the
family planning clinics for one month (the number of participants is not specified).
Women will be asked to fill out a self-administered questionnaire while they are waiting
to be attended. Women that are under 18 years of age will not participate in the survey.
The questionnaire will take approximately 15 minutes. Women will be asked about their
experience with the family planning services and whether or not they feel their needs are
being met. The directors and staff members of the clinics will also fill out a self-
administered questionnaire. Among other things, the directors and staff members will be
first asked about the services they feel they are providing and their goals. In addition,
they will be asked about their experience in rural areas, their understanding of local
traditions, norms, and obstacles preventing contraceptive use among women, and
qualifications of staff members (See the attached questionnaires).
55
Potential Risks and Discomforts
The research is of minimal risk to the subjects. The risks are primarily associated
with the possible breaches in anonymity of clients. To protect participants’ anonymity,
they will not be asked to put their names on the questionnaires. Furthermore, prior to
filling out the survey the respondents will be reassured that the staff will not look at the
questionnaires. When respondents are finished with the questionnaires, they will put
them in a safe place, which will be watched by staff. When I get the questionnaires, I
will place them in a safe file cabinet. And only my committee members and I will have
access to them.
Benefits to the Subjects
This research may be beneficial to clients, directors, and staff members of the
clinics. Clients will give their perceptions of the clinics and problems that they
experience with the use of the family planning services. The directors and staff members
will be asked questions about whether or not they feel their services meet the needs of
their clients. Such an approach should help determine the needs of rural women in
receiving family planning services and improve some existing conditions.
Confidentiality
The information collected from subjects will be used for my thesis. No
information that will be included will reveal the identity of respondents.
Participation and Withdrawal
The participation in this research is voluntary. If the respondent decides to
participate, she is free to do so, or discontinue participation at any time without any
penalty.
56
Appendix E (Tables)
Table 1: Employment Status at Different Locations
Location
A B C D E F Total
Full-Time 31.0 31.8 26.9 5.9 26.3 32.1 28.4
Part-Time 16.7 18.2 38.5 35.3 42.1 39.6 29.9
Not
Employed 52.4 50.0 34.6 58.8 31.6 28.3 41.8
Total 100.0 100.0 100.0 100.0 100.0 100.0 100.0
Pearson’s Chi-Square = 18.25**
57
Table 2: Age at Different Location
Location
A B C D E F Total
13-17 21.4 21.3 11.1 5.9 15.8 12.6
18-25 50.0 44.7 37.0 35.3 63.2 74.1 53.4
26-54 28.6 34.0 51.9 58.8 21.1 25.9 34.0
Total 100 100 100 100 100 100 100
Pearson’s Chi-Square = 28.77***
58
Table 3: Education at Different Locations
Location
A B C D E F Total
Less than High School 2.6 4.7 11.5 11.8 10.5 0.0 5.1
High School 71.1 67.4 34.6 47.1 36.8 3.7 41.6
More than High School 26.3 27.9 53.8 41.2 52.6 96.3 53.3
Total 100 100 100 100 100 100 100
Pearson’s Chi-Square = 85.27***
59
Table 4: Means of Transportation at Different Locations
Location
A B C D E F Total
Walk 0.0 7.1 0.0 0.0 0.0 10.4 4.4
Drive 72.2 81.0 72.7 88.2 80.0 87.5 80.6
Get a ride 27.8 11.9 27.3 11.8 20.0 0.0 14.4
Get by bus 0.0 0.0 0.0 0.0 0.0 2.1 0.6
Total 100.0 100.0 100.0 100.0 100.0 100.0 100.0
Pearson’s Chi-Square = 11.66**
60
Table 5: Appointment at Different Locations
Location
A B C D E F Total
Walk-in 11.4 14.6 2.1 6.2
Appointment 88.6 85.4 100.0 100.0 100.0 97.9 93.8
Total 100.0 100.0 100.0 100.0 100.0 100.0 100.0
Pearson’s Chi-Square = 11.66**
61
Table 6: Appointment on the First Try at Different Locations
Location
A B C D E F Total
No 8.6 5.0 9.1 2.1 4.5
Yes 91.4 95.0 90.9 100.0 100.0 97.9 95.5
Total 100.0 100.0 100.0 100.0 100.0 100.0 100.0
Pearson’s Chi-Square = 4.59
62
Table 7: The Mean Waiting Time at Different Locations
Location Mean St. D. N
A 33.0 34.7 33
B 32.4 27.3 37
C 33.7 26.8 19
D 23.2 15.1 14
E 18.7 11.9 13
F 16.3 7.8 42
Total 26.5 24.5 158
63
Table 8: Mean Satisfaction with Family Planning Services by Appalachian Background
Appalachian Mean Standard Deviation
Non-Appalachian 36.2 3.2
Appalachian 37.9 3.0
Total 37.5 3.2
64
Table 9: Mean Satisfaction with Family Planning Services by Location
Place Mean Standard Deviation
A 37.2 4.6
B 39.0 1.3
C 37.5 3.8
D 38.2 2.6
E 38.8 1.9
F 35.4 3.2
Total 37.4 3.5
65
Table 10: Mean Satisfaction with Family Planning Services by Education
Education Mean Std. D.
Less than high school 39.2 1.1
High school 38.6 2.6
Some college 36.1 3.4
College 37.2 3.4
Graduate degree 35.9 2.9
Other 39.2 0.8
Total 37.4 3.2
66
Table 11: Mean Satisfaction with Family Planning Services by Employment Status
Employment Mean Std. D.
Full-time 38.1 2.6
Part-time 36.8 3.4
Not employed 37.5 3.3
Total 37.4 3.2
67
Table 12: Mean Satisfaction with Family Planning Services by Marital Status
Marital status Mean Std. D.
Married 38.5 1.8
Widowed or divorced and
not in long-term
relationship 38.0 3.4
Never married and not in
long-term relationship 37.1 3.4
Not married but in long-
term relationship 37.0 3.4
Total 37.4 3.2
68
Table 13: Regression of Satisfaction on Appalachian Background, Demographic and
Access Variables (*p. <=. 05, **p. <=. 01, ***p. <=. 001) N = 147.
Model A
Independent Variables Unstandardized Standardized
Appalachian Background 1.79*** 0.25
Constant 36.15
R-Squared 0.06
F-Test 9.88
69
Table 14: Regression of Satisfaction on Appalachian Background and Demographic
Variables (*p. <=.05, **p. <=.01, ***p. <=.001) N = 144
Model B
Independent Variables Unstandardized Standardized
Appalachian Background 1.23* 0.17
Age 0.084** 0.17
Marital Status:
(Reference: Married)
Widowed/Divorced and not
in a long-term relationship -1.16 -0.13
Never Married and not in a
long-term relationship -1.10 -0.14
Not Married but in a long-
term relationship -0.63 -0.1
Education:
(Reference: High School)
Less than High School 1.16 0.06
Some College -2.41 -0.34
College -1.22 -0.15
Graduate Degree -2.03 -0.17
Employed 0.10 0.02
Constant 36.18
R-Squared 0.21
F-Test 3.61
70
Table 15: Regression of Satisfaction on Appalachian Background, Demographic and
Access Variables (*p. <=. 05, **p. <=. 01, ***p. <=. 001) N = 125
Model C
Independent Variables Standardized Unstandardized
Appalachian Background 1.46*** 0.19
Age 0.1*** 0.19
Marital Status
(Reference: Married)
Widowed/Divorced and not in a
long-term relationship
-1.58 -0.17
Never Married and not in a long-
term relationship
-0.98 -0.12
Not Married but in a long-term
relationship
-0.74 -0.11
Education:
(Reference: High School)
Less than High School 1.65 0.008
Some College -2.32 -0.32
College -0.89 -0.1
Graduate Degree -1.70 -0.12
Employed -0.11 -0.02
Access:
Time to get to the clinic 0.00 -0.01
Whether a client needs to make an
appointment -1.30
-0.09
Whether a client is not able to make
an appointment on the first try
-0.12
Waiting Time -0.04 -0.21
Transportation (Reference: Drive)
Whether a client walks to a clinic -2.62 -0.17
Whether a client gets a ride 0.00 0
Constant 40.42
R-Squared 0.26
F-Test 2.43
71
Table 16: Regression of Satisfaction with the Family Planning Services by Location (*p.
<=. 05, **p. <=. 01, ***p. <=. 001) N = 160
Model A
Independent Variables Unstandardized Standardized
Location (Reference: F)
A 1.92*** 0.23
B 3.62*** 0.43
C 2.06*** 0.19
D 2.79*** 0.24
E 3.37*** 0.28
Constant 35.41
R-Squared 0.16
F-test 5.97
72
Table 17: Regression of Satisfaction with the Family Planning Services by Location and
Demographic Variables (*p. <=.05, **p. <=.01, ***p. <=.001) N = 154
Model B
Independent Variables Unstandardized Standardized
Location (Reference: F)
A 1.72*** 0.22
B 2.81*** 0.35
C 1.36*** 0.14
D 2.04*** 0.19
E 3.01*** 0.27
Age 0.04 0.09
Marital Status 0.09
(Reference: Married)
Widowed/Divorced and not
in a long-term relationship
0.04 -0.12
Never Married and not in a
long-term relationship
-1.11 -0.15
Not Married but in a long-
term relationship
-0.65 -0.1
Education:
(Reference: High School)
Less than High School 3.8 0.02
Some College -1.87 -0.27
College -0.60 -0.07
Graduate Degree -1.19 -0.1
Employed 0.4
0.06
Constant 36.07
R-Squared 0.27
F-test 3.62
73
Table 18: Regression of Satisfaction with the Family Planning Services by Location,
Demographic and Access Variables (*p. <=. 05, **p. <=. 01, ***p. <=. 001) N = 134
Model C
Independent Variables Unstandardized Standardized
Location (Reference: F)
A 2.28*** 0.28
B 3.77*** 0.44
C 2.39*** 0.22
D 2.49*** 0.22
E 3.26*** 0.28
Age 0.05 0.09
Marital Status
(Reference: Married)
Widowed/Divorced and not
in a long-term relationship
-1.43 -0.15
Never Married and not in a
long-term relationship
-1.14 -0.14
Not Married but in a long-
term relationship
-0.63 -0.09
Education:
(Reference: High School)
Less than High School 0.98 0.04
Some College -1.62 -0.22
College -0.46 -0.06
Graduate Degree -0.82 -0.06
Employed 0.2 0.03
Access:
Time to get to the clinic 0.00 -0.01
Whether a client needs to
make an appointment
-0.47 -0.03
Whether a client is not able
to make an appointment on
the first try
-0.16 -0.01
Waiting Time -0.03 -0.19
Transportation (Reference: Drive)
Whether a client walks to a
clinic
-1.69 -0.11
Whether a client gets a ride -0.36 -0.04
Constant 37.04
R-Squared 0.31
F-Test 2.54
74
Table 19: Regression of Quality of Care by Appalachian Background, Demographic and
Access Variables (*p. <=.05, **p. <=.01, ***p. <=.001) N = 148.
Model A
Independent Variables Unstandardized Standardized
Appalachian Background 0.92** 0.21
Constant 17.93
R-Squared 0.05
F-Test 6.92
75
Table 20: Regression of Quality of Care by Appalachian Background and Demographic
Variables (*p. <=. 05, **p. <=. 01, ***p. <=. 001) N = 145.
Model B
Independent Variables Unstandardized Standardized
Appalachian Background 0.55 0.13
Age 0.03 0.12
Marital Status:
(Reference: Married)
Widowed/Divorced and not
in a long-term relationship -0.81 -0.15
Never Married and not in a
long-term relationship -1.18*** -0.24
Not Married but in a long-
term relationship -0.74 -0.19
Education:
(Reference: High School)
Less than High School 0.63 0.05
Some College -1.54*** -0.36
College -0.57 -0.12
Graduate Degree -1.13 -0.16
Employed 0.06 0.02
Constant 18.65
R-Squared 0.22
F-Test 3.71
76
Table 21: Regression of Quality of Care by Appalachian Background, Demographic and
Access Variables (*p. <=. 05, **p. <=. 01, ***p. <=. 001) N = 125.
Model C
Independent Variables Standardized Unstandardized
Appalachian Background 0.76 0.17
Age 0.04 0.11
Marital Status
(Reference: Married)
Widowed/Divorced and not in a
long-term relationship
-0.89 -0.16
Never Married and not in a long-
term relationship
-1.06** -0.22
Not Married but in a long-term
relationship
-0.7 -0.18
Education:
(Reference: High School)
Less than High School 0.89 0.07
Some College -1.44** -0.33
College -0.24 -0.05
Graduate Degree -0.41 -0.05
Employed -0.03 0.01
Access:
Time to get to the clinic 0.00 0.00
Whether a client needs to make an
appointment -0.82
-0.1
Whether a client is not able to make
an appointment on the first try -1.78
-0.14
Waiting Time -0.02 -0.16
Transportation (Reference: Drive)
Whether a client walks to a clinic -1.62** -0.17
Whether a client gets a ride -0.13 -0.02
Constant 21.32
R-Squared 0.25
F-Test 2.3
77
Table 22: Regression of Quality of the Family Planning Services by Location (*p. <=. 05,
**p. <=. 01, ***p. <=. 001) N = 162.
Model A
Independent Variables Unstandardized Standardized
Location (Reference: F)
A 1.01*** 0.2
B 1.84*** 0.37
C 0.51*** 0.08
D 1.17*** 0.17
E 1.65*** 0.23
Constant 17.63
R-Squared 0.12
F-test 4.22
78
Table 23: Regression of Quality of the Family Planning Services by Location and
Demographic Variables (*p. <=. 05, **p. <=. 01, ***p. <=. 001) N = 156.
Model B
Independent Variables Unstandardized Standardized
Location (Reference: F)
A 0.68 0.14
B 1.22** 0.25
C -0.07 -0.01
D 0.51 0.08
E 1.4** 0.21
Age 0.00 0.07
Marital Status
(Reference: Married)
Widowed/Divorced and not
in a long-term relationship
-0.88** -0.16
Never Married and not in a
long-term relationship
-1.2*** -0.26
Not Married but in a long-
term relationship
-0.82*** -0.21
Education:
(Reference: High School)
Less than High School 0.37 0.03
Some College -1.25** -0.3
College -0.41 -0.09
Graduate Degree -0.8 -0.11
Employed 0.26
0.07
Constant 18.67
R-Squared 0.25
F-test 3.42
79
Table 24: Regression of Quality of the Family Planning Services by Location,
Demographic and Access Variables (*p. <=. 05, **p. <=. 01, ***p. <=. 001) N = 135
Model C
Independent Variables Unstandardized Standardized
Location (Reference: F)
A 0.96 0.2
B 1.7*** 0.34
C 0.59 0.1
D 0.84 0.13
E 1.62*** 0.24
Age 0.01 0.05
Marital Status
(Reference: Married)
Widowed/Divorced and not
in a long-term relationship
-0.88 -0.16
Never Married and not in a
long-term relationship
-1.12*** -0.24
Not Married but in a long-
term relationship
-0.71 -0.18
Education:
(Reference: High School)
Less than High School 0.49 0.04
Some College -1.09*** -0.26
College -0.27 -0.06
Graduate Degree -0.15 -0.02
Employed 0.25 0.06
Access:
Time to get to the clinic 0.00 0.01
Whether a client needs to
make an appointment
-0.33 -0.04
Whether a client is not able
to make an appointment on
the first try
-0.25 -0.02
Waiting Time -0.01 -0.12
Transportation (Reference: Drive)
Whether a client walks to a
clinic
-1.1 -0.12
Whether a client gets a ride -0.22 -0.04
Constant 19.22
R-Squared 0.27
F-Test 2.07
80
Table 25: Regression of Staff Interaction by Appalachian Background (*p. <=. 05, **p.
<=. 01, ***p. <=. 001) N = 152
Model A
Independent Variables Unstandardized Standardized
Appalachian Background 0.78*** 0.22
Constant 18.24
R-Squared 0.05
F-Test 7.62
81
Table 26: Regression of Staff Interaction by Appalachian Background and Demographic
Variables (*p. <=.05, **p. <=.01, ***p. <=.001) N = 148
Model B
Independent Variables Unstandardized Standardized
Appalachian Background 0.52 0.14
Age 0.05** 0.23
Marital Status:
(Reference: Married)
Widowed/Divorced and not
in a long-term relationship -0.36 -0.08
Never Married and not in a
long-term relationship 0.07 0.02
Not Married but in a long-
term relationship 0.11 0.03
Education:
(Reference: High School)
Less than High School -0.28 -0.03
Some College -0.89*** -0.25
College -0.79*** -0.19
Graduate Degree -0.1*** -0.16
Employed -0.01 -0.02
Constant 17.6
R-Squared 0.14
F-Test 2.31
82
Table 27: Regression of Staff Interaction by Appalachian Background, Demographic and
Access Variables (*p. <=.05, **p. <=.01, ***p. <=.001) N = 126
Model C
Independent Variables Standardized Unstandardized
Appalachian Background 0.6 0.16
Age 0.07*** 0.27
Marital Status
(Reference: Married)
Widowed/Divorced and not in a
long-term relationship
-0.05 -0.15
Never Married and not in a long-
term relationship
0.07 0.02
Not Married but in a long-term
relationship
0.00 0.00
Education:
(Reference: High School)
Less than High School -0.16 -0.02
Some College -0.93*** -0.25
College 0.65*** -0.15
Graduate Degree -1.4*** -0.2
Employed -0.24 -0.07
Access:
Time to get to the clinic 0.00 -0.03
Whether a client needs to make an
appointment -0.49
-0.07
Whether a client is not able to make
an appointment on the first try -0.79
-0.07
Waiting Time -0.02*** -0.23
Transportation (Reference: Drive)
Whether a client walks to a clinic -1.04 -0.13
Whether a client gets a ride -0.05 0.01
Constant 19.19
R-Squared 0.22
F-Test 1.94
83
Table 28: Regression of Staff Interaction by Location (*p. <=. 05, **p. <=. 01, ***p. <=. 001)
N = 165.
Model A
Independent Variables Unstandardized Standardized
Location (Reference: F)
A 0.93 *** 0.22
B 1.73*** 0.42
C 1.32*** 0.25
D 1.59*** 0.28
E 1.48*** 0.25
Constant 17.78
R-Squared 0.16
F-test 6.02
84
Table 29: Regression of Staff Interaction by Location and Demographic Variables (*p.
<=.05, **p. <=.01, ***p. <=.001) N = 165
Model B
Independent Variables Unstandardized Standardized
Location (Reference: F)
A 1.01*** 0.26
B 1.57*** 0.39
C 1.19*** 0.23
D 1.52*** 0.28
E 1.45*** 0.26
Age 0.03 0.13
Marital Status
(Reference: Married)
Widowed/Divorced and not
in a long-term relationship
-0.37 -0.08
Never Married and not in a
long-term relationship
0.02 0.01
Not Married but in a long-
term relationship
0.15 0.05
Education:
(Reference: High School)
Less than High School -0.57 -0.07
Some College -0.62*** -0.18
College -0.27 -0.07
Graduate Degree -0.4 -0.06
Employed 0.07
0.02
Constant 17.37
R-Squared 0.21
F-test 2.8
85
Table 30: Regression of Staff Interaction by Location, Demographic and Access
Variables (*p. <=. 05, **p. <=. 01, ***p. <=. 001) N = 135
Model C
Independent Variables Unstandardized Standardized
Location (Reference: F)
A 1.46*** 0.35
B 2.17*** 0.5
C 1.85*** 0.34
D 1.8*** 0.31
E 1.51*** 0.26
Age 0.03 0.14
Marital Status
(Reference: Married)
Widowed/Divorced and not
in a long-term relationship
-0.63 -0.13
Never Married and not in a
long-term relationship
0.05 0.01
Not Married but in a long-
term relationship
0.16 0.05
Education:
(Reference: High School)
Less than High School -0.22 -0.02
Some College -0.51 -0.14
College -0.1 -0.02
Graduate Degree -0.63 -0.09
Employed -1.12 -0.04
Access:
Time to get to the clinic -0.01 -0.04
Whether a client needs to
make an appointment
-0.12 -0.02
Whether a client is not able
to make an appointment on
the first try
0.11 0.01
Waiting Time -0.02*** -0.27
Transportation (Reference: Drive)
Whether a client walks to a
clinic
-0.63 -0.08
Whether a client gets a ride -0.28 -0.06
Constant 17.72
R-Squared 0.3
F-Test 2.43
86
REFERENCES
Beaver, P. 1991. “Family, Land, and Community”. Pp. 299-307 in Appalachia: Social
Context Past and Present, edited by Bruce Ergood and Bruce E. Kuhre. Dubuque,
IA: Kendall/Hunt.
Bruce, Judith. 1990. “Fundamental Elements of the Quality of Care: A Simple
Framework”. Studies in Family Planning 21: 61-91.
Bushy, A. 1998. “Health Issues of Women in Rural Environments”. Journal of the
American Medical Women’s Association 53:53-56.
Cockerham, William, Alfred Rutten, and Thomas Abel. 1997. “Conceptualizing
Contemporary Health Lifestyles: Moving Beyond Weber”. The Sociological
Quarterly 38: 321-342.
Couto, R.A. 1988. “TVA, Appalachian Underdevelopment, and the Post-Industrial Era”.
Sociological Spectrum 8: 323-347.
Dobie, Sharon, Lorna Gober, and Roger Rosenblatt. 1993. “Family Planning Service
Provision in Rural Areas: A Survey in Washington State”. Family Planning
Perspectives 30:139-142.
Denham, Sharon A. 1996. "Family Health in a Rural Appalachian Ohio County." [Meigs
County] Journal of Appalachian Studies 2 (Fall): 299-310.
DeYoung, Alan J. 1995. "Constructing and Staffing the Cultural Bridge: The School as
Change Agent in Rural Appalachia." [West Virginia School System]
Anthropology & Education Quarterly 26 (June): 168-192.
Edwards, Joellen, Patricia Shuman, and Lee Glenn.1996. “Relationships among
Health Risk Factors and Objective Physical Findings in Well Rural Appalachia”.
Family and Community Health 18:67-81.
Frost, Jennifer. 1996. “Family Planning Clinic Services in the United States, 1994”.
Family Planning Perspectives 28:92-100.
Frost, Jennifer. 2001. “Public or Private Providers? U.S. Women’s Use of Reproductive
Health Services”. Family Planning Perspectives 33:4-12.
Frost, Jennifer, Nalini Ranjit, Kathleen Manzella, Jacqueline Darroch, and Suzette
Audam. 2001. “Family Planning Clinic Services in the United States: Patterns
and Trends in the Late 1990s”. Family Planning Perspectives 33:113-122.
Gorham, Lucy. 1992. “The Growing Problem of Low Earning in Rural Areas”. Rural
Poverty in America, edited by Cynthia M. Duncan. New York: Auburn House.
87
Grady, William, Daniel Klepinger, and John Billy. 1993. “The Influence of Community
Characteristics on the Practice of Effective Contraception”. Family Planning
Perspectives 25:4-11.
Hartlage, Shirley, Cynthia Breaux, Sarah Gehlert, and Louis Fogg. 2001 “Rural and
Urban Midwestern United States Contraceptive Practices”. Contraception
63:319-323.
Hochstrasser, Donald and Gerry Gairola. 1991. “Family Planning and Fertility in
Southern Appalachia: A Community Study”. Human Organization 50:393-405.
Huttlinger, Kathleen, Jennifer Schaller-Ayers, and Tony Lawson. 2004. “Health Care in
Appalachia: A Population-Based Approach”. Public Health Nursing 21: 103-110.
Jones, L. 2002. “Some Observations”. Pp. 155-160 in Appalachia: Social Context Past
and Present, edited by Bruce Ergood and Bruce E. Kuhre. Dubuque, IA:
Kendall/Hunt.
Latimer, Melissa. 2000. “A Contextual Analysis of the Effects of Gender and Place on
Workers’ Income”. Sociology Spectrum 20: 345-356.
Lohmann, R.A. (1990). “Four Perspectives on Appalachian Culture and Poverty”.
Journal of Appalachian Studies Association 2: 76-88.
Oberhauser, Ann. 1995. “Gender and Household Economic Strategies in Rural
Appalachia”. Gender, Place, and Culture 2:51-70.
Piccinino, Linda and William Mosher. 1998. “Trends in Contraceptive Use in the United
States: 1982-1995. Family Planning Perspectives 30:4-10.
Purnell, Larry D. 2003. “People of Appalachia”. Pp. 73-89 in Transcultural Health Care:
A Culturally Competent Approach. Philadelphia, PA: F. A. Davis, 2003.
Severy, Lawrence and Kevin McKillop. 1990. “Low-Income Women’s Perceptions of
Family Planning Service Alternatives”. Family Planning Perspectives 22:150-
157.
Shapiro, Henry. 2002. “Appalachia and the Idea of America. The Problem of the
Persisting Frontier”. Pp. 36-42 in Appalachia: Social Context Past and Present,
edited by Bruce Ergood and Bruce E. Kuhre. Dubuque, IA: Kendall/Hunt.
Tickamyer, Ann R. and Cecil Tickamyer. 1991. “Gender, Family Structure and Poverty
in Central Appalachia”. Pp. 307-14 in Appalachia: Social Context Past and
Present, edited by Bruce Ergood and Bruce E. Kuhre. Dubuque, IA:
Kendall/Hunt.
88
Tickamyer, Ann R. and Cynthia Duncan. 1990. "Poverty and Opportunity Structure in
Rural America." Annual Review of Sociology 16: 67-86.
Wilson, Stephan, Gary Peterson, and Particia Wilson.1993. “The Process of
Educational and Occupational Attainment of Adolescent Females form Low-
Income, Rural Families”. Journal of Marriage and Family 55:158-175.