26
Reporting the incidence, prevalence and survival of Aboriginal and Torres Strait Islander Australians receiving renal replacement. Chapter 10

CHAPTER 10
Reporting the incidence, prevalence and survival of Aboriginal and Torres Strait Islander Australians receiving renal replacement.
Chapter 10

ANZDATA Annual Report – Chapter 10 – End Stage Kidney Disease in Aboriginal and Torres Strait Islander Australians Page | 1
Contents Introduction ........................................................................................................................................ 2
Suggested Citation .............................................................................................................................. 2
New Patients ....................................................................................................................................... 3
Primary Renal Disease ......................................................................................................................... 4
Incidence Rates ................................................................................................................................... 4
Prevalent Patients ............................................................................................................................... 7
Transplantation ................................................................................................................................... 9
Transplant Survival ............................................................................................................................ 11
Dialysis ............................................................................................................................................... 13
Timing of Renal Replacement Therapy Initiation .............................................................................. 14
Incidence and Prevalence by State ................................................................................................... 15
State Incidence .................................................................................................................................. 15
Dialysis by Resident State .................................................................................................................. 17
Transplantation by Referring State ................................................................................................... 18
Deaths by Resident State .................................................................................................................. 18
Geographical Distribution ................................................................................................................. 19
Late Referral ...................................................................................................................................... 20
Vascular Access ................................................................................................................................. 21
Incident Vascular Access ................................................................................................................... 21
Prevalent Vascular Access ................................................................................................................. 22
Patient Flow ...................................................................................................................................... 23
Cause of Death .................................................................................................................................. 24
References ......................................................................................................................................... 25

ANZDATA Annual Report – Chapter 10 – End Stage Kidney Disease in Aboriginal and Torres Strait Islander Australians Page | 2
Introduction
In this chapter, the rates and practice patterns for end-stage kidney disease for people identifying as Aboriginal and Torres Strait Islander living in Australia are reported. We acknowledge the distinctiveness of many nations of Aboriginal and Torres Strait Islander peoples, and respectfully refer to them as Indigenous Australians within this report. Self-identified ethnicity is reported by renal units on behalf of patients.
The collection of ethnicity data in ANZDATA now allows for a patient to nominate more than one ethnicity group, however, consultation regarding reporting of ethnicity data is currently ongoing and reporting guidelines have not been finalised at the time of publication. As a result, ethnicity data throughout this report includes only the first ethnicity category entered for each patient. Future publications will aim to report more accurately on patients identifying as more than one ethnicity.
Denominator population statistics were sourced from the Australian Bureau of Statistics (2019)1 and are stratified by ethnicity. For example, the incidence of renal replacement therapy (RRT) for Indigenous Australians includes the Indigenous Australian population as the denominator. In Australia, Indigenous and non-Indigenous populations possess different age structures: Indigenous populations tend to be younger and demonstrate onset of long-term conditions at ages 10-20 years younger than non-Indigenous communities.
Suggested Citation
ANZDATA Registry. 43rd Report, Chapter 10: End Stage Kidney Disease in Aboriginal and Torres Strait Islander Australians. Australia and New Zealand Dialysis and Transplant Registry, Adelaide, Australia. 2021. Available at: http://www.anzdata.org.au

ANZDATA Annual Report – Chapter 10 – End Stage Kidney Disease in Aboriginal and Torres Strait Islander Australians Page | 3
New Patients
A total of 351 Aboriginal and 29 Torres Strait Islander people (n=380 total of Indigenous Australians) commenced renal replacement therapy (RRT) for kidney failure in Australia during 2019 (table 10.1). The majority (86%) were treated with haemodialysis as their initial RRT modality (figure 10.1). Two pre-emptive kidney transplants were accessed by Indigenous Australians in 2019.
Haemodialysis incidence was approximately 5-fold higher for Indigenous Australians (383 pmp) than for non-Indigenous Australians (81 pmp). In 2019, only 14% of Indigenous Australians accessed peritoneal dialysis as first treatment compared with almost one-quarter of non-Indigenous Australians.
Table 10.1 New Patients (pmp) Australia 2015-2019, with Kidney replacement modality at first treatment Year Modality Indigenous Non-Indigenous Total
2015
HD 252 (322) 1557 (68) 1809 (76) PD 38 (49) 691 (30) 729 (31) Graft 1 (1) 86 (4) 87 (4)
2016
HD 272 (341) 1602 (68) 1874 (77) PD 41 (51) 735 (31) 776 (32) Graft 1 (1) 84 (4) 85 (4)
2017
HD 311 (382) 1822 (77) 2133 (87) PD 49 (60) 748 (31) 797 (32) Graft 0 (0) 121 (5) 121 (5)
2018
HD 283 (341) 1887 (78) 2170 (87) PD 39 (47) 738 (31) 777 (31) Graft 2 (2) 95 (4) 97 (4)
2019
HD 325 (383) 1996 (81) 2321 (92) PD 53 (63) 680 (28) 733 (29) Graft 2 (2) 101 (4) 103 (4)
Figure 10.1 - Percentage of New Patients Commencing on Haemodialysis – Australia
0
20
40
60
80
100
Per
cent
2015 2016 2017 2018 2019
IndigenousNon-Indigenous

ANZDATA Annual Report – Chapter 10 – End Stage Kidney Disease in Aboriginal and Torres Strait Islander Australians Page | 4
Primary Renal Disease
The primary renal diseases of new Australian patients over 2015-2019 are shown in table 10.2. The proportion of Indigenous patients with diabetic nephropathy was substantially higher than for non-Indigenous patients.
Table 10.2 Primary Renal Disease of New Patients Australia 2015-2019 Primary Renal Disease Indigenous Non-Indigenous Diabetic Nephropathy 1158 (69%) 4488 (35%) Glomerulonephritis 151 (9%) 2385 (18%) Hypertension 116 (7%) 1820 (14%) Polycystic Disease 8 (<1%) 890 (7%) Reflux Nephropathy 15 (1%) 270 (2%) Other 114 (7%) 2152 (17%) Uncertain 66 (4%) 708 (5%) Not reported 41 (2%) 230 (2%) Total 1669 12943
Incidence Rates
Overall, the incidence rates (per million of population) of end-stage kidney disease for Indigenous patients were markedly and persistently higher than those for non-Indigenous patients.
Although rates fluctuate from year to year, in Australia the incidence rate among Indigenous people is gradually increasing (figure 10.2). The relative rate differs with age and also with gender - this is illustrated in figure 10.3.
Figure 10.2 - Unadjusted Incident RRT Rate – Australia
Indigenous Australians experience higher rates of end-stage kidney disease at all ages. This disparity is greater among Indigenous women and shows a particular pattern with age with the highest relative rates in the 35-64-year age group (figure 10.3).
0
100
200
300
400
500
Inci
denc
e pe
r mill
ion
popu
latio
n (9
5% C
I)
1999 2004 2009 2014 2019
IndigenousNon-Indigenous

ANZDATA Annual Report – Chapter 10 – End Stage Kidney Disease in Aboriginal and Torres Strait Islander Australians Page | 5
Figure 10.3 - Relative Incidence Rate of Treated ESKD for Indigenous Patients by Gender (Comparison to Non-Indigenous Australians) - 2015-2019
There is also considerable variation in the incidence of renal replacement therapy for Indigenous Australians across Australian States and Territories (figure 10.4; note that the Y axis scales vary).
While rates for the very young (<25 years) and older (>75 years) groups are similar in each State/Territory, the rates for people 25-74 years of age show a clear trend of progressively higher rates from NSW/Victoria to Queensland then South Australia, Western Australia and the Northern Territory (highest). Data are shown for a five-year period given the small numbers in some locations.
Figure 10.4 - Age-specific Incidence Rates of Treated ESKD - Among Indigenous Australians, by State and Age at RRT start 2015-2019
There are a number of factors which contribute to incident numbers of RRT (among both Indigenous and non-Indigenous people). These may include underlying rates of diabetes or other medical conditions, rates of disease progression, referral patterns, access to treatment and patient treatment decisions.
0
5
10
15
Rel
ativ
e ra
te (9
5% C
I)
0-14 15-24 25-34 35-44 45-54 55-64 65-74 75+Age (years)
Female Male
0
50
100
0
500
1000
1500
0
5000
0
2000
4000
6000
0
2000
4000
6000
0
1000
2000
3000
QLDNSW VIC SA NT
WA
QLDNSW VIC SA NT
WA
QLDNSW VIC SA NT
WA
0-24 years 25-44 years 45-54 years
55-64 years 65-74 years 75+ years
Rate 95% CI
Rat
e (p
mp)
Note the Y axis scales vary between panels

ANZDATA Annual Report – Chapter 10 – End Stage Kidney Disease in Aboriginal and Torres Strait Islander Australians Page | 6
The trends in age-specific rates for the non-Indigenous population are shown in figure 10.5.1; the increasing overall rate is driven by increases in the 25-64-year age groups in the non-Indigenous age groups but trends in the Indigenous age groups differ (figure 10.5.2).
Figure 10.5.1 - Age-specific Incidence Rates of Treated ESKD - Non-Indigenous, Australia
Figure 10.5.2 - Age-specific Incidence Rates of Treated ESKD - Indigenous, Australia
8
10
12
14
40
45
50
55
90100110120130
170
180
190
200
210
300
350
400
300
350
400
2000
-2003
2004
-2007
2008
-2011
2012
-2015
2016
-2019
2000
-2003
2004
-2007
2008
-2011
2012
-2015
2016
-2019
2000
-2003
2004
-2007
2008
-2011
2012
-2015
2016
-2019
0-24 years 25-44 years 45-54 years
55-64 years 65-74 years 75+ years
Rate 95% CI
Rat
e (p
mp)
Note the Y axis scales vary between panels
10
20
30
40
200
250
300
350
400
1000
1100
1200
1300
1400
1500
2000
2500
1000
1500
2000
2500
0
500
1000
1500
2000
-2003
2004
-2007
2008
-2011
2012
-2015
2016
-2019
2000
-2003
2004
-2007
2008
-2011
2012
-2015
2016
-2019
2000
-2003
2004
-2007
2008
-2011
2012
-2015
2016
-2019
0-24 years 25-44 years 45-54 years
55-64 years 65-74 years 75+ years
Rate 95% CI
Rat
e (p
mp)
Note the Y axis scales vary between panels

ANZDATA Annual Report – Chapter 10 – End Stage Kidney Disease in Aboriginal and Torres Strait Islander Australians Page | 7
Prevalent Patients
The number of Indigenous Australians with treated end-stage kidney disease at the end of 2019 increased from 2248 persons in 2018 to 2378 persons (table 10.3).
There were marked differences in treatment modalities for Indigenous Australians (figures 10.6 and 10.7). Most Indigenous Australians were treated with facility-based haemodialysis (75%), with very few accessing home haemodialysis (5%), long-term peritoneal dialysis (7%), or kidney transplantation (14%). The proportion of Indigenous Australians with a kidney transplant as long-term treatment for end-stage kidney disease was 14% during 2019 compared with half (50%) of non-Indigenous Australians. Only 5% of Indigenous Australians accessed home-based haemodialysis compared with 10% of non-Indigenous Australians.
Table 10.3 Prevalent Patients by Ethnicity and Treatment Modality Australia 2015-2019 Year Modality Indigenous Non-Indigenous
2015
HD 1549 (81%) 8249 (41%) % HD at home 7% 13% PD 134 (7%) 2295 (12%) Tx 237 (12%) 9392 (47%)
2016
HD 1627 (81%) 8322 (41%) % HD at home 6% 12% PD 134 (7%) 2228 (11%) Tx 260 (13%) 9861 (48%)
2017
HD 1743 (81%) 8521 (40%) % HD at home 6% 11% PD 145 (7%) 2208 (10%) Tx 272 (13%) 10363 (49%)
2018
HD 1796 (80%) 8819 (40%) % HD at home 5% 11% PD 152 (7%) 2219 (10%) Tx 300 (13%) 10876 (50%)
2019
HD 1887 (79%) 9243 (40%) % HD at home 5% 10% PD 157 (7%) 2184 (10%) Tx 334 (14%) 11407 (50%)

ANZDATA Annual Report – Chapter 10 – End Stage Kidney Disease in Aboriginal and Torres Strait Islander Australians Page | 8
Figure 10.6.1 - Prevalent Patients by Modality - Australia – Indigenous
Figure 10.6.2 - Prevalent Patients by Modality - Australia - Non-Indigenous
Figure 10.7 - Prevalent Haemodialysis at Home by Ethnicity – Australia
0
200
400
600
800
1000
1200
1400
1600
1800
2000
Pre
vale
nt p
atie
nts
2015 2016 2017 2018 2019
HDPDTransplant
0
2000
4000
6000
8000
10000
12000
Pre
vale
nt p
atie
nts
2015 2016 2017 2018 2019
HDPDTransplant
0
4
8
12
16
20
Per
cent
2015 2016 2017 2018 2019
Non-IndigenousIndigenous
ANZDATA Annual Report – Chapter 10 – End Stage Kidney Disease in Aboriginal and Torres Strait Islander Australians Page | 9
Transplantation
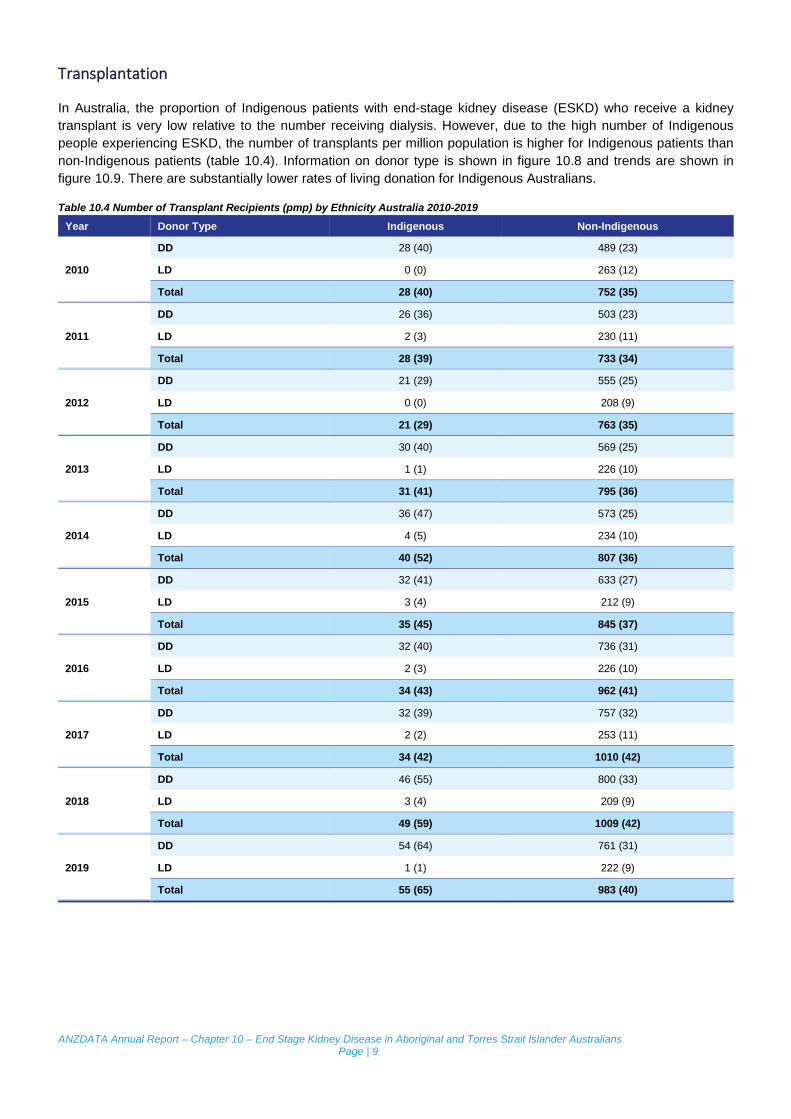
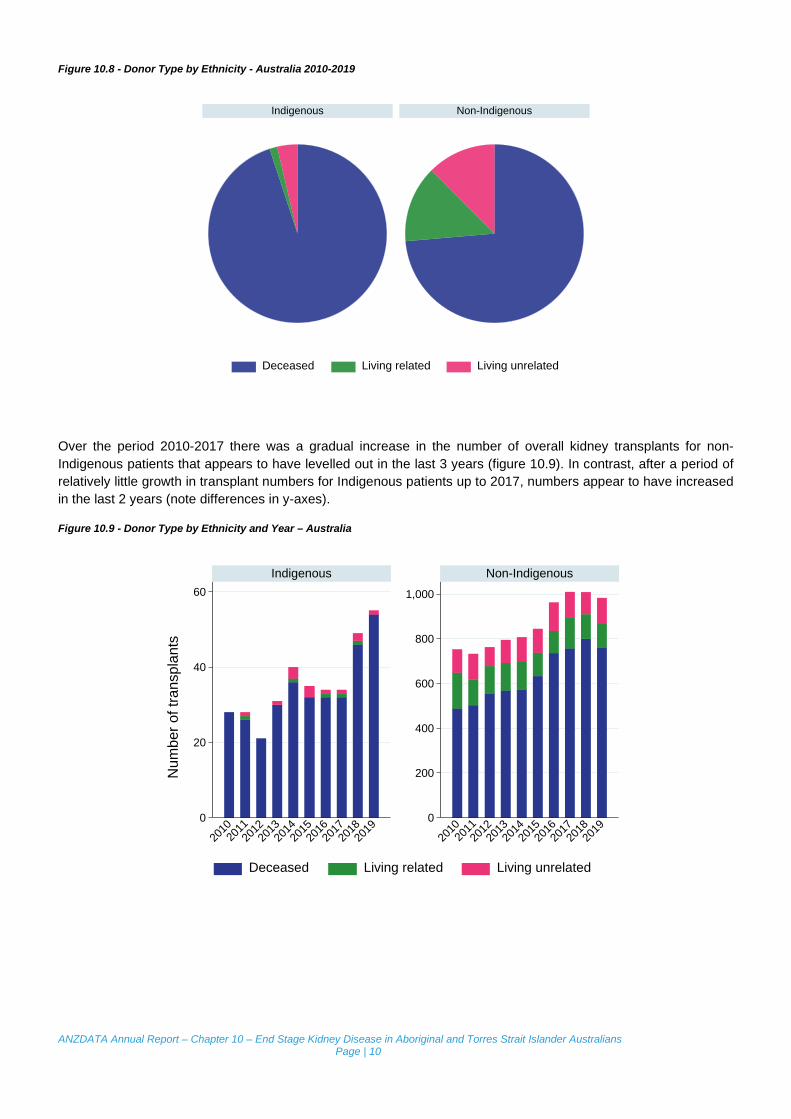
In Australia, the proportion of Indigenous patients with end-stage kidney disease (ESKD) who receive a kidney transplant is very low relative to the number receiving dialysis. However, due to the high number of Indigenous people experiencing ESKD, the number of transplants per million population is higher for Indigenous patients than non-Indigenous patients (table 10.4). Information on donor type is shown in figure 10.8 and trends are shown in figure 10.9. There are substantially lower rates of living donation for Indigenous Australians.
Table 10.4 Number of Transplant Recipients (pmp) by Ethnicity Australia 2010-2019 Year Donor Type Indigenous Non-Indigenous
2010 DD 28 (40) 489 (23) LD 0 (0) 263 (12) Total 28 (40) 752 (35)
2011 DD 26 (36) 503 (23) LD 2 (3) 230 (11) Total 28 (39) 733 (34)
2012 DD 21 (29) 555 (25) LD 0 (0) 208 (9) Total 21 (29) 763 (35)
2013 DD 30 (40) 569 (25) LD 1 (1) 226 (10) Total 31 (41) 795 (36)
2014 DD 36 (47) 573 (25) LD 4 (5) 234 (10) Total 40 (52) 807 (36)
2015 DD 32 (41) 633 (27) LD 3 (4) 212 (9) Total 35 (45) 845 (37)
2016 DD 32 (40) 736 (31) LD 2 (3) 226 (10) Total 34 (43) 962 (41)
2017 DD 32 (39) 757 (32) LD 2 (2) 253 (11) Total 34 (42) 1010 (42)
2018 DD 46 (55) 800 (33) LD 3 (4) 209 (9) Total 49 (59) 1009 (42)
2019 DD 54 (64) 761 (31) LD 1 (1) 222 (9) Total 55 (65) 983 (40)
ANZDATA Annual Report – Chapter 10 – End Stage Kidney Disease in Aboriginal and Torres Strait Islander Australians Page | 10
Figure 10.8 - Donor Type by Ethnicity - Australia 2010-2019
Over the period 2010-2017 there was a gradual increase in the number of overall kidney transplants for non-Indigenous patients that appears to have levelled out in the last 3 years (figure 10.9). In contrast, after a period of relatively little growth in transplant numbers for Indigenous patients up to 2017, numbers appear to have increased in the last 2 years (note differences in y-axes).
Figure 10.9 - Donor Type by Ethnicity and Year – Australia
Indigenous Non-Indigenous
Deceased Living related Living unrelated
0
20
40
60
0
200
400
600
800
1,000
2010
2011
2012
2013
2014
2015
2016
2017
2018
2019
2010
2011
2012
2013
2014
2015
2016
2017
2018
2019
Indigenous Non-Indigenous
Deceased Living related Living unrelated
Num
ber o
f tra
nspl
ants
ANZDATA Annual Report – Chapter 10 – End Stage Kidney Disease in Aboriginal and Torres Strait Islander Australians Page | 11
Figure 10.10 - Percentage of Patients Starting RRT with Pre-emptive Kidney Transplant – Australia
Transplant Survival
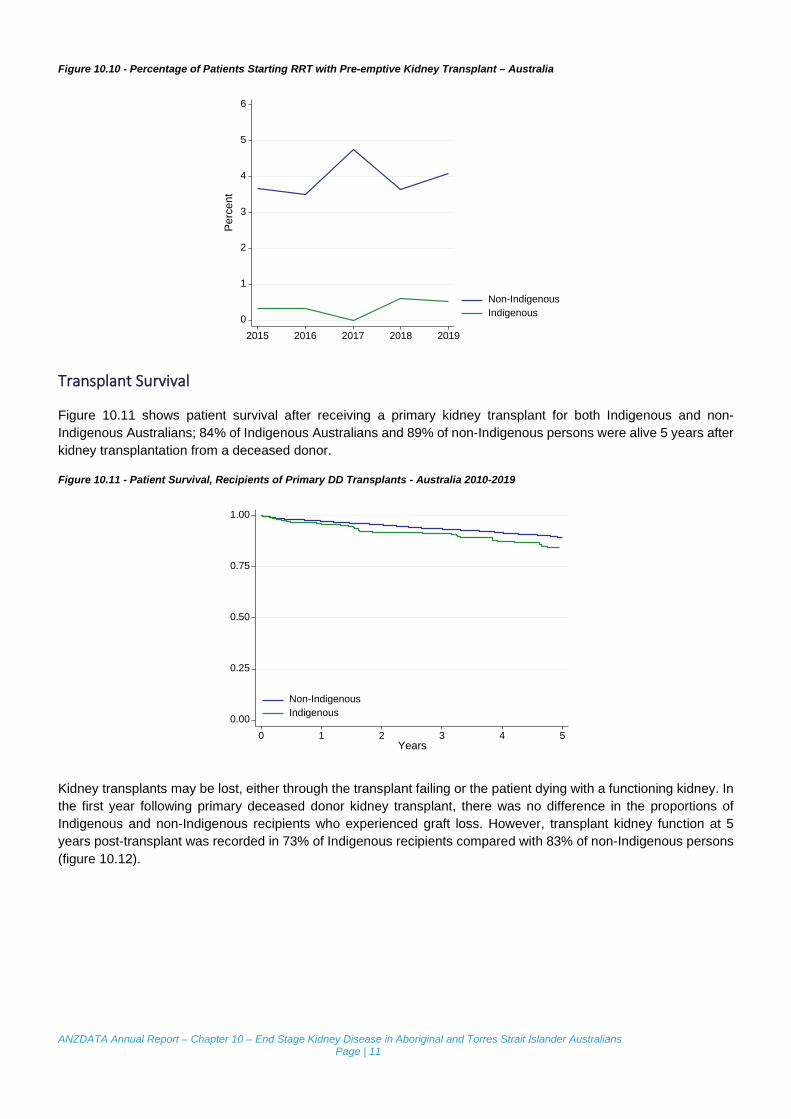
Figure 10.11 shows patient survival after receiving a primary kidney transplant for both Indigenous and non-Indigenous Australians; 84% of Indigenous Australians and 89% of non-Indigenous persons were alive 5 years after kidney transplantation from a deceased donor.
Figure 10.11 - Patient Survival, Recipients of Primary DD Transplants - Australia 2010-2019
Kidney transplants may be lost, either through the transplant failing or the patient dying with a functioning kidney. In the first year following primary deceased donor kidney transplant, there was no difference in the proportions of Indigenous and non-Indigenous recipients who experienced graft loss. However, transplant kidney function at 5 years post-transplant was recorded in 73% of Indigenous recipients compared with 83% of non-Indigenous persons (figure 10.12).
0
1
2
3
4
5
6
Per
cent
2015 2016 2017 2018 2019
Non-IndigenousIndigenous
0.00
0.25
0.50
0.75
1.00
0 1 2 3 4 5Years
Non-IndigenousIndigenous
ANZDATA Annual Report – Chapter 10 – End Stage Kidney Disease in Aboriginal and Torres Strait Islander Australians Page | 12
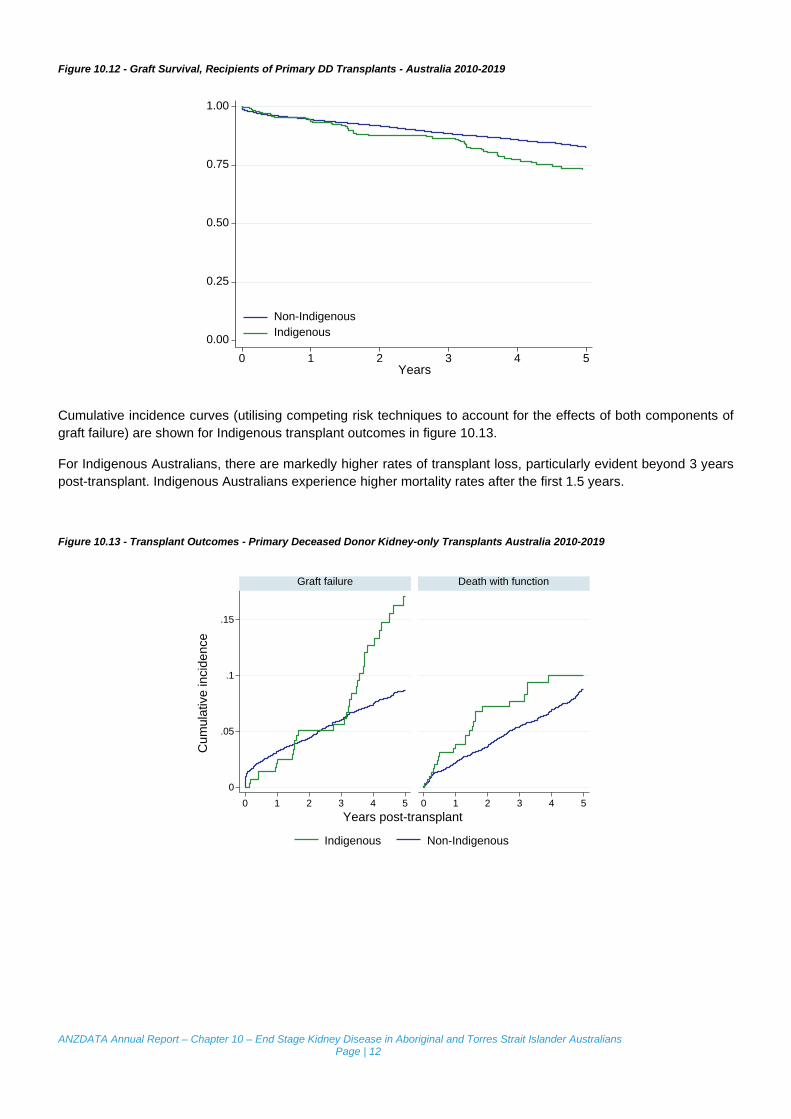
Figure 10.12 - Graft Survival, Recipients of Primary DD Transplants - Australia 2010-2019
Cumulative incidence curves (utilising competing risk techniques to account for the effects of both components of graft failure) are shown for Indigenous transplant outcomes in figure 10.13.
For Indigenous Australians, there are markedly higher rates of transplant loss, particularly evident beyond 3 years post-transplant. Indigenous Australians experience higher mortality rates after the first 1.5 years.
Figure 10.13 - Transplant Outcomes - Primary Deceased Donor Kidney-only Transplants Australia 2010-2019
0.00
0.25
0.50
0.75
1.00
0 1 2 3 4 5Years
Non-IndigenousIndigenous
0
.05
.1
.15
0 1 2 3 4 5 0 1 2 3 4 5
Graft failure Death with function
Indigenous Non-Indigenous
Cum
ulat
ive
inci
denc
e
Years post-transplant

ANZDATA Annual Report – Chapter 10 – End Stage Kidney Disease in Aboriginal and Torres Strait Islander Australians Page | 13
Dialysis
The distribution of dialysis modality is shown graphically in figure 10.14. For Indigenous Australians, the predominant modality is satellite haemodialysis. Access to home-based dialysis care including both haemodialysis and peritoneal dialysis is proportionally much lower. Indigenous Australians utilise automated peritoneal dialysis (APD) at much lower rates than non-Indigenous Australians.
Figure 10.14 - Dialysis Modality End 2019 - Australia, by Ethnicity
60% of the Indigenous Australians who started dialysis over 2010-2019 were alive 5 years later (figure 10.15). This was a slightly higher proportion in Indigenous compared with non-Indigenous patients (50%). These are unadjusted figures; differences between populations including age distribution and access to competing treatments (transplantation) will affect mortality comparisons.
Figure 10.15 - Incident Dialysis Patient Survival 2010-2019 – Australia
4%4%
19%
69%
5%13%
6%
22%
50%
8%
Indigenous Non-Indigenous
APD CAPD Hospital HDSatellite HD Home HD
0.00
0.25
0.50
0.75
1.00
0 1 2 3 4 5Years
IndigenousNon-Indigenous
Censored at transplantation

ANZDATA Annual Report – Chapter 10 – End Stage Kidney Disease in Aboriginal and Torres Strait Islander Australians Page | 14
Timing of Renal Replacement Therapy Initiation
In Australia, the level of kidney function at which dialysis is commenced ranges between eGFR 5-6 mL/min/1.73m2
for Indigenous Australians while the kidney function at dialysis commencement for non-Indigenous Australians is approximately 7 mL/min/1.73m2.
Figure 10.16 - eGFR at RRT start – Australia
0
2
4
6
8
10
2009 2011 2013 2015 2017 2019 2009 2011 2013 2015 2017 2019
Indigenous Non-Indigenous
Median Interquartile range
CK
D-E
PI e
GFR
(mL/
min
/1.7
3m2 )

ANZDATA Annual Report – Chapter 10 – End Stage Kidney Disease in Aboriginal and Torres Strait Islander Australians Page | 15
Incidence and Prevalence by State
The next few pages show a variety of figures that summarise various key rates (incidence, prevalence, transplant rates) for Indigenous Australians. In large part they show information from previous pages, in a series of differing formats.
State Incidence
There is marked variation in the incidence of renal replacement therapy between States and Territories in Australia. NT had the highest national incidence for Indigenous Australians treated for end-stage kidney disease at 1429 per million of population in 2019; the next highest was in WA (747 pmp) (figure 10.17).
Kidney transplantation is offered in major metropolitan centres in NSW, QLD, WA, VIC and SA. There is a marked State/Territory variation in the incidence of kidney transplantation in Australia and between years (figure 10.18). In 2019, Australia had its highest rate of kidney transplants per million population for Indigenous Australians in the last 5 years, driven by an increase in the rate in NT residents (who are transplanted in SA).
Figure 10.17 - Incidence of New Indigenous Australian Patients
0
200
400
600
800
1,000
1,200
1,400
New
pat
ient
s pe
r mill
ion
popu
latio
n
QLD
NSW/A
CT
VIC/TAS SA NT
WA
Austra
lia
2015 2016 2017 2018 2019

ANZDATA Annual Report – Chapter 10 – End Stage Kidney Disease in Aboriginal and Torres Strait Islander Australians Page | 16
Figure 10.18 - Incidence of New Transplants Indigenous Australian Patients - By referring state
The time from commencement of dialysis to receipt of first transplant is shown in figure 10.19, with varying patterns between different states and territories.
Figure 10.19 - Median Time to Primary Transplant Indigenous Australian Patients - By referring state, Transplants during 2012-2015 vs 2016-2019
0
30
60
90
120
150
New
tran
spla
nts
per m
illio
n po
pula
tion
QLD
NSW/A
CT
VIC/TAS SA NT
WA
Austra
lia
2015 2016 2017 2018 2019
0
1
2
3
4
5
6
Yea
rs
QLD
NSW/A
CT
VIC/TAS SA NT
WA
Austra
lia
2012-20152016-2019
ANZDATA Annual Report – Chapter 10 – End Stage Kidney Disease in Aboriginal and Torres Strait Islander Australians Page | 17
Dialysis by Resident State
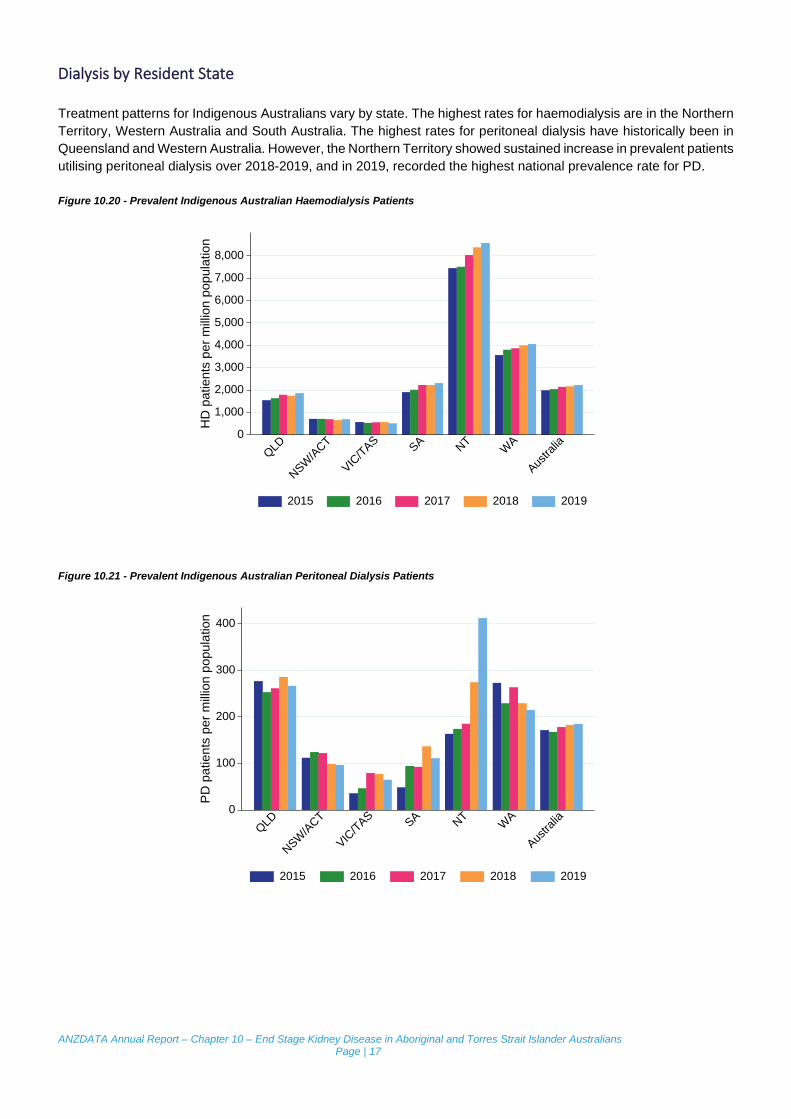
Treatment patterns for Indigenous Australians vary by state. The highest rates for haemodialysis are in the Northern Territory, Western Australia and South Australia. The highest rates for peritoneal dialysis have historically been in Queensland and Western Australia. However, the Northern Territory showed sustained increase in prevalent patients utilising peritoneal dialysis over 2018-2019, and in 2019, recorded the highest national prevalence rate for PD.
Figure 10.20 - Prevalent Indigenous Australian Haemodialysis Patients
Figure 10.21 - Prevalent Indigenous Australian Peritoneal Dialysis Patients
0
1,000
2,000
3,000
4,000
5,000
6,000
7,000
8,000
HD
pat
ient
s pe
r mill
ion
popu
latio
n
QLD
NSW/A
CT
VIC/TAS SA NT
WA
Austra
lia
2015 2016 2017 2018 2019
0
100
200
300
400
PD
pat
ient
s pe
r mill
ion
popu
latio
n
QLD
NSW/A
CT
VIC/TAS SA NT
WA
Austra
lia
2015 2016 2017 2018 2019

ANZDATA Annual Report – Chapter 10 – End Stage Kidney Disease in Aboriginal and Torres Strait Islander Australians Page | 18
Transplantation by Referring State
Rates of prevalent transplants vary substantially between states with the highest prevalence rates in South Australia, the Northern Territory and Western Australia. These rates are per population, not per dialysis patient, and they reflect both background rates of kidney disease and transplant practices. Transplant rates per dialysis patient are presented in Chapter 7 of this Report. Transplantation prevalence rates appear to be increasing overall and, in most jurisdictions, apart from SA (figure 10.22).
Figure 10.22 - Prevalent Indigenous Australian Transplant Patients
Deaths by Resident State
State based mortality rates for Indigenous Australians on renal replacement therapy are shown in figure 10.23. The differences in death rates between states are likely to reflect a combination of the differences in ESKD prevalence, practice patterns and patient factors.
Figure 10.23 - Deaths of Indigenous Australian RRT patients
0
200
400
600
800
1,000
Tran
spla
nt p
atie
nts
per m
illio
n po
pula
tion
QLD
NSW/A
CT
VIC/TAS SA NT
WA
Austra
lia
2015 2016 2017 2018 2019
0
200
400
600
800
1,000
Dea
ths
per m
illio
n po
pula
tion
QLD
NSW/A
CT
VIC/TAS SA NT
WA
Austra
lia
2015 2016 2017 2018 2019
ANZDATA Annual Report – Chapter 10 – End Stage Kidney Disease in Aboriginal and Torres Strait Islander Australians Page | 19
Geographical Distribution
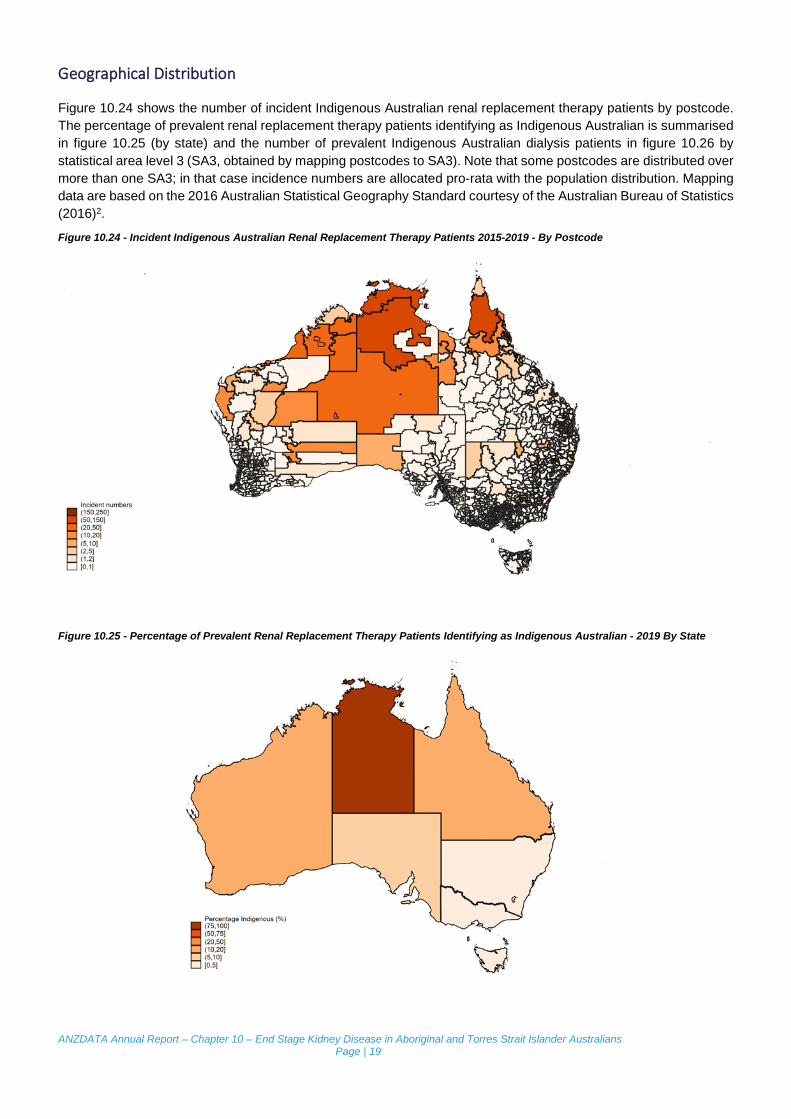
Figure 10.24 shows the number of incident Indigenous Australian renal replacement therapy patients by postcode. The percentage of prevalent renal replacement therapy patients identifying as Indigenous Australian is summarised in figure 10.25 (by state) and the number of prevalent Indigenous Australian dialysis patients in figure 10.26 by statistical area level 3 (SA3, obtained by mapping postcodes to SA3). Note that some postcodes are distributed over more than one SA3; in that case incidence numbers are allocated pro-rata with the population distribution. Mapping data are based on the 2016 Australian Statistical Geography Standard courtesy of the Australian Bureau of Statistics (2016)2.
Figure 10.24 - Incident Indigenous Australian Renal Replacement Therapy Patients 2015-2019 - By Postcode
Figure 10.25 - Percentage of Prevalent Renal Replacement Therapy Patients Identifying as Indigenous Australian - 2019 By State
ANZDATA Annual Report – Chapter 10 – End Stage Kidney Disease in Aboriginal and Torres Strait Islander Australians Page | 20
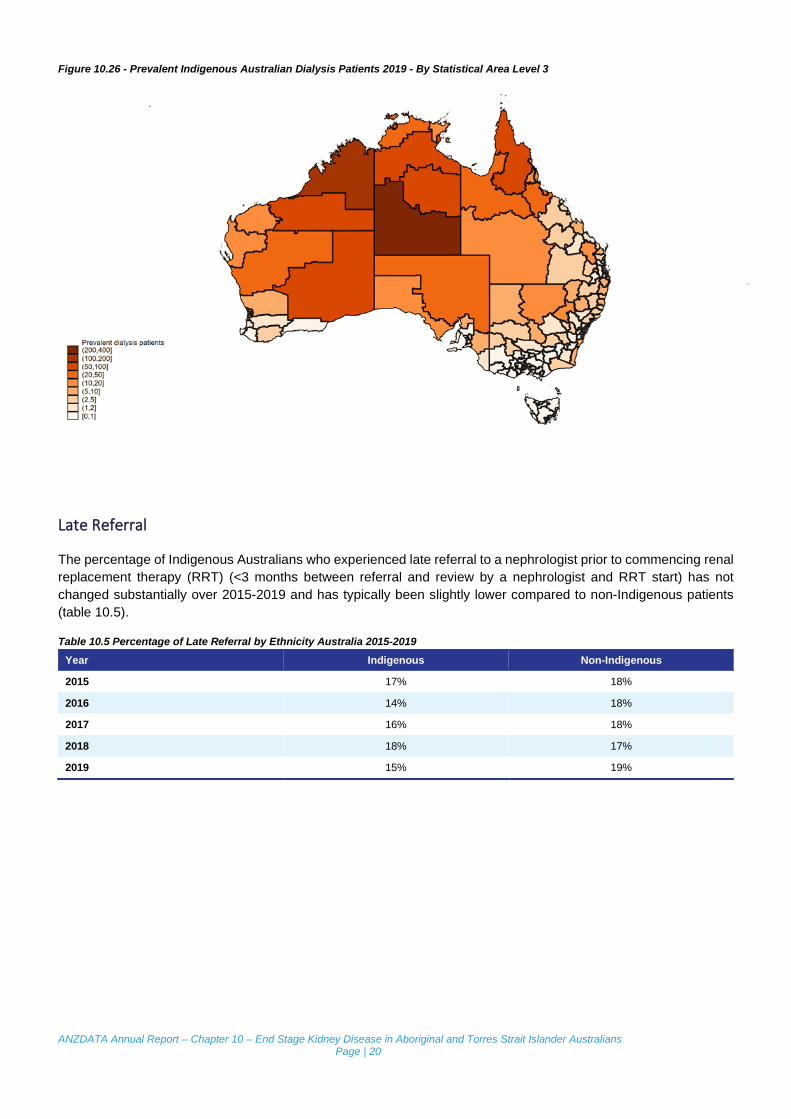
Figure 10.26 - Prevalent Indigenous Australian Dialysis Patients 2019 - By Statistical Area Level 3
Late Referral
The percentage of Indigenous Australians who experienced late referral to a nephrologist prior to commencing renal replacement therapy (RRT) (<3 months between referral and review by a nephrologist and RRT start) has not changed substantially over 2015-2019 and has typically been slightly lower compared to non-Indigenous patients (table 10.5).
Table 10.5 Percentage of Late Referral by Ethnicity Australia 2015-2019 Year Indigenous Non-Indigenous 2015 17% 18% 2016 14% 18% 2017 16% 18% 2018 18% 17% 2019 15% 19%

ANZDATA Annual Report – Chapter 10 – End Stage Kidney Disease in Aboriginal and Torres Strait Islander Australians Page | 21
Vascular Access
Incident Vascular Access
Incident vascular access data are presented in table 10.6, and prevalent data in table 10.7.
The proportion of Indigenous Australian patients commencing RRT with haemodialysis using a catheter rather than permanent access was very similar to non-Indigenous patients in 2019 (table 10.6).
Table 10.6 Incident Vascular Access Australia 2015-2019 Year Vascular access Indigenous Non-Indigenous
2015
AVF 93 (37%) 667 (43%) AVG 5 (2%) 24 (2%) CVC 150 (60%) 838 (54%) Not reported 4 (2%) 28 (2%)
2016
AVF 107 (39%) 666 (42%) AVG 1 (<1%) 20 (1%) CVC 163 (60%) 893 (56%) Not reported 1 (<1%) 23 (1%)
2017
AVF 113 (36%) 763 (42%) AVG 9 (3%) 22 (1%) CVC 188 (60%) 1015 (56%) Not reported 1 (<1%) 22 (1%)
2018
AVF 107 (38%) 765 (41%) AVG 3 (1%) 21 (1%) CVC 173 (61%) 1087 (58%) Not reported 0 (0%) 14 (1%)
2019
AVF 134 (41%) 792 (40%) AVG 2 (1%) 23 (1%) CVC 188 (58%) 1176 (59%) Not reported 1 (<1%) 5 (<1%)

ANZDATA Annual Report – Chapter 10 – End Stage Kidney Disease in Aboriginal and Torres Strait Islander Australians Page | 22
Prevalent Vascular Access
In contrast to incident vascular access, the rate of catheter usage for prevalent dialysis patients in 2019 was lower for Indigenous Australian patients than non-Indigenous patients (table 10.7).
Table 10.7 Prevalent Vascular Access Australia 2015-2019 Year Vascular access Indigenous Non-Indigenous
2015
AVF 1186 (77%) 6204 (75%) AVG 47 (3%) 531 (6%) CVC 177 (11%) 1097 (13%) Not reported 139 (9%) 417 (5%)
2016
AVF 1252 (77%) 6191 (74%) AVG 51 (3%) 436 (5%) CVC 164 (10%) 1137 (14%) Not reported 160 (10%) 558 (7%)
2017
AVF 1380 (79%) 6516 (76%) AVG 51 (3%) 404 (5%) CVC 207 (12%) 1338 (16%) Not reported 105 (6%) 263 (3%)
2018
AVF 1419 (79%) 6744 (76%) AVG 50 (3%) 394 (4%) CVC 240 (13%) 1479 (17%) Not reported 87 (5%) 202 (2%)
2019
AVF 1530 (81%) 6757 (73%) AVG 53 (3%) 394 (4%) CVC 233 (12%) 1634 (18%) Not reported 71 (4%) 458 (5%)

ANZDATA Annual Report – Chapter 10 – End Stage Kidney Disease in Aboriginal and Torres Strait Islander Australians Page | 23
Patient Flow Table 10.8 shows the overall flow of Indigenous Australian patients, by state. For new and pre-emptive transplants, numbers are shown by referring state. The differences in death rates between states are likely to reflect a combination of the differences in ESKD prevalence, practice patterns and patient factors.
Table 10.8 Patient Flow (pmp) Australian Indigenous Patients 2015-2019 Year Event QLD NSW/ACT VIC/TAS SA NT WA Australia
2015
New patients 58 (267) 36 (135) 7 (83) 10 (241) 105 (1431) 75 (759) 291 (372) New transplants 5 (23) 13 (49) 4 (47) 4 (96) 7 (95) 2 (20) 35 (45) Pre-emptive transplants 0 (0) 1 (4) 0 (0) 0 (0) 0 (0) 0 (0) 1 (1) Prevalent dialysis 394 (1816) 220 (824) 51 (602) 81 (1949) 558 (7606) 379 (3835) 1683 (2150) Prevalent transplants 51 (235) 46 (172) 21 (248) 34 (818) 42 (572) 43 (435) 237 (303) Total prevalence 445 (2051) 266 (996) 72 (850) 115 (2767) 600 (8178) 422 (4270) 1920 (2453) Deaths 50 (230) 26 (97) 11 (130) 13 (313) 52 (709) 40 (405) 192 (245)
2016
New patients 88 (398) 51 (187) 10 (116) 22 (521) 68 (912) 75 (746) 314 (393) New transplants 5 (23) 6 (22) 3 (35) 5 (118) 5 (67) 10 (99) 34 (43) Pre-emptive transplants 0 (0) 0 (0) 0 (0) 0 (0) 0 (0) 1 (10) 1 (1) Prevalent dialysis 416 (1880) 228 (835) 50 (579) 89 (2106) 573 (7687) 405 (4029) 1761 (2206) Prevalent transplants 55 (249) 50 (183) 22 (255) 34 (804) 47 (630) 52 (517) 260 (326) Total prevalence 471 (2129) 278 (1018) 72 (834) 123 (2910) 620 (8317) 457 (4547) 2021 (2531) Deaths 61 (276) 36 (132) 10 (116) 12 (284) 47 (630) 43 (428) 209 (262)
2017
New patients 95 (420) 47 (169) 13 (147) 18 (417) 104 (1376) 83 (809) 360 (442) New transplants 9 (40) 10 (36) 2 (23) 2 (46) 8 (106) 3 (29) 34 (42) Pre-emptive transplants 0 (0) 0 (0) 0 (0) 0 (0) 0 (0) 0 (0) 0 (0) Prevalent dialysis 464 (2052) 225 (808) 55 (624) 100 (2317) 621 (8216) 423 (4121) 1888 (2318) Prevalent transplants 60 (265) 57 (205) 24 (272) 32 (742) 51 (675) 48 (468) 272 (334) Total prevalence 524 (2318) 282 (1013) 79 (896) 132 (3059) 672 (8891) 471 (4589) 2160 (2652) Deaths 45 (199) 43 (154) 6 (68) 10 (232) 53 (701) 65 (633) 222 (273)
2018
New patients 92 (398) 27 (95) 11 (122) 15 (340) 109 (1422) 70 (668) 324 (390) New transplants 18 (78) 9 (32) 6 (67) 1 (23) 8 (104) 7 (67) 49 (59) Pre-emptive transplants 1 (4) 0 (0) 1 (11) 0 (0) 0 (0) 0 (0) 2 (2) Prevalent dialysis 469 (2030) 213 (750) 58 (643) 104 (2360) 662 (8639) 442 (4217) 1948 (2345) Prevalent transplants 75 (325) 65 (229) 27 (299) 33 (749) 52 (679) 48 (458) 300 (361) Total prevalence 544 (2355) 278 (979) 85 (943) 137 (3108) 714 (9318) 490 (4675) 2248 (2706) Deaths 69 (299) 30 (106) 7 (78) 7 (159) 67 (874) 52 (496) 232 (279)
2019
New patients 116 (491) 46 (159) 8 (87) 19 (422) 111 (1429) 80 (747) 380 (448) New transplants 15 (64) 14 (48) 6 (65) 2 (44) 11 (142) 7 (65) 55 (65) Pre-emptive transplants 0 (0) 2 (7) 0 (0) 0 (0) 0 (0) 0 (0) 2 (2) Prevalent dialysis 501 (2121) 227 (784) 52 (564) 109 (2421) 698 (8987) 457 (4270) 2044 (2410) Prevalent transplants 87 (368) 74 (256) 28 (304) 33 (733) 60 (772) 52 (486) 334 (394) Total prevalence 588 (2490) 301 (1039) 80 (867) 142 (3154) 758 (9759) 509 (4756) 2378 (2804) Deaths 73 (309) 27 (93) 10 (108) 19 (422) 66 (850) 57 (533) 252 (297)

ANZDATA Annual Report – Chapter 10 – End Stage Kidney Disease in Aboriginal and Torres Strait Islander Australians Page | 24
Cause of Death
The causes of death in 2019 are shown in figure 10.27 and table 10.9, categorised by ethnicity and modality at time of death.
238 Indigenous Australian patients who were receiving dialysis died in 2019, with cardiovascular disease followed by withdrawal from treatment and 'other causes' as the most common causes of death.
Among non-Indigenous Australian dialysis patients, withdrawal from dialysis was the most common cause of death.
Figure 10.27 - Cause of Death by Modality and Ethnicity, Australia - Deaths Occurring During 2019
Table 10.9 Cause of Death by Modality and Ethnicity, Australia 2019 Modality Cause of death Indigenous Non-Indigenous
Dialysis
Cardiovascular 77 (32%) 442 (28%) Withdrawal 55 (23%) 534 (34%) Cancer 5 (2%) 34 (2%) Infection 37 (16%) 130 (8%) Other 51 (21%) 385 (25%) Not reported 13 (5%) 30 (2%) Total 238 1555
Transplant
Cardiovascular 2 (22%) 54 (24%) Withdrawal 2 (22%) 9 (4%) Cancer 1 (11%) 60 (27%) Infection 3 (33%) 36 (16%) Other 0 (0%) 62 (28%) Not reported 1 (11%) 1 (0%) Total 9 222
0
20
40
60
80
100
Indigenous Non-Indigenous Indigenous Non-Indigenous
Dialysis Transplant
Cardiovascular Withdrawal CancerInfection Other Not reported
Per
cent

ANZDATA Annual Report – Chapter 10 – End Stage Kidney Disease in Aboriginal and Torres Strait Islander Australians Page | 25
References
1 Australian Bureau of Statistics, 2019, Australian Demographic Statistics, Jun 2019, time series spreadsheets, cat. no. 3101.0, viewed 19 Dec 2019, http://www.abs.gov.au/AUSSTATS/[email protected]/DetailsPage/3101.0Jun%202019?OpenDocument
2 Australian Bureau of Statistics, 2016, Australian Statistical Geography Standard (ASGS): Volume 1 - Main Structure and Greater Capital City Statistical Areas, July 2016, cat. no. 1270.0.55.001, viewed 22 May 2018, http://www.abs.gov.au/AUSSTATS/[email protected]/DetailsPage/1270.0.55.001July%202016?OpenDocument


