26
CHAPTER 15 Evaluating Sales force Performance
| Date post: | 18-Dec-2015 |
| Category: |
Documents |
| Upload: | jordan-cannon |
| View: | 224 times |
| Download: | 1 times |
CHAPTER 15
Evaluating Sales force Performance
THE SALES AUDIT
• ...a comprehensive, periodic review and evaluation of the sales function
THE SALES AUDIT
• The audit includes an appraisal of– objectives– personnel– tactics
STEPS IN THE SALES AUDIT
• Find out what happened
• Find out why it happened
• Decide what to do about it
EVALUATING EFFECTIVENESS
• Sales Volume Analysis
• Cost Analysis
• Profitability Analysis
• Productivity Analysis
SALES VOLUME ANALYSIS
• A study of the net sales section of the profit and loss statement.
• Examine sales by product lines, territories, key accounts, and general classes of customers.
SALES VOLUME ANALYSIS
• Two approaches:– Hierarchical Sales Analysis– Effectiveness Analysis

HIERARCHICAL SALES ANALYSIS
• A multistage analysis which proceeds from one sales organization level to the next by – identifying major deviations – investigating these in more detail at the
next lower level.
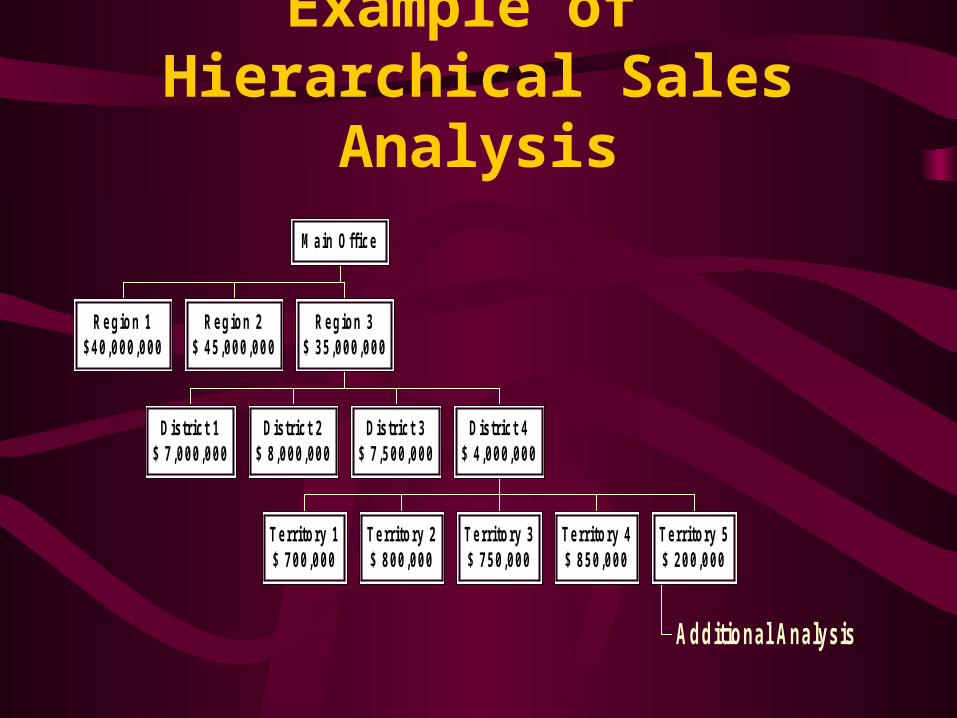
Example of Hierarchical Sales Analysis
Region 1$40,000,000
Region 2$ 45,000,000
District 1$ 7,000,000
District 2$ 8,000,000
District 3$ 7,500,000
T erritory 1$ 700,000
T erritory 2$ 800,000
T erritory 3$ 750,000
T erritory 4$ 850,000
Additional Analysis
T erritory 5$ 200,000
District 4$ 4,000,000
Region 3$ 35,000,000
M ain Office

EFFECTIVENESS INDEX
• Examine territory performance relative to potential
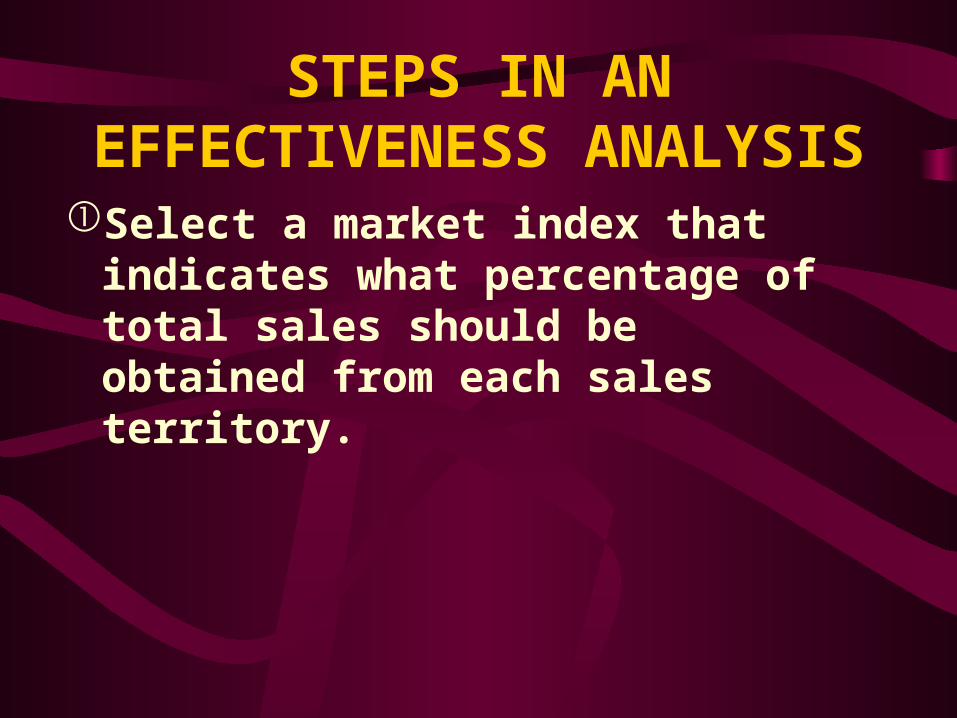
STEPS IN AN EFFECTIVENESS ANALYSIS
Select a market index that indicates what percentage of total sales should be obtained from each sales territory.
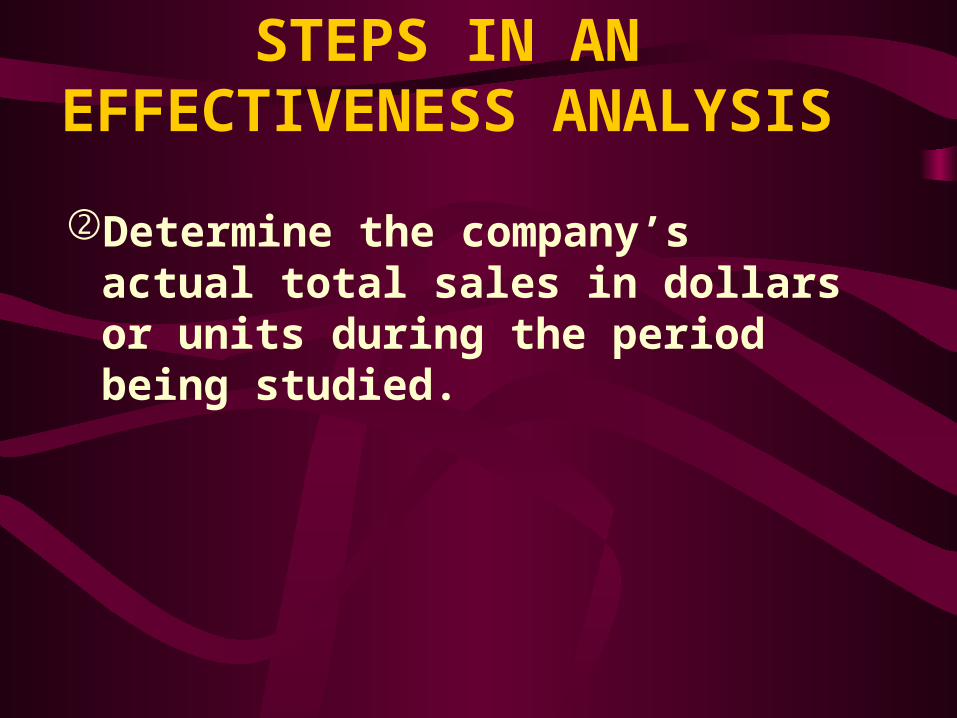
STEPS IN AN EFFECTIVENESS ANALYSIS
Determine the company’s actual total sales in dollars or units during the period being studied.

STEPS IN AN EFFECTIVENESS ANALYSIS
Multiply the territorial index by the total sales figure to determine the goal in each district.

STEPS IN AN EFFECTIVENESS ANALYSIS
Compare actual regional sales with the regional goals to see how much variation has occurred.
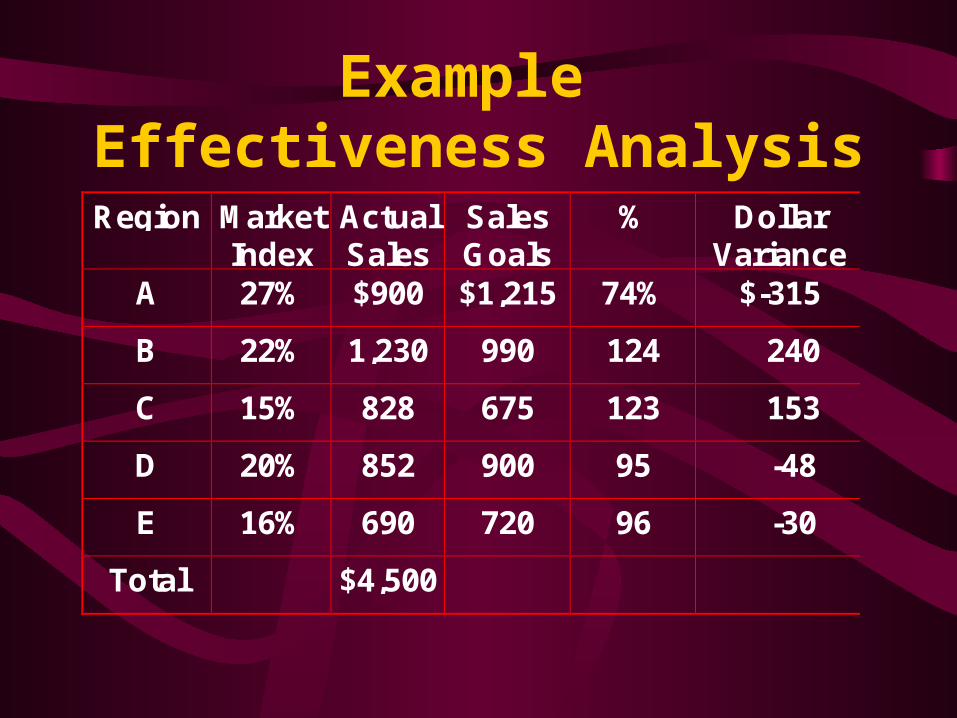
Example Effectiveness Analysis
Region MarketIndex
ActualSales
SalesGoals
% DollarVariance
A 27% $900 $1,215 74% $-315
B 22% 1,230 990 124 240
C 15% 828 675 123 153
D 20% 852 900 95 -48
E 16% 690 720 96 -30
Total $4,500
HIERARCHICAL AND EFFECTIVENESS ANALYSIS
• Territories
• Different products
• Sales by accounts
• Channels of distribution
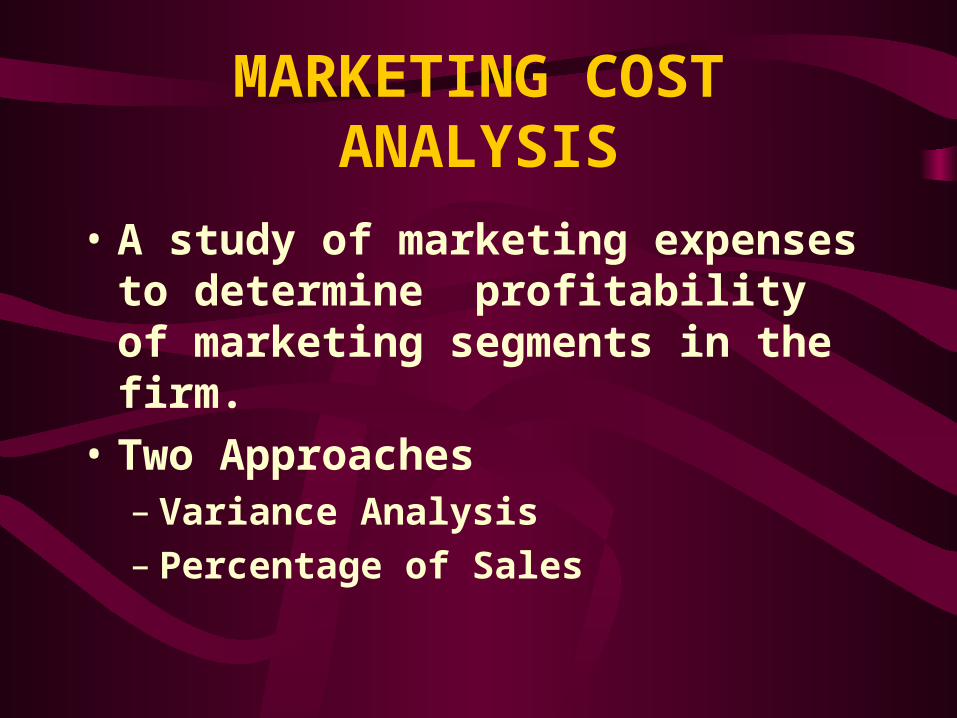
MARKETING COST ANALYSIS
• A study of marketing expenses to determine profitability of marketing segments in the firm.
• Two Approaches– Variance Analysis– Percentage of Sales
VARIANCE ANALYSIS• Variance represents the difference
between actual costs and budgeted costs.
• High variances should be examined further.

PERCENTAGE OF SALES• Examines costs as a percentage of
sales.
PROFITABILITY ANALYSIS
• Return on Assets Managed (ROAM)
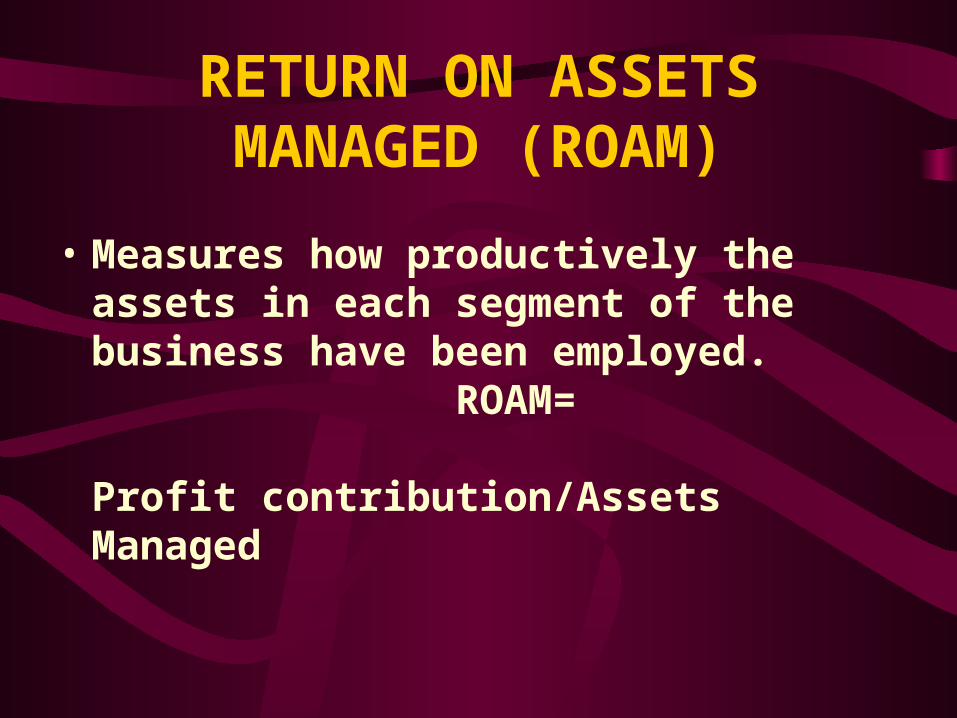
RETURN ON ASSETS MANAGED (ROAM)
• Measures how productively the assets in each segment of the business have been employed.
ROAM= Profit contribution/Assets Managed
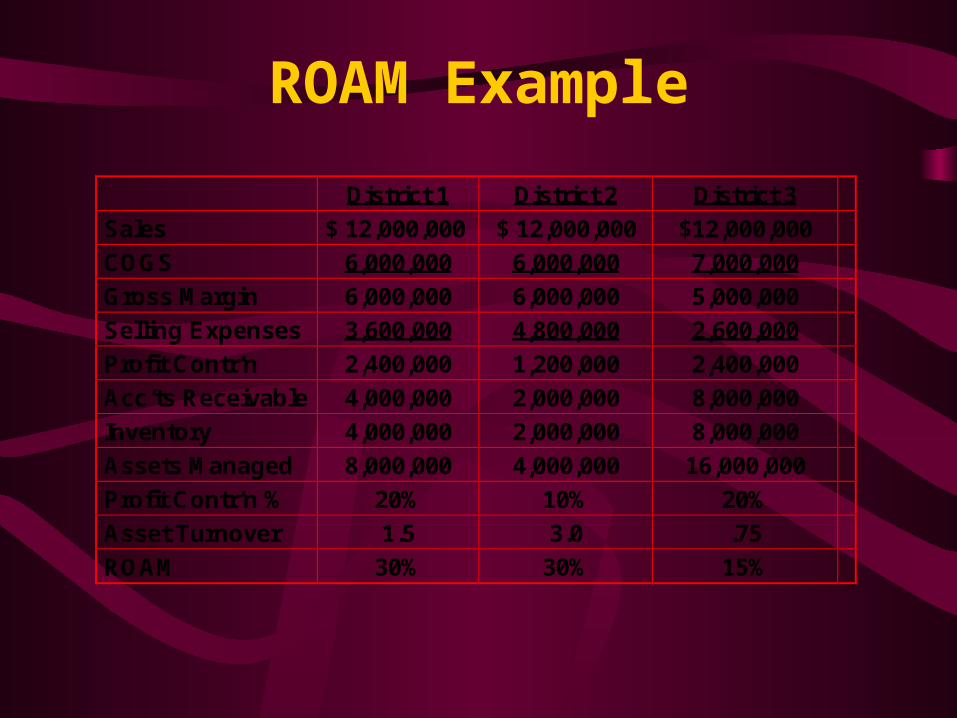
ROAM Example
District 1 District 2 District 3
Sales $ 12,000,000 $ 12,000,000 $12,000,000
COGS 6,000,000 6,000,000 7,000,000
Gross Margin 6,000,000 6,000,000 5,000,000
Selling Expenses 3,600,000 4,800,000 2,600,000
Profit Contr’n 2,400,000 1,200,000 2,400,000
Acc’ts Receivable 4,000,000 2,000,000 8,000,000
Inventory 4,000,000 2,000,000 8,000,000
Assets Managed 8,000,000 4,000,000 16,000,000
Profit Contr’n % 20% 10% 20%
Asset Turnover 1.5 3.0 .75
ROAM 30% 30% 15%
PRODUCTIVITY ANALYSIS
• Additional productivity analysis may be required to get a fuller picture of organizational effectiveness.
• Measured in terms of inputs and outputs.
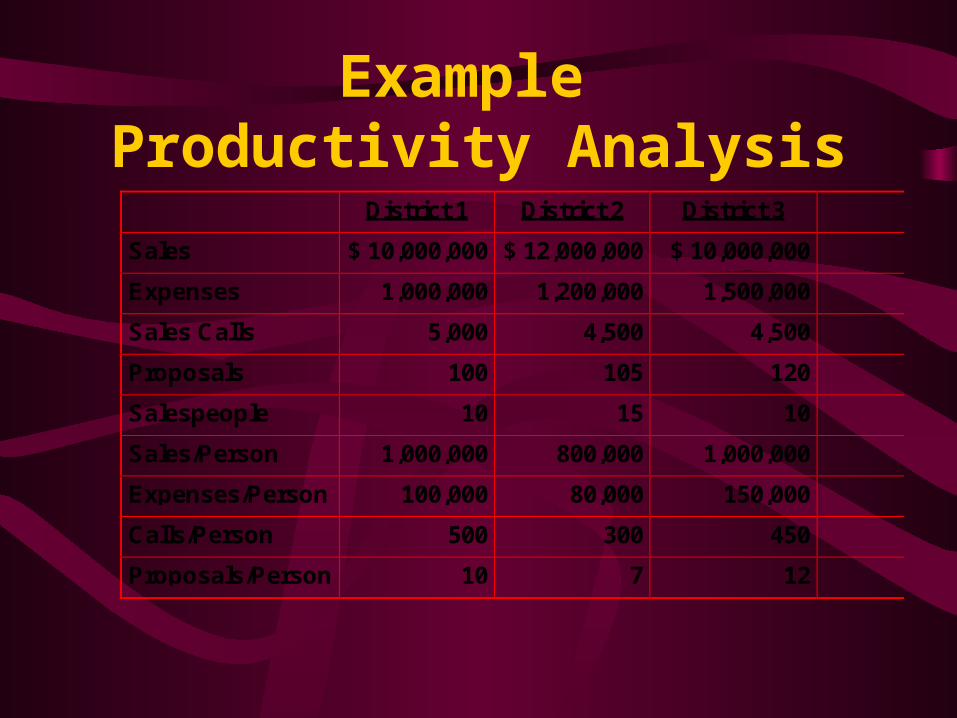
Example Productivity Analysis
District 1 District 2 District 3
Sales $ 10,000,000 $ 12,000,000 $ 10,000,000
Expenses 1,000,000 1,200,000 1,500,000
Sales Calls 5,000 4,500 4,500
Proposals 100 105 120
Salespeople 10 15 10
Sales/Person 1,000,000 800,000 1,000,000
Expenses/Person 100,000 80,000 150,000
Calls/Person 500 300 450
Proposals/Person 10 7 12
WHAT IS DONE WITH THIS INFORMATION?
• Adjust territorial boundaries
• Adjust product line
• Change classes of customers

FROM THE TEXT
• Read everything except Residual Income Analysis on pages 724 to 726.


![Evaluating Sales Performance [Compatibility Mode]](https://static.documents.pub/doc/80x56/577cd72b1a28ab9e789e3d45/evaluating-sales-performance-compatibility-mode.jpg)


