48 Chapter 2 Planning Project Evaluation This chapter explains key issues to consider for evaluation planning. “Evaluation questions” will be explained as the first step in making a work plan, and then, “basis for judgment,” “necessary data and data sources,” and “data collection methods” will follow. Tips! - First, determine what we need to learn in the evaluation (evaluation questions). The Five Evaluation Criteria will help us formulate evaluation questions as specifically as possible. - Next, consider with what we ought to compare the project or program in order to make value judgment (basis for judgment). - Then, consider whom to contact, what data to collect, and how to do it in order to answer evaluation questions (data source, necessary data, and data collection methods). - There are various data collection and analysis methods. It is more effective to use several different approaches in order to offset the weakness of one approach by the strength of another. - Finally, bring all planning elements together in an Evaluation Grid, a tool to develop evaluation work plans. The Evaluation Grid should be flexibly applied to meet the different purposes of each evaluation study.
Transcript
48
Chapter 2 Planning Project Evaluation
This chapter explains key issues to consider for evaluation planning. “Evaluation
questions” will be explained as the first step in making a work plan, and then, “basis for
judgment,” “necessary data and data sources,” and “data collection methods” will follow.
Tips!
- First, determine what we need to learn in the evaluation (evaluation questions). The
Five Evaluation Criteria will help us formulate evaluation questions as specifically as
possible.
- Next, consider with what we ought to compare the project or program in order to
make value judgment (basis for judgment).
- Then, consider whom to contact, what data to collect, and how to do it in order to
answer evaluation questions (data source, necessary data, and data collection
methods).
- There are various data collection and analysis methods. It is more effective to use
several different approaches in order to offset the weakness of one approach by the
strength of another.
- Finally, bring all planning elements together in an Evaluation Grid, a tool to develop
evaluation work plans. The Evaluation Grid should be flexibly applied to meet the
different purposes of each evaluation study.
49
Steps of Evaluation Study
Making an evaluation plan is a process for determining what and how to implement
the evaluation in line with its purpose. An evaluation study is usually limited in its
budget and time, and therefore an effective and efficient way to conduct the study should
be well developed. The major steps of evaluation planning are described below. These
steps are interrelated with each other, and thus are in many cases developed at the
same time.
(3) Formulate evaluation work plan
(6) Report evaluation results
Feedback
(4) Collect data
(5) Analyze and interpret data
(1) Confirm the purpose of evaluation
(2) Organize information of
the target project
Evaluation
planning
Imple-
mentation
Reporting
the results
-What is the evaluation methodology?
- Consider evaluation questions, basis for judgment,
data needed, and data collection methods
50
On what basis the value judgment to be made
“Steps of making an evaluation plan”
Evaluation Questions Evaluation
CriteriaMain
questions
Sub-
questions
Basis for
judgement
Data
Needed
Data
Sources
Data
Collection
Methods
Relevance
Effectiveness
Efficiency
Impact
Sustainability
Others
Evaluation Grid
1. Develop evaluation questions
2. Identify basis for judgment
What to know throughevaluation
3. Identify necessary data and
select data source
4. Select data collection methods
What data to be collected from
where
How to collect data
51
1. Developing Evaluation Questions
(1) Levels of Evaluation Questions and Five Evaluation Criteria
i) What is an ‘Evaluation Question’?
Evaluation questions represent “what one wants to know through evaluation.” For
instance, the question of “whether a project was (or will be) meaningful” is an example of
an evaluation question and a common question for project evaluation. More focused
questions to verify the value of a project will be: “Were effects produced by the project?”
or “Were resources efficiently used?” It is possible to formulate more specific questions
focusing on the effectiveness of a project. In an irrigation project, for instance, evaluators
can ask such questions as: “Was the production volume of crops increased?” or “Were
farmers’ incomes increased?” Starting from a general question, more specific
questions should be developed to make evaluation study operational. By doing so,
more concrete survey methods as well as the necessary data are easily identified.
Project operation departments within JICA develop evaluation questions that
consider the actual situation of a project and what should be focused upon in the
evaluation’s limited timeframe in order to obtain useful findings. JICA staff is responsible
for setting appropriate evaluation questions because they are in the position to
understand the main issues of the target project as well as the related sector issues.
They should keep in mind those issues when developing the evaluation questions so
that the evaluation results will be fully utilized for future project improvement.
ii) Connection between Evaluation Questions and Five Evaluation Criteria
As explained in the previous section, JICA adopts the DAC’s Five Evaluation Criteria
(namely relevance, effectiveness, efficiency, impact, and sustainability) to make a value
judgment about the project results. Evaluation questions can be developed according to
the five criteria. For example, in the case of a terminal evaluation of the “Mathematics
and Science Teachers Training Project,” evaluation questions for determining the
effectiveness of the project could be: “Was there any improvement in teachers’ teaching
methods as a result of the project?” or “Is there any change in teachers’ attitudes?” More
specific questions could be: “How do students evaluate the changes in teachers’
attitudes?” and “Has the level of achievement of teachers met with target values (only if
the rating system for evaluating teaching methods has been introduced in the project as
a monitoring system)?” The more specific the questions, the easier it is to develop an
evaluation work plan afterwards. By doing so, the quality of evaluation itself may be
improved.
We do not have to cover all the criteria with a full set of evaluation questions. We
52
need to be careful not to automatically set evaluation questions based on the five criteria,
but to develop the main questions that would give useful answers for improving the
project. Accordingly, emphasis among criteria may be different. For an internal
evaluation with the purpose of improving projects, the results will be irrelevant unless the
major concerns of JICA staff and other stakeholders are reflected in the evaluation
questions. Their concerns and interests are the starting point of the evaluation. In that
process, we can prioritize which critical questions to address. The budget and time for
an evaluation is usually limited, and it is often difficult to answer all questions. JICA staff
should fully discuss with other stakeholders what to intensively investigate and then
select important evaluation questions.
Explained below are the relationships between the Five Evaluation Criteria and
evaluation questions. Good evaluation questions will make it easy to identify the
necessary data and indicators in an evaluation study.
53
Figure 2-2-1 Conceptual Model of How to Break Down a Main Question
(A Case of Terminal Evaluation of
“Math and Science Teachers Training Project”)
(Main Question)
(Broken Down to More Specific Questions)
Was the project implementation valid?
i
Relevance
Efficiency
Sustainability
They still can be broken down further into more specific questions.
ii iii iv v
i) Is there a need for improving math and science education?
ii) Have teachers’ teaching methods improved?
iii) Was the cost of developing a curriculum acceptable?
iv) Have students attained a certain academic achievement?
v) Has the teacher training system been sustained?
Five Evaluation Criteria
Effectiveness
Impact
54
Figure 2-2-2 An Example of Evaluation Questions: main questions and
sub-questions
The Case: Irrigation Management Training Course
Was the project effective? (effectiveness)
Did trainees acquire enough knowledge through training?
Did trainees acquire knowledge on the maintenance system of irrigation facilities and the establishment and management of a water management cooperative? (test scores and report grades)
Are trainees satisfied with the training program? (questionnaire survey)
Do trainees receive good assessment about their work from their supervisors after returning home? (questionnaire survey)
The first question of the example above is too general. For instance, it is not
clear what “trainees’ knowledge” means and how to judge “the increase in their
knowledge.” Breaking down the first general question into the three specific
questions makes it easier to consider a “basis for judgment,” the “necessary data”
and the “data collection methods.” Some questions may be further broken down
until one can imagine exactly what data should be collected.
The Case: Polio Eradication Project
Will the project be sustainable? (sustainability)
Is the polio vaccine supply plan workable?
Is funding assured for maintaining and managing the vaccine storage system?
Will the health education for the local people be continuously provided? ( it is also necessary to further break this down into specific questions focusing on such issues as training of health volunteers and development and delivery of textbooks, etc.)
(2) Perspectives of Five Evaluation Criteria
As explained in previous section, the Five Evaluation Criteria are used to evaluate a
55
target project from various issues of view and, in the process, to identify the hindering
and contributing factors. Based on those factors, good lessons learned and
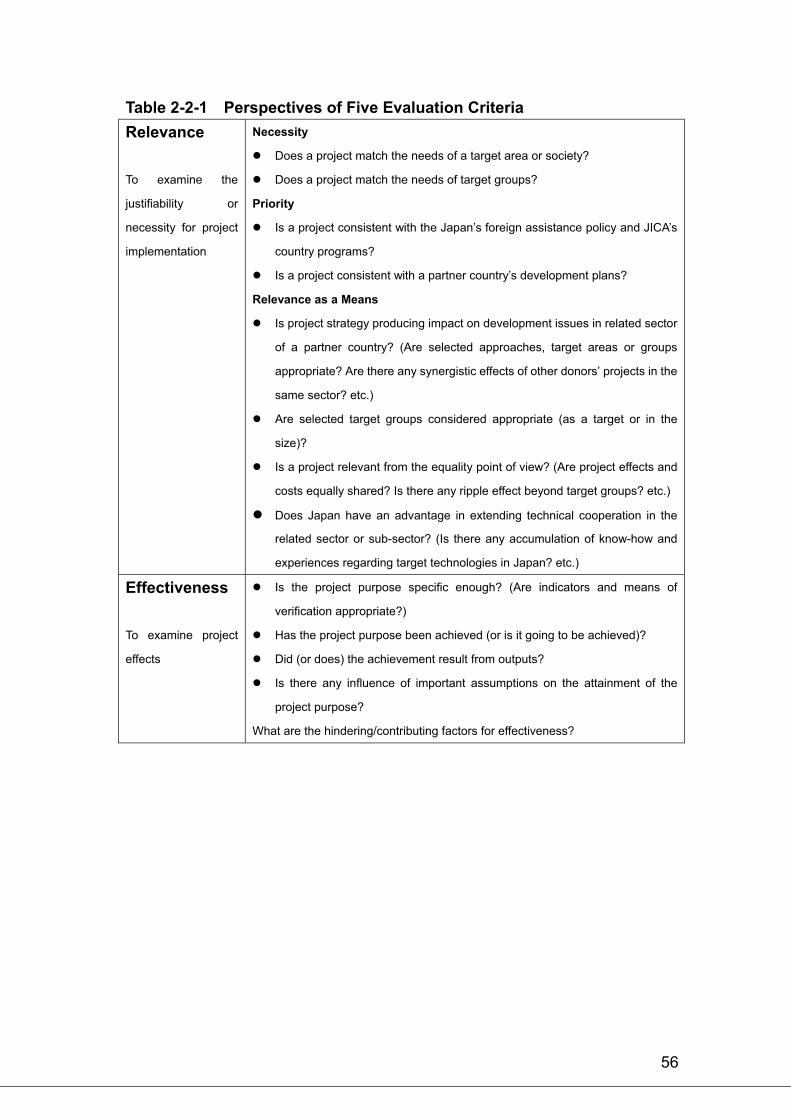
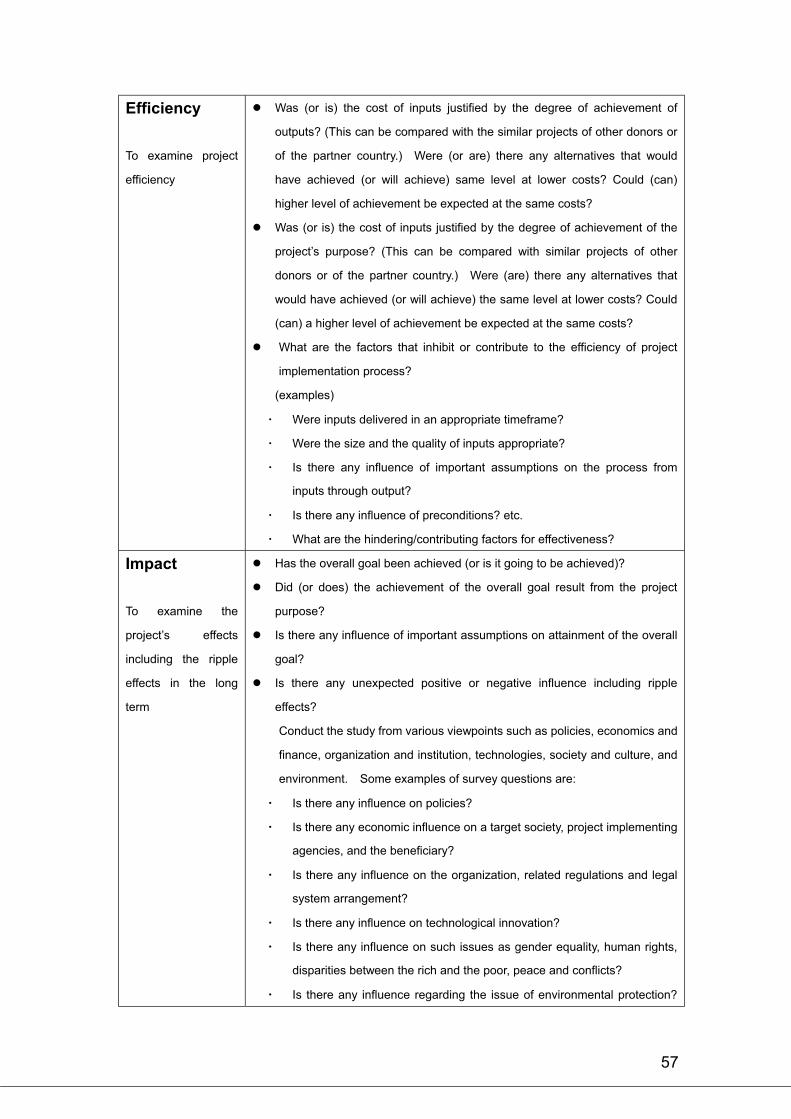
recommendations can be formulated. Table 2-2-1 shows main perspectives of each
criterion. They can be referred to when developing evaluation questions. Figure 2-2-3
shows the conceptual relationships between the Five Evaluation Criteria and the
logframe. As is explained, the information of a logframe may not be enough to conduct a
comprehensive evaluation according to the five criteria.
The appropriate evaluation questions for each criterion should be developed,
referring to project documents and the logframe. The logframe provides information for
narrowing and prioritizing the evaluation questions in a systematic way by highlighting
the causal connections between project components (including outputs, activities and
inputs) and outcomes (including overall goals and project purpose), as well as the
assumptions underlying the project. If the logic in the logframe is correct, the evaluator
may directly use the logframe’s description of the project to formulate questions
regarding its achievement level. On the other hand, if the logframe is not logically
structured, the evaluator may have to create relevant evaluation questions together with
the stakeholders.
56
Table 2-2-1 Perspectives of Five Evaluation Criteria
Relevance
To examine the
justifiability or
necessity for project
implementation
Necessity
Does a project match the needs of a target area or society?
Does a project match the needs of target groups?
Priority
Is a project consistent with the Japan’s foreign assistance policy and JICA’s
country programs?
Is a project consistent with a partner country’s development plans?
Relevance as a Means
Is project strategy producing impact on development issues in related sector
of a partner country? (Are selected approaches, target areas or groups
appropriate? Are there any synergistic effects of other donors’ projects in the
same sector? etc.)
Are selected target groups considered appropriate (as a target or in the
size)?
Is a project relevant from the equality point of view? (Are project effects and
costs equally shared? Is there any ripple effect beyond target groups? etc.)
Does Japan have an advantage in extending technical cooperation in the
related sector or sub-sector? (Is there any accumulation of know-how and
experiences regarding target technologies in Japan? etc.)
Effectiveness
To examine project
effects
Is the project purpose specific enough? (Are indicators and means of
verification appropriate?)
Has the project purpose been achieved (or is it going to be achieved)?
Did (or does) the achievement result from outputs?
Is there any influence of important assumptions on the attainment of the
project purpose?
What are the hindering/contributing factors for effectiveness?
57
Efficiency
To examine project
efficiency
Was (or is) the cost of inputs justified by the degree of achievement of
outputs? (This can be compared with the similar projects of other donors or
of the partner country.) Were (or are) there any alternatives that would
have achieved (or will achieve) same level at lower costs? Could (can)
higher level of achievement be expected at the same costs?
Was (or is) the cost of inputs justified by the degree of achievement of the
project’s purpose? (This can be compared with similar projects of other
donors or of the partner country.) Were (are) there any alternatives that
would have achieved (or will achieve) the same level at lower costs? Could
(can) a higher level of achievement be expected at the same costs?
What are the factors that inhibit or contribute to the efficiency of project
implementation process?
(examples)
Were inputs delivered in an appropriate timeframe?
Were the size and the quality of inputs appropriate?
Is there any influence of important assumptions on the process from
inputs through output?
Is there any influence of preconditions? etc.
What are the hindering/contributing factors for effectiveness?
Impact
To examine the
project’s effects
including the ripple
effects in the long
term
Has the overall goal been achieved (or is it going to be achieved)?
Did (or does) the achievement of the overall goal result from the project
purpose?
Is there any influence of important assumptions on attainment of the overall
goal?
Is there any unexpected positive or negative influence including ripple
effects?
Conduct the study from various viewpoints such as policies, economics and
finance, organization and institution, technologies, society and culture, and
environment. Some examples of survey questions are:
Is there any influence on policies?
Is there any economic influence on a target society, project implementing
agencies, and the beneficiary?
Is there any influence on the organization, related regulations and legal
system arrangement?
Is there any influence on technological innovation?
Is there any influence on such issues as gender equality, human rights,
disparities between the rich and the poor, peace and conflicts?
Is there any influence regarding the issue of environmental protection?
58
etc.
Is there any specific impact observed, either positive or negative, due to the
differences of gender, race, and social class?
What are the hindering and contributing factors for impact?
What are unexpected factors that produced positive and negative influence?
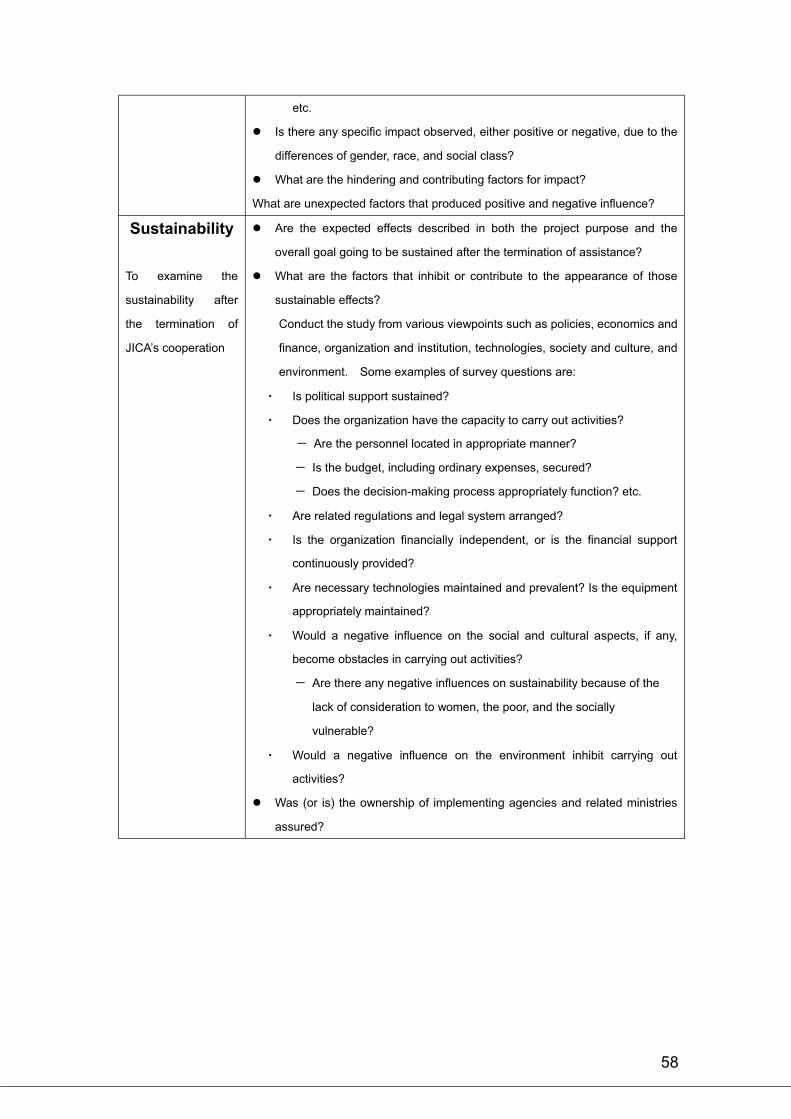
Sustainability
To examine the
sustainability after
the termination of
JICA’s cooperation
Are the expected effects described in both the project purpose and the
overall goal going to be sustained after the termination of assistance?
What are the factors that inhibit or contribute to the appearance of those
sustainable effects?
Conduct the study from various viewpoints such as policies, economics and
finance, organization and institution, technologies, society and culture, and
environment. Some examples of survey questions are:
Is political support sustained?
Does the organization have the capacity to carry out activities?
Are the personnel located in appropriate manner?
Is the budget, including ordinary expenses, secured?
Does the decision-making process appropriately function? etc.
Are related regulations and legal system arranged?
Is the organization financially independent, or is the financial support
continuously provided?
Are necessary technologies maintained and prevalent? Is the equipment
appropriately maintained?
Would a negative influence on the social and cultural aspects, if any,
become obstacles in carrying out activities?
Are there any negative influences on sustainability because of the
lack of consideration to women, the poor, and the socially
vulnerable?
Would a negative influence on the environment inhibit carrying out
activities?
Was (or is) the ownership of implementing agencies and related ministries
assured?
59
Figure 2-2-3 The Relationship between the Five Evaluation Criteria
and the Logframe (Conceptual Figure)
Note: In the past, the efficiency has been analyzed mainly based on the relationship between the inputs and outputs. However, the cost-effectiveness also should be verified by looking at the relationship between inputs and project purpose.
This figure mainly shows the relationship between the Five Evaluation Criteria and the
Logframe. Logframe is only one of the information sources in an evaluation and one
needs to look at other information as well. For instance:
for “relevance,” such information as development plans of a partner country,
background of project, the needs of the beneficiary, project strategies, and the
formulation of plans is needed;
“efficiency” needs to be analyzed from three viewpoints: 1) productivity; 2)
cost-benefit; and 3) cost-effectiveness;
for “impact,” not only the overall goal described as an expected effect in logframe,
but also unexpected positive and negative influences have to be investigated; the
relevance of project strategies in a program’s framework is also examined;
for “sustainability,” various questions have to be raised as is described in table
2-2-1; and
for “effectiveness” and “impact,” when examining the causal relationship between
project implementation and effects, such aspects as internal conditions,
implementation process, and unexpected external conditions should be included.
Impact
Overall Goal
Outputs
Inputs
Effectiveness
Efficiency
Relevance
Sustainability
Activities
(Assessment of performance)
(Examination of implementationprocess)
(note)
ProjectPurpose
60
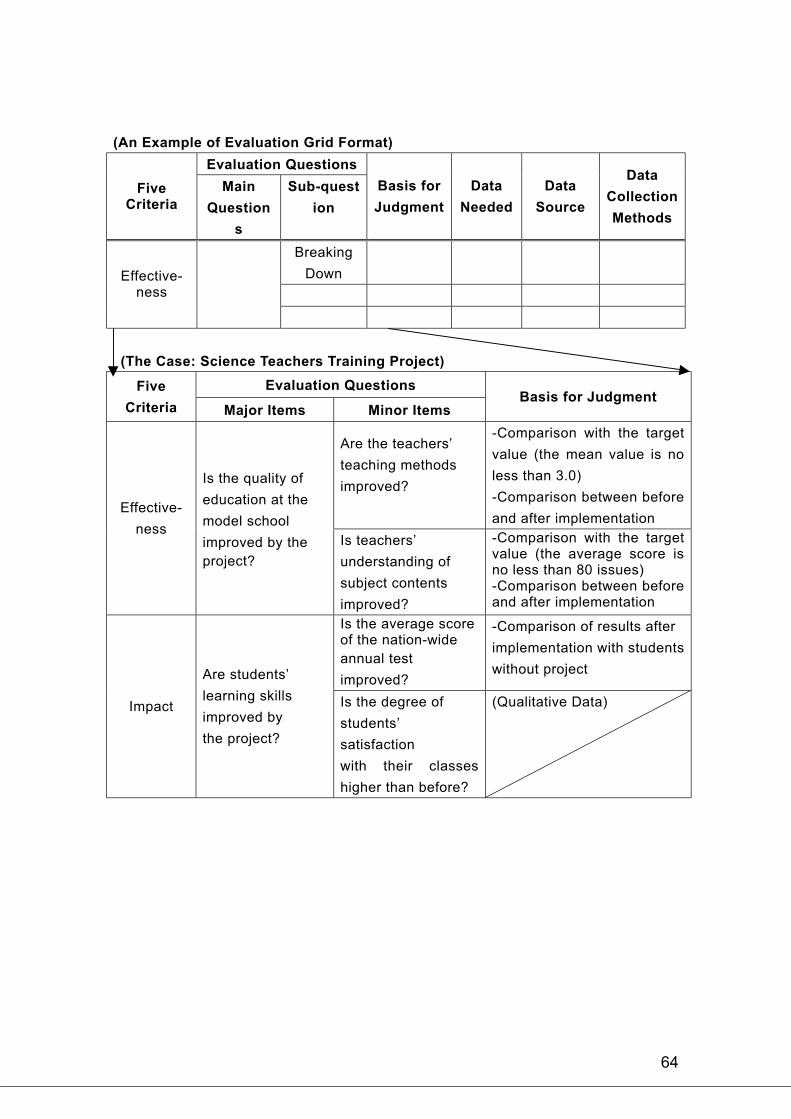
(3) How to describe the evaluation questions in an evaluation grid
All components of evaluation planning will finally be brought together in the
evaluation grid. Examples of evaluation questions in the case of the “mathematics
and science teachers training project” are as follows.
( An Example of Evaluation Grid Format)
Evaluation Questions Five
Criteria Main
Questions
Sub-
questions
Basis for
Judgment
Data
Needed
Data
Source
Data
Collection
Methods
Breaking
Down
Effective- ness
(The Case: Mathematics and Science Teachers Training Project)
Evaluation Questions Five
Criteria Main Questions Sub-questions
Are the teachers’ teaching methods
improved?*
Is the teachers’ performance in class
improved?**
Is the quality of education
at the model school
improved by the project? Is teachers’ understanding of subject
contents improved?***
Effective-
ness
Are trained teachers
continuously involved in
education activities?****
Is the average score of the nation-wide
annual test increased? Impact
Are students’ learning skills
improved by the project? Is the degree of students’ satisfaction with
their classes higher than before?
Note: It is meaningless to set evaluation questions unless the necessary data can be collected. The following data is supposed to be collected for the above mentioned questions.
* Comparison with the data obtained from the questionnaire survey that is supposedly
carried out after the project.
** The utilization of data obtained from direct observations correlated to the checklists
in monitoring activities.
*** Measurement by test scores.
**** Measurement of the ratio of teachers continuously working at the same
school at the time of evaluation.
61
2. Basis for Judgment
(1) Confirming Target Values or Setting New Criteria
The assessment of a project’s performance in and after mid-term evaluation needs
achievement criteria (or target values) in order to judge whether the objectives were
achieved as expected. Target values described in the indicators column can be
utilized as such criteria. In case no target values are specified, an evaluator
needs to set up the criteria for determining both the level of achievement and what
to compare that achievement to. For instance, to evaluate a water safety level, one
can apply the criteria for water quality set by the WHO. Another example is to apply
the national average rate of infectious diseases to the target region to measure the
changes after a health project. The evaluator and stakeholders have to fully
discuss what criteria to use as a basis for judgment. (Refer to Box 2: Several Ways of
Deciding Target Values.)
It is also necessary to consider what criteria to use in assessing efficiency.
For instance, in order to evaluate the cost-efficiency of building an elementary school,
such criteria as the total cost of similar projects, the average cost of building an
elementary school in a target country, or the average cost of one built by other
donors can be used. (Currently, the efficiency has not been analyzed from the cost
aspect because the criteria for comparison are not available. Therefore, in most
cases, the efficiency of implementation process has been qualitatively analyzed.
The accumulation of data for comparison is in need.)
<< BBooxx 2: Methods of Setting Target Values >
Refer to the needs of the target group: to set target values based on the standard expectedby the target group.
Refer to the mean of the large region to which the target area belongs: to set target valuesreferring to the mean of the large region to which the target area belongs. (e.g., country,prefecture)
Refer to successful cases of similar projects: to learn from experiences in successful casesof similar projects carried out under similar conditions. This is based on the idea that a targetproject should be as successful as those cases.
Refer to target values set by specialized agencies: to use standard values set byspecialized agencies – e.g., the criteria of water quality set by WHO.
62
(2) The Viewpoint of Examining Causal Relationships
In evaluating the effectiveness or the impact of a project, the evaluators should raise
the causal question on whether the effects resulted from project intervention. Such a
question is different than measuring a project’s achievement through normative
questions. Because a project is merely one intervention in a target society, we can
not exclude the influences of other factors besides the project. For instance, an
increase in farmers’ income could be caused by an increase in the productivity of
cash crops as a result of an irrigation project, or it might be the influence of totally
different factors such as the farmers’ working in the neighboring towns, other
chances to get extra income, and so on. In other words, the effects of a project can
not be measured only by looking at the changes of target beneficiaries. Usually
there are two methods to prove causality: 1) quantitative methods by “comparison;”
and 2) qualitative methods of constructing information, trying to prove interrelation
between the project outputs and outcome.
i) Quantitative Methods: Experimental Design Method, etc.
The basic methodology of quantitative methods to examine causal relationships is
“comparison.” There are two ways of comparison: 1) to compare a target
society/beneficiary before and after a project is conducted to see their changes; and
2) to compare a target society/beneficiary with a project and another society/people
without project.
The most scientific method is said to be the one called “the experimental
design method,” which is a combination of before/after and with/without. There are
two steps in conducting the survey: 1) to choose people as the target group and
another people as the non-target (control group) at random before implementing a
project; and 2) compare their changes before and after the project. However, these
methods raise ethical concerns and require a comparatively higher cost, and thus
can not easily be applied for evaluating individual projects in reality. However, it is
possible to conduct a simple comparative survey between those who participated in
a project and those who did not, even though those groups are not chosen at random.
(For instance, to compare people’s perception towards health care in a target region
of a PHC project and those in another region in the similar environment without the
project; this method is called “the quasi-experimental design method.”)
When evaluating individual projects at JICA, in many cases, before and after
comparison of the target group is applied. The baseline data obtained in ex-ante
evaluation will be used to compare results after the project. Another way of
examining causal relationships is to regularly measure data and see the transition
and its tendency in a time series.
63
ii) Qualitative Methods
Qualitative analysis of causal relationships tries to explain the relationship between
the project implementation and the changes in its beneficiaries. Such analysis brings
together (or constructs) various sources of information about the project in order to
ascertain what kind of causal relationship exists between the project and the effects
upon the target society.
There are several qualitative ways to analyze causal relationships as described
below.
Qualitative approach to analyze causal relationshipsConstruct information on implementation process from inputs through activities to outputs, and from outputs to objectives.
Attempt to explain the logical relationship between project implementation and effects.
Analyze the process to transfer and disseminate technologies through activities.
Clarify the relationship between project implementation and effects by conducting detailed and in-depth survey of a target region or a target group of small size (e.g. case study).
In constructing information on the implementation process and assessing
causal relationship, the qualitative data such as how activities are carried out,
whether outputs are achieved as expected, how a target group’s perception towards
the project changed, or when the effects were produced may be collected and
interpreted, in which qualitative analysis methods can be utilized. (Refer to table
2-2-4 for the methodology)
Both quantitative and qualitative methods can be combined and used
complimentarily. For instance, after the assessment of performance before and
after measurement, we can utilize qualitative methods to make the explanation more
persuasive. This is often the case with evaluations of individual projects at JICA.
(3) How to describe basis for judgment in evaluation grid
In the evaluation grid, a “basis for judgment” column is not necessarily filled in
depending on the evaluation questions. The relevance and the sustainability issue
may not require such a basis because qualitative data is mainly collected. An
example of the use of the evaluation grid with basis for judgment is shown below.
64
(An Example of Evaluation Grid Format)
Evaluation Questions
FiveCriteria
Main
Question
s
Sub-quest
ion
Basis for
Judgment
Data
Needed
Data
Source
Data
Collection
Methods
Breaking
Down
Effective- ness
(The Case: Science Teachers Training Project)
Evaluation Questions Five
Criteria Major Items Minor Items Basis for Judgment
Are the teachers’
teaching methods
improved?
-Comparison with the target
value (the mean value is no
less than 3.0)
-Comparison between before
and after implementation Effective-
ness
Is the quality of
education at the
model school
improved by the
project?
Is teachers’
understanding of
subject contents
improved?
-Comparison with the target value (the average score is no less than 80 issues) -Comparison between before and after implementation
Is the average score of the nation-wide
annual test
improved?
-Comparison of results after
implementation with students
without project
Impact
Are students’
learning skills
improved by
the project?
Is the degree of
students’
satisfaction
with their classes
higher than before?
(Qualitative Data)
65
< Box 3: The Experimental Design Method and the
Quasi-experimental Design Method >
The experimental design method is a method for examining causal relationships between effects and project implementation by comparing a group with a project (an implementation group) and a group without a project (a comparison group or control group). It is hard to examine causal relationships between the changes made and a specific project only by comparing before and after project implementation because of the influences from exogenous factors. The method is meant to estimate the “net effects” of a project intervention by detracting changes of a control group from the changes of an implementation group between before and after project implementation.
There are two cases of evaluation using a comparison group: 1) the case in which a comparison group already exists; and 2) the case in which evaluators formulate a comparison group at the time of evaluation. The more scientific (or theoretically effective) way to use comparison group is to choose both groups in a target region at random before the project launches.
When actually conducting a development assistance project, it may cause some difficulty to decide an implementation group and a comparison group in advance. There is an ethical issue in controlling and observing a group that is excluded from development benefits during the three to five years of the project period. Also, there is an issue of the cost.
The more easily usable method is to specify a comparison group that may have similar conditions to an implementation group, and to compare effects between them. This method is called the quasi-experimental design method, and two comparison groups of almost the same size with similar characteristics are compared. (This method is also called the matching model.)
For instance, it is possible to compare the situation after project implementation between village A where regional health care activities are conducted and village B without those activities. The village B needs to have a similar tendencies to village A in such conditions as gender ratio, number of households, kinds of infectious diseases, the actual situation of medical care services, the annual rainfall, or the geographic condition. Also, it is possible to further compare the selected groups of some specific characteristics (different age groups, different sex groups, different profession groups, etc.).
(Sources: Ryu Yoshiaki, Ryo Sasaki (2000), ‘Seisakuhyoka’ no riron to giho (Theories and Techniques of ‘Policy Evaluation’), Tagashuppan, p. 50-71; Lipsey RF (1999), Evaluation: A Systematic Approach, 6
th ed, SAGE, p. 279-306.
66
3. Considering Necessary Data and Information Sources
The next step is to identify what data should be collected from what sources in order
to answer evaluation questions. The task of identifying the necessary data is part of
the process of finding out the specific indicators for measuring a phenomenon. For
instance, an evaluator should decide a method of measurement: for instance,
whether “the richness” should be measured by the annual income or the number of
livestock in particular situation of the project. There usually are several ways of
measuring a phenomenon, and thus the most appropriate measurement should be
selected.
(1) Types of Data
There are two types of information or data to answer evaluation questions: 1)
quantitative data; and 2) qualitative data. The different nature of each type of data
should be realized because it affects data collection and analysis methods in an
evaluation study. (Refer to 2-2-4 for quantitative analysis and qualitative analysis
methods)
i) Quantitative Data
Quantitative data is the data expressed in numerical values (e.g., the harvest volume
of agricultural products, the literacy rate, the infant mortality rate, the area of
irrigation land, the number of facilities built, and the average test score). Quantitative
data is used more to assess project performance or the degree of achievement in
numerical values: e.g., to calculate the average income of a certain group by
statistical analysis, and to see the correlation between the academic history and the
income. Quantitative data is also suitable for analyzing the situation of a relatively
large-size group by conducting sampling surveys.
It is possible to quantify those “qualitative aspects” – that are not so easy to
directly measure in numerical values – through a questionnaire survey with multiple
choices or through observation with the check list. For example, in order to
investigate the degree of people’s satisfaction, an evaluator can calculate the
percentage of satisfied people by preparing five multiple choices: 1) fully satisfied; 2)
moderately satisfied; 3) neither satisfied nor unsatisfied; 4) a little unsatisfied; and 5)
totally unsatisfied. One can then calculate the mean value of the degree of
satisfaction by coding these choices with numbers from five to one respectively.
When measuring changes in people’s attitude or perception, it becomes possible to
quantify the changes by defining “the attitude” or “the perception” in concrete terms.
For instance, in order to analyze how teachers’ attitudes and teaching methods
changed after receiving training, those changes may be defined as “adopting a
67
participatory method in class,” “the attitude towards students not being able to keep
up with the progress of the class,” “the way of teaching with limited experimental
tools,” or “the way of fostering students’ creativity.” These can be measured through
observation by a third party or through a questionnaire survey for teachers.
Because quantitative data is systematically and uniformly collected, it may be
more reliable and easier to analyze. However, background information such as the
reason why a phenomenon is observed and how the status quo is achieved cannot
easily be obtained.
Quantitative data is applied to
Measure project performance or the degree of achievement
Investigate a large number of people
Use established measurement methods
Conduct statistical analysis
ii) Qualitative Data
Qualitative data is the data expressing a phenomenon in a descriptive way, and thus
it is suitable for understanding the situation in depth or for understanding the
people’s behavior and their perception in detail. Qualitative data can provide more
detailed information including influential factors, the process of changes, episodes,
and relationships among them in a project. Most of the information on the
implementation process is qualitative data, and this kind of information includes the
problems and measures taken in the process of activities, the management process,
human relationships, and the perception of stakeholders towards the project. Such
data can be analyzed to learn how these factors influenced the attainment of
objectives and what hindering or contributing factors exist. The analysis using
qualitative data is more inductive compared with quantitative data, and therefore, the
interpretation tends to be more biased.
Qualitative data is applied to
Conduct in-depth surveys with detailed information
Analyze related factors (hindering/contributing factors) that influenced the
achievement
Use when analytical methods are not decided in advance
Use when there is no need for quantification
68
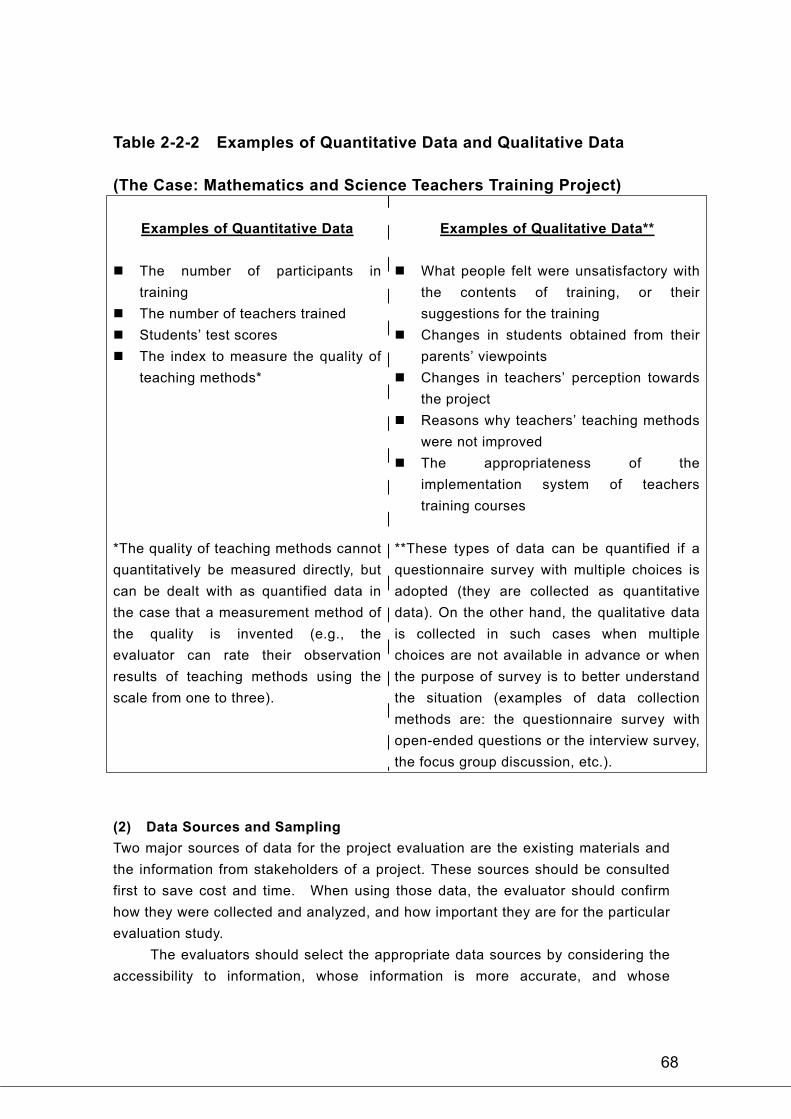
Table 2-2-2 Examples of Quantitative Data and Qualitative Data
(The Case: Mathematics and Science Teachers Training Project)
Examples of Quantitative Data
The number of participants in
training
The number of teachers trained
Students’ test scores
The index to measure the quality of
teaching methods*
*The quality of teaching methods cannot
quantitatively be measured directly, but
can be dealt with as quantified data in
the case that a measurement method of
the quality is invented (e.g., the
evaluator can rate their observation
results of teaching methods using the
scale from one to three).
Examples of Qualitative Data**
What people felt were unsatisfactory with
the contents of training, or their
suggestions for the training
Changes in students obtained from their
parents’ viewpoints
Changes in teachers’ perception towards
the project
Reasons why teachers’ teaching methods
were not improved
The appropriateness of the
implementation system of teachers
training courses
**These types of data can be quantified if a
questionnaire survey with multiple choices is
adopted (they are collected as quantitative
data). On the other hand, the qualitative data
is collected in such cases when multiple
choices are not available in advance or when
the purpose of survey is to better understand
the situation (examples of data collection
methods are: the questionnaire survey with
open-ended questions or the interview survey,
the focus group discussion, etc.).
(2) Data Sources and Sampling
Two major sources of data for the project evaluation are the existing materials and
the information from stakeholders of a project. These sources should be consulted
first to save cost and time. When using those data, the evaluator should confirm
how they were collected and analyzed, and how important they are for the particular
evaluation study.
The evaluators should select the appropriate data sources by considering the
accessibility to information, whose information is more accurate, and whose
69
viewpoints are indispensable. Differences of gender, ethnicity, and social classes
are also carefully examined when collecting and specifying data.
Necessary data may not be obtained as expected even from supposedly the
most ideal information source, if data collection methods are not appropriate. For
instance, in a society where women cannot raise their voices in the presence of men,
data should be collected in circumstances where men and women are separated.
When local people may not express their true feelings to outsiders, it may become
necessary to train local people as surveyors to carry out data collection.
When conducting surveys on a number of unidentified beneficiaries, we can
proceed with either: 1) a “census survey” in which all people (or a population) are the
target; or 2) a “sample survey” in which only a part of them is the target. Which to
choose depends on the survey purpose, the size of the target group or target region,
the restrictions of budget and time, and the accuracy of expected data. The merit of
the sampling survey is that the results of the survey can be generalized as
characteristics of a target population. (Refer to “Box 4: The Census Survey and the
Sample Survey.”)
70
Box 4: Census Survey and Sample Survey
Census Survey
The census survey is the type of survey in which all who have been involved in a
project are the sources of data collection. This survey is effective when gathering
quantitative data, such as “the percentage of the increase in the number of farmers
that attained higher productivity of rice” or “the percentage of the increase in the
number of people who gained knowledge on health.” The factors that influenced the
results can be estimated by statistically analyzing the living condition of the target
people.
It is relatively easy to conduct a census survey on a small sized project, a pilot
project, and a training project. In a large sized project, it is more difficult to obtain
information on all people, but if it focuses on a certain group of people who participated
in a certain activity, a census survey is also usable.
Sample Survey
The sample survey is the type of survey which estimates the characteristics of an
entire population through survey on the selected part of it. The sample size has to be
decided within the range of acceptable sampling error. The margin of sampling error is
+/– 5 percentage points when the sampling number is around 400, while +/– 10
percentage points for 100. For instance, in the case that 40 percent of 100 samples
are found to have agreed to certain opinion, it can be estimated that 30 to 50 percent
of the whole population agreed to it. It can be considered within an acceptable range
if a sampling error is less than 10 percent, and thus the sampling number of 100 or
more is desirable. There largely are two types of sampling: 1) random sampling; and
2) nonprobability sampling.
Source: Atsuko Isoda (2003), “Chapter 3: Joho/Deta no Shushu to Bunsekishuho (Methods ofInformation and Data Collection and Analysis),” Ed. NPO Corporation Ayus, KokusaikyoryokuPurojekuto Hyoka (Evaluation of International Cooperation Projects), International DevelopmentJournal, p. 77-79.
71
< Box 5: Theoretical Sampling”>
The sample survey is also called “statistical sampling” and is mainly used in
quantitative analysis. In contrast, in qualitative analysis, what is called ‘theoretical
sampling’ method is widely used. (Refer to 2-2-4 (3) p. 91 for quantitative and
qualitative methods.)
Theoretical sampling is usually applied in generating theory and categories
based on the findings of evaluation that are grounded in the empirical world. It directs
the evaluators where to collect what kind of data responding to various concepts that
are still in the process of construction. In other words, theoretical sampling is the
process for identifying samples through repeatedly collecting and analyzing data
related to concepts and categories.
For example, when measuring the outcome of a technical cooperation project,
the qualitative aspects of the attitudes and behavioral changes of beneficiaries and
target organizations are often investigated. In that case, theoretical sampling method
together with a logic model may be utilized to conduct an evaluation. The evaluators
can first identify a group of key informants who are theoretically considered to be an
important and effective data source, and then conduct interviews or focus group
discussions to assess their changes of attitudes or behavior. In analyzing the
collected data, another data source can be identified who may be related to the factors
and incidents resulted from the previous survey. Such a repeated process may be
ended when no other new findings are expected.
72
4. Data Collection Methods
(1) Types of Data Collection Methods
The main methods of collecting data are shown below. Some methods can be
applied to collect both quantitative and qualitative data depending on the structure of
questions and responses. For example, data can be quantified in a questionnaire
survey with response options prepared (e.g., 80% of respondents are satisfied),
whereas only qualitative data is available if it is structured with open-ended
questions.
Types of Data Collection Methods
Reviewing statistics, literature, and existing data
Observation
Questionnaire survey
Interview
Focus group discussion
Collecting data takes time and money, and thus the availability of existing
credible data is the first thing to be investigated. Each method has merits and
demerits, and the evaluator has to carefully select the appropriate methods for data
collection. Table 2-2-3 and 2-2-4 show the characteristics of each data collection
method for reference.
Table 2-2-3 Relationships between the Types of Data and Data
Collection Methods
Questionnaire Survey Observation
Structuredquestions
Open-ended
questions
Interview
Survey
Focus
Group
Discussion
Observation
Using the Checklist
SiteVisits
Quantita-
tive Data *
Qualita-
tive Data
*In the case that an interview is structured, it is possible to quantify results to some extent.
73
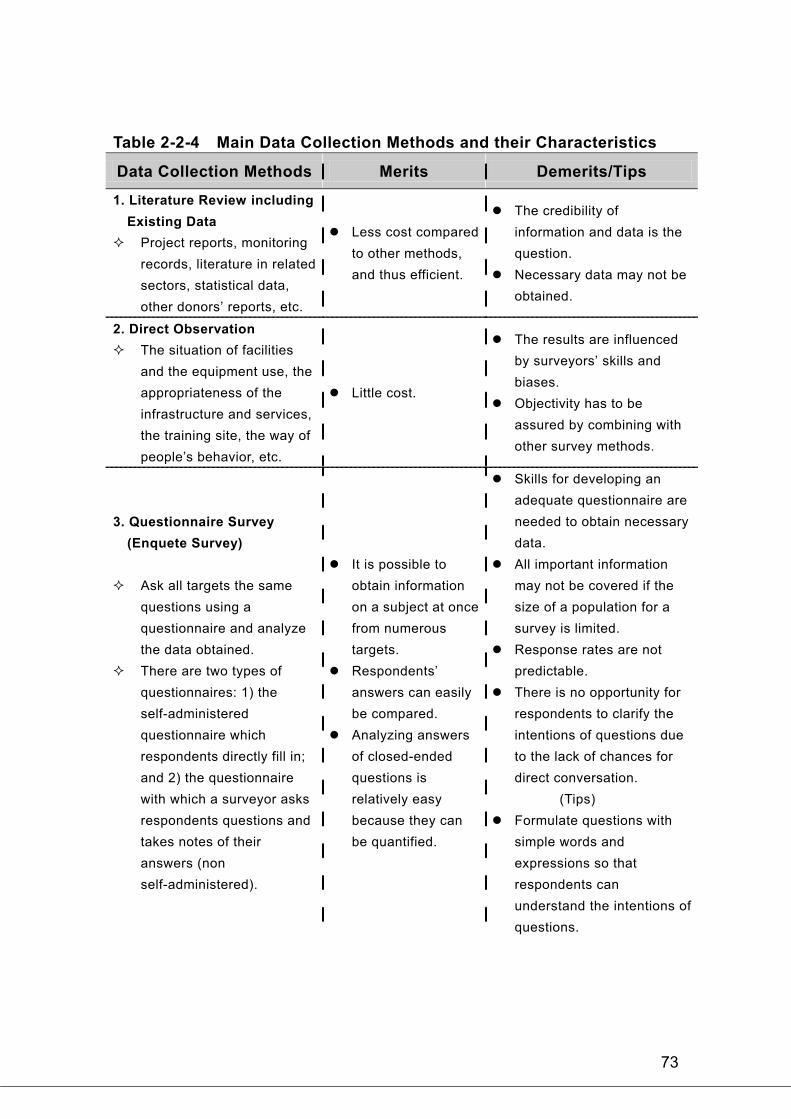
Table 2-2-4 Main Data Collection Methods and their Characteristics
Data Collection Methods Merits Demerits/Tips
1. Literature Review including
Existing Data
Project reports, monitoring
records, literature in related
sectors, statistical data,
other donors’ reports, etc.
Less cost compared
to other methods,
and thus efficient.
The credibility of
information and data is the
question.
Necessary data may not be
obtained.
2. Direct Observation
The situation of facilities
and the equipment use, the
appropriateness of the
infrastructure and services,
the training site, the way of
people’s behavior, etc.
Little cost.
The results are influenced
by surveyors’ skills and
biases.
Objectivity has to be
assured by combining with
other survey methods.
3. Questionnaire Survey
(Enquete Survey)
Ask all targets the same
questions using a
questionnaire and analyze
the data obtained.
There are two types of
questionnaires: 1) the
self-administered
questionnaire which
respondents directly fill in;
and 2) the questionnaire
with which a surveyor asks
respondents questions and
takes notes of their
answers (non
self-administered).
It is possible to
obtain information
on a subject at once
from numerous
targets.
Respondents’
answers can easily
be compared.
Analyzing answers
of closed-ended
questions is
relatively easy
because they can
be quantified.
Skills for developing an
adequate questionnaire are
needed to obtain necessary
data.
All important information
may not be covered if the
size of a population for a
survey is limited.
Response rates are not
predictable.
There is no opportunity for
respondents to clarify the
intentions of questions due
to the lack of chances for
direct conversation.
(Tips)
Formulate questions with
simple words and
expressions so that
respondents can
understand the intentions of
questions.
74
There are two types of
questions: 1) closed-ended
questions for which specific
response options are
provided; and 2)
open-ended questions for
which respondents answer
in their own words.
Pay enough attention to
write a request letter in a
proper way.
Take into consideration
social and cultural
backgrounds and ways of
expression so that the
intentions of questions are
properly conveyed.
Do not make the volume too
large.
Select types of response
while taking into
consideration data analysis
methods.
4. Interview Survey
There are some types of
interviews depending on
the target – individual
interview, group interview,
key informant interview,
etc.
There are three types of
interviews depending on
the structure of questions.
Structured Interview:
Specific questions are
prepared, same as in the
questionnaire survey.
It is possible to
flexibly deal with
respondents,
depending on the
situation.
It is possible to
further obtain
information from
respondents’
reactions – e.g.,
facial expressions,
voices, etc.
It is possible to ask
additional questions
to obtain more
details.
It takes time.
The results are influenced
by interviewers’ skills.
The results can be
influenced by individual
bias.
In many cases, it is not
possible to quantify data
and thus, generalize
results.
(Tips)
Create questions assuming
a smooth conversation.
Avoid long questions or a
large volume of questions.
Try to obtain information
also through observation of
respondents’ facial
expressions, attitudes, etc.
75
Semi-structured Interview:
Main questions are
prepared. Some
additional questions
are asked when
necessary during the
interview.
Unstructured Interview:
Only the intention of
the interview is
clarified. Questions
are freely asked for
each respondent.
5. Focus Group Discussion
A group of around 10
persons with the same
background discusses
specific topics (or
questions). Their perception
towards the topics or ideas
can be obtained through
observing the discussion.
It is relatively easy
to conduct it.
Through
participants’
interactions,
information on
specific topics is
obtained from
various viewpoints.
Objections are
easily heard.
It is not suitable for
sensitive topics.
A few respondents may
control the discussion.
Respondents may not
express their true feelings
if the topics are related to
social norms.
Discussions are
influenced by facilitator’s
skills (capable facilitators
are needed).
Carefully select members
(maximum 12 persons).
Have someone make a
record of the discussion.
In the questionnaire survey or the interview, results may easily be influenced
by the way questions are formulated. Even though a questionnaire survey is
conducted for the whole population, or for key respondents who may have important
information, it might not be possible to obtain the necessary data as expected unless
questions are appropriate and operational. Described below are some tips
regarding how to prepare questionnaires and questions by different methods of data
collection.
76
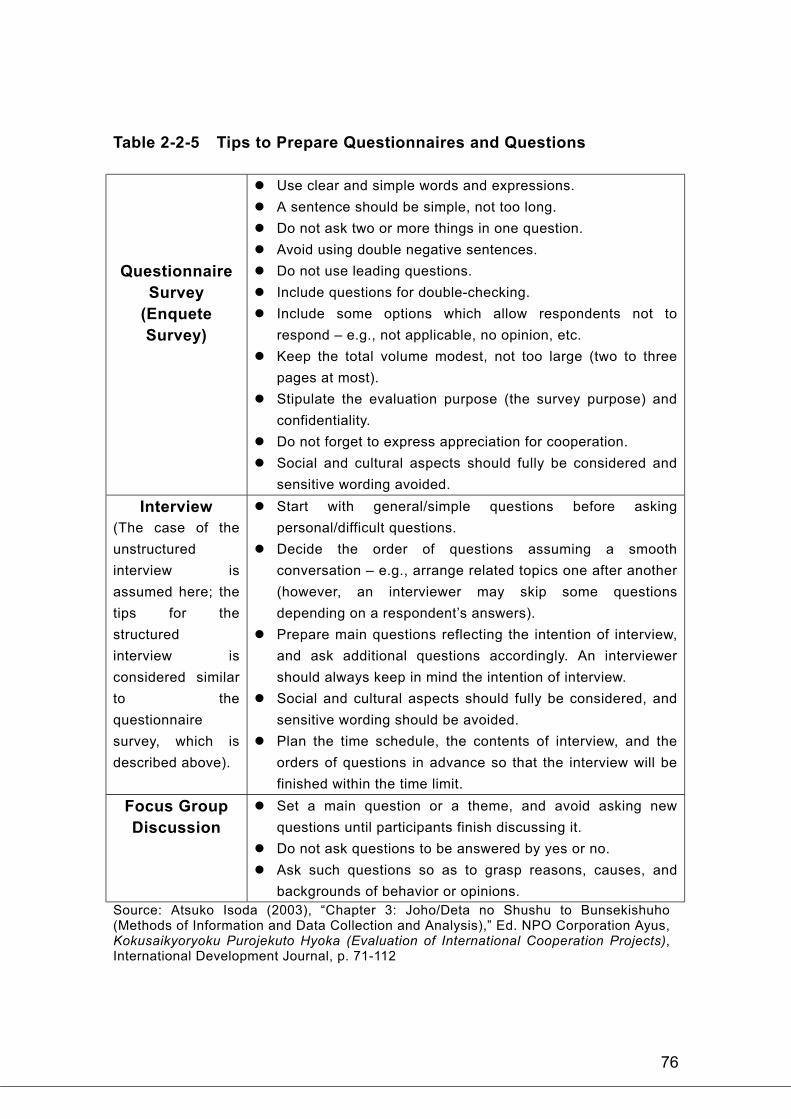
Table 2-2-5 Tips to Prepare Questionnaires and Questions
Questionnaire
Survey
(Enquete
Survey)
Use clear and simple words and expressions.
A sentence should be simple, not too long.
Do not ask two or more things in one question.
Avoid using double negative sentences.
Do not use leading questions.
Include questions for double-checking.
Include some options which allow respondents not to
respond – e.g., not applicable, no opinion, etc.
Keep the total volume modest, not too large (two to three
pages at most).
Stipulate the evaluation purpose (the survey purpose) and
confidentiality.
Do not forget to express appreciation for cooperation.
Social and cultural aspects should fully be considered and
sensitive wording avoided.
Interview
(The case of the
unstructured
interview is
assumed here; the
tips for the
structured
interview is
considered similar
to the
questionnaire
survey, which is
described above).
Start with general/simple questions before asking
personal/difficult questions.
Decide the order of questions assuming a smooth
conversation – e.g., arrange related topics one after another
(however, an interviewer may skip some questions
depending on a respondent’s answers).
Prepare main questions reflecting the intention of interview,
and ask additional questions accordingly. An interviewer
should always keep in mind the intention of interview.
Social and cultural aspects should fully be considered, and
sensitive wording should be avoided.
Plan the time schedule, the contents of interview, and the
orders of questions in advance so that the interview will be
finished within the time limit.
Focus Group
Discussion
Set a main question or a theme, and avoid asking new
questions until participants finish discussing it.
Do not ask questions to be answered by yes or no.
Ask such questions so as to grasp reasons, causes, and
backgrounds of behavior or opinions.
Source: Atsuko Isoda (2003), “Chapter 3: Joho/Deta no Shushu to Bunsekishuho (Methods of Information and Data Collection and Analysis),” Ed. NPO Corporation Ayus, Kokusaikyoryoku Purojekuto Hyoka (Evaluation of International Cooperation Projects),International Development Journal, p. 71-112
77
(2) Combining Different Data Collection Methods
In order to maximize the merits and minimize the demerits of each data collection
method, several different methods should be combined. For example, a
questionnaire survey can be conducted to complement existing data. Or, a focus
group discussion among local people may be conducted to know their perception
after an understanding of the general tendency has already been learned through a
questionnaire survey. It is also possible to carry out a survey using both quantitative
and qualitative data collection methods. It is important to consider the combination
of several methods in order to reduce the biases of surveyors as well as
respondents.
Some examples of combining methods are described below.
Combining different methods
Facilitate a focus group discussion first to formulate questions for a
questionnaire survey afterwards.
<Examples of Use and Merits>
Grasp important issues by observing those concerned in a project and analyzing their perception through a focus group discussion, and reflect the results on a questionnaire survey.
When setting specific response options for a questionnaire survey, refer to the results of a focus group discussion.
Facilitate a focus group discussion after obtaining results through a
questionnaire survey or literature review in order to further investigate the
background information.
Facilitate a focus group discussion to understand factors that affected the project. Such a discussion can help explain the reasons for and the background behind the results of the questionnaire survey (ask participants the reason why the results are obtained).
Ask participants about supporting evidence for data in monitoring reports (e.g., in the case that the performance was low) and influential factors.
Conduct a questionnaire survey at the end of a group interview.
The respondents may understand the intention of a questionnaire survey in advance.
It is easier to obtain respondents’ cooperation for a questionnaire survey.
Use some open-ended questions in a questionnaire survey together with
multiple choices.
It may be possible to know respondents’ perception in a way that may not be obtained through analyzing the closed-end questions.
78
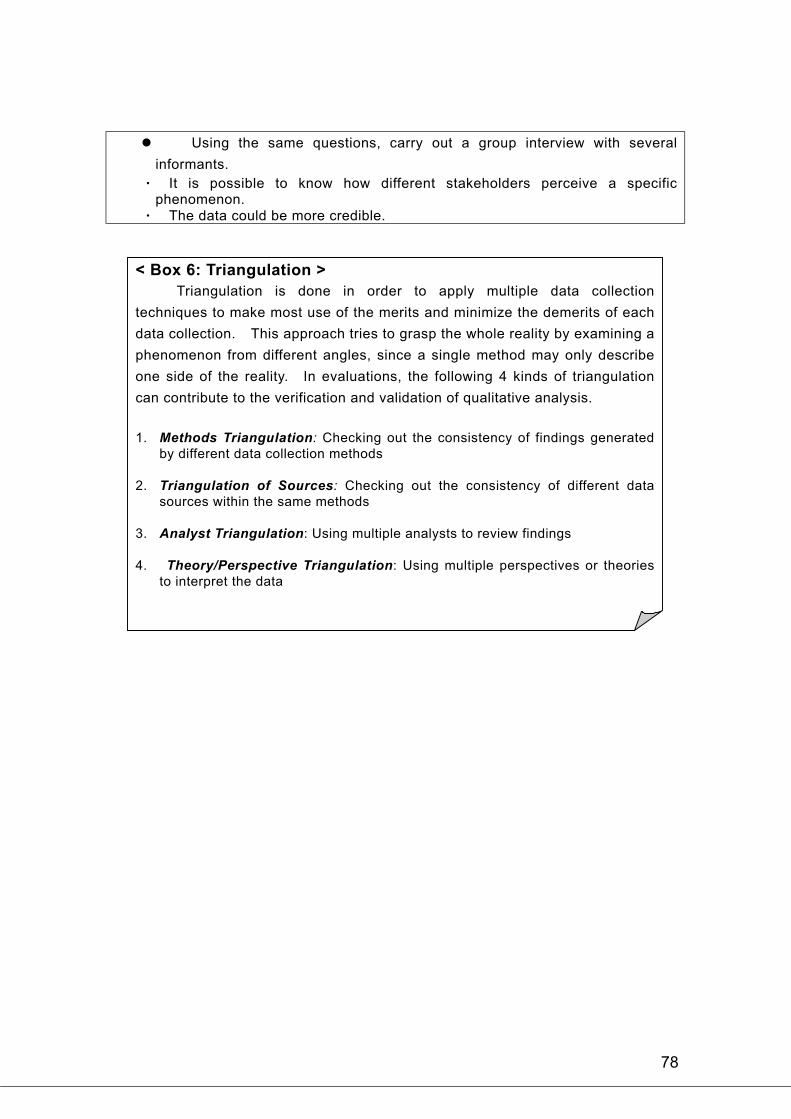
Using the same questions, carry out a group interview with several
informants.
It is possible to know how different stakeholders perceive a specific phenomenon.
The data could be more credible.
< Box 6: Triangulation >
Triangulation is done in order to apply multiple data collection
techniques to make most use of the merits and minimize the demerits of each
data collection. This approach tries to grasp the whole reality by examining a
phenomenon from different angles, since a single method may only describe
one side of the reality. In evaluations, the following 4 kinds of triangulation
can contribute to the verification and validation of qualitative analysis.
1. Methods Triangulation: Checking out the consistency of findings generated
by different data collection methods
2. Triangulation of Sources: Checking out the consistency of different data
sources within the same methods
3. Analyst Triangulation: Using multiple analysts to review findings
4. Theory/Perspective Triangulation: Using multiple perspectives or theories
to interpret the data
79
(3) Types of Data Analysis Methods
JICA staff is not directly involved in the task of analyzing collected data. However,
they should have basic knowledge of data analysis methods so that they can plan
evaluation studies and create the Terms Of Reference (TORs) for consultants. If
they are familiar with the different characteristics of data analysis methods, it will
help them decide the appropriate evaluation work plans. There are two types of data
analysis: 1) quantitative analysis; and 2) qualitative analysis – exactly the same as
the types of data. They should be utilized complementarily.
Quantitative analysis demonstrates the degree of achievement or causal
relationships using quantitative data based on statistics grounds. It tries to present
the evaluation results as scientifically as possible.
On the other hand, qualitative analysis uses qualitative information obtained
from a literature review, interview, or a focus group discussion, etc. The set of
analytical tools is not prepared in advance, and in the process of data analysis, the
meaning of data, new facts, or relationships between factors may be deductively
constructed.
The results of qualitative analysis may be influenced by the biases of both
respondents and analysts. In order to assure the objectivity of the findings, such
measures as having a third party conduct the analysis or combining with other data
collection methods should be incorporated. One of the merits of qualitative analysis
is its ability to obtain detailed information about local target populations and people’s
behavioral changes. The results of qualitative analysis can be utilized as
supporting evidence for the results of quantitative analysis, and thus can help to
identify the various factors influencing project performance.
80
< Box 7 : Basic Quantitative Analysis Methods >>
Simple Aggregation and Simple Statistical Analysis
The basic quantitative analysis method deals with a single variable. Thismethod is suitable for examining the degree of achievement or for comparing thatachievement with target values. Although being a simple method, it providesmeaningful data, and thus is useful for carrying out evaluation. Types of analysis aredescribed below.
Frequency (e.g., the number of persons who answered “yes” and that ofpersons who answered “no”)
Percentage distribution (e.g., the ratio of persons who responded per100 persons)
Central tendency (the mean, the mode, the median
Standard deviation (to see how far the values are distributed from themean)
Cross Aggregation
This type of statistical analysis method sees how each of the persons whoresponded in a certain way to a question responds to another question, or thetendency of responses depending on the attribution. For instance, by creating atable (a cross-tabulation) composed of two variables: 1) the row variable is “practiceof hand-washing”; and 2) the column variable is “the participation in the hygienecampaign,” we can estimate the frequency or the ratio of people who practicehand-washing based on whether they participated in the campaign. This method isuseful for comparing between a target group with a project and a control group
without any project (with/without , or to examine the influences of a project on
different groups.
Correlation Coefficient
This type of statistical analysis method examines whether there is a linearrelationship between two sets of numerical values for two variables (e.g., data of theincome level and that of the education level). There are two types of relationships inthat direction: 1) a positive relationship in which an increase in the value of onevariable is accompanied by an increase in the value of the other; and 2) a negativerelationship in which a decrease in the value of one variable is accompanied by anincrease in the value of the other.
Multivariate Analysis
This type of statistical analysis method deals with three or more variables.Multivariate analysis includes “multiple regression” to analyze multiple variables and“factor analysis” to analyze the degree of other factors’ influences on a variable. Thismethod is used to examine causal relationships between variables in which acorrelation is estimated, and requires a special analysis software.
(Source: Atsuko Isoda (2003), “Chapter 3: Joho/Deta no Shushu to Bunsekishuho (Methods of
Information and Data Collection and Analysis),” Ed. NPO Corporation Ayus, Kokusaikyoryoku
Purojekuto Hyoka (Evaluation of International Cooperation Projects), International Development
Journal, p. ??.)
81
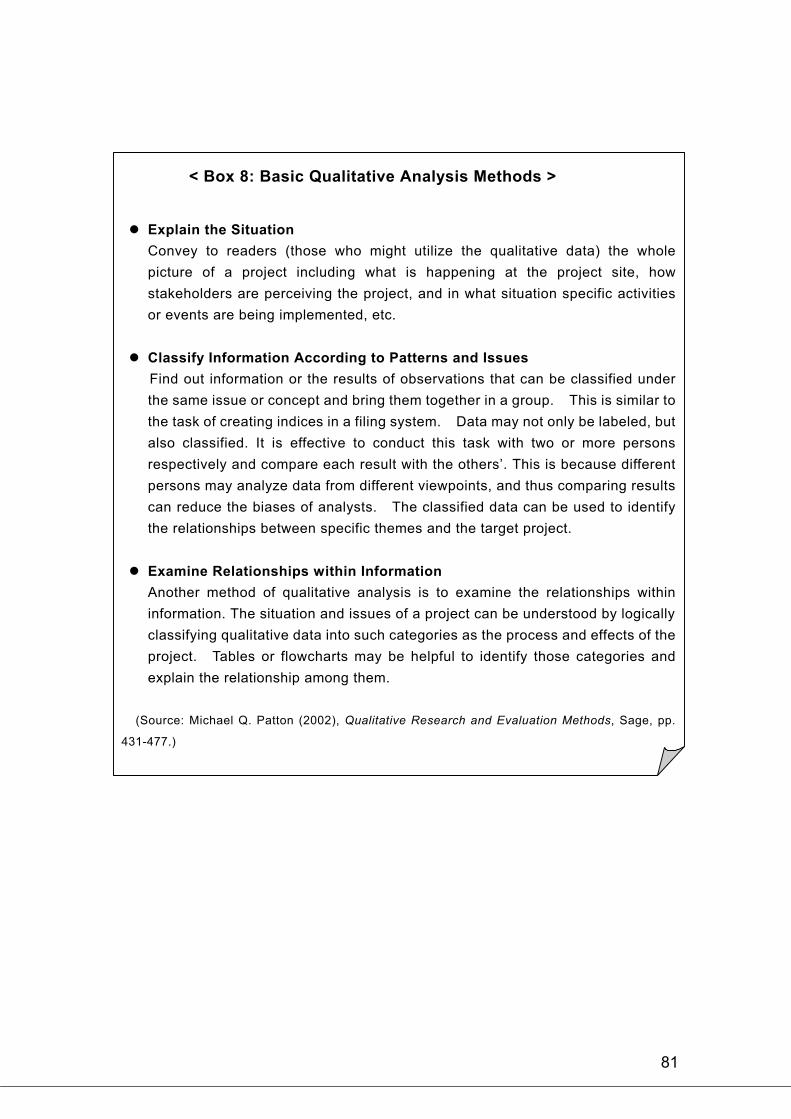
< Box 8: Basic Qualitative Analysis Methods >
Explain the Situation
Convey to readers (those who might utilize the qualitative data) the whole
picture of a project including what is happening at the project site, how
stakeholders are perceiving the project, and in what situation specific activities
or events are being implemented, etc.
Classify Information According to Patterns and Issues
Find out information or the results of observations that can be classified under
the same issue or concept and bring them together in a group. This is similar to
the task of creating indices in a filing system. Data may not only be labeled, but
also classified. It is effective to conduct this task with two or more persons
respectively and compare each result with the others’. This is because different
persons may analyze data from different viewpoints, and thus comparing results
can reduce the biases of analysts. The classified data can be used to identify
the relationships between specific themes and the target project.
Examine Relationships within Information
Another method of qualitative analysis is to examine the relationships within
information. The situation and issues of a project can be understood by logically
classifying qualitative data into such categories as the process and effects of the
project. Tables or flowcharts may be helpful to identify those categories and
explain the relationship among them.
(Source: Michael Q. Patton (2002), Qualitative Research and Evaluation Methods, Sage, pp.
431-477.)
82
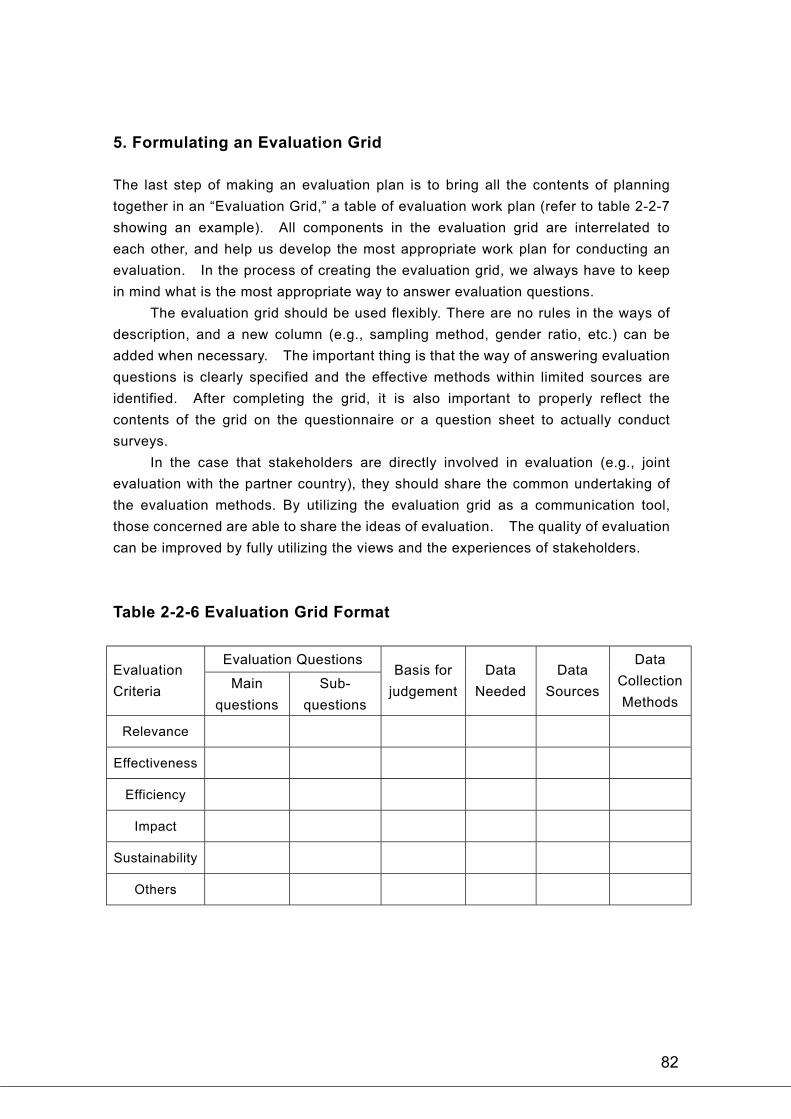
5. Formulating an Evaluation Grid
The last step of making an evaluation plan is to bring all the contents of planning
together in an “Evaluation Grid,” a table of evaluation work plan (refer to table 2-2-7
showing an example). All components in the evaluation grid are interrelated to
each other, and help us develop the most appropriate work plan for conducting an
evaluation. In the process of creating the evaluation grid, we always have to keep
in mind what is the most appropriate way to answer evaluation questions.
The evaluation grid should be used flexibly. There are no rules in the ways of
description, and a new column (e.g., sampling method, gender ratio, etc.) can be
added when necessary. The important thing is that the way of answering evaluation
questions is clearly specified and the effective methods within limited sources are
identified. After completing the grid, it is also important to properly reflect the
contents of the grid on the questionnaire or a question sheet to actually conduct
surveys.
In the case that stakeholders are directly involved in evaluation (e.g., joint
evaluation with the partner country), they should share the common undertaking of
the evaluation methods. By utilizing the evaluation grid as a communication tool,
those concerned are able to share the ideas of evaluation. The quality of evaluation
can be improved by fully utilizing the views and the experiences of stakeholders.
Table 2-2-6 Evaluation Grid Format
Evaluation Questions Evaluation
CriteriaMain
questions
Sub-
questions
Basis for
judgement
Data
Needed
Data
Sources
Data
Collection
Methods
Relevance
Effectiveness
Efficiency
Impact
Sustainability
Others
83
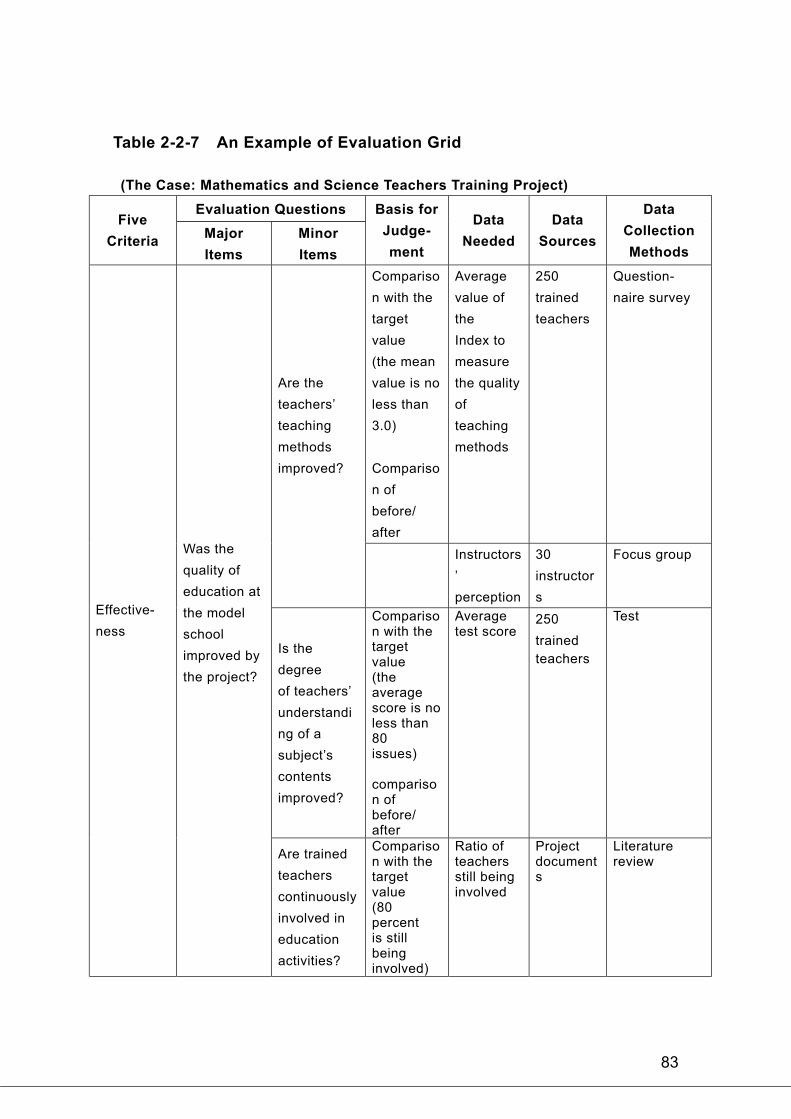
Table 2-2-7 An Example of Evaluation Grid
(The Case: Mathematics and Science Teachers Training Project)
Evaluation Questions Five
CriteriaMajor
Items
Minor
Items
Basis for
Judge-
ment
Data
Needed
Data
Sources
Data
Collection
Methods
Compariso
n with the
target
value
(the mean
value is no
less than
3.0)
Compariso
n of
before/
after
Average
value of
the
Index to
measure
the quality
of
teaching
methods
250
trained
teachers
Question-
naire survey
Are the
teachers’
teaching
methods
improved?
Instructors
’
perception
30
instructor
s
Focus group
Is the
degree
of teachers’
understandi
ng of a
subject’s
contents
improved?
Comparison with the targetvalue(theaveragescore is no less than 80issues)
comparison of before/ after
Average test score
250
trained
teachers
Test Effective-
ness
Was the
quality of
education at
the model
school
improved by
the project?
Are trained
teachers
continuously
involved in
education
activities?
Comparison with the targetvalue(80percentis still beinginvolved)