Chapter 2 Secondary organic aerosol formation from reaction of isoprene with nitrate radical 1 1 Adapted from Ng, N. L., Kwan, A. J., Surratt, J. D., Chan, A. W. H., Chhabra, P. S., Sorooshian, A., Pye, H. O. T., Crounse, J. D., Wennberg, P. O., Flagan, R. C., and Seinfeld, J. H.: Secondary organic aerosol (SOA) formation from reaction of isoprene with nitrate radicals (NO 3 ), Atmospheric Chemistry and Physics, 8, 4117-4140, 2008. 15
Transcript
Chapter 2
Secondary organic aerosol formation from reaction of isoprene
with nitrate radical1
1 Adapted from Ng, N. L., Kwan, A. J., Surratt, J. D., Chan, A. W. H., Chhabra, P. S., Sorooshian, A., Pye, H. O. T., Crounse, J. D., Wennberg, P. O., Flagan, R. C., and Seinfeld, J. H.: Secondary organic aerosol (SOA) formation from reaction of isoprene with nitrate radicals (NO3), Atmospheric Chemistry and Physics, 8, 4117-4140, 2008.
15
Abstract
Secondary organic aerosol (SOA) formation from the reaction of isoprene with
nitrate radicals (NO3) is investigated in the Caltech indoor chambers. Experiments are
performed in the dark and under dry conditions (RH < 10%) using N2O5 as a source of
NO3 radicals. For an initial isoprene concentration of 18.4 to 101.6 ppb, the SOA yield
(defined as the ratio of the mass of organic aerosol formed to the mass of parent
hydrocarbon reacted) ranges from 4.3% to 23.8%. By examining the time evolutions of
gas-phase intermediate products and aerosol volume in real time, we are able to constrain
the chemistry that leads to the formation of low-volatility products. Although the
formation of ROOR from the reaction of two peroxy radicals (RO2) has generally been
considered as a minor channel, based on the gas-phase and aerosol-phase data it appears
that RO2 + RO2 reaction (self reaction or cross-reaction) in the gas phase yielding ROOR
products is a dominant SOA formation pathway. A wide array of organic nitrates and
peroxides are identified in the aerosol formed and mechanisms for SOA formation are
proposed. Using a uniform SOA yield of 10% (corresponding to Mo 10 g m-3), it is
estimated that ~2 to 3 Tg yr-1 of SOA results from isoprene + NO3. The extent to which
the results from this study can be applied to conditions in the atmosphere depends on the
fate of peroxy radicals in the nighttime troposphere.
2.1 Introduction
Isoprene has the largest emissions of any non-methane hydrocarbon (~500 Tg yr-
1) (Guenther et al., 1995; Guenther et al., 2006). In the troposphere, isoprene reacts with
hydroxyl radicals (OH), ozone (O3), and nitrate radicals (NO3). Owing to its high
16
concentration and reactivity with OH radicals, isoprene plays an important role in the
photochemistry occurring within the atmospheric boundary layer. Recently, it has been
shown that the photooxidation of isoprene leads to the formation of low volatility species
that condense to form SOA (Claeys et al., 2004; Edney et al., 2005; Kroll et al., 2005;
Dommen et al., 2006; Kroll et al., 2006; Surratt et al., 2006); SOA yields as high as ~ 3%
have been observed (Kroll et al., 2005; Kroll et al., 2006). Global SOA production from
isoprene photooxidation has been estimated to be about 13 Tg yr-1 (Henze et al., 2007).
Although emission of isoprene from vegetation is triggered by sunlight and
increases with light intensity and temperature (e.g., Sharkey et al., 1996), the isoprene
mixing ratio has been observed to peak in early evening in several field studies, with a
measured mixing ratio up to a few ppb (Curren et al., 1998; Starn et al., 1998; Stroud et
al., 2002; Steinbacher et al., 2005). After sunset, the isoprene mixing ratio drops rapidly,
and it has been suggested that the reaction with nitrate radicals, NO3, is a major
contributor to isoprene decay at night (Curren et al., 1998; Starn et al., 1998; Stroud et al.,
2002; Steinbacher et al., 2005). Typical NO3 radical mixing ratios in boundary layer
continental air masses range between ~10 to ~100 ppt (Platt and Janssen, 1995; Smith et
al., 1995; Heintz et al., 1996; Carslaw et al., 1997). Concentrations as high as several
hundred ppt have been observed over northeastern USA and Europe, however (Platt et
al., 1981; von Friedeburg et al., 2002; Brown et al., 2006; Penkett et al., 2007). Given the
rapid reaction rate between isoprene and NO3 radicals (kNO3 = 7 x 10-13 cm3 molecule-1 s-1
at T = 298 K, IUPAC), it is likely that NO3 radicals play a major role in the nighttime
chemistry of isoprene.
17
The kinetics and gas-phase products of the isoprene-NO3 reaction have been the
subject of several laboratory and theoretical studies (Jay and Stieglitz, 1989; Barnes et al.,
1990; Skov et al., 1992; Kwok et al., 1996; Berndt and Böge, 1997; Suh et al., 2001;
Zhang et al., 2002; Fan et al., 2004). In many studies, C5-nitrooxycarbonyl is identified
as the major first-generation gas-phase reaction product (Jay and Stieglitz, 1989; Skov et
al., 1992; Kwok et al., 1996; Berndt and Böge, 1997). Other compounds such as C5-
hydroxynitrate, C5-nitrooxyhydroperoxide, and C5-hydroxycarbonyl have also been
identified (Kwok et al., 1996); C5-hydroxynitrate has also been measured in ambient air
with concentrations in the lower ppt range at a few ng m-3 (Werner et al., 1999).
According to the experimental study by Barnes et al. (1990), the yield for nitrate-
containing compounds from the reaction of isoprene and NO3 radicals can be as high as
80%. A recent modeling study in conjunction with observations from the ICARTT field
campaign suggests that ~50% of the total isoprene nitrates production occurs via reaction
of isoprene and NO3 radicals (Horowitz et al., 2007).
Little is known beyond the formation of the first-generation products of the
reaction of NO3 with isoprene. The isoprene nitrates and other first-generation products
still contain a double bond, and it is likely that the further oxidation of these species will
lead to low volatility products that can contribute to SOA formation at nighttime.
In this work, SOA formation from the reaction of isoprene with NO3 radicals is
investigated. Laboratory chamber experiments are performed in the dark using N2O5 as a
source of NO3 radicals. Aerosol yields are obtained over a range of initial isoprene
concentrations (mixing ratios). By examining the time evolutions of aerosol volume and
different intermediate gas-phase products, we are able to constrain the chemistry that
18
leads to the formation of low-volatility products. Mechanisms for SOA formation are
proposed and chemical composition data of the SOA formed are also presented.
2.2 Experimental
Experiments are carried out in the Caltech dual 28 m3 Teflon chambers. A
detailed description of the facility is provided elsewhere (Cocker et al., 2001; Keywood
et al., 2004). Before each experiment, the chambers are flushed continuously for over 24
h. Aerosol number concentration, size distribution, and volume concentration are
measured by a Differential Mobility Analyzer (DMA, TSI model 3081) coupled with a
condensation nucleus counter (TSI model 3760). All aerosol growth data are corrected
for wall loss, in which size-dependent particle loss coefficients are determined from inert
particle wall loss experiments (Keywood et al., 2004). Temperature, relative humidity
(RH), O3, NO, and NOx are continuously monitored. Experiments are performed in the
dark at room temperature (20-21°C) and under dry conditions (RH < 10%).
In most experiments, seed aerosols are introduced into the chamber to act as a
substrate onto which the gas-phase products may condense. Seed aerosols are generated
by atomizing an aqueous solution with a constant-rate atomizer. The seed solution
consists of 0.015 M (NH4)2SO4. In a few experiments, acidic seed is used, consisting of
0.03 M MgSO4 and 0.05 M H2SO4. The initial particle number concentration is ~20,000
particles cm-3, with a geometric mean diameter of ~50 nm. The initial seed volume is 10-
12 µm3 cm-3. In some experiments, no seed particles are added and aerosols are formed
via nucleation. After introduction of the seed aerosols (in seeded experiments), a known
volume of isoprene (Aldrich, 99%) is injected into a glass bulb and introduced into the
19
chamber by an air stream. The mixing ratio of isoprene is monitored with a gas
chromatograph equipped with a flame ionization detector (GC-FID, Agilent model
6890N). The column used is a bonded polystyrene-divinylbenzene based column (HP-
PLOT Q, 15 m × 0.53 mm, 40 µm thickness, J&W Scientific). The oven temperature is
held at 60°C for 0.5 min, ramped at 35°C min-1 to 200°C, and held constant for 3.5 min.
The thermal decomposition of N2O5 serves as a source of NO3 radicals in these
experiments. N2O5 is prepared and collected offline by mixing a stream of nitric oxide
(≥99.5%, Matheson Tri Gas) with a stream of ozone in a glass bulb (Davidson et al.,
1978):
NO + O3 NO2 + O2 (2.1)
NO2 + O3 NO3 + O2 (2.2)
NO2 + NO3 N2O5 (2.3)
Ozone is generated by flowing oxygen through an ozonizer (OREC model V10-0,
Phoenix, AZ) at ~1 L min-1. The mixing ratio of ozone is measured by a UV/VIS
spectrometer (Hewlett Packard model 8453) to be ~2%. The flow rate of nitric oxide into
the glass bulb is adjusted until the brown color in the bulb disappears. The N2O5 is
trapped for 2 h in an acetone-dry ice bath (approximately at -80°C; cold enough to trap
N2O5 but not O3, as condensed O3 can explode upon warming and is extremely
dangerous) as a white solid, and stored between experiments under liquid nitrogen
temperature. Once the seed and isoprene concentrations in the chamber stabilize,
reaction is initiated by vaporizing N2O5 into an evacuated 500 mL glass bulb and
introduced into the chamber with an air stream of 5 L min-1. The amount of N2O5
injected is estimated based on the vapor pressure in the glass bulb, which is measured
20
using a capacitance manometer (MKS); this amount corresponds to an initial mixing ratio
of ~1 ppm in the chamber. The thermal decomposition of N2O5 forms NO2 and NO3
radicals. Impurities in the N2O5 starting material are quantified by FTIR spectroscopy
(Nicolet model Magna 550). N2O5 is vaporized into an evacuated pyrex cell (18 cm in
length and 300 cm3) with CaF2 windows. Spectra are collected immediately upon
addition over the 1000 cm-1 to 4000 cm-1 window allowing for quantification of NO2
(1616 cm-1 band) and HNO3 (3550 cm-1 band) impurities.
A custom-modified Varian 1200 Chemical Ionization Mass Spectrometer (CIMS) is
used to continuously monitor the concentrations of various gas-phase intermediates and
products over the course of the experiments. The CIMS instrument is operated mainly in
negative mode using CF3O- as a reagent ion, which selectively clusters with compounds
having high fluorine affinity (e.g., acidic compounds and many hydroxy- and nitrooxy-
carbonyls), forming ions at m/z MW + 85. In some experiments, the CIMS instrument is
also operated in the positive mode using H2O·H+ as a reagent ion forming ions at m/z
MW + 1. The ionization schemes are as follows:
Negative chemical ionization: CF3O- + HB --> CF3O
-·HB
Positive chemical ionization: H2O·H+ + D --> D·H+ + H2O (where D has a proton affinity
> H2O)
The term “product ion” is used throughout this manuscript to describe the ionized
products formed through the above chemical reaction schemes. Typically, we scan from
m/z 50 to 400. More details about the CIMS technique are given in Crounse et al. (2006)
and Ng et al. (2007a). Because authentic standards are not available for the major
products, sensitivities are not experimentally determined. We estimate the collision rate
21
of CF3O- with these products (which determines the sensitivity) with the empirical
method of Su and Chesnavich (1982), which bases its predictions on an analyte's dipole
moment and polarizability. Dipole moments and polarizabilities are calculated with the
Spartan06 quantum package, and are based on molecular structures optimized with the
B3LYP/6-31G(d) method. Further details on estimating CIMS sensitivities based on
quantum calculations are described in Paulot et al. (2008). As isomers would have
different polarities and hence different sensitivities, in estimating the concentrations it is
assumed that the NO3 attack at C1-position to C4-position is 5.5:1 (See Section 2.4.1).
Aerosol physical and chemical properties are monitored by many instruments.
Real-time particle mass spectra are obtained with an Aerodyne quadrupole Aerosol Mass
Spectrometer (Q-AMS) (Jayne et al., 2000). A Particle-Into-Liquid Sampler (PILS,
Brechtel Manufacturing, Inc.) coupled with ion chromatography (IC) is employed for
quantitative measurements of water-soluble ions in the aerosol phase (Sorooshian et al.,
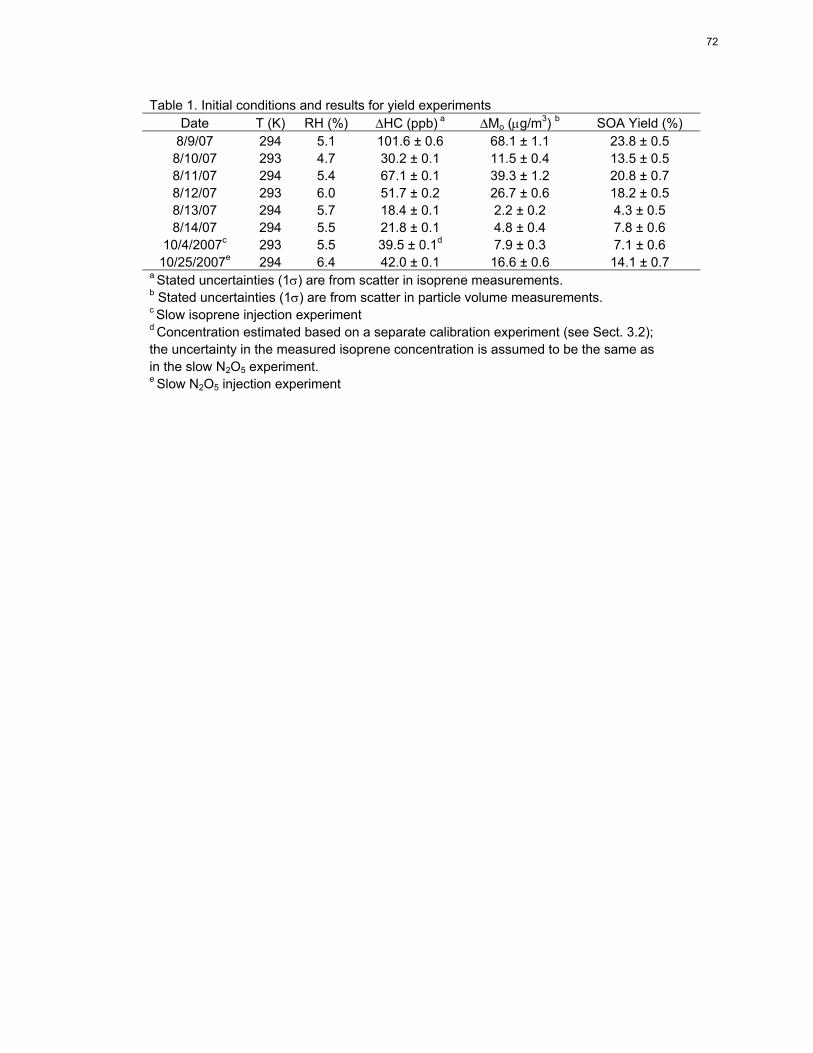
a Stated uncertainties (1) are from scatter in isoprene measurements. b Stated uncertainties (1) are from scatter in particle volume measurements. c Slow isoprene injection experiment d Concentration estimated based on a separate calibration experiment (see Sect. 3.2); the uncertainty in the measured isoprene concentration is assumed to be the same as in the slow N2O5 experiment. e Slow N2O5 injection experiment
72
Tab
le 2
. S
OA
pro
duct
s id
entif
ied
usin
g U
PLC
/(−
)ES
I-T
OF
MS
.
Ret
entio
n T
ime
(min
)
Mea
sure
d [M
− H
]−
Ion
(m/z
)
TO
FM
S
Sug
gest
ed
[M −
H]−
Ion
For
mul
a
Err
or
(mD
a,
ppm
)
Mea
sure
d
[M
− H
+ C
2H4O
2]−
Ion
(m/z
)
TO
FM
S
Sug
gest
ed
[M −
H +
C
2H4O
2]− Io
n F
orm
ula
Err
or
(mD
a,
ppm
) P
ropo
sed
Str
uctu
rea
3.68
b 19
4.03
10
C5H
8NO
7−
0.9,
4.6
c
4.52
b 23
9.01
37
C5H
7N2O
9−
-1.5
, -6.
3
5.09
d 30
4.99
46
C5H
9N2O
11S−
1.9,
6.2
5.24
b 23
9.01
52
C5H
7N2O
9−
0.0,
0.0
5.43
d 30
4.99
44
C5H
9N2O
11S−
1.7,
5.6
HO
ON
O2O
H
O
HO H
O
ON
O2O
H
O
O2N
O HO
O2N
O
ON
O2O
SO
3H
HO
ON
O2O
H
O
O2N
O HO
O2N
O
ON
O2O
SO
3H
73
6.07
22
5.03
50
C5H
9N2O
8−
-0.9
, -4.
0
6.12
22
5.03
42
C5H
9N2O
8−
-1.7
, -7.
6
6.60
22
5.03
75
C5H
9N2O
8−
1.6,
7.1
28
5.06
76
C7H
13N
2O10−
0.6,
2.1
7.75
d 34
9.97
75
C5H
8N3O
13S−
-0.3
, -0.
9
7.85
d 34
9.97
64
C5H
8N3O
13S−
0.2,
0.6
8.00
d 34
9.97
84
C5H
8N3O
13S−
-0.4
, -1.
1
HO
O2N
O
ON
O2O
H
HO
O2N
O
ON
O2O
H
HO
O2N
O
ON
O2O
H
ON
O2O
SO
3H
O2N
O
ON
O2
ON
O2O
SO
3H
O2N
O
ON
O2
ON
O2O
SO
3H
O2N
O
ON
O2
74
8.48
d 46
6.02
68
C10
H16
N3O
16S−
1.7,
3.6
8.54
d 46
6.02
64
C10
H16
N3O
16S−
1.3,
2.8
8.72
d 46
6.02
37
C10
H16
N3O
16S−
-1.4
, -3.
0
8.76
e 27
0.01
99
C5H
8N3O
10−
-1.1
, -4.
1 33
0.03
93
C7H
12N
3O12−
-2.8
, -8.
5
8.81
d 46
6.02
37
C10
H16
N3O
16S−
-1.4
, -3.
0
8.85
e 27
0.02
04
C5H
8N3O
10−
-0.6
, -2.
2 33
0.03
79
C7H
12N
3O12−
-4.2
, -12
.7
O2N
O
OO
ON
O2
O
ON
O2
HO
3SO
OO
2NO
OO
ON
O2
HO
3SO
ON
O2
O2N
O
OO
ON
O2
O
ON
O2
HO
3SO
ON
O2O
H
O2N
O
ON
O2
O2N
O
OO
ON
O2
O
ON
O2
HO
3SO
ON
O2O
H
O2N
O
ON
O2
75
9.15
37
0.07
34
C10
H16
N3O
12−
0.9,
2.4
43
0.09
40
C12
H20
N3O
14−
-0.5
, -1.
2
9.19
38
6.06
78
C10
H16
N3O
13−
-0.5
, -1.
3 44
6.08
88
C12
H20
N3O
15−
-0.6
, -1.
3
9.24
37
0.07
32
C10
H16
N3O
12−
-0.2
, -0.
5 43
0.09
37
C12
H20
N3O
14−
-0.8
, -1.
9
9.25
38
6.06
83
C10
H16
N3O
13−
-0.2
, -0.
5 44
6.08
93
C12
H20
N3O
15−
-0.1
, -0.
2
9.37
44
9.06
37
C10
H17
N4O
16−
-0.3
, -0.
7 50
9.08
54
C12
H21
N4O
18−
0.3,
0.6
O2N
O
OO
ON
O2
OH
ON
O2
O2N
O
OO
ON
O2
O
HO
ON
O2
O2N
OO
NO
2
ON
O2O
HO
O
O2N
O
OO
ON
O2
O
HO
ON
O2
O2N
OO
NO
2 OH
O2N
O
OO
HO
ON
O2
76
9.41
38
6.06
84
C10
H16
N3O
13−
0.1,
0.3
44
6.09
03
C12
H20
N3O
15−
0.9,
2.0
9.45
44
9.06
53
C10
H17
N4O
16−
1.3,
2.9
50
9.08
53
C12
H21
N4O
18−
0.2,
0.4
9.90
f 49
4.05
37
C10
H16
N5O
18−
4.7,
9.5
55
4.06
69
C12
H20
N5O
20−
-3
.3, -
6.0
9.98
f 49
4.05
18
C10
H16
N5O
18−
2.8,
5.7
55
4.06
76
C12
H20
N5O
20−
-2
.6, -
4.7
a
Str
uctu
ral i
som
ers
cont
aini
ng n
itrat
e, s
ulfa
te, o
r hy
roxy
l gro
ups
at o
ther
pos
ition
s ar
e lik
ely;
for
sim
plic
ity, o
nly
one
isom
er
is s
how
n.
b T
hese
com
poun
ds a
ppea
r to
be
very
min
or S
OA
pro
duct
s du
e to
ver
y sm
all c
hrom
atog
raph
ic p
eak
area
s, c
onfir
min
g th
at th
e fu
rthe
r ox
idat
ion
of
the
nitr
ooxy
carb
onyl
and
hyd
roxy
carb
onyl
firs
t-ge
nera
tion
gas-
pha
se p
rodu
cts
do n
ot y
ield
sig
nific
ant q
uant
ities
of S
OA
. c A
bla
nk c
ell i
ndic
ates
that
the
dete
cted
SO
A p
rodu
ct h
ad n
o ob
erva
ble
acet
ic a
cid
addu
ct io
n (i.
e. [M
− H
+ C
2H4O
2]−).
d T
hese
org
anos
ulfa
te S
OA
pro
duct
s w
ere
obse
rved
onl
y in
exp
erim
ents
em
ploy
ing
eith
er (
NH
4)2S
O4
(i.e.
neu
tral
) or
MgS
O4
+ H
2SO
4 (i.
e. a
cidi
c)
see
d ae
roso
l. T
hese
org
anos
ulfa
te S
OA
pro
duct
s w
ere
als
o ob
serv
ed in
the
exce
ss is
opre
ne e
xper
imen
ts.
e In a
dditi
on to
the
acet
ic a
cid
addu
ct io
n, th
ese
com
poun
ds a
lso
had
a si
gnifi
cant
add
uct i
on a
t [M
− H
+ H
NO
3]− (
m/z
333
), in
dica
ting
th
at th
ese
com
poun
ds a
re li
kely
not
ver
y st
able
due
to th
e fr
agm
enta
tion
of o
ne o
f the
NO
3 gr
oups
dur
ing
the
MS
ana
lysi
s.
f T
hese
com
poun
ds w
ere
only
wea
kly
dete
cted
in th
e ex
cess
isop
rene
exp
erim
ents
.
O2N
O
OO
ON
O2
O
HO
ON
O2
O2N
OO
NO
2 OH
O2N
O
OO
HO
ON
O2 O
O
ON
O2
O2N
O
OH
O2N
O
O2N
OO
NO
2 OO
ON
O2
O2N
O
OH
O2N
O
O2N
OO
NO
2
77
Tab
le 3
. P
erox
ide
cont
ent o
f SO
A fo
rmed
by
NO
3 ox
idat
ion
of is
opre
ne.
Exp
erim
ent
Dat
e S
eede
da / N
ucle
atio
n [Is
opre
ne]
(ppb
) [N
2O5]
(p
pm)
SO
A V
olum
e G
row
th
Obs
erve
db (
m3 /c
m3 )
Tot
al S
OA
M
ass
Con
cent
ratio
nc
(g/
m3 )
Per
oxid
e A
eros
ol M
ass
Con
cent
ratio
n
(g/
m3 )
Con
triu
btio
n of
Per
oxid
es
to th
e S
OA
M
ass
Con
cent
ratio
n O
bser
ved
(%)
8/22
/07
AS
20
0 1
102
145
46
32
8/30
/07
AM
S
200
1 12
3 17
4 40
23
10
/22/
07d
AS
12
00
0.7
70
100
b.d.
l.e f
10/2
3/07
nu
clea
tion
200
1 12
5 17
7 31
17
10
/24/
07
AS
20
0 1
111
158
47
30
10/2
7/07
g A
S
300
1 11
0 15
6 47
30
a A
S =
am
mon
ium
sul
fate
see
d, A
MS
= a
cidi
fied
mag
nesi
um s
ulfa
te s
eed.
b A
vera
ged
over
the
cour
se o
f filt
er s
ampl
ing.
c A
ssum
ing
a S
OA
den
sity
of 1
.42
g/cm
3 . T
his
was
bas
ed o
n D
MA
and
Q-A
MS
mea
sure
men
ts.
d E
xces
s is
opre
ne e
xper
imen
t.
e B
elow
det
ectio
n lim
its.
f No
obse
rvab
le c
ontr
ibut
ion
of o
rgan
ic p
erox
ides
to th
e S
OA
mas
s co
ncen
trat
ion.
g S
low
inje
ctio
n of
isop
rene
in th
is e
xper
imen
t to
enha
nce
the
RO
2 +
NO
3 re
actio
n pa
thw
ay.
78
Tab
le 4
. Glo
bal e
stim
atio
n of
isop
rene
usi
ng G
EO
S-C
hem
E
mis
sion
Mod
el
GE
IAa
ME
GA
Nb
Is
opre
ne e
mis
sion
(T
g/y)
50
7 38
9
Glo
bal i
sopr
ene
burd
en (
Tg)
1.
7 1.
7
Isop
rene
life
time
(day
s)
1.2
1.6
Is
opre
ne r
eact
ed (
Tg/
y) b
y
Isop
rene
+ O
H
407
304
Is
opre
ne +
O3
69
62
Is
opre
ne +
NO
3 29
21
a M
odifi
catio
n of
GE
IA fo
r G
EO
S-C
hem
are
des
crib
ed a
t Bey
et a
l. (2
001c
).
Orig
inal
GE
IA r
efer
ence
is G
uent
her
et a
l. (1
995)
.
b G
uent
her
et a
l. (2
006)
79
Figure 1.
3.5
3.0
2.5
2.0
1.5
1.0
0.5
0.0
Mass conc. (μg/m
3)
200150100500Time (min)
2.5
2.0
1.5
1.0
0.5Vol
ume
conc
. (μ
m3 /c
m3 )
PILS_nitrate AMS_nitrate DMA_volume
80
Alan Kwan
Typewritten Text
Alan Kwan
Text Box
Figure 2.1. Time profiles of aerosol volume, inorganic nitrate measured by PILS/IC, and nitrate signals from Q-AMS in a blank experiment (~1 ppm N2O5, ammonium sulfate seed, no isoprene).
Alan Kwan
Text Box
Figure 2.
200
150
100
50
0
ΔMo (μg/m
3)
100806040200Time (min)
250
200
150
100
50
0
Isop
rene
mix
ing
ratio
(ppb
)
SOA Isoprene mixing ratio
81
Alan Kwan
Text Box
Figure 2.2. Isoprene depletion and SOA formation for typical experiment. Initial isoprene is 203.4 ppb (573 mg/m3).
Alan Kwan
Text Box
Figure 3.
0.25
0.20
0.15
0.10
0.05
0.00
Yie
ld
806040200Mo (μg/m3)
Typical yield experiment Yield curve
Slow isoprene injection Slow N2O5 injection
82
Alan Kwan
Text Box
Figure 2.3. SOA yield data and yield curve for isoprene-NO3 reaction. Also shown are SOA yields from the slow N2O5 injection experiment and slow isoprene injection experiment.
Alan Kwan
Text Box
Figure 4.
20
15
10
5
0
ΔM
o (μ
g/m
3 )
120100806040200ΔHC (μg/m3)
Slow isoprene injection Slow N2O5 injection
83
Alan Kwan
Text Box
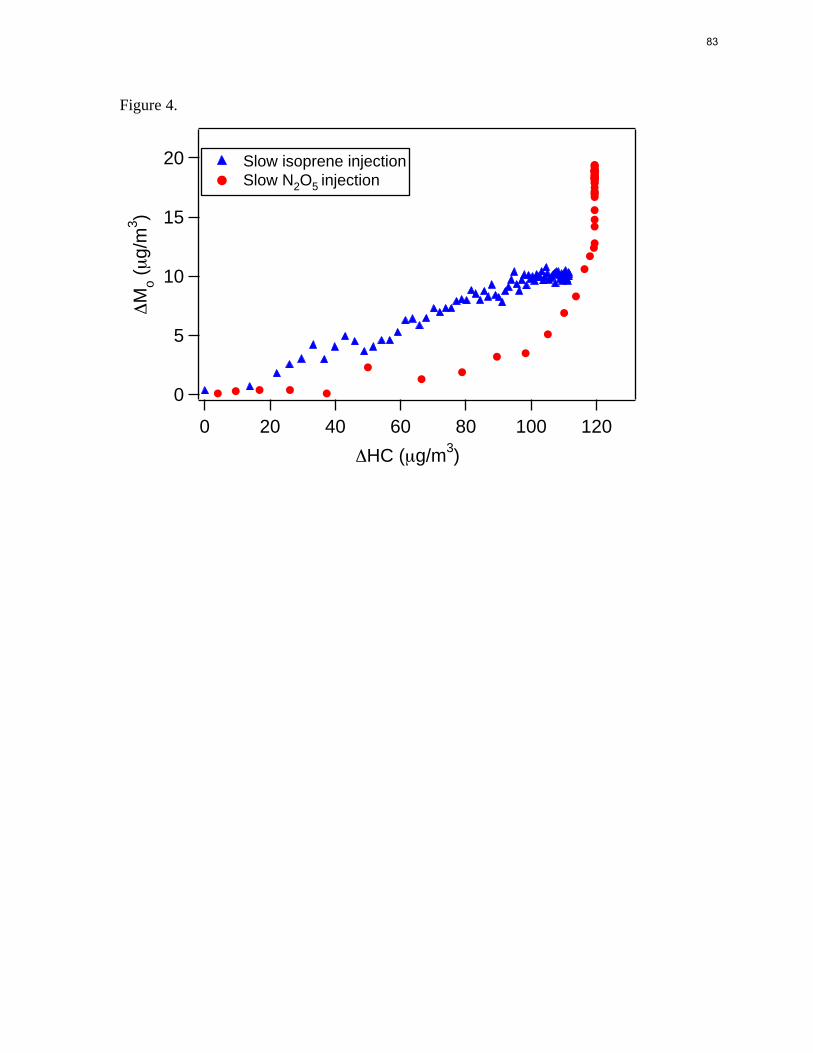
Figure 2.4. Time-dependent growth curves for the slow N2O5 injection experiment and slow isoprene injection experiment (last two experiments in Table 1).
Figure 2.5. Time profiles of the major gas-phase products (m/z 230, 232, and 248) and the corresponding aerosol growth from the excess isoprene experiment.
Alan Kwan
Text Box
Figure 6.
2.5
2.0
1.5
1.0
0.5
0.0Gas
-pha
se c
once
ntra
tion
(ppb
)
2422201816141210
Real time (hrs)
100
80
60
40
20
0
Gas
-pha
se c
once
ntra
tion
(ppb
)
2422201816141210
200
150
100
50
0
Isop
rene
con
cent
ratio
n (p
pb)
2422201816141210
140
120
100
80
60
40
20
0
ΔMo (μg/m
3)
SOAIsoprene
��� 230
��� 232
��� 248
��� 393
��� 377
��� 185
85
Alan Kwan
Text Box
Figure 2.6. Time evolution of various gas-phase products in the staggered N2O5 injection experiment (Isoprene is first injected into the chamber, followed by the addition of 3 pulses of N2O5: ~120, 50, and 210 ppb). The top panel shows the isoprene decay and aerosol formation; the middle panel shows the time profiles of the three major first-generation products (m/z 230, 232, and 248); the bottom panel shows the time profiles of three minor products (m/z 185, 377, and 393). (The likely identities for these products are shown in Fig. 11.)
Alan Kwan
Text Box
Figure 7.
0.0001
0.001
0.01
0.1
Sig
nal F
ract
ion
150140130120110100908070605040302010m/z
m/z 30 m/z 43m/z 46
86
Alan Kwan
Text Box
Figure 2.7. A typical AMS spectrum for SOA formed in typical yield experiments.
Alan Kwan
Text Box
Figure 8.
10-6
10-5
10-4
10-3
10-2
10-1S
igna
l fra
ctio
n (s
low
N2O
5 in
ject
ion
expe
rimen
t)
10-6 10-5 10-4 10-3 10-2 10-1
Signal fraction (typical yield experiment)
121314
15
16
17
18
1920
24
25
2627
2930
3132
3738
4142
43
44
45
46
4748
49
505152
53
54
55
565758
596061
62
63
6465
66
676869 7071
7273
74
75
76
77
78
79
80
81
8283
84858687
8889
90
91
929394
9596
97
9899100101
102103
104105
106
107108109
110111
112
113
114
115
116117118119
120
121122123124
125
126
127128
129130
131
132
133134
135
136
137139
140
141
142143
144145
146
147148150151
152153
154
155
156157
158159160161
162
163
165
167
168
169
170
171172
173 174175176177
179180181187189 190
191192
193194
195
196
197199
200201202
203
204207208
209
211213214215
216220
222
223224225226229
230231
232233234236
237
239
240244247
248
250251252253 254256
257260262
269272274275276
280
283289296297
300
250
200
150
100
50
0
m/z
87
Alan Kwan
Text Box
Figure 2.8. AMS spectra signal from the slow N2O5 injection experiment versus a typical yield experiment. Each mass fragment is normalized by the total signal. The solid red line is the 1:1 line. Note that the higher masses (m/z > 165) are dominated by noise.
Alan Kwan
Text Box
Figure 9.
10-6
10-5
10-4
10-3
10-2
10-1
Sig
nal f
ract
ion
(slo
w is
opre
ne in
ject
ion
expe
rimen
t)
10-6 10-5 10-4 10-3 10-2 10-1
Signal fraction (typical yield experiment)
121314
15
16
17
18
1920
24
25
2627
2930
3132
373841
42
43
44
45
46
4748
49
505152
53
54
55
565758
596061
62
63
6465
66
676869
7071
727374
75
76
77
78
79
80
81
82
838485
8687
8889
90
91
929394
9596
979899100101
102103104105106107
108109110111
112
113
114
115
116117118119
120
121122123124
125126 127
128
129
130131
132
133134
135
136
137139140
141
142
143144145
146
147148
151
152 153154
155156
157
158
159
160
162
165
167
168
169171
172
174175
177187
195
196
197
200201202
207208
214231243
264269
283294296
300
250
200
150
100
50
0
m/z
88
Alan Kwan
Text Box
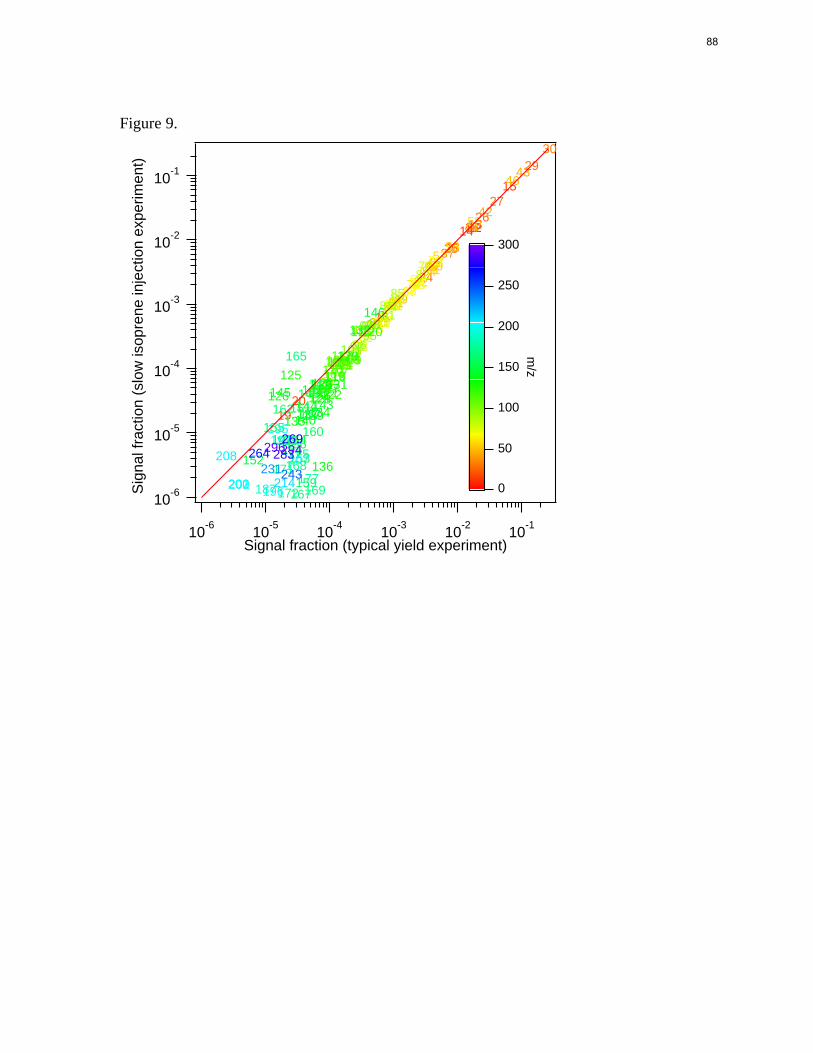
Figure 2.9. AMS spectra signal from the slow isoprene injection experiment versus a typical yield experiment. Each mass fragment is normalized by the total signal. The solid red line is the 1:1 line.
Alan Kwan
Text Box
10
98
76
50
14
23
Tim
e (m
in)
Relative Abundance
0
100 0
100 0
100 0
100
Fig
ure
10.
97 97 97
9721
5
305
305
305
305
305
305
305
305
285
285
285
285
350
350
350
350
350
350
33333
3
333
333
33333
3
466
466
466
466
370
446
44644
6
430
430
430
554
509
449
449
449 44
926
0
(a)
Typ
ical
Exp
erim
ent
(b
) S
low
Isop
rene
Inje
ctio
n E
xper
imen
t
(c)
Exc
ess
Isop
rene
Exp
erim
ent
(d
) Aci
d S
eed
Exp
erim
ent
285
285
330
446
449
285 28
5
430
554
285
446
554
449
430
333
430
350
89
Alan Kwan
Text Box
Figure 2.10. UPLC/(-)ESI-TOFMS base peak ion chromatograms (BPCs) for the following isoprene-NO3 oxidation experiments: (a) 200 ppb isoprene + 1 ppm N2O5 + seed aerosol generated from 15 mM (NH4)2SO4 atomizing solution; (b) 300 ppb isoprene + 1 ppm N2O5 + seed aerosol generated from 15 mM (NH4)2SO4 atomizing solution; (c) 1.2 ppm isoprene + 700 ppb N2O5 + seed aerosol generated from 15 mM (NH4)2SO4 atomizing solution; (d) 200 ppb isoprene + 1 ppm N2O5 + seed aerosol generated from 30 mM MgSO4 + 50 mM H2SO4 atomizing solution. The numbers indicated above the selected chromatographic peaks correspond to the most abundant negative ion, and is either the [M - H]- or [M - H + C2H4O2]- ions.
Alan Kwan
Text Box
O2N
O
O2
O2N
O
O
C5-
nitr
oxyh
ydro
pero
xideNO
3
O2
O2N
O
OO
H
C5-
nitr
oxyc
arbo
nyl
HO
2
RO
2
O2N
O
OH
C5-
hydr
oxyn
itrat
e
O2N
O
O2
RO
2N
O3
Or
O2N
O
O
RO
2
CIM
S m
/z 2
30C
IMS
m/z
232
CIM
S m
/z 2
48
O2N
O
OH
Isom
eriz
atio
n-
NO
2
OH
O C5-
hydr
oxyc
arbo
nyl
CIM
S m
/z 1
85O
2
O2N
O
OH
O2
RO
2'
[RO
2']
O2N
O
OO
ON
O2
CIM
S m
/z 3
77
- N
O2
Dec
ompo
sitio
n
O
2-m
ethy
l-2-v
inyl
-oxi
rane
O
O2
ON
O2
RO
2'O
2NO
OO
CIM
S m
/z 3
93
O
ON
O2
RO
2'
Dec
ompo
sitio
n
O2N
O
OO
CIM
S m
/z 3
93ON
O2
OH
NO
3
O2
Fra
gmen
tatio
n
Fig
ure
11.
90
Alan Kwan
Text Box
Figure 2.11. Proposed mechanisms for the formation of various gas-phase intermediate product ions observed by CIMS. Multiple structural isomers are possible. In this figure, RO2' refers to the isoprene peroxy radical (nitrooxyperoxy radical), RO2 refer to a generic peroxy radical. The numbers in the parentheses refer to the molar yields of the products. It is noted that the sensitivity for m/z 393 is not calculated, instead it is assumed that the sum of the molar yields of the two isomers shown to be the same as that for m/z 377 (i.e. 0.01).
Alan Kwan
Text Box
Figure 12.
100
80
60
40
20
0Gas
-pha
se c
once
ntra
tion
(ppb
)
222018161412 Real Time (hrs)
120
100
80
60
40
20
0
ΔMo (μg/m
3)
��� 230
��� 248
��� 232
SOA
91
Alan Kwan
Text Box
Figure 2.12. Time profiles of the major gas-phase products (m/z 230, 232, and 248) and the corresponding aerosol growth from the slow N2O5 injection experiment. Note that this experiment has a higher initial isoprene concentration (~200 ppb) compared to the one shown in Figure 2.4.
Alan Kwan
Text Box
Figure 13.
40
30
20
10
0
Gas
-pha
se c
once
ntra
tion
(ppb
)
222018161412 Real Time (hrs)
60
50
40
30
20
10
0
ΔMo (μg/m
3)
��� 230
��� 248
��� 232
SOA
92
Alan Kwan
Text Box
Figure 2.13. Time profiles of the major gas-phase products (m/z 230, 232, and 248) and the corresponding aerosol growth from the slow isoprene injection experiment. Note that this experiment has a higher initial isoprene concentration (~200 ppb) compared to the one shown in Figure 2.4.
Alan Kwan
Text Box
NO
3
O2
ON
O2
OH
C5-
hydr
oxyn
itrat
ea
CIM
S m/z
232
RO
2
HO
OH
H2S
O4
H
ON
OO
SO
3H
MW
= 3
06c
C5H
10N
2O11
S
NO
3 / O
2
RO
2
OH
O2
NO
3
NO
3O
2
OH
MW
= 2
71b
C5H
9N3O
10
H2S
O4
- H2O O
SO
3H
MW
= 3
51c
C5H
9N3O
13S
OH
OO
MW
= 3
71b
C10
H17
N3O
12
NO
3 / O
2
RO
2O
H
OO
MW
= 4
50C
10H
18N
4O16
HO
b
RO
2'[RO
2'' ]
[RO
2' ]
RO
2''
HO
OH
OO
MW
= 4
50b
C10
H18
N4O
16
MW
= 2
26b
C5H
10N
2O8
- H2O
Fig
ure
14.
O2
ON
O2
ON
O2
ON
O2
ON
O2
ON
O2
ON
O2
ON
O2
ON
O2
ON
O2
ON
O2
ON
O2
ON
O2
ON
O2
2O
NO
2O
NO
2O
NO
2O
NO
2O
NO
2O
NO
2O
NO
2O
NO
2O
NO
2O N
O2
O
93
Alan Kwan
Text Box
Figure 2.14. Proposed mechanism for SOA formation from the formation and decay of the C5-hydroxynitrate gas-phase product formed from the isoprene + NO3 reaction. Boxes indicate UPLC/(-)ESI-TOFMS detected SOA products; molecular formulas were confirmed by the accurate mass data provided by the UPLC/(-)ESI-TOFMS. Multiple structural isomers are possible, consistent with the multiple chromatographic peaks observed in the extracted ion chromatograms; however, only one structural isomer is shown for simplicity. a This first-generation gas-phase product was previously observed by Jay and Stieglitz (1989), Skov et al. (1992), Kwok et al. (1996), and Berndt and Böge (1997); this gas-phase product was detected as the [M + CF3O]- ion by the CIMS instrument. b These particle-phase compounds were detected as both their [M - H]- and [M - H + C2H4O2]- ions; the acetic acid adduct ([M - H + C2H4O2]-) ion was, in most cases, the molecular ion (i.e. dominant ion). c These organosulfate compounds were detected as their [M - H]- ions and were observed only in ammonium sulfate and acidified magnesium sulfate seeded experiments.
Alan Kwan
Text Box
NO
3
O2
N
O2
[RO
2' ]
OO
C
IMS
m/z
377a
OO
OH
MW
= 3
71b
C10
H17
N3O
12
RO
2'
NO
3 / O
2R
O2
NO
3 / O
2
RO
2
OO
OH
MW
= 4
50b
C10
H18
N4O
16
HO
Fig
ure
15.
O2
ON
O2
ON
O2
O NO
2O
NO
2O
NO
2O
NO
2O
NO
2O
NO
2O
NO
2O
94
Alan Kwan
Text Box
Figure 2.15. Proposed mechanism for SOA formation from the formation and decay of the CIMS m/z 377 gas-phase product formed from the isoprene + NO3 reaction. Boxes indicate UPLC/(-)ESI-TOFMS detected SOA products; molecular formulas were confirmed by the accurate mass data provided by the UPLC/(-)ESI-TOFMS. Multiple structural isomers are possible, consistent with the multiple chromatographic peaks observed in the extracted ion chromatograms; however, only one structural isomer is shown for simplicity. a This first-generation gas-phase product was detected as the [M + CF3O]- ion by the CIMS instrument. b These particle-phase compounds were detected as both their [M - H]- and [M - H + C2H4O2]- ions; the acetic acid adduct ([M - H + C2H4O2]-) ion was, in most cases, the molecular ion (i.e. dominant ion).
Alan Kwan
Text Box
O2N
O
O2
NO
3
O2
O2N
O
O2
RO
2N
O3
Or
O2N
O
O
Isom
eriz
atio
n
O2
O2N
O
OH
O2
RO
2'
[RO
2']
- N
O2
Dec
ompo
sitio
n
O
2-m
ethy
l-2-v
inyl
-oxi
rane
a
O
O2
ON
O2
RO
2'O
2NO
OO
CIM
S m
/z 3
93b
O
ON
O2
O2N
O
OO
ON
O2
OH
NO
3
O2
Fig
ure
16.
O2N
O
OO
ON
O2
OH
ON
O2
HO
MW
= 3
87c
C10
H17
N3O
13
O2N
O
OO
O
ON
O2
ON
O2
HO
MW
= 3
87c
C10
H17
N3O
13
RO
2N
O3/
O2
H2S
O4
-H2O
MW
= 4
67c
C10
H17
N3O
16S
O2N
O
OO
O
ON
O2
ON
O2
HO
3SO
H2S
O4
-H2O
O2N
O
OO
ON
O2
OH
ON
O2
HO
3SO
NO
3/O
2
RO
2
MW
= 4
67c
C10
H17
N3O
16S
CIM
S m
/z 3
93b
95
Alan Kwan
Text Box
96
Alan Kwan
Text Box
Figure 2.16. Proposed mechanism for SOA formation from the formation and decay of the CIMS m/z 393 gas-phase product formed from the isoprene + NO3 reaction. Boxes indicate UPLC/(-)ESI-TOFMS detected SOA products; molecular formulas were confirmed by the accurate mass data provided by the UPLC/(-)ESI-TOFMS. Multiple structural isomers are possible, consistent with the multiple chromatographic peaks observed in the extracted ion chromatograms; however, only one structural isomer is shown for simplicity. a This first-generation gas-phase product was detected as the [M + H]+ ion by the CIMS instrument; this gas-phase product was previously observed by Berndt and Bšge (1997) and could also be 2-(1-methyl-vinyl)oxirane. b This gas-phase product was detected as the [M + CF3O]- ion. c These particle-phase compounds were detected as both their [M - H]- and [M - H + C2H4O2]- ions; the acetic acid adduct ([M - H + C2H4O2]-) ion was, in most cases, the molecular ion (i.e. dominant ion). d This organosulfate compound was detected as its [M - H]- ion and was observed only in the ammonium sulfate and acidified magnesium sulfate seeded experiments.
O2
ON
O
NO
3
O2
RO
2N
O3
/ O2
RO
2
ox.
MW
= 2
40b
C5H
8N2O
9
or N
O3
/ O2
HO
O
NO
3
O2
HO
HO
OH
O
HO
O
OH
MW
= 1
95b
C5H
9NO
7
HO
OH
OO
OH
NO
3 / O
2
RO
2
ox.
C5-
nitr
ooxy
carb
onyl
a
C5-
hydr
oxyc
arbo
nyla
[RO
2' ]
O2
C5-
dini
trat
ec
NO
3
O2
O2
MW
= 4
95d
C10
H17
N5O
18
NO
3N
O3
O2
OO
NO
3 / O
2R
O2
OO
OH
RO
2'
Fig
ure
17.
CIM
S m
/z 2
30
C
IMS
m/z
185
C
IMS
m/z
277
2O
ON 2
OO
N 2O
ON 2
O
ON
2O
ON
2O
ON
2O
ON
2O
ON
2O
ON
2O
ON
2O
ON
2O
ON
2O
ON
2O
ON
2O
ON 2
OO
N 2O
ON 2
OO
N 2O
ON 2
O ON 2
OO
N 2O
ON 2
O
97
Alan Kwan
Text Box
Figure 2.17. Proposed mechanism for SOA formation from the formation and decay of the C5-nitrooxycarbonyl, C5-hydroxycarbonyl, and C5-dinitrate first-generation products formed from the isoprene + NO3 reaction. Boxes indicate UPLC/(-)ESI-TOFMS detected SOA products; molecular formulas were confirmed by the accurate mass data provided by the UPLC/(-)ESI-TOFMS. Multiple structural isomers are possible, consistent with the multiple chromatographic peaks observed in the extracted ion chromatograms; however, only one structural isomer is shown for simplicity. a These first-generation gas-phase products were previously observed by Skov et al. (1994) and Kwok et al. (1996); these gas-phase products were detected as the [M + CF3O]- ion by the CIMS instrument. b These are minor SOA products, confirming that the further oxidation of the C5-nitrooxycarbonyl and C5-hydroxycarbonyl first-generation products do not yield significant amounts of SOA. c This first-generation gas-phase product was previously observed by Werner et al. (1999); this gas-phase product was also detected as the [M + CF3O-]- ion by the CIMS instrument. d This particle-phase compound was detected as both its [M - H]- and [M - H + C2H4O2]- ions; the acetic acid adduct ([M - H + C2H4O2]-) ion was the molecular ion (i.e. dominant ion).