Technical Report Documentation Page 1. Report No. FHWA/TX-09/0-5824-1 2. Government Accession No. 3. Recipient’s Catalog No. 4. Title and Subtitle Improved Correlation between Texas Cone Penetrometer Blow Count and Undrained Shear Strength of Soft Clays 5. Report Date August 2008; Revised January 2009 6. Performing Organization Code 7. Author(s) Scott M. Garfield, David A. Varathungarajan, Stephen G. Wright 8. Performing Organization Report No. 0-5824-1 9. Performing Organization Name and Address Center for Transportation Research The University of Texas at Austin 3208 Red River, Suite 200 Austin, TX 78705-2650 10. Work Unit No. (TRAIS) 11. Contract or Grant No. 0-5824 12. Sponsoring Agency Name and Address Texas Department of Transportation Research and Technology Implementation Office P.O. Box 5080 Austin, TX 78763-5080 13. Type of Report and Period Covered Technical Report September 1, 2006–August 31, 2008 14. Sponsoring Agency Code 15. Supplementary Notes Project performed in cooperation with the Texas Department of Transportation and the Federal Highway Administration. 16. Abstract The objective of this project was to develop an improved correlation between Texas Cone Penetrometer (TCP) blow count and undrained shear strength for soft, clay soils in the upper approximately 30 feet of the ground. Subsurface explorations were carried out by Tolunay-Wong Engineers, Inc. (TWEI) at six sites in the Texas Gulf Coast region where soft soils were expected to exist to obtain the data necessary to establish the improved correlation. A series of borings was made at each site with TCP tests, conventional (“Dutch”) piezocone penetration tests, thin-walled tube sampling, and vane shear tests. Laboratory testing was subsequently performed at The University of Texas at Austin on the thin-walled tube samples obtained in the field. The results of these field and laboratory tests were used to develop average, lower- and upper-bound undrained shear strength profiles for each of the sites (Varathungarajan, 2008). The data were used to evaluate existing correlations between TCP blow count and undrained shear strength as well as to establish an improved correlation. The following improved correlation was proposed: ݏ௨ ൌ 300 60 where s u is undrained shear strength in lbs. per square foot (psf) and N is the TCP blow count. To evaluate the improved correlation, bearing capacity analyses were performed using the computer software UTEXAS4 (Wright, 1999) to compute factors of safety for undrained strength profiles developed using the improved correlation as well as for the undrained strength profiles developed by Varathungarajan (2008). Factors of safety computed using undrained shear strengths based on the improved correlation generally showed good agreement with the factors of safety determined using the strength profiles developed by Varathungarajan (2008). The improved correlation is recommended over the existing correlations and is intended primarily for soft, shallow (less than 30 feet) clays with undrained shear strengths of 1200 psf (approximately 0.47 atmospheres) or less (TCP blow counts of 15 or less). Accordingly, this correlation should be used cautiously. Significant benefits can also be realized by performing more extensive field and laboratory testing, rather than relying on simple, approximate TCP correlations. 17. Key Words soil shear strength, soft clay, geotechnical engineering, penetration tests 18. Distribution Statement No restrictions. This document is available to the public through the National Technical Information Service, Springfield, Virginia 22161; www.ntis.gov. 19. Security Classif. (of report) Unclassified 20. Security Classif. (of this page) Unclassified 21. No. of pages 140 22. Price Form DOT F 1700.7 (8-72) Reproduction of completed page authorized
Transcript
Technical Report Documentation Page 1. Report No.
FHWA/TX-09/0-5824-1 2. Government Accession No.
3. Recipient’s Catalog No.
4. Title and Subtitle Improved Correlation between Texas Cone Penetrometer Blow Count and Undrained Shear Strength of Soft Clays
5. Report Date August 2008; Revised January 2009
6. Performing Organization Code 7. Author(s)
Scott M. Garfield, David A. Varathungarajan, Stephen G. Wright
8. Performing Organization Report No. 0-5824-1
9. Performing Organization Name and Address Center for Transportation Research The University of Texas at Austin 3208 Red River, Suite 200 Austin, TX 78705-2650
10. Work Unit No. (TRAIS) 11. Contract or Grant No.
0-5824
12. Sponsoring Agency Name and Address Texas Department of Transportation Research and Technology Implementation Office P.O. Box 5080 Austin, TX 78763-5080
13. Type of Report and Period Covered Technical Report September 1, 2006–August 31, 2008
14. Sponsoring Agency Code
15. Supplementary Notes Project performed in cooperation with the Texas Department of Transportation and the Federal Highway Administration.
16. Abstract The objective of this project was to develop an improved correlation between Texas Cone Penetrometer (TCP)
blow count and undrained shear strength for soft, clay soils in the upper approximately 30 feet of the ground. Subsurface explorations were carried out by Tolunay-Wong Engineers, Inc. (TWEI) at six sites in the Texas Gulf Coast region where soft soils were expected to exist to obtain the data necessary to establish the improved correlation. A series of borings was made at each site with TCP tests, conventional (“Dutch”) piezocone penetration tests, thin-walled tube sampling, and vane shear tests. Laboratory testing was subsequently performed at The University of Texas at Austin on the thin-walled tube samples obtained in the field. The results of these field and laboratory tests were used to develop average, lower- and upper-bound undrained shear strength profiles for each of the sites (Varathungarajan, 2008). The data were used to evaluate existing correlations between TCP blow count and undrained shear strength as well as to establish an improved correlation. The following improved correlation was proposed: 300 60
where su is undrained shear strength in lbs. per square foot (psf) and N is the TCP blow count. To evaluate the improved correlation, bearing capacity analyses were performed using the computer software
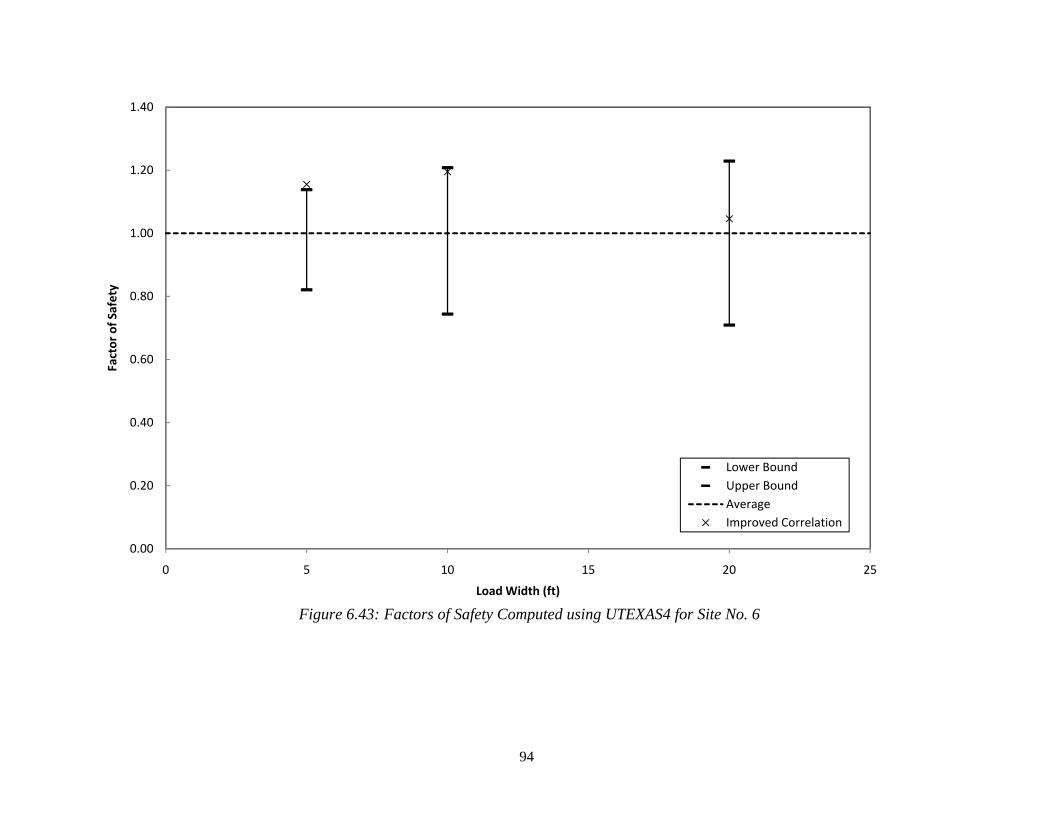
UTEXAS4 (Wright, 1999) to compute factors of safety for undrained strength profiles developed using the improved correlation as well as for the undrained strength profiles developed by Varathungarajan (2008). Factors of safety computed using undrained shear strengths based on the improved correlation generally showed good agreement with the factors of safety determined using the strength profiles developed by Varathungarajan (2008).
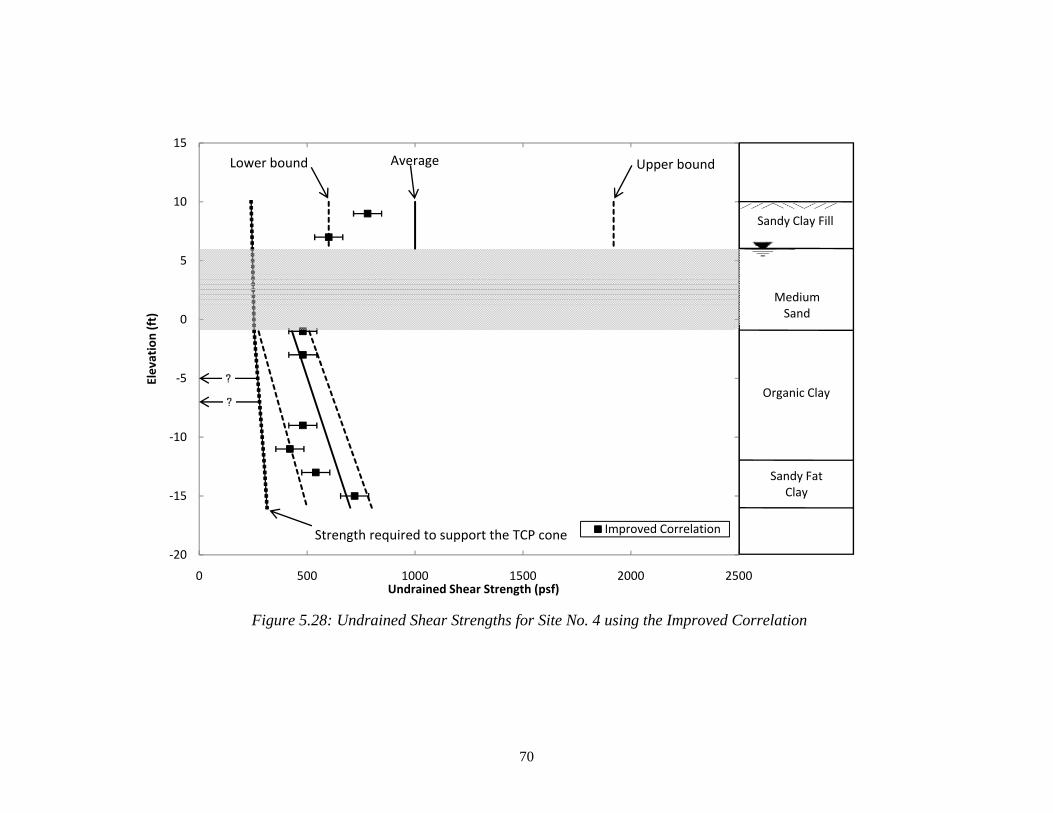
The improved correlation is recommended over the existing correlations and is intended primarily for soft, shallow (less than 30 feet) clays with undrained shear strengths of 1200 psf (approximately 0.47 atmospheres) or less (TCP blow counts of 15 or less). Accordingly, this correlation should be used cautiously. Significant benefits can also be realized by performing more extensive field and laboratory testing, rather than relying on simple, approximate TCP correlations.17. Key Words
18. Distribution Statement No restrictions. This document is available to the public through the National Technical Information Service, Springfield, Virginia 22161; www.ntis.gov.
19. Security Classif. (of report) Unclassified
20. Security Classif. (of this page) Unclassified
21. No. of pages 140
22. Price
Form DOT F 1700.7 (8-72) Reproduction of completed page authorized
Improved Correlation between Texas Cone Penetrometer Blow Count and Undrained Shear Strength of Soft Clays Scott M. Garfield David A. Varathungarajan Stephen G. Wright CTR Technical Report: 0-5824-1 Report Date: August 2008; Revised January 2009 Project: 0-5824 Project Title: Correlation of Shallow, Low Blow Count Texas Cone Penetrometer Values
and Shear Strength for Texas Soils Sponsoring Agency: Texas Department of Transportation Performing Agency: Center for Transportation Research at The University of Texas at Austin Project performed in cooperation with the Texas Department of Transportation and the Federal Highway Administration.
iv
Center for Transportation Research The University of Texas at Austin 3208 Red River Austin, TX 78705 www.utexas.edu/research/ctr Copyright (c) 2008 Center for Transportation Research The University of Texas at Austin All rights reserved Printed in the United States of America
v
Disclaimers Author's Disclaimer: The contents of this report reflect the views of the authors, who
are responsible for the facts and the accuracy of the data presented herein. The contents do not necessarily reflect the official view or policies of the Federal Highway Administration or the Texas Department of Transportation (TxDOT). This report does not constitute a standard, specification, or regulation.
Patent Disclaimer: There was no invention or discovery conceived or first actually reduced to practice in the course of or under this contract, including any art, method, process, machine manufacture, design or composition of matter, or any new useful improvement thereof, or any variety of plant, which is or may be patentable under the patent laws of the United States of America or any foreign country.
Engineering Disclaimer NOT INTENDED FOR CONSTRUCTION, BIDDING, OR PERMIT PURPOSES.
Research Supervisor: Stephen G. Wright
vi
Acknowledgments The authors wish to thank Dr. Robert B. Gilbert of the University of Texas for his review
and suggestions during the course of this work. We also wish to express our gratitude to Tolunay-Wong Engineers, Inc., including Art Stephens and John Hebert, for performing the field exploration and testing for this research. Their efforts were instrumental in the success of the project. Mr. Mark McClelland and Ms. Dina Dewane served as Program Coordinator and Project Director, respectively, for TxDOT. Their vision, support, and encouragement throughout the work are sincerely appreciated.
Chapter 2. Texas Cone Penetrometer (TCP) Test ..................................................................... 3 2.1 Apparatus and Procedure .......................................................................................................3 2.2 Minimum Strength Required to Support the Texas Cone Penetrometer (TCP) Cone ...........4 2.3 Example of Application .........................................................................................................6
Chapter 3. Correlation of the Texas Cone Penetrometer Blow Count and Undrained Shear Strength ............................................................................................................................... 9
3.1 Texas A&M University – Hamoudi et al. (1974), Research Report 10-1 .............................9 3.2 Texas A&M University – Duderstadt et al. (1977), Research Report 10-3F ......................11 3.3 University of Houston – Kim et al. ......................................................................................12 3.4 Summary ..............................................................................................................................13
Chapter 4. Overview of Subsurface Explorations ................................................................... 15 4.1 Site No. 1 – Port Arthur, TX (Site A) ..................................................................................15
Review of Published Literature ........................................................................................ 15 Field Exploration .............................................................................................................. 15 Laboratory Testing ............................................................................................................ 17 Stratigraphic Profile .......................................................................................................... 17
4.2 Site No. 2 – Port Arthur, TX (Site B) ..................................................................................19 Field Exploration .............................................................................................................. 19 Laboratory Testing ............................................................................................................ 22 Stratigraphic Profile .......................................................................................................... 22
4.3 Site No. 3 – Mont Belvieu, TX ............................................................................................24 Review of Published Literature ........................................................................................ 24 Field Exploration .............................................................................................................. 24 Laboratory Testing ............................................................................................................ 26 Stratigraphic Profile .......................................................................................................... 26
4.4 Site No. 4 – Beaumont, TX ..................................................................................................28 Review of Published Literature ........................................................................................ 28 Field Exploration .............................................................................................................. 28 Laboratory Testing ............................................................................................................ 30 Stratigraphic Profile .......................................................................................................... 30
4.5 Site No. 5 – Cameron Parish, LA (Site A) ...........................................................................33 Review of Published Literature ........................................................................................ 33 Field Exploration .............................................................................................................. 33 Laboratory Testing ............................................................................................................ 35 Stratigraphic Profile .......................................................................................................... 35
4.6 Site No. 6 – Cameron Parish, LA (Site B) ...........................................................................37 Field Exploration .............................................................................................................. 37 Laboratory Testing ............................................................................................................ 37 Stratigraphic Profile .......................................................................................................... 37
Chapter 5. Analysis of the Texas Cone Penetrometer Correlations ...................................... 41 5.1 Evaluation of Existing Correlations .....................................................................................41
Site No. 1 – Port Arthur, TX (Site A) ............................................................................... 41 Site No. 2 – Port Arthur, TX (Site B) ............................................................................... 44 Site No. 3 – Mont Belvieu, TX ......................................................................................... 47 Site No. 4 – Beaumont, TX ............................................................................................... 49 Site No. 5 – Cameron Parish, LA (Site A) ........................................................................ 52 Site No. 6 – Cameron Parish, LA (Site B) ........................................................................ 55
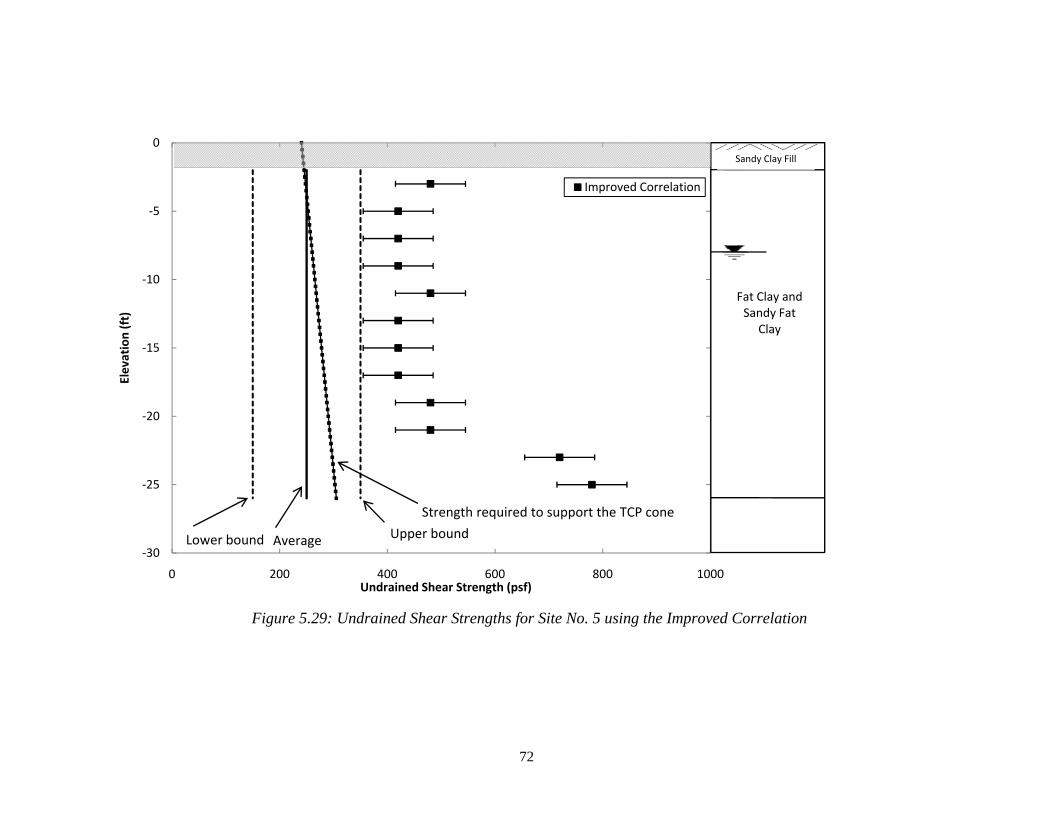
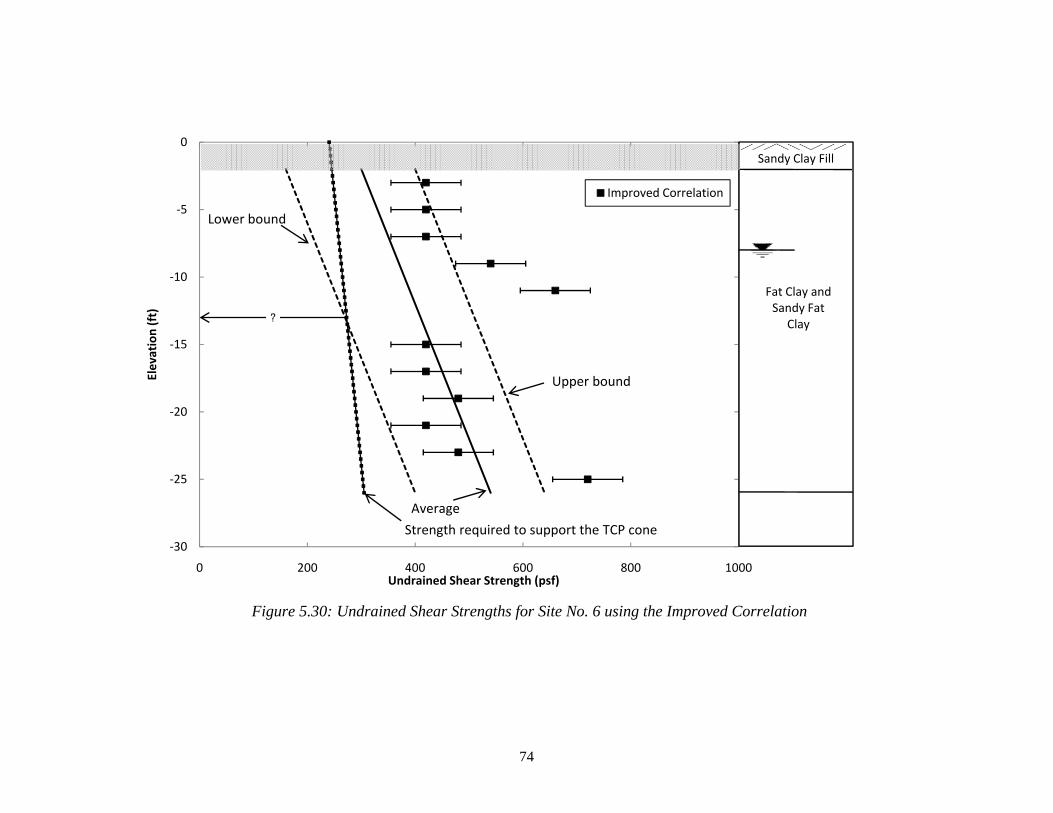
5.2 Discussion of Existing Correlations ....................................................................................58 5.3 Evaluation of Improved Correlation ....................................................................................63 5.4 Discussion of Improved Correlation ....................................................................................75
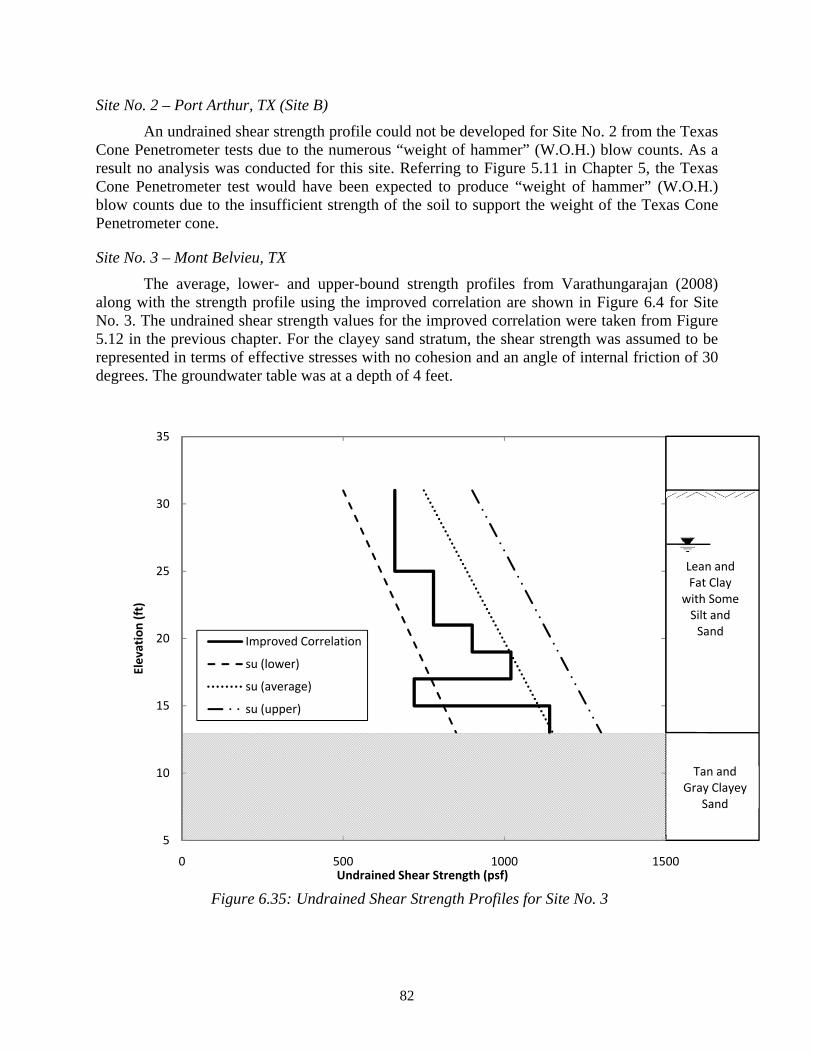
Site No. 1 – Port Arthur, TX (Site A) ............................................................................... 80 Site No. 2 – Port Arthur, TX (Site B) ............................................................................... 82 Site No. 3 – Mont Belvieu, TX ......................................................................................... 82 Site No. 4 – Beaumont, TX ............................................................................................... 83 Site No. 5 – Cameron Parish, LA (Site A) ........................................................................ 83 Site No. 6 – Cameron Parish, LA (Site B) ........................................................................ 86
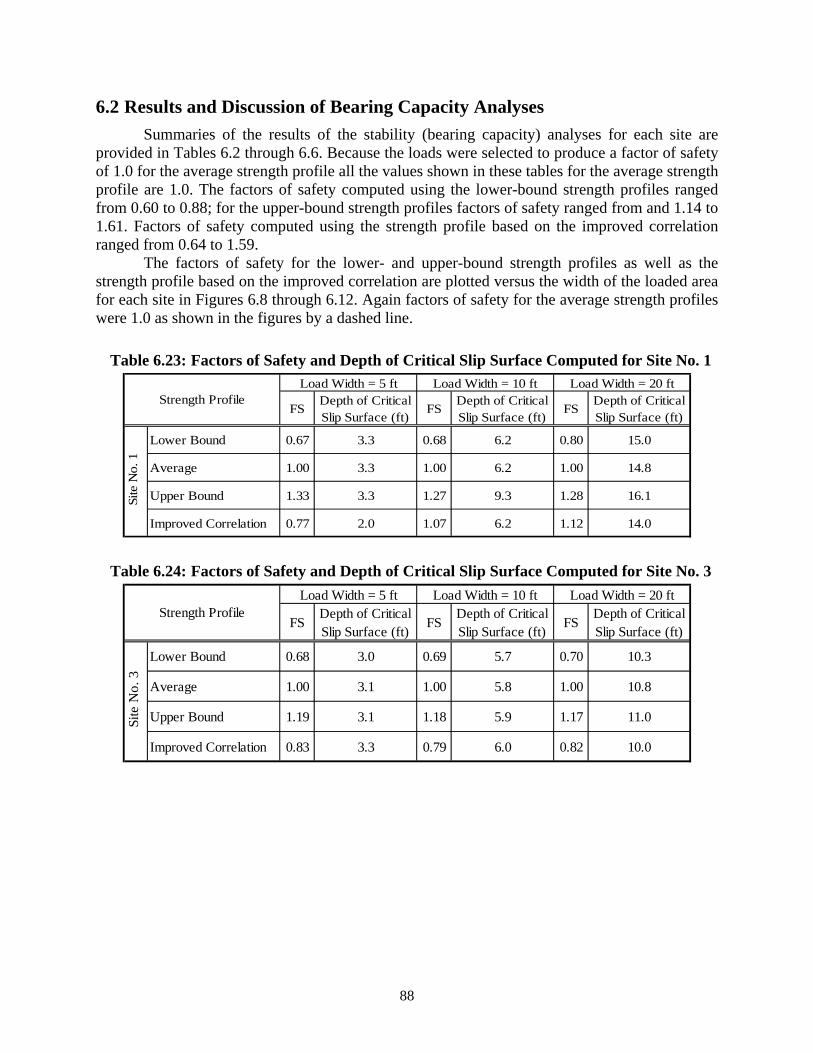
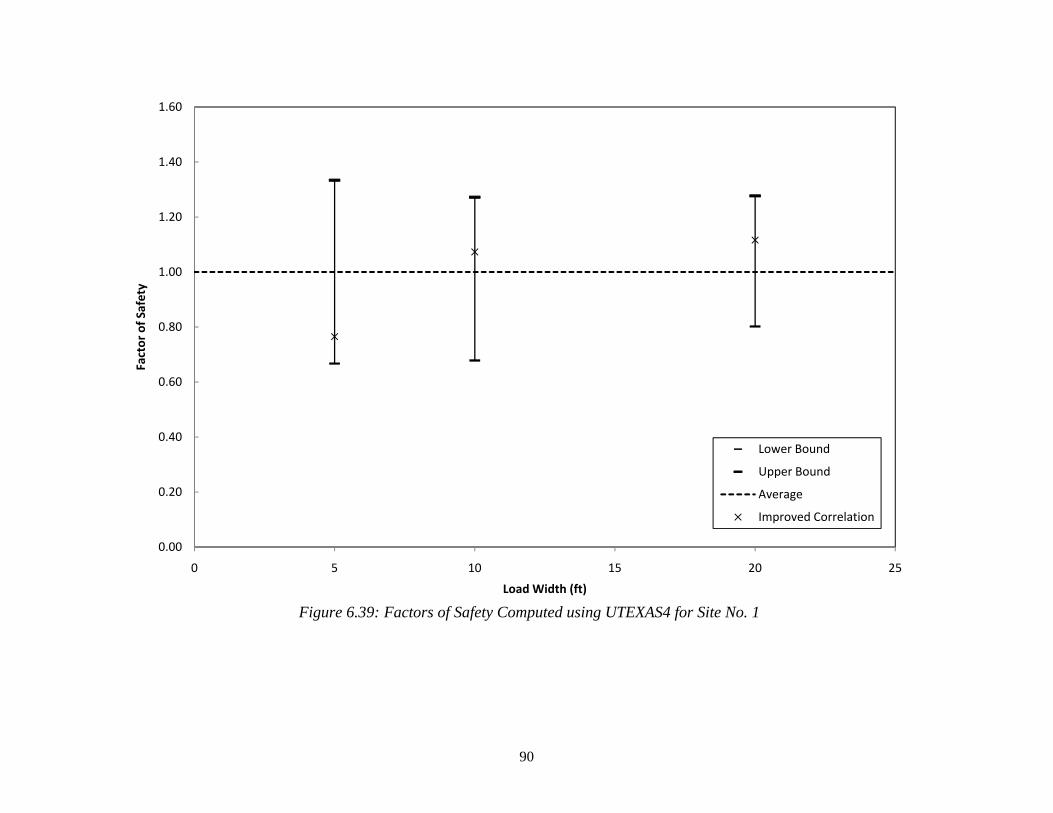
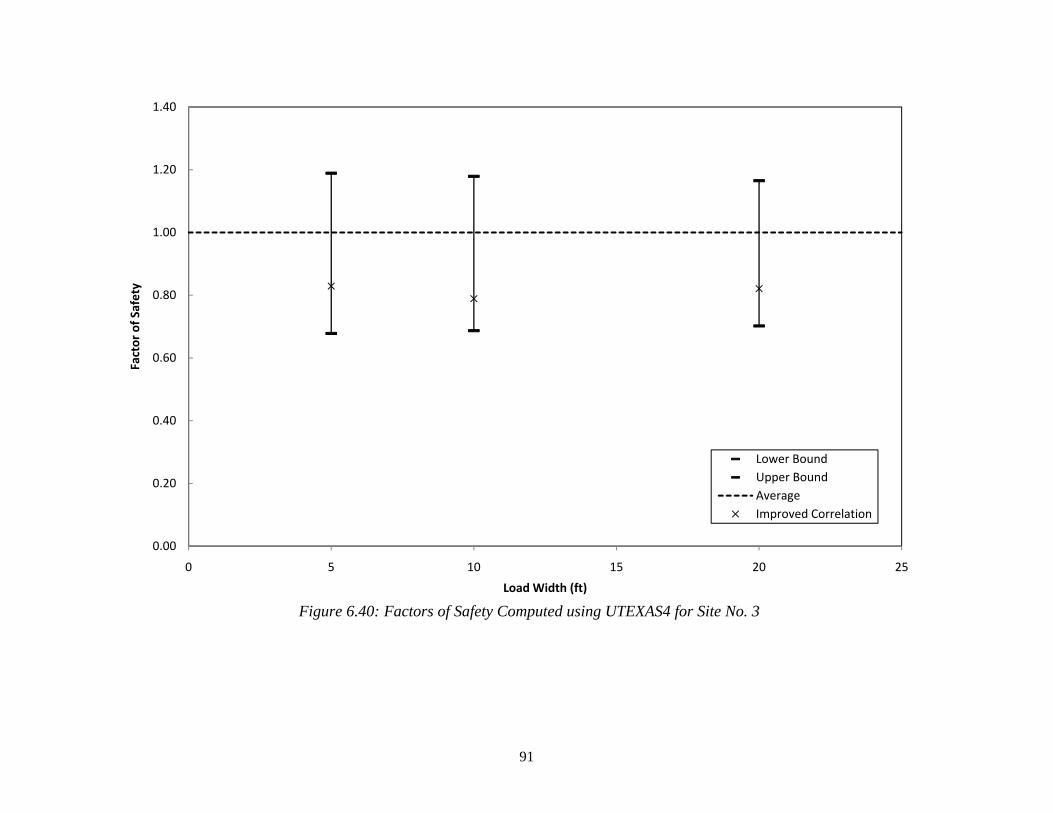
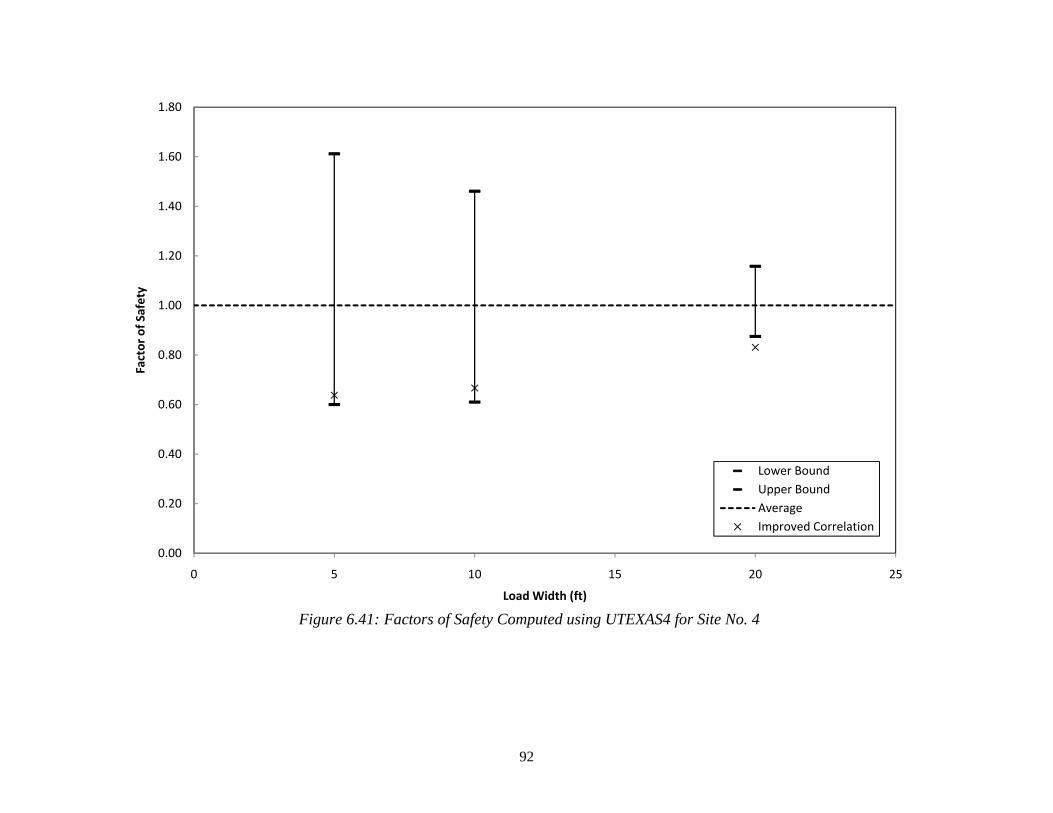
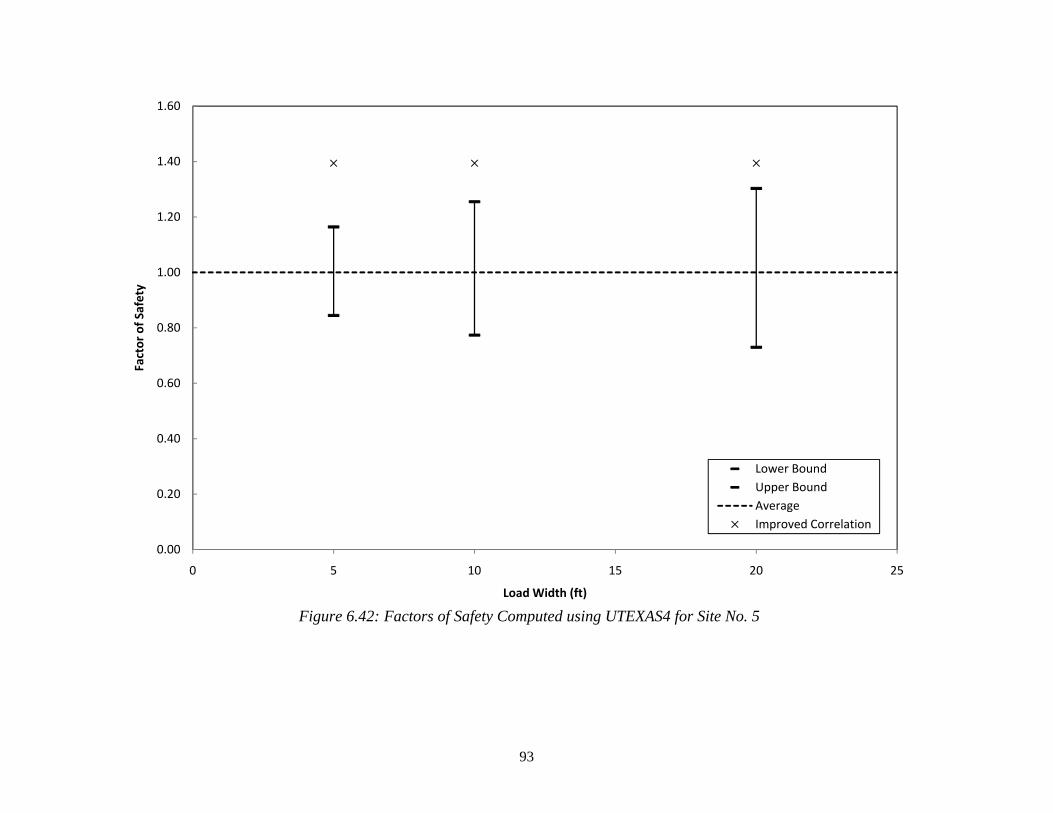
6.2 Results and Discussion of Bearing Capacity Analyses .......................................................88
Figure 2.2: Minimum Strength Required to Support the TCP Cone for Example ......................... 7
Figure 3.1: Correlation of NTCP and su from Hamoudi et al. (1974) ............................................. 11
Figure 3.2: Correlation of NTCP and su from Duderstadt et al. (1977) .......................................... 12
Figure 4.1: Site and Boring Location Map for Site No. 1 ............................................................. 16
Figure 4.2: Stratigraphic Profile of Site No. 1 .............................................................................. 20
Figure 4.3: Site and Boring Location Map for Site No. 2 ............................................................. 21
Figure 4.4: Stratigraphic Profile of Site No. 2 .............................................................................. 23
Figure 4.5: Site and Boring Location Map for Site No. 3 ............................................................. 25
Figure 4.6: Stratigraphic Profile of Site No. 3 .............................................................................. 27
Figure 4.7: Site and Boring Location Map for Site No. 4 ............................................................. 29
Figure 4.8: Stratigraphic Profile of Site No. 4 .............................................................................. 32
Figure 4.9: Site and Boring Location Map for Sites No. 5 and No. 6 .......................................... 34
Figure 4.10: Stratigraphic Profile of Site No. 5 ............................................................................ 36
Figure 4.11: Stratigraphic Profile of Site No. 6 ............................................................................ 39
Figure 5.1: Undrained Shear Strengths for Site No. 1 using the Texas Cone Penetrometer Correlations from Duderstadt et al. (1977) and Kim et al. (2007 ..................................... 43
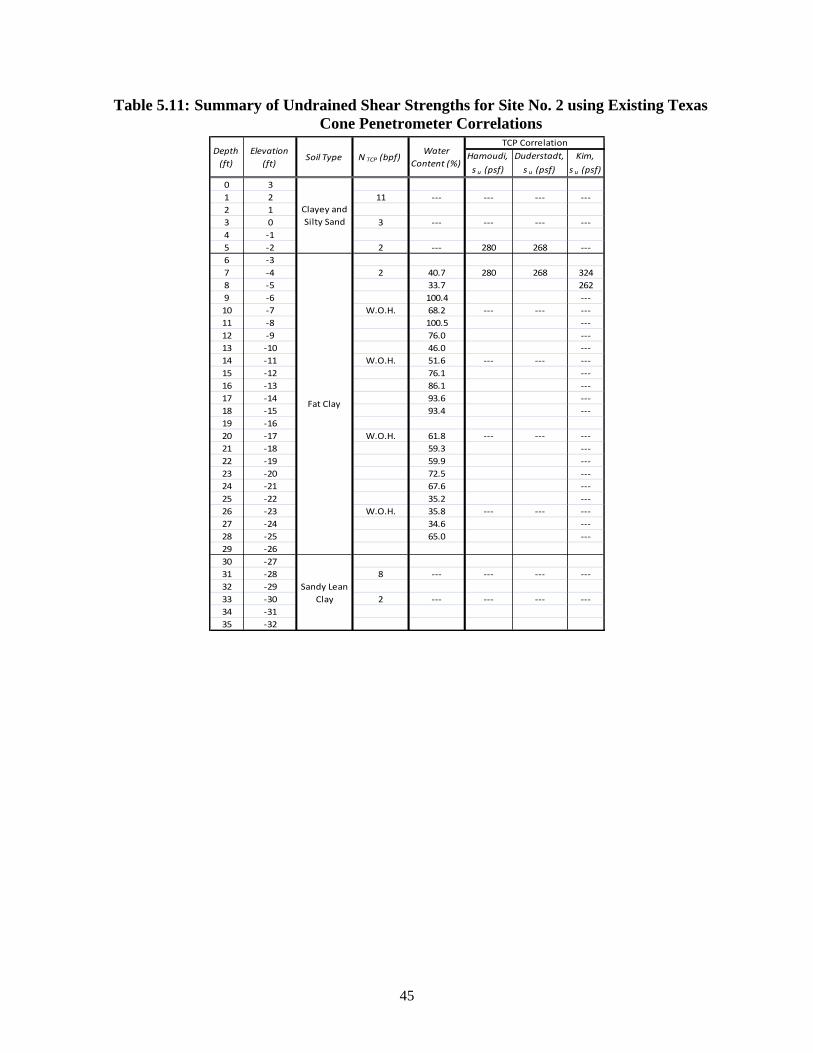
Figure 5.2: Undrained Shear Strengths for Site No. 2 using the Texas Cone Penetrometer Correlations from Duderstadt et al. (1977) and Kim et al. (2007) .................................... 46
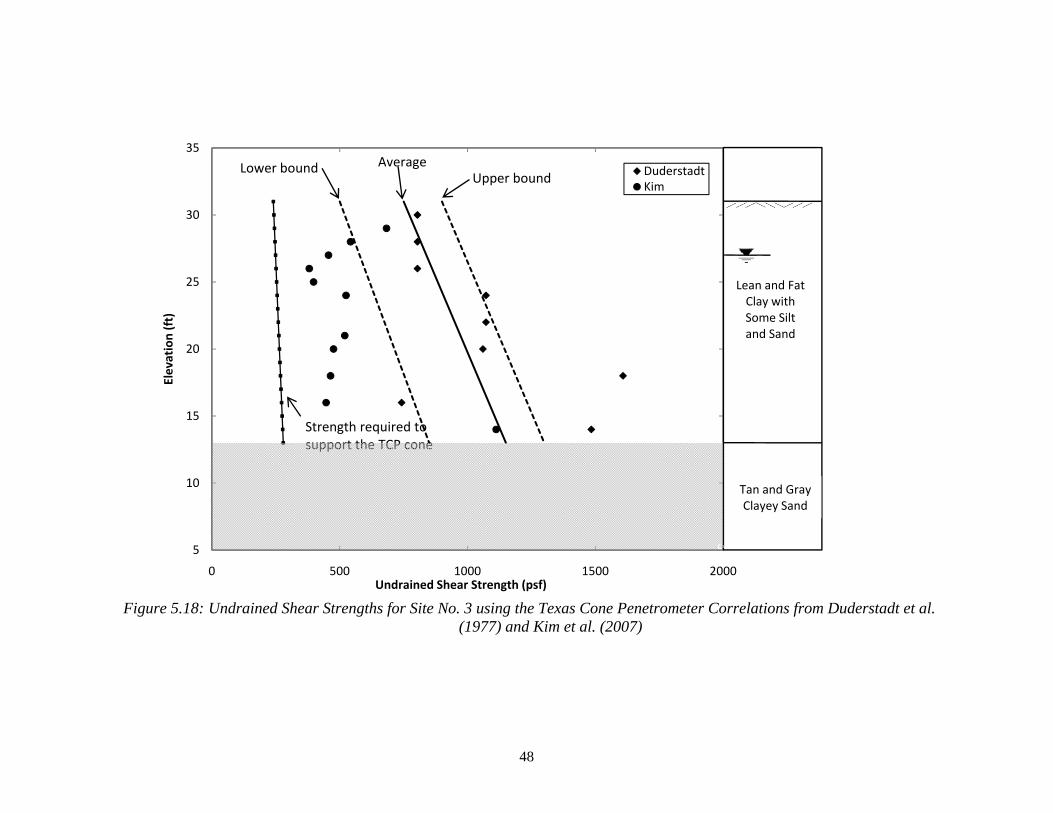
Figure 5.3: Undrained Shear Strengths for Site No. 3 using the Texas Cone Penetrometer Correlations from Duderstadt et al. (1977) and Kim et al. (2007) .................................... 48
Figure 5.4: Undrained Shear Strengths for Site No. 4 using the Texas Cone Penetrometer Correlations from Duderstadt et al. (1977) and Kim et al. (2007) .................................... 51
Figure 5.5: Undrained Shear Strengths for Site No. 5 using the Texas Cone Penetrometer Correlations from Duderstadt et al. (1977) and Kim et al. (2007) .................................... 54
Figure 5.6: Undrained Shear Strengths for Site No. 6 using the Texas Cone Penetrometer Correlations from Duderstadt et al. (1977) and Kim et al. (2007) .................................... 57
Figure 5.7: Ratio of the Undrained Shear Strength Determined Using the Average Undrained Strength Profile from Varathungarajan (2008) to the Minimum Undrained Shear Strength Required to Support the TCP Cone ........................................ 60
Figure 5.8: All Texas Cone Penetrometer Data from Hamoudi et al. (1974), Duderstadt et al. (1977) and the Additional Six Sites of this Study ........................................................ 61
Figure 5.9: Texas Cone Penetrometer Data from Hamoudi et al. (1974), Duderstadt et al. (1977) and the Additional Six Sites of this Study for Blow Counts of 15 or less ............ 62
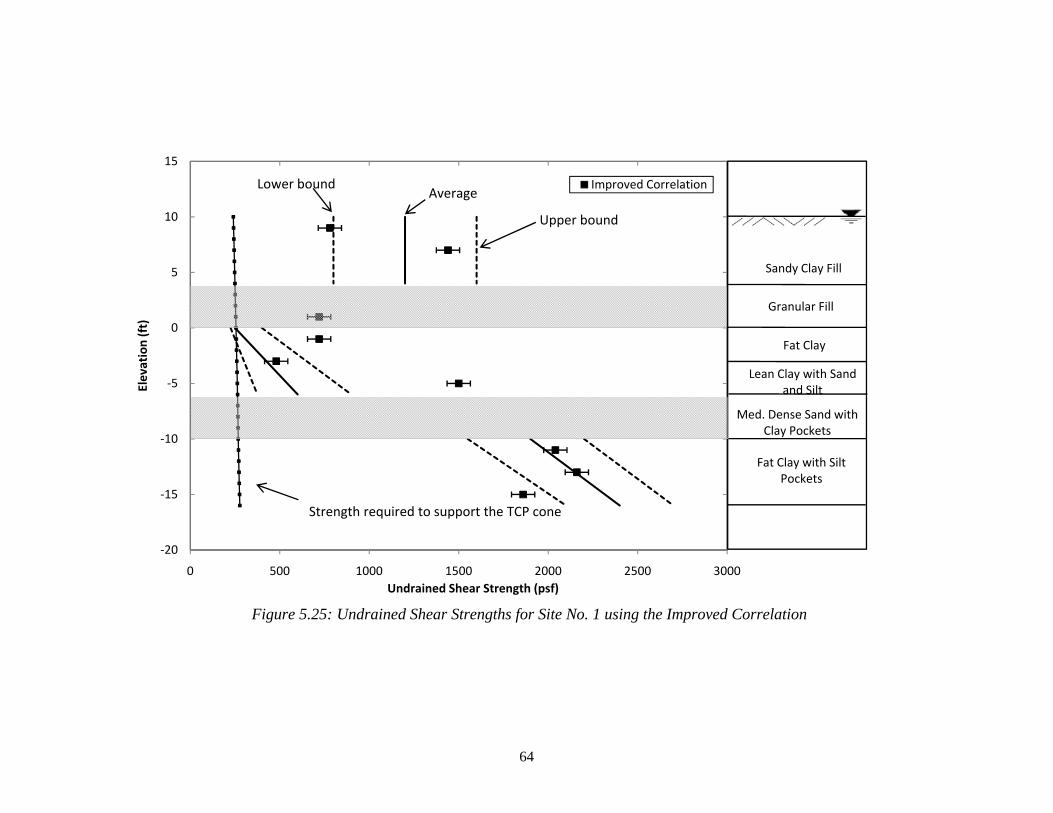
Figure 5.10: Undrained Shear Strengths for Site No. 1 using the Improved Correlation ............. 64
x
Figure 5.11: Undrained Shear Strengths for Site No. 2 using the Improved Correlation ............. 66
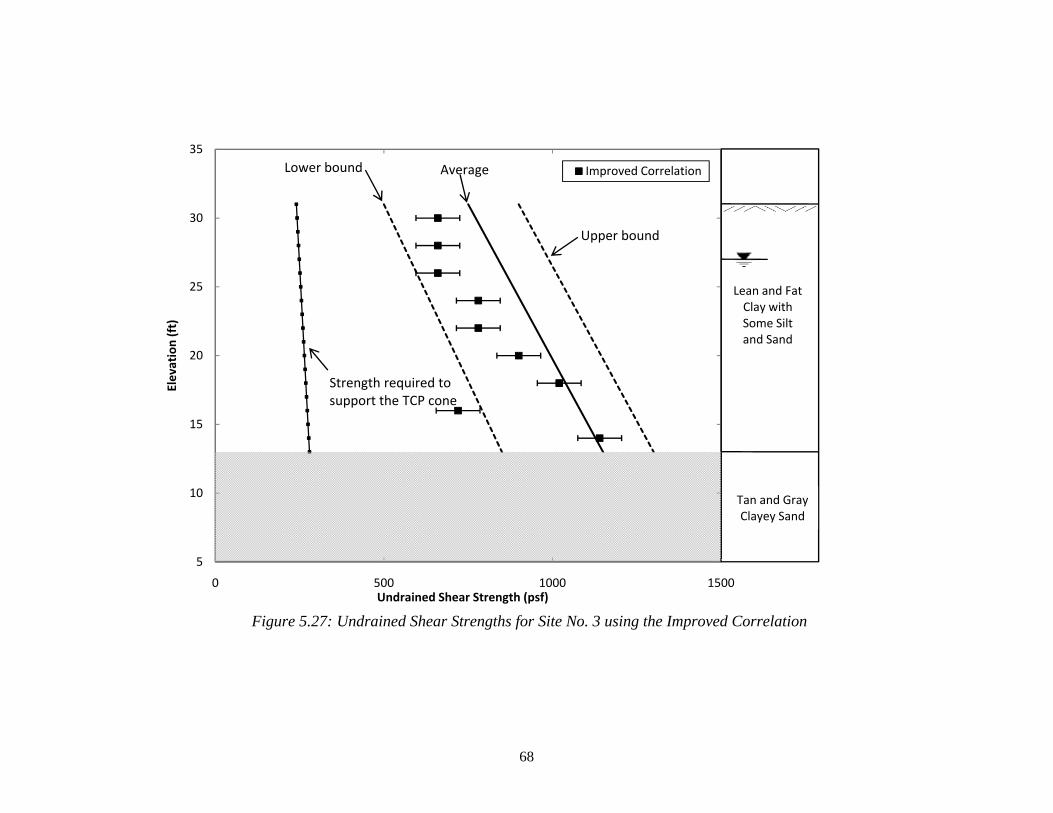
Figure 5.12: Undrained Shear Strengths for Site No. 3 using the Improved Correlation ............. 68
Figure 5.13: Undrained Shear Strengths for Site No. 4 using the Improved Correlation ............. 70
Figure 5.14: Undrained Shear Strengths for Site No. 5 using the Improved Correlation ............. 72
Figure 5.15: Undrained Shear Strengths for Site No. 6 using the Improved Correlation ............. 74
Figure 5.16: Ratio of the Undrained Shear Strength Computed from the Improved Correlation to the Undrained Shear Strength Determined Using the Average Undrained Strength Profile from Varathungarajan (2008) ............................................... 76
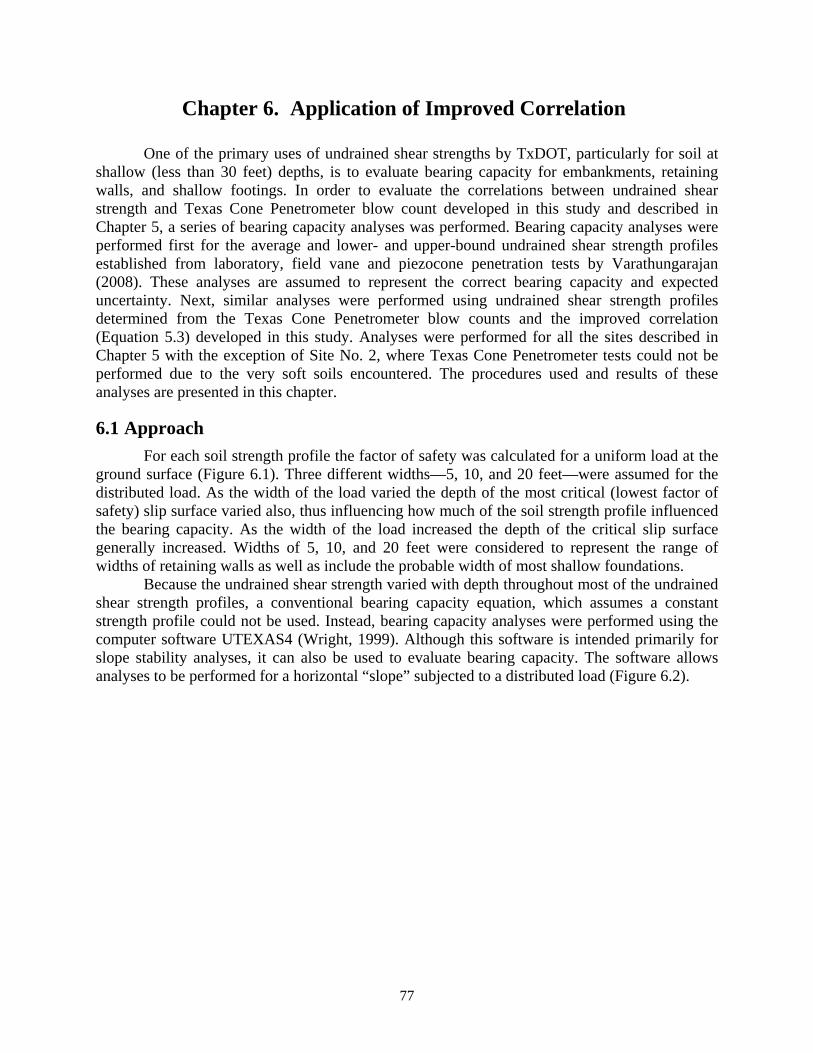
Figure 6.1: Graphic File for Site 1 using the Average Undrained Shear Strength Profile and a Load Width of 10 Feet ............................................................................................. 78
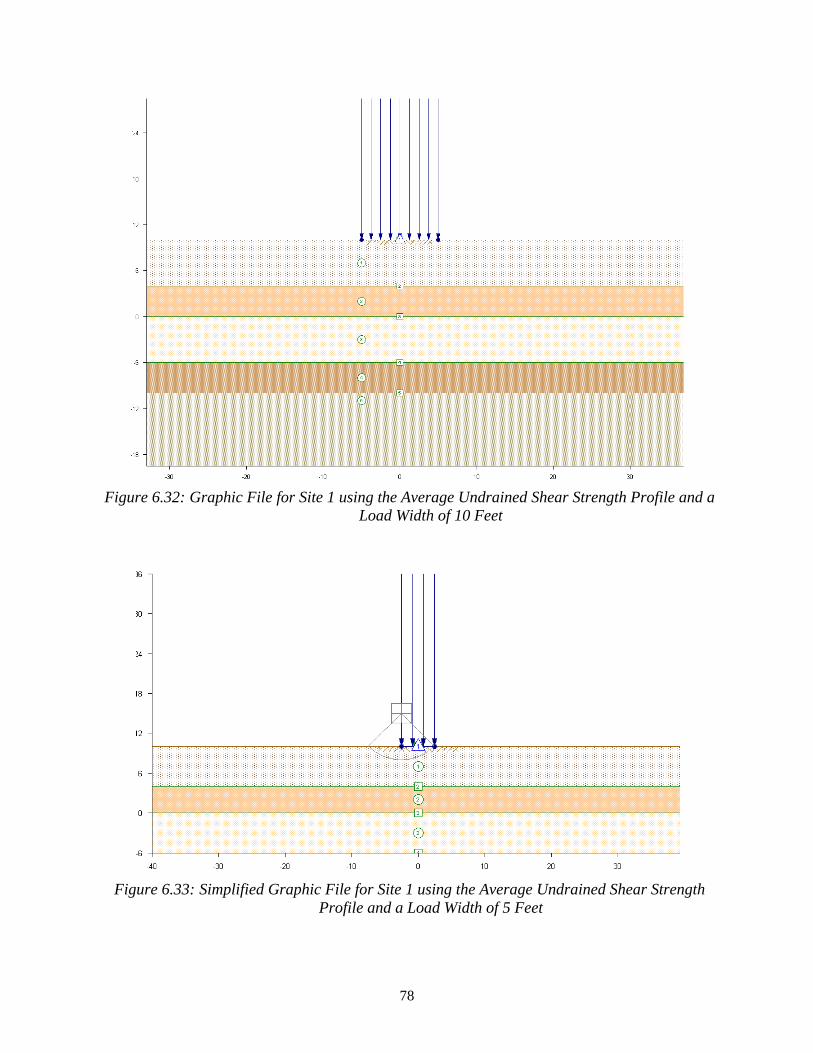
Figure 6.2: Simplified Graphic File for Site 1 using the Average Undrained Shear Strength Profile and a Load Width of 5 Feet .................................................................... 78
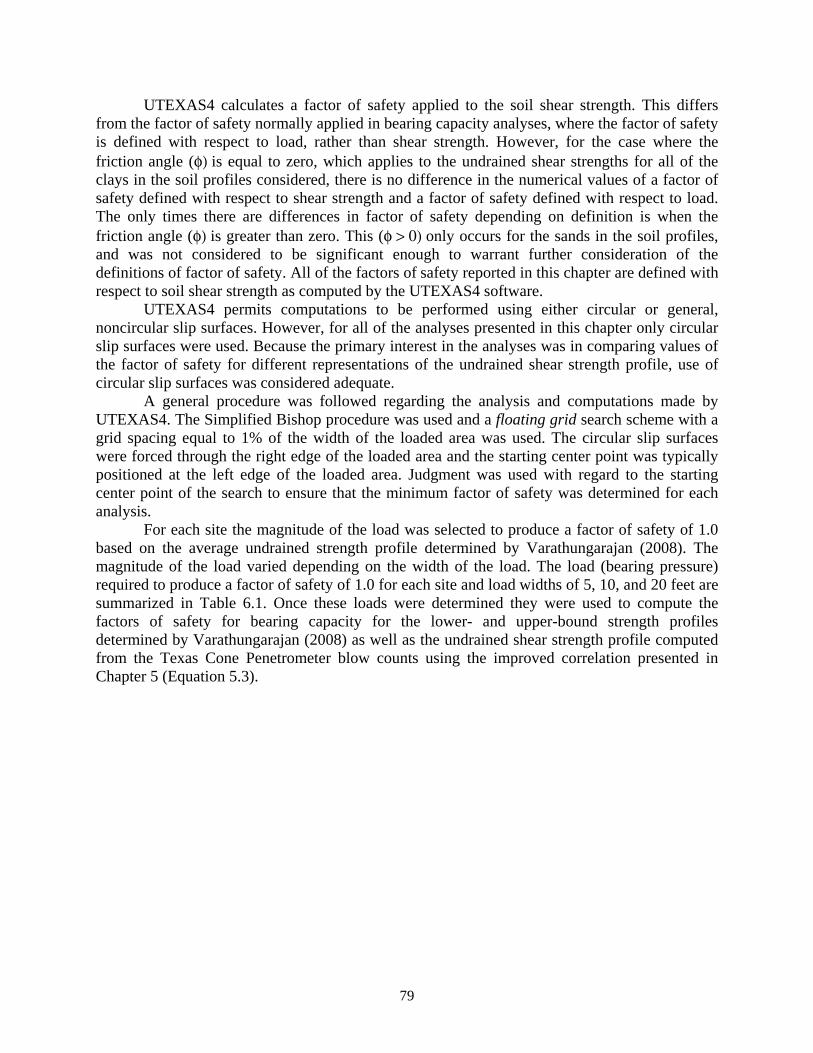
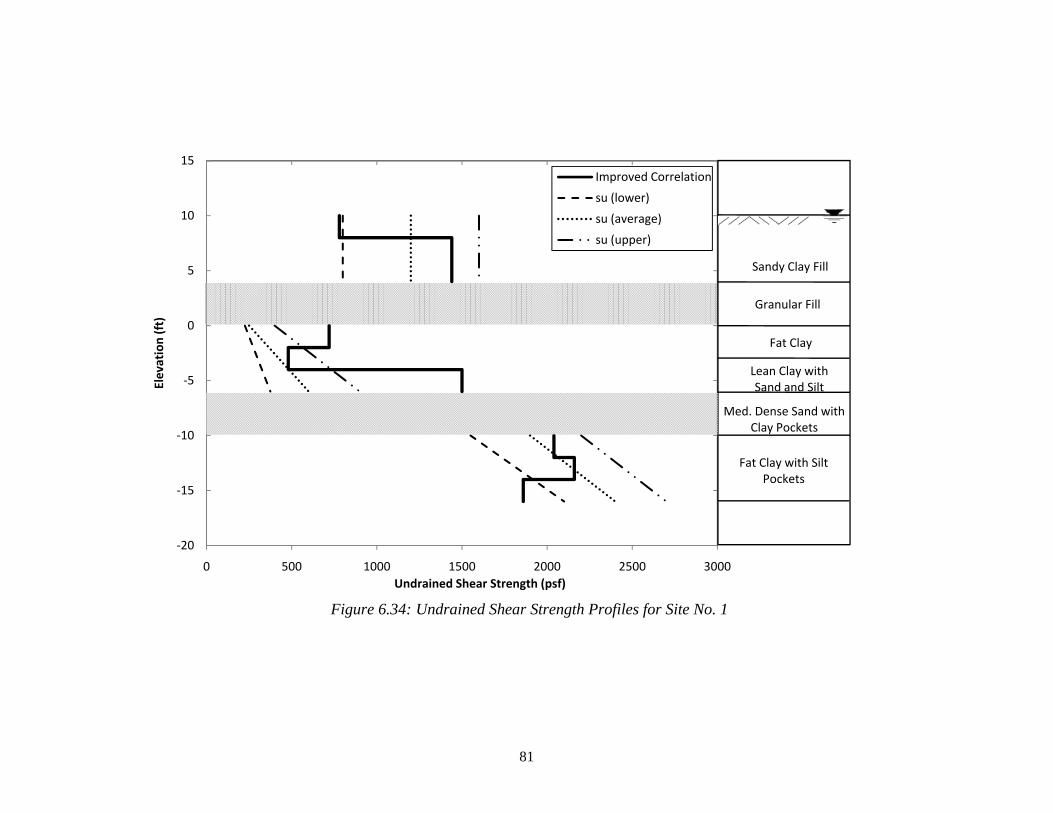
Figure 6.3: Undrained Shear Strength Profiles for Site No. 1 ...................................................... 81
Figure 6.4: Undrained Shear Strength Profiles for Site No. ......................................................... 82
Figure 6.5: Undrained Shear Strength Profiles for Site No. 4 ...................................................... 84
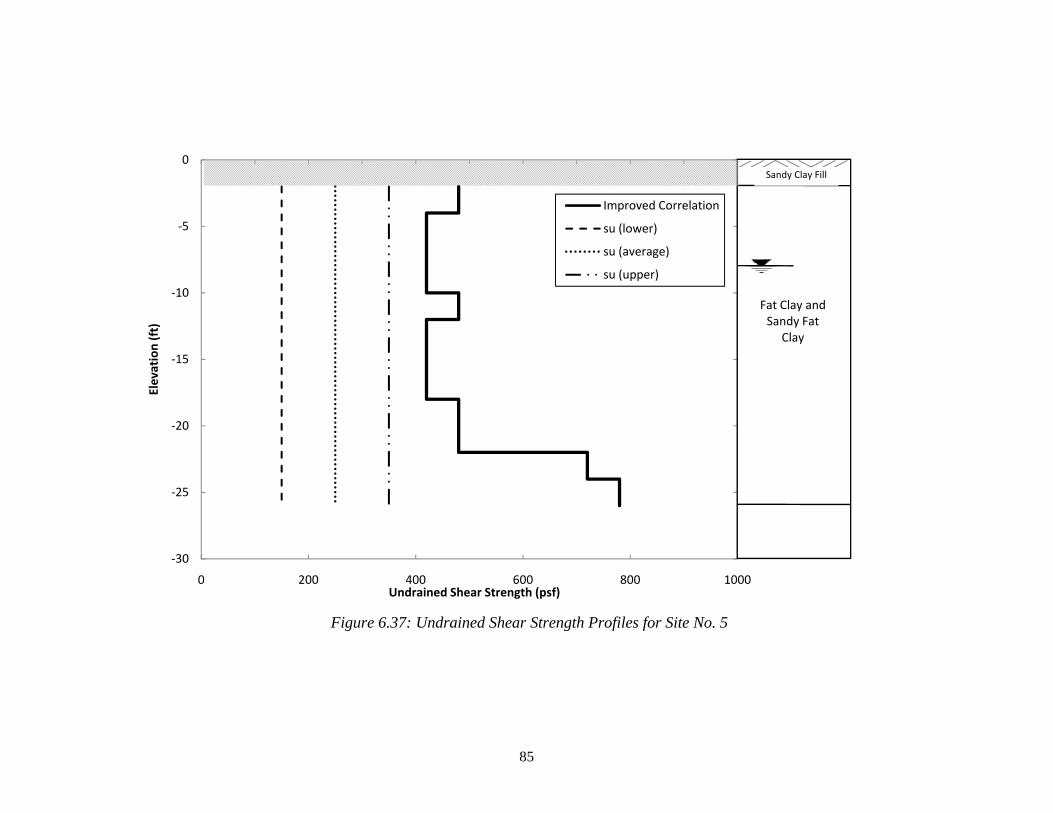
Figure 6.6: Undrained Shear Strength Profiles for Site No. 5 ...................................................... 85
Figure 6.7: Undrained Shear Strength Profiles for Site No. 6 ...................................................... 87
Figure 6.8: Factors of Safety Computed using UTEXAS4 for Site No. 1 .................................... 90
Figure 6.9: Factors of Safety Computed using UTEXAS4 for Site No. 3 .................................... 91
Figure 6.10: Factors of Safety Computed using UTEXAS4 for Site No. 4 .................................. 92
Figure 6.11: Factors of Safety Computed using UTEXAS4 for Site No. 5 .................................. 93
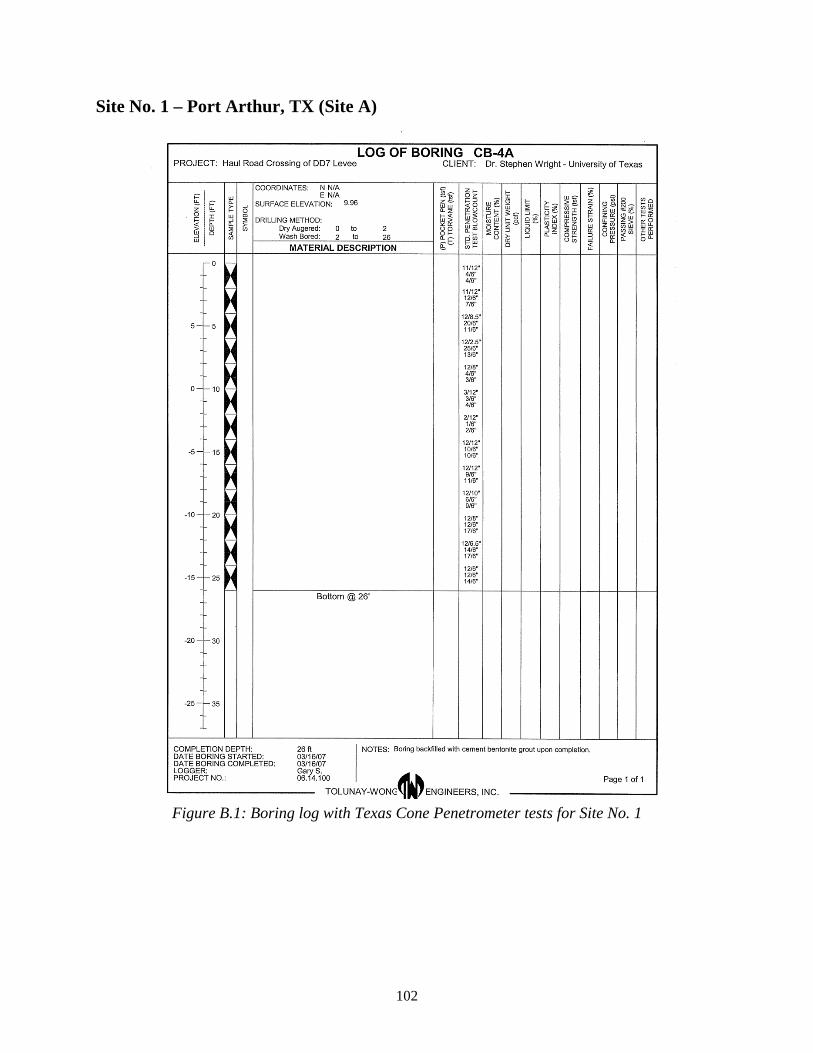
Figure 6.12: Factors of Safety Computed using UTEXAS4 for Site No. 6 .................................. 94 Figure B.1: Boring log with Texas Cone Penetrometer tests for Site No. 1 ............................... 102
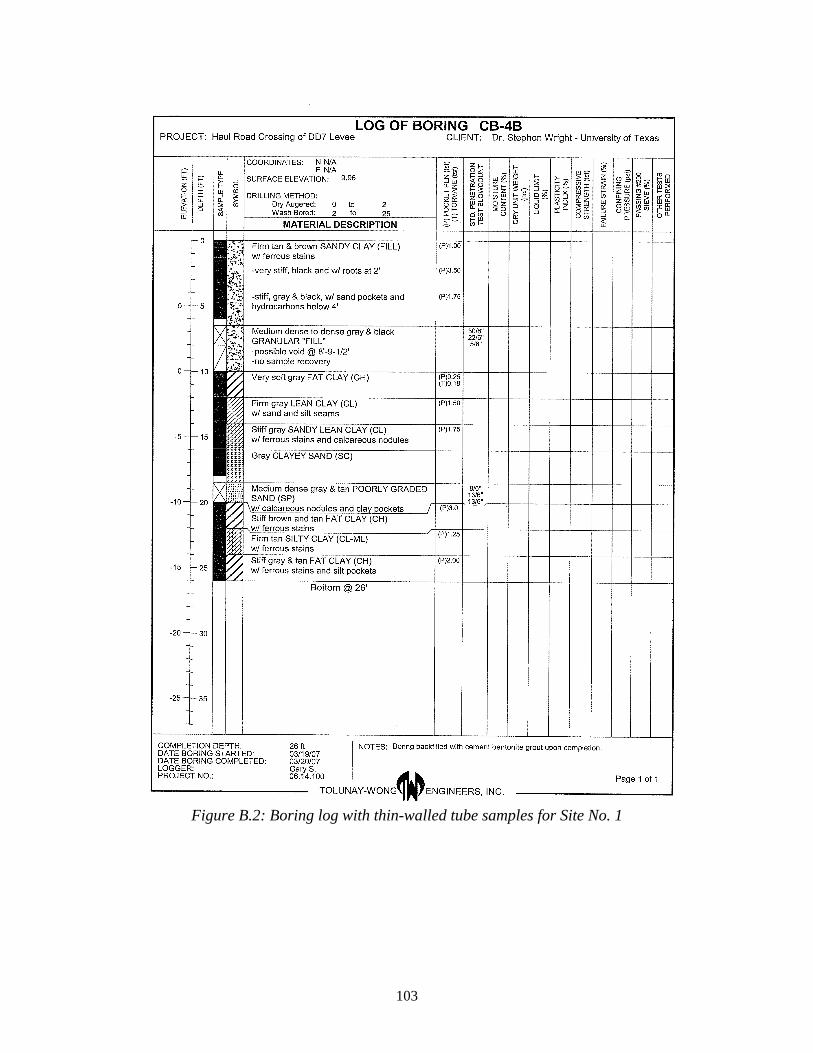
Figure B.2: Boring log with thin-walled tube samples for Site No. 1 ........................................ 103
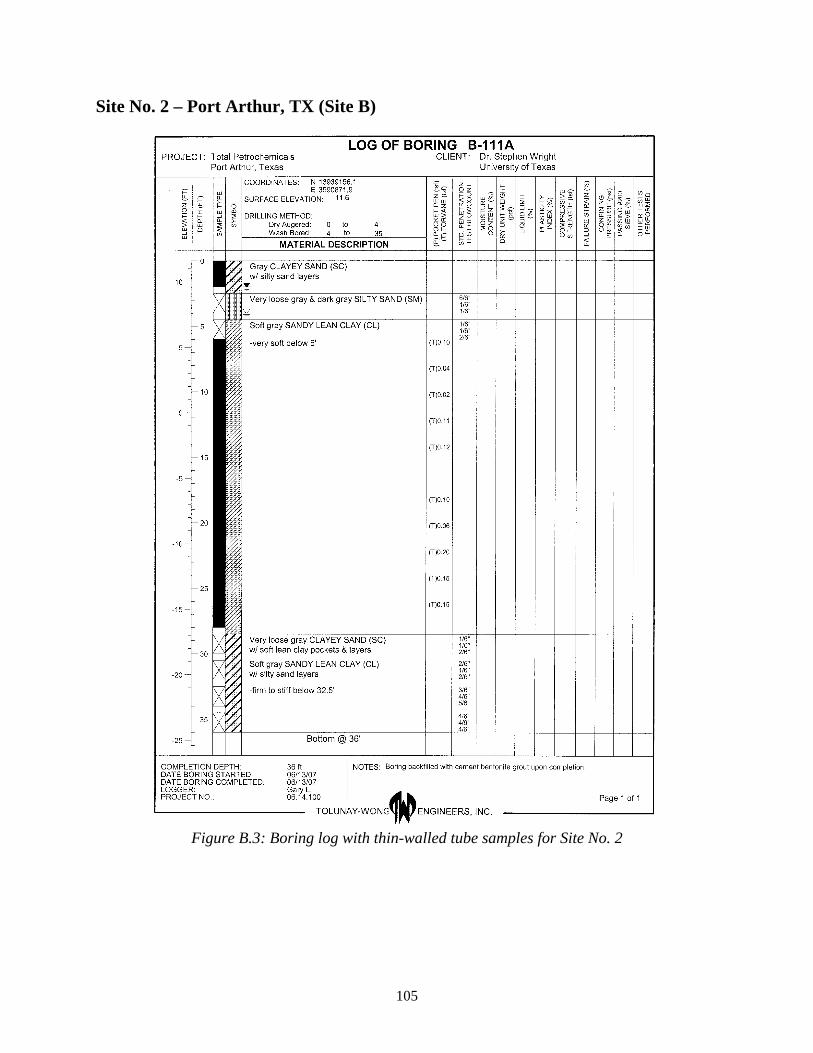
Figure B.3: Boring log with thin-walled tube samples for Site No. 2 ........................................ 105
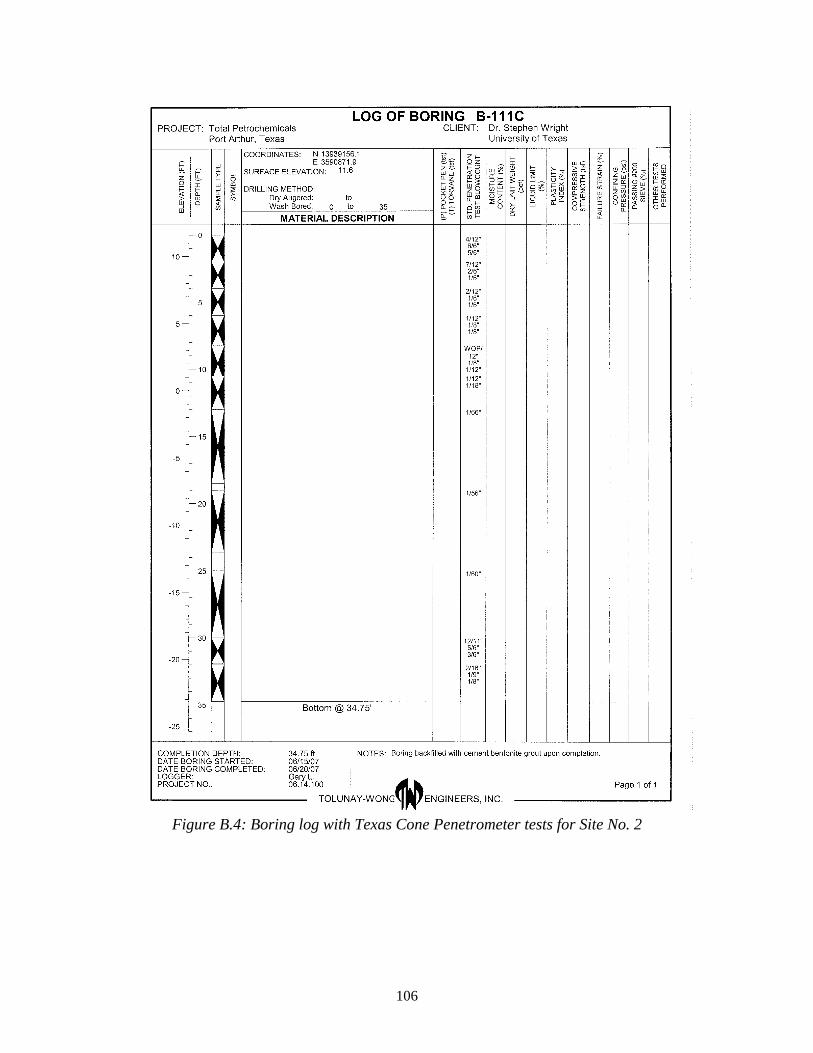
Figure B.4: Boring log with Texas Cone Penetrometer tests for Site No. 2 ............................... 106
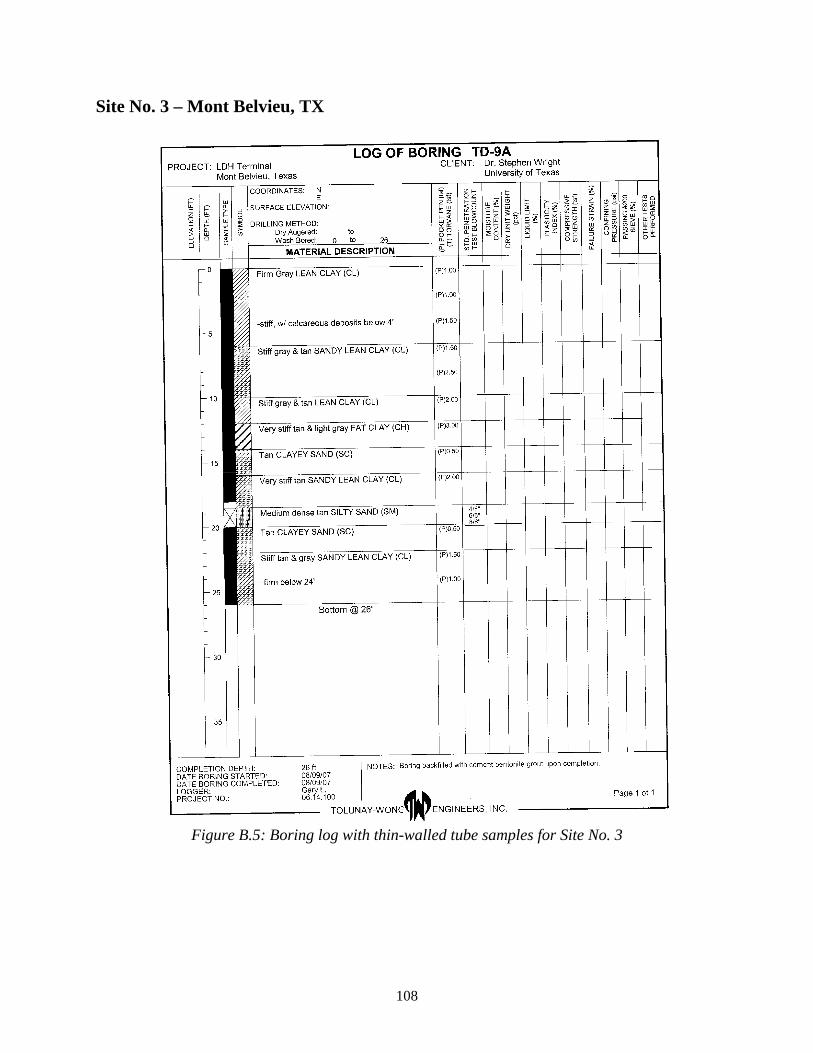
Figure B.5: Boring log with thin-walled tube samples for Site No. 3 ........................................ 108
Figure B.6: Boring log with Texas Cone Penetrometer tests for Site No. 2 ............................... 109
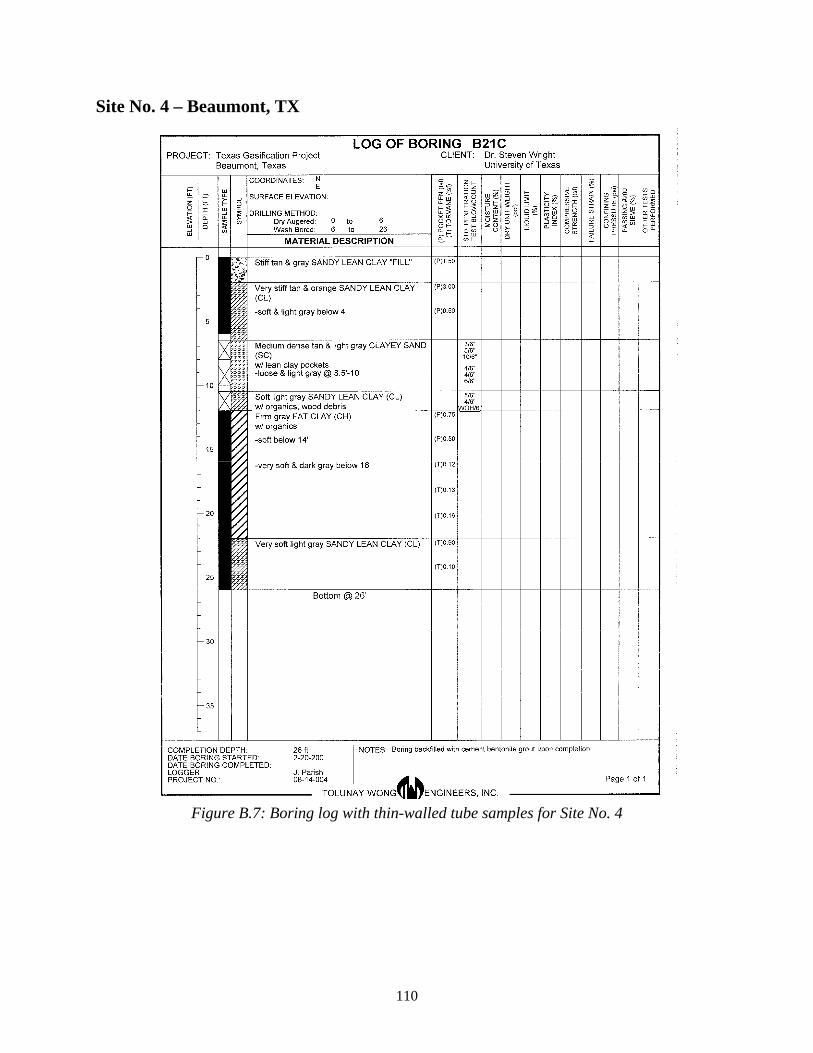
Figure B.7: Boring log with thin-walled tube samples for Site No. 4 ........................................ 110
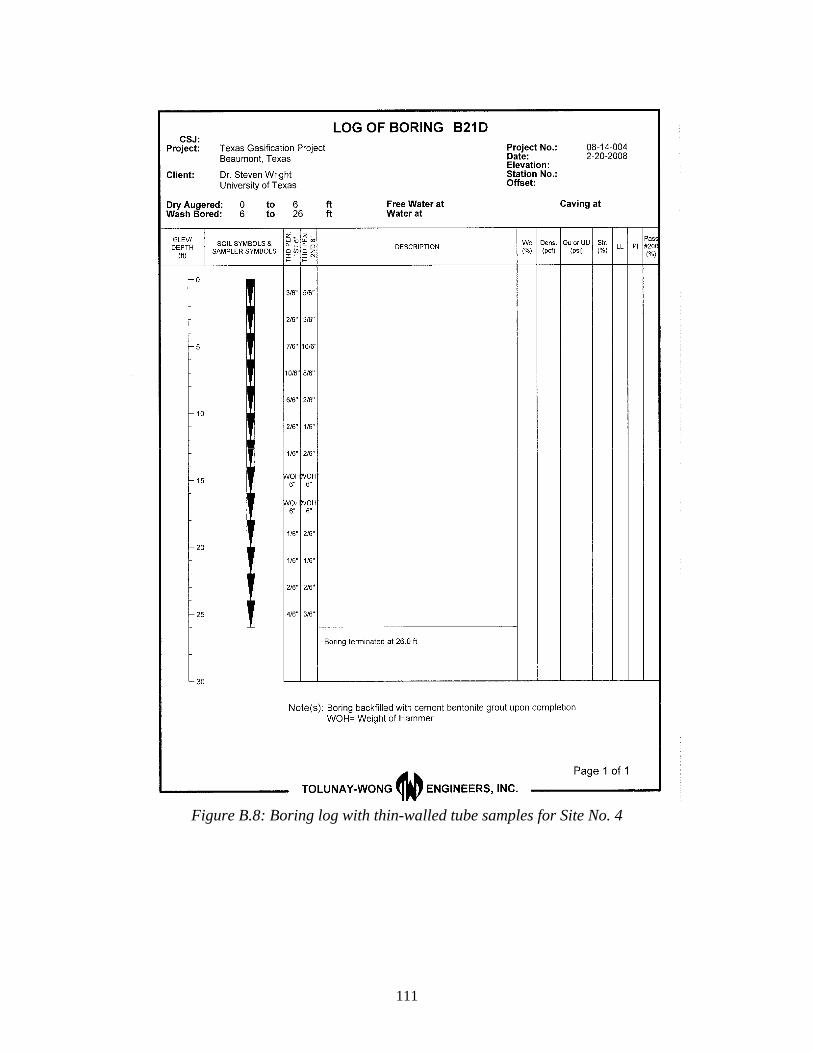
Figure B.8: Boring log with thin-walled tube samples for Site No. 4 ........................................ 111
Figure B.9: Boring log with thin-walled tube samples for Site No. 5 ........................................ 113
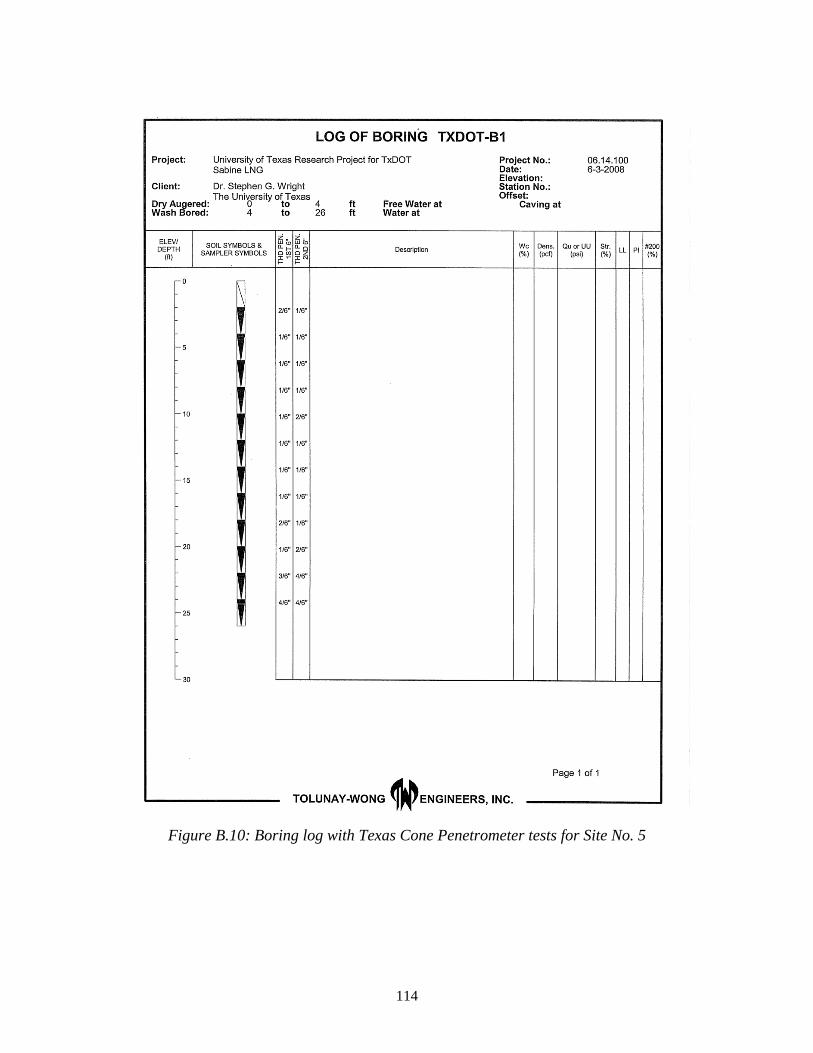
Figure B.10: Boring log with Texas Cone Penetrometer tests for Site No. 5 ............................. 114
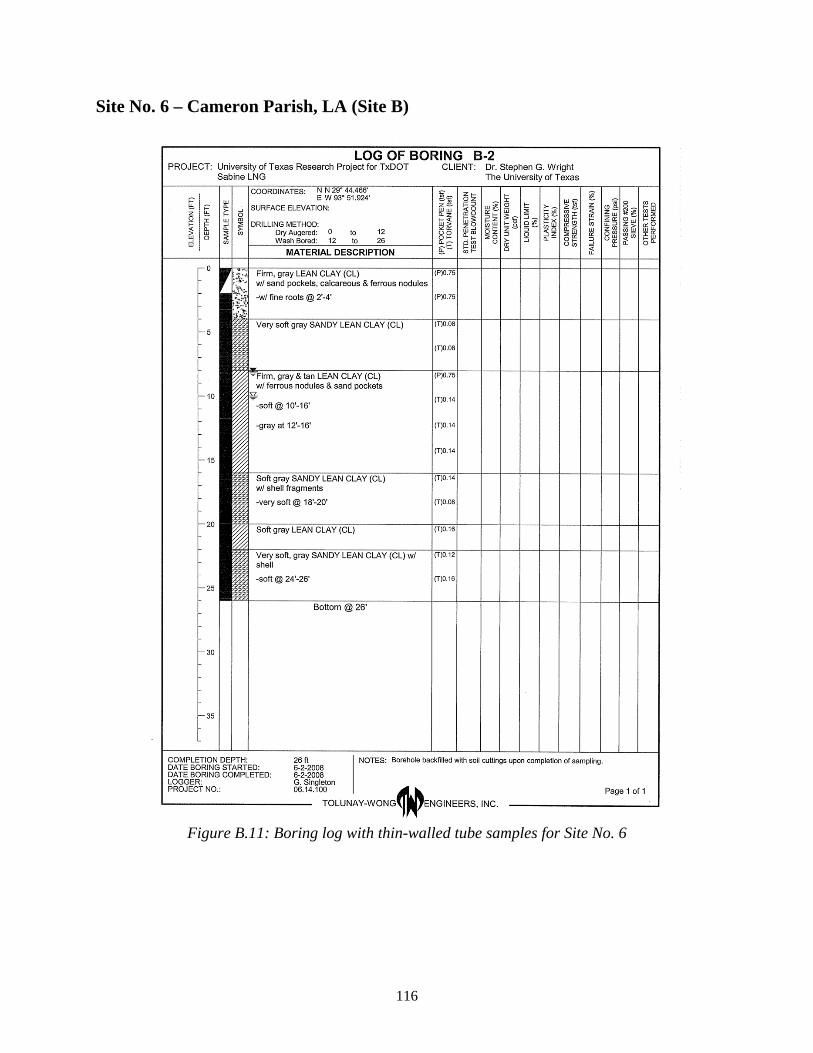
Figure B.11: Boring log with thin-walled tube samples for Site No. 6 ...................................... 116
Figure B.12: Boring log with Texas Cone Penetrometer tests for Site No. 6 ............................. 117
xi
List of Tables Table 2.1: Weight and Dimension of TCP Test Equipment ........................................................... 5
Table 2.2: Computations for Bearing Capacity Analysis Example ................................................ 6
Table 3.1: Texas Cone Penetrometer Blow Counts and Undrained Shear Strengths from Hamoudi et al. (1974) ....................................................................................................... 10
Table 3.2: Constant of Proportionality for Various USCS Soil Classifications from Hamoudi et al. (1974) ....................................................................................................... 10
Table 3.3: TCP Blow Counts and Undrained Shear Strengths from Duderstadt et al. (1977) ................................................................................................................................ 11
Table 3.4: Constant of Proportionality for Various USCS Soil Classifications from Duderstadt et al. (1977) ..................................................................................................... 12
Table 3.5: Ranges and Averages for Variables from Kim et al. (2007) ....................................... 13
Table 3.6: Parameter from Least Squares Fitting of the Data for the Correlation from Kim et al. (2007) ....................................................................................................................... 13
Table 3.7: Data from Hamoudi et al. (1974) and Duderstadt et al. (1977) where Texas Cone Penetrometer Blow Counts were less than 15 ......................................................... 14
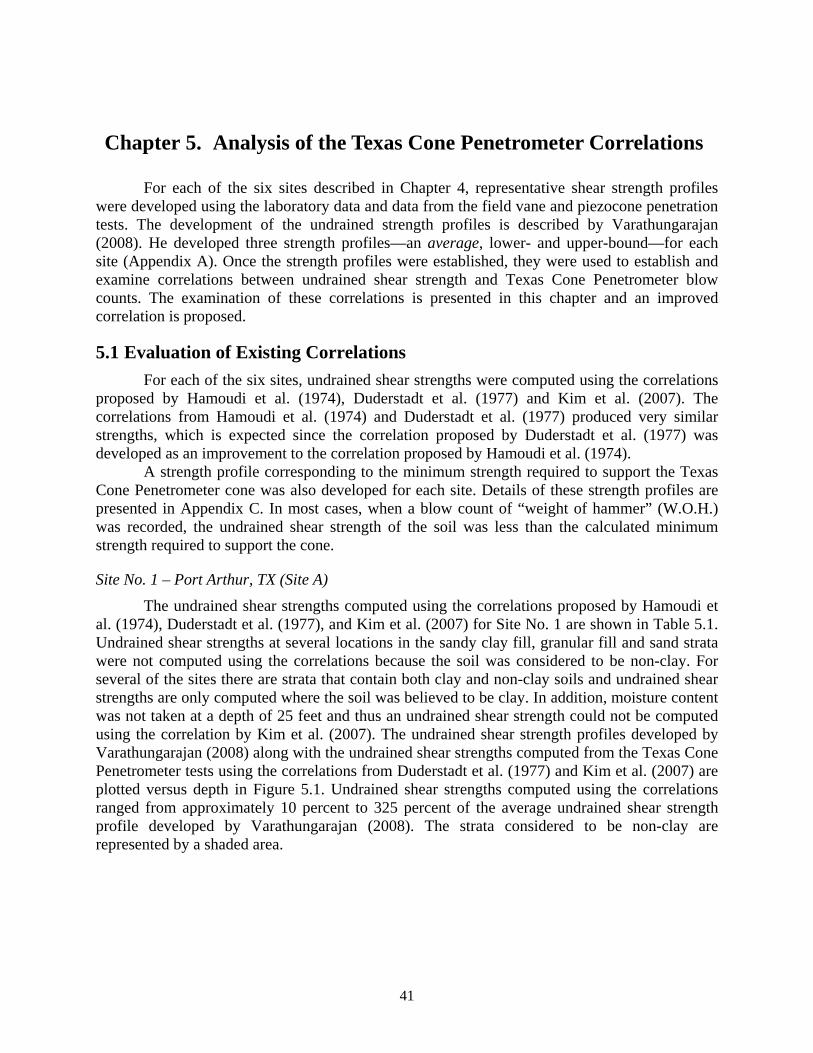
Table 5.1: Summary of Undrained Shear Strengths for Site No. 1 using Existing Texas Cone Penetrometer Correlations ....................................................................................... 42
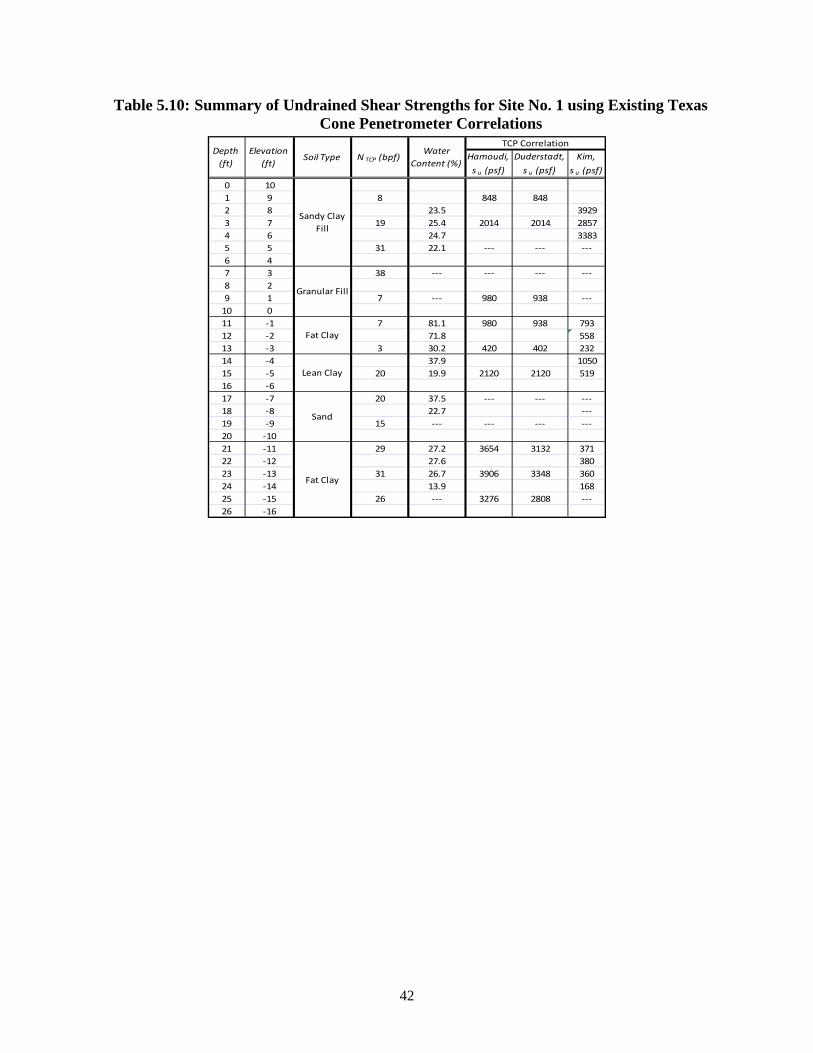
Table 5.2: Summary of Undrained Shear Strengths for Site No. 2 using Existing Texas Cone Penetrometer Correlations ....................................................................................... 45
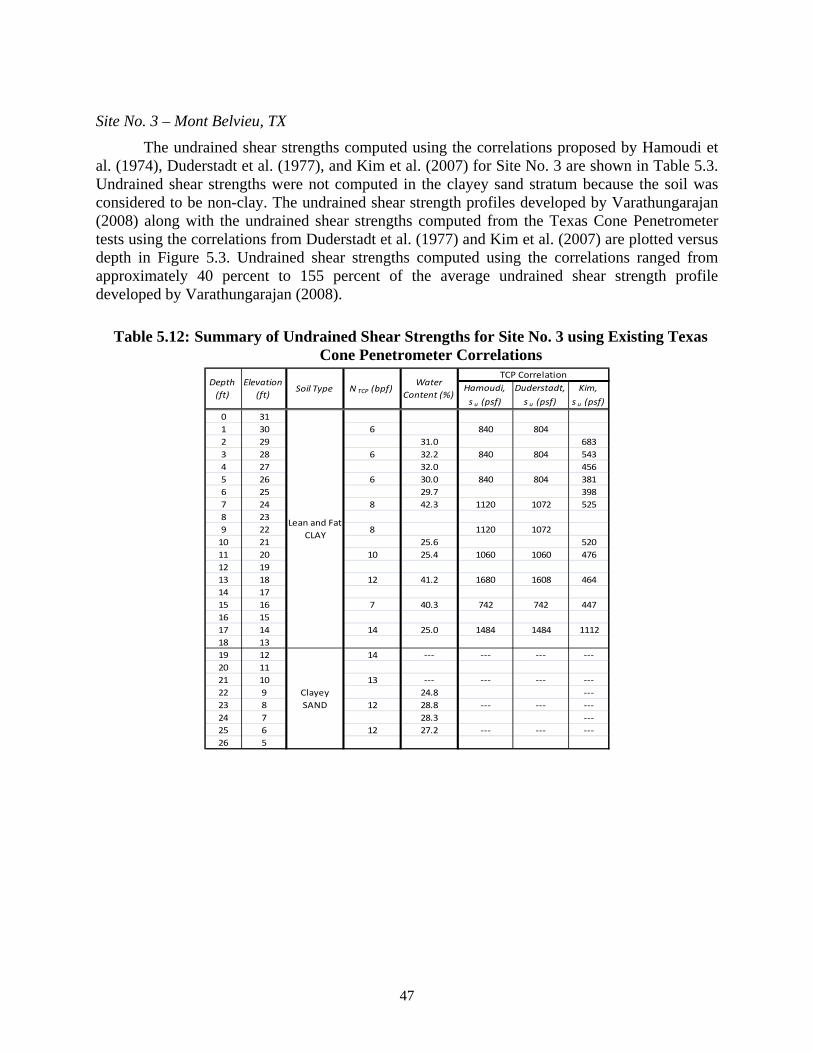
Table 5.3: Summary of Undrained Shear Strengths for Site No. 3 using Existing Texas Cone Penetrometer Correlations ....................................................................................... 47
Table 5.4: Summary of Undrained Shear Strengths for Site No. 4 using Existing Texas Cone Penetrometer Correlations ....................................................................................... 50
Table 5.5: Summary of Undrained Shear Strengths for Site No. 5 using Existing Texas Cone Penetrometer Correlations ....................................................................................... 53
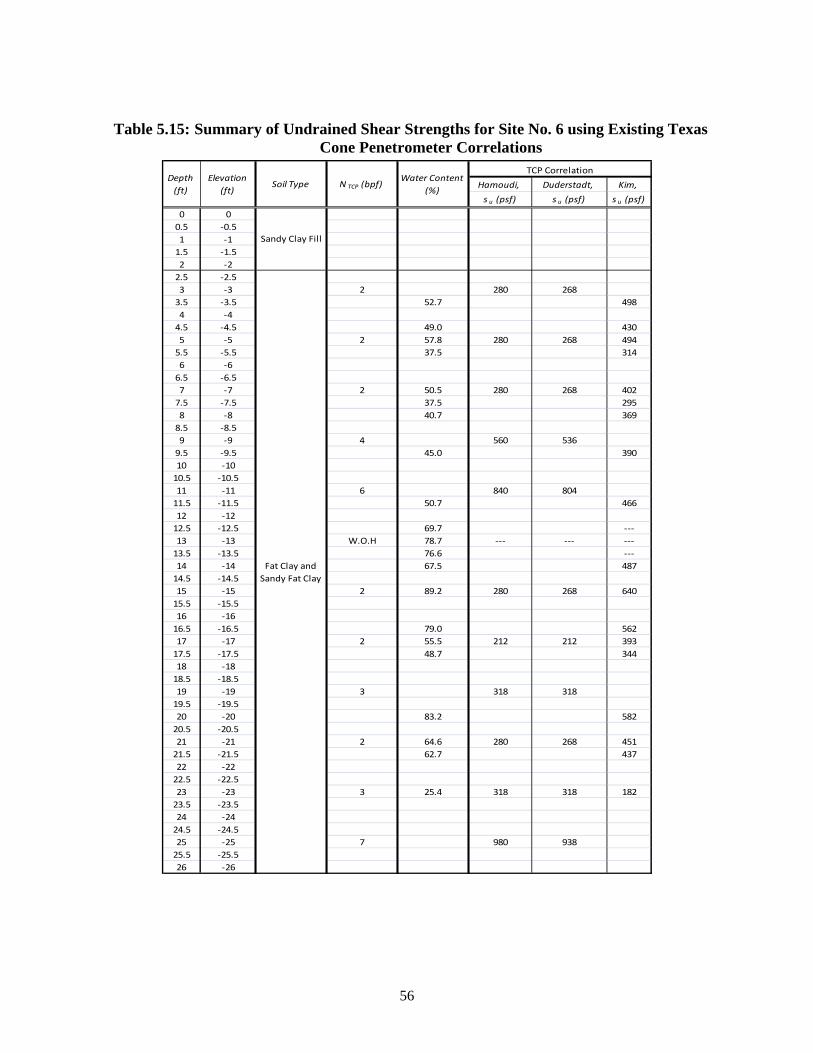
Table 5.6: Summary of Undrained Shear Strengths for Site No. 6 using Existing Texas Cone Penetrometer Correlations ....................................................................................... 56
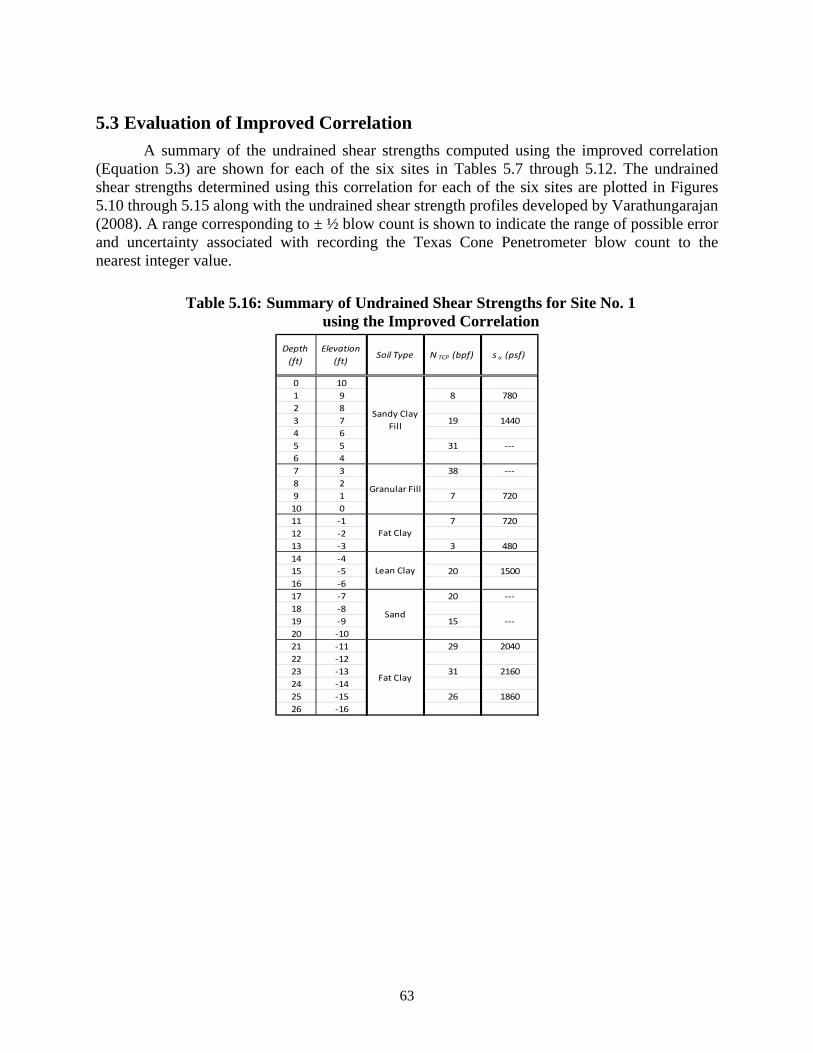
Table 5.7: Summary of Undrained Shear Strengths for Site No. 1 using the Improved Correlation ........................................................................................................................ 63
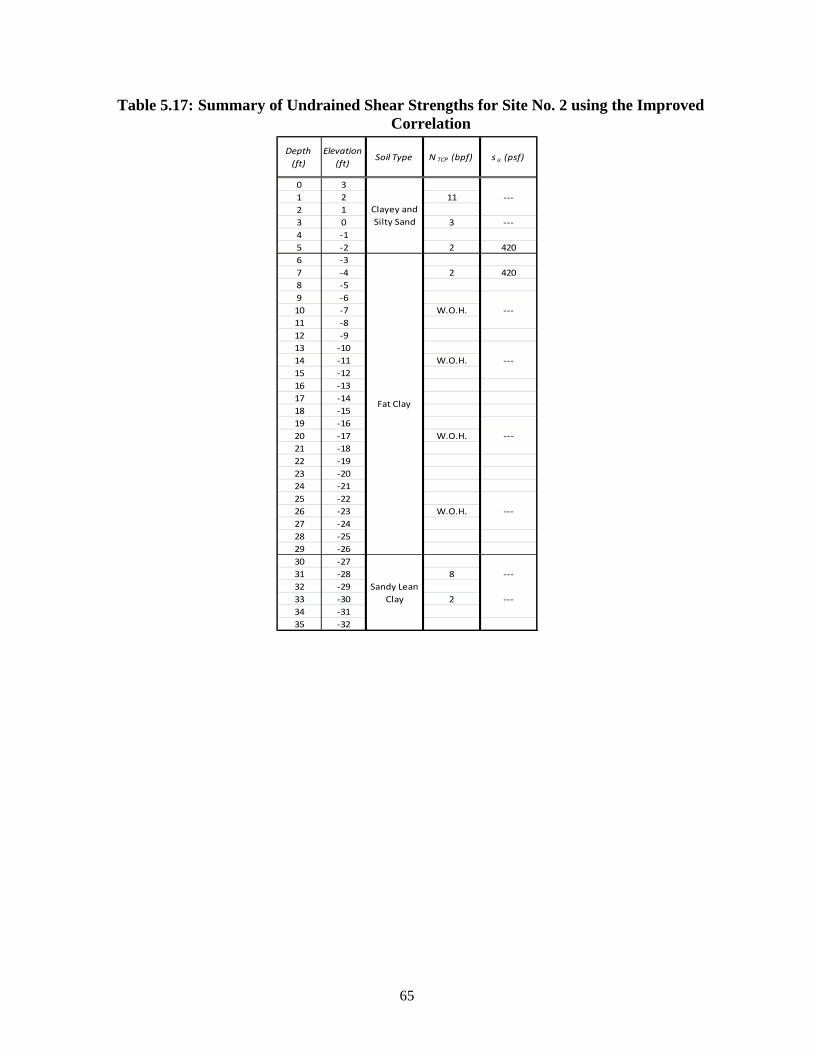
Table 5.8: Summary of Undrained Shear Strengths for Site No. 2 using the Improved Correlation ........................................................................................................................ 65
Table 5.9: Summary of Undrained Shear Strengths for Site No. 3 using the Improved Correlation ........................................................................................................................ 67
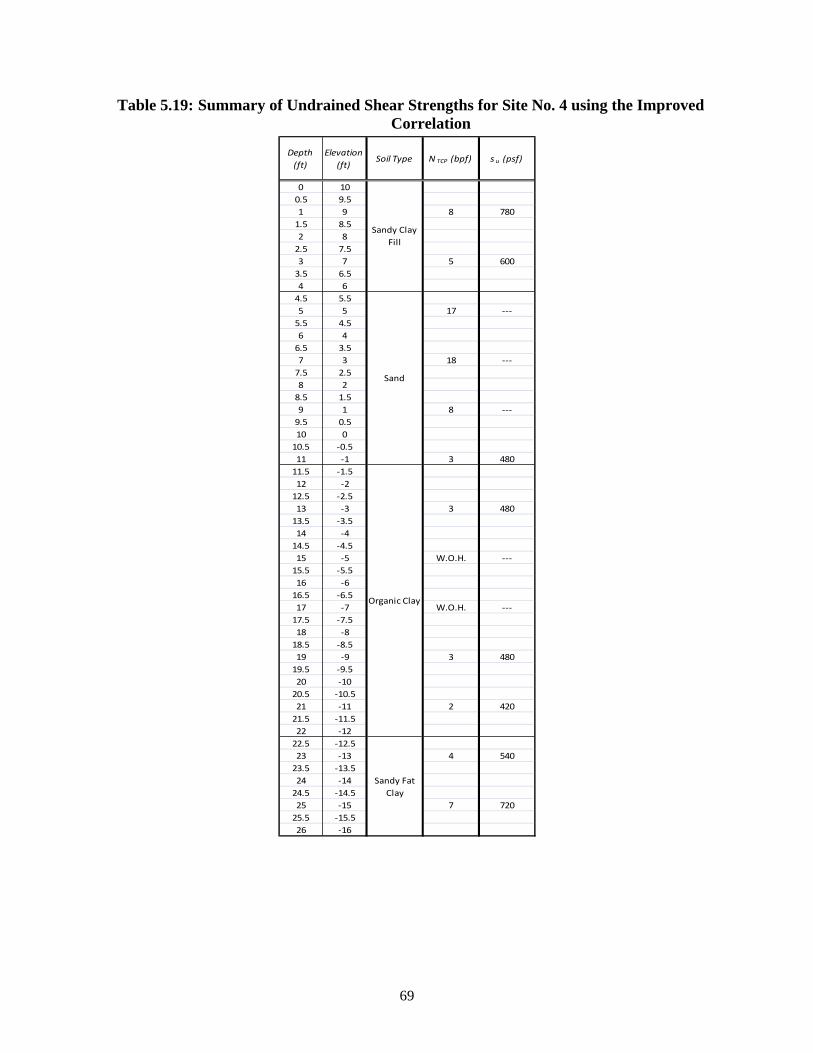
Table 5.10: Summary of Undrained Shear Strengths for Site No. 4 using the Improved Correlation ........................................................................................................................ 69
Table 5.11: Summary of Undrained Shear Strengths for Site No. 5 using the Improved Correlation ........................................................................................................................ 71
xii
Table 5.12: Summary of Undrained Shear Strengths for Site No. 6 using the Improved Correlation ........................................................................................................................ 73
Table 6.1: Load (Bearing Pressure) Required to Produce a Factor of Safety of 1.0 for each Site ............................................................................................................................ 80
Table 6.2: Factors of Safety and Depth of Critical Slip Surface Computed for Site No. 1 .......... 88
Table 6.3: Factors of Safety and Depth of Critical Slip Surface Computed for Site No. 3 .......... 88
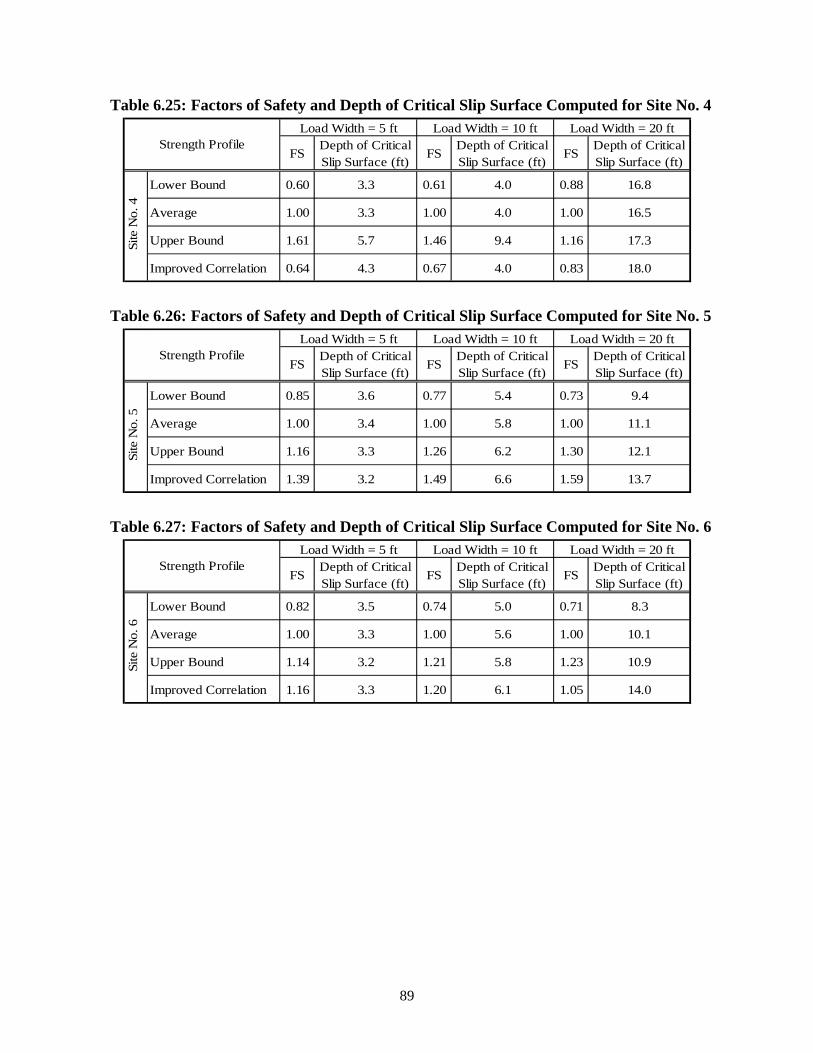
Table 6.4: Factors of Safety and Depth of Critical Slip Surface Computed for Site No. 4 .......... 89
Table 6.5: Factors of Safety and Depth of Critical Slip Surface Computed for Site No. 5 .......... 89
Table 6.6: Factors of Safety and Depth of Critical Slip Surface Computed for Site No. 6 .......... 89
Table 6.7: Average and Standard Deviation of the Factors of Safety Computed using UTEXAS4 ......................................................................................................................... 95
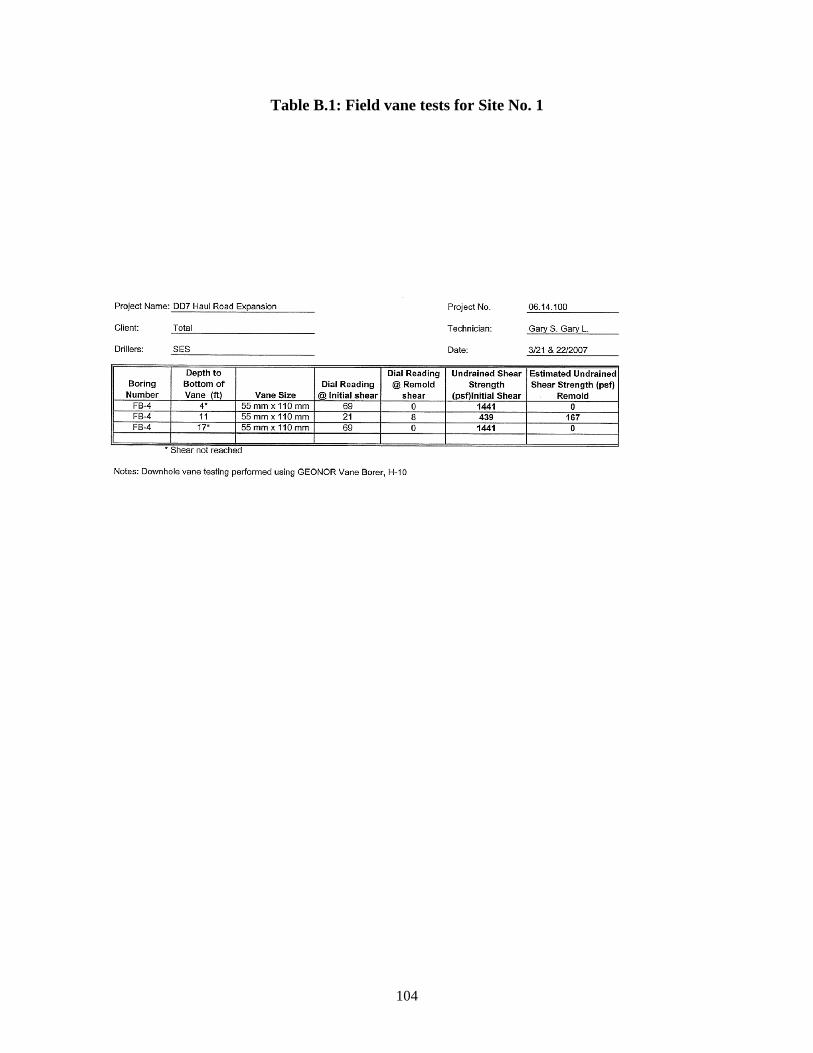
Table B.1: Field vane tests for Site No. 1 ................................................................................... 104
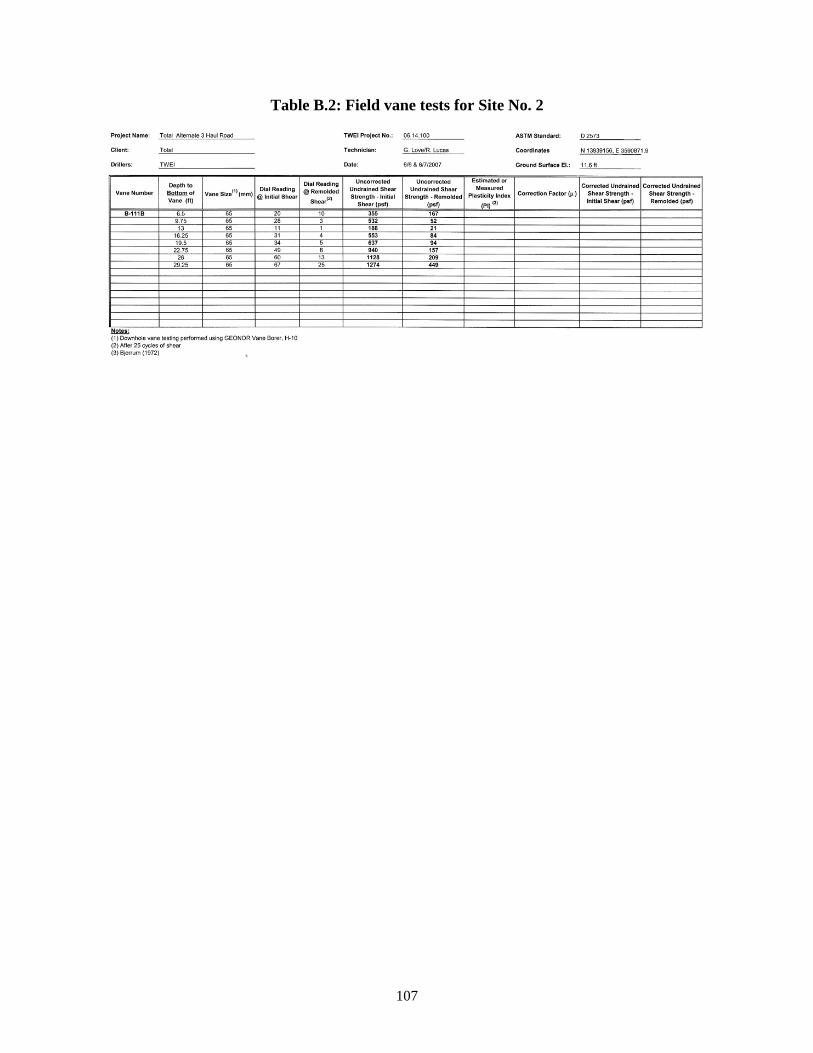
Table B.2: Field vane tests for Site No. 2 ................................................................................... 107
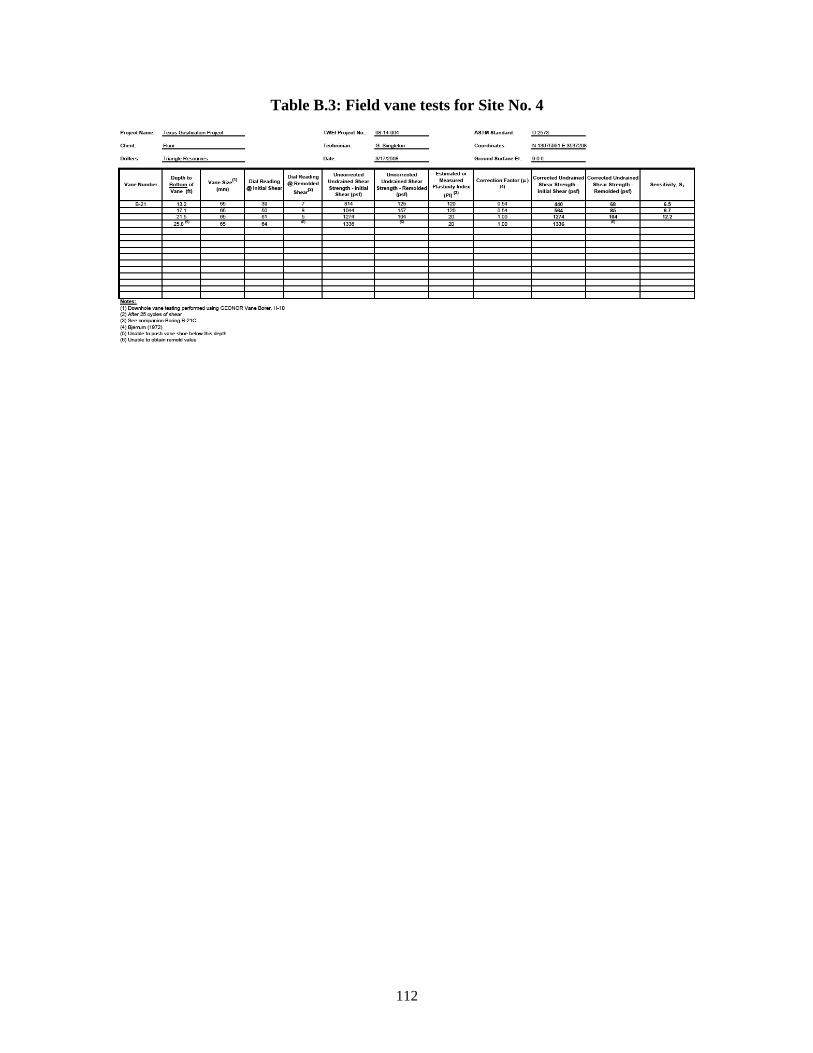
Table B.3: Field vane tests for Site No. 4 ................................................................................... 112
Table B.4: Field vane tests for Site No. 5 ................................................................................... 115
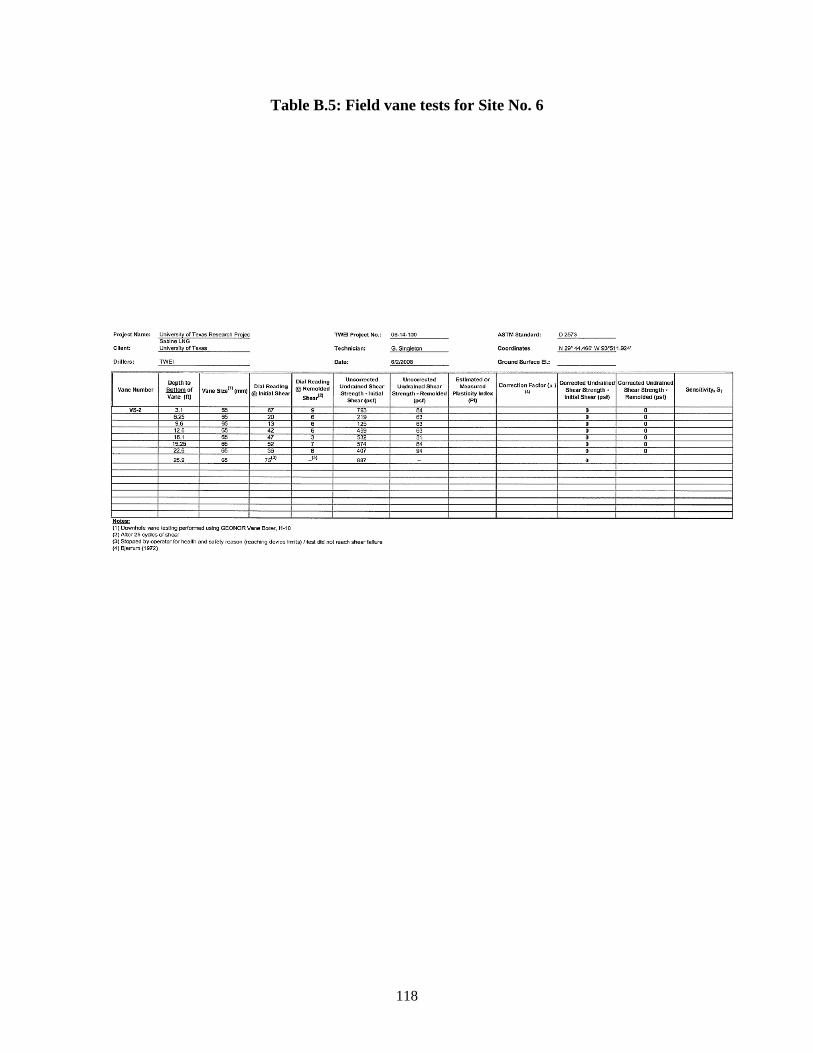
Table B.5: Field vane tests for Site No. 6 ................................................................................... 118
Table C.1: Constants used in the Computations ......................................................................... 119
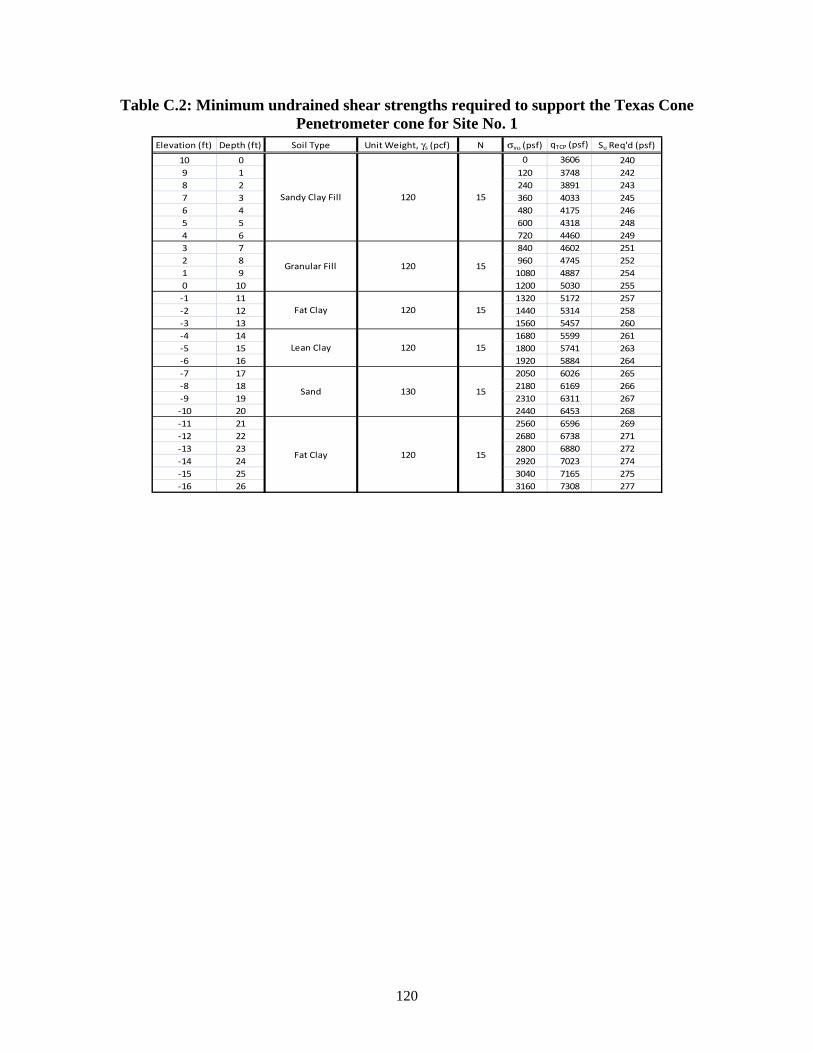
Table C.2: Minimum undrained shear strengths required to support the Texas Cone Penetrometer cone for Site No. 1 .................................................................................... 120
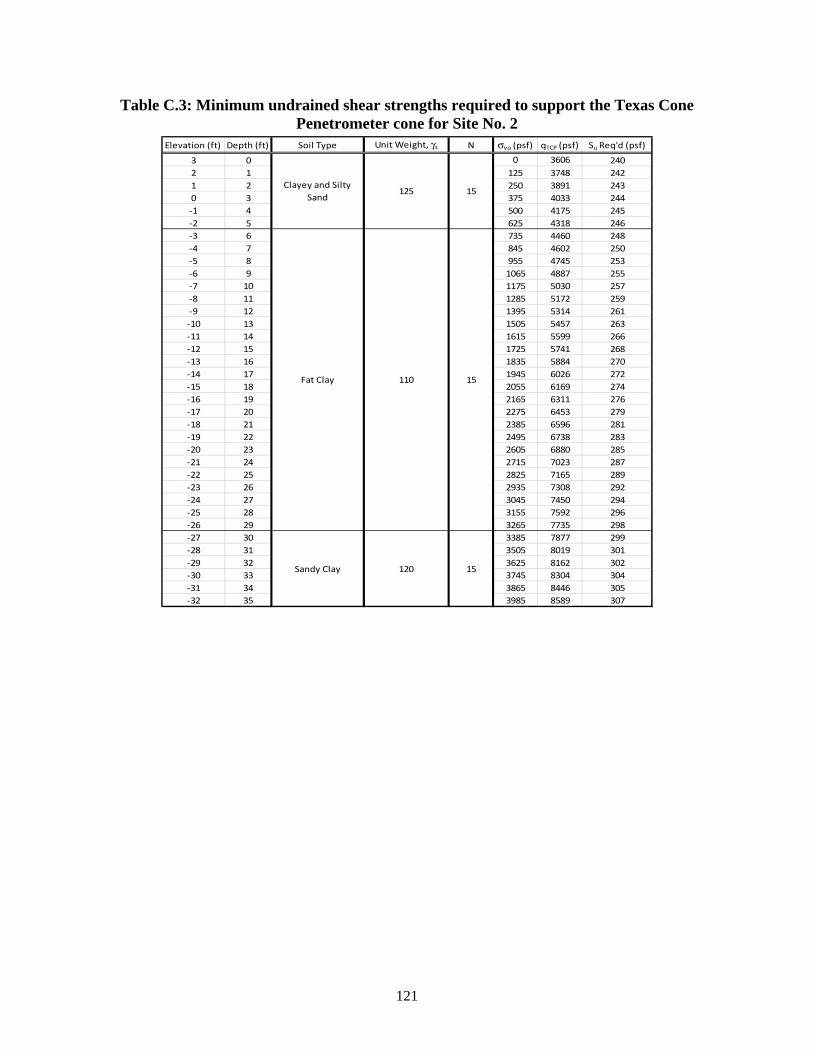
Table C.3: Minimum undrained shear strengths required to support the Texas Cone Penetrometer cone for Site No. 2 .................................................................................... 121
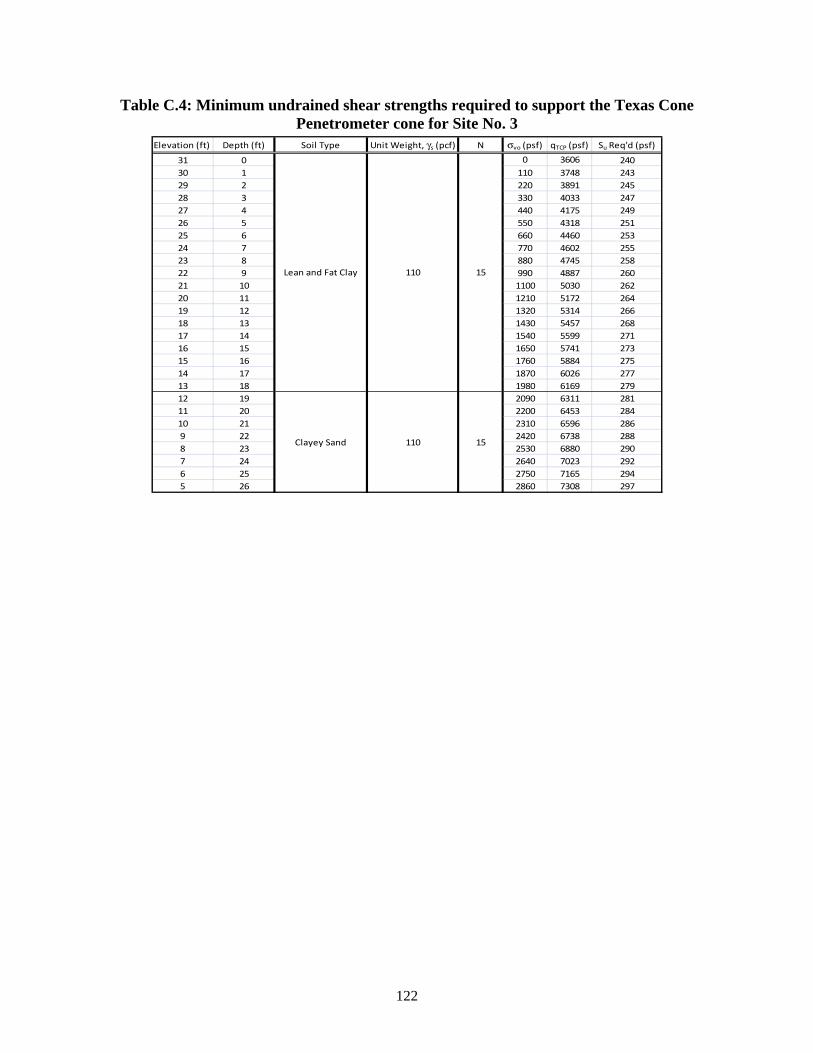
Table C.4: Minimum undrained shear strengths required to support the Texas Cone Penetrometer cone for Site No. 3 .................................................................................... 122
Table C.5: Minimum undrained shear strengths required to support the Texas Cone Penetrometer cone for Site No. 4 .................................................................................... 123
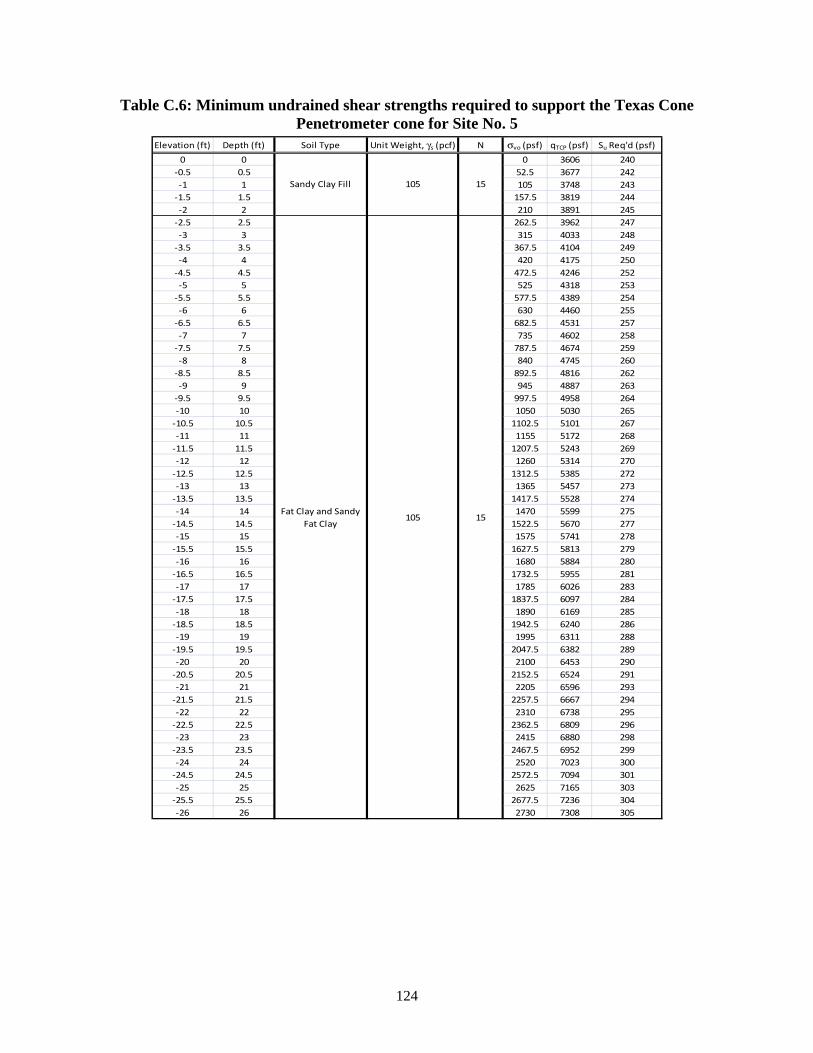
Table C.6: Minimum undrained shear strengths required to support the Texas Cone Penetrometer cone for Site No. 5 .................................................................................... 124
Table C.7: Minimum undrained shear strengths required to support the Texas Cone Penetrometer cone for Site No. 6 .................................................................................... 125
1
Chapter 1. Introduction
The Texas Department of Transportation (TxDOT) routinely performs Texas Cone Penetrometer tests as part of subsurface site investigations. The data obtained from these tests are often the only data available to TxDOT for estimating undrained shear strengths of the soil for preliminary design. Accordingly, correlations between Texas Cone Penetrometer blow count and undrained shear strength are frequently used to estimate undrained shear strength. A need exists for estimating undrained shear strengths of softer soils at shallow depths (30 feet or less).
The objective of this project was to develop an improved correlation between Texas Cone Penetrometer blow count and undrained shear strength for soft, clay soils in the upper approximately thirty feet of the ground. The Texas Cone Penetrometer test is discussed in detail in Chapter 2 and the existing correlation between Texas Cone Penetrometer blow count and undrained shear strength are described and evaluated in Chapter 3.
Subsurface explorations were carried out by Tolunay-Wong Engineers, Inc. (TWEI) at six sites in the Texas Gulf Coast region where soft soils were expected to exist. A series of borings was made at each site with Texas Cone Penetrometer tests, conventional (“Dutch”) piezocone penetration tests, thin-walled tube sampling, and vane shear tests. In some cases, depending upon the strength of the soils encountered and availability of field testing equipment, only some of the in-situ tests were performed. In addition to the field testing, laboratory testing was performed at The University of Texas at Austin on thin-walled tube samples collected in the field. Laboratory testing included index property tests, unconsolidated-undrained (UU) triaxial compression tests, isotropically consolidated-undrained triaxial compression tests (ICU), and one-dimensional consolidation tests. Chapter 4 summarizes the field and laboratory testing and provides a stratigraphic profile for each site.
The field and laboratory data were analyzed for each site by Varathungarajan (2008) and representative undrained shear strength profiles were developed (Appendix A). In Chapter 5, these profiles are used to evaluate the existing correlations between Texas Cone Penetrometer blow count and undrained shear strength as well as to develop an improved correlation for soft soils.
Several series of bearing capacity analyses were performed to provide a basis for evaluating the improved correlation presented in Chapter 5. These analyses were carried out assuming a uniform load of varying width and magnitude applied at the ground surface. The goal was to model a typical shallow foundation. The computer software UTEXAS4 (Wright 1999) was utilized to carry out the analyses. Bearing capacity analyses were performed for the undrained shear strength profiles established from laboratory, field vane, and piezocone penetration tests by Varathungarajan (2008) as well as for the undrained shear strength profiles determined from the Texas Cone Penetrometer blow counts using the improved correlation developed in this study. These analyses are presented in Chapter 6, where factors of safety are compared to estimate the reliability of the improved correlation. Conclusions and recommendations are presented in Chapter 7.
2
3
Chapter 2. Texas Cone Penetrometer (TCP) Test
A variety of in-situ tests are used in geotechnical engineering to estimate the undrained shear strength of saturated clays. One of the primary in-situ tests utilized by the Texas Department of Transportation (TxDOT) is the Texas Cone Penetrometer (TCP) test.
2.1 Apparatus and Procedure The TCP test is a dynamic penetration test performed to determine in-situ properties of
the subsurface soil. The test is performed in accordance with the TxDOT Test Procedure TEX-132-E. The TCP apparatus consists of a 3-inch diameter cone (see Figure 2.1) attached to a 1 and 3/4-inch O.D. drilling rod with a 3/16 inch wall thickness. A 170-pound hammer is positioned at the top of the drilling rod and allowed to fall freely a distance of 2 feet.
When performing the TCP test, a hole is advanced to the desired depth using an appropriate drilling method, which may vary depending upon the subsurface conditions. The cone is then seated into the undisturbed soil by driving the cone 12 blows or 12 inches, whichever is achieved first, into the soil. Once the cone is seated it is driven an additional 12 inches or 100 blows, whichever is reached first. In cases where the cone is driven the full 12 inches, the number of blows required to drive each 6 inches of penetration up to 12 inches is recorded. The total number of blows required for the two 6-inch increments are then recorded as the TCP blow count, denoted as NTCP. In cases where the cone is unable to be driven the full 12 inches, the penetration is recorded after every 50 blows up to 100 blows. In the event that the cone penetrates the soil at least 12 inches under its own weight without driving or travels a distance greater than 12 inches after 1 blow, the NTCP value is recorded as “weight of hammer (WOH).” In typical practice the TCP test is performed at 5-foot to 10-foot intervals and where a significant change in soil is detected.
4
Figure 2.1: Details of the Texas Cone Penetrometer after Vijayvergiya, Hudson and Reese
(1969)
2.2 Minimum Strength Required to Support the Texas Cone Penetrometer (TCP) Cone
For the present study, a bearing capacity analysis was performed to estimate the minimum undrained shear strength of saturated clays required to support the TCP cone at a given depth below the ground surface. This is believed to represent the maximum possible undrained shear strength of the soil when the blow count is reported as “weight of hammer.” Classical bearing capacity theory relates bearing capacity and undrained shear strength by an equation of the form
(2.1)
where qult is ultimate bearing capacity, N is a bearing capacity factor, su is undrained shear strength, and σv0 is total overburden stress prior to drilling. The total overburden stress is determined as follows, (2.2) where D is the depth which the TCP test is being performed and γs is the total unit weight of the overlying soil.
There have been numerous studies to determine the bearing capacity factor, N, in Equation 2.1. Most of these have been for either spread footings or deep foundations. None relate directly to a cone such as the one used in the Texas Cone Penetrometer test. However, studies have been performed for the Standard (“Dutch”) Cone Penetrometer (CPT) test and literature is available that discusses an empirical bearing capacity factor (also known as the cone factor) that
5
is used for this test. The CPT test uses a smaller cone than the TCP test, and the cone is pushed rather than driven with a hammer. Lunne et al. (1997) reported that the bearing capacity factor used in the CPT test generally ranges from 10 to 20. An empirical bearing capacity factor of 15 was used for the present analysis.
The stress imposed by the cone can be determined from the weight and dimension of the equipment used in performing the Texas Cone Penetrometer test. Pertinent information is shown in Table 2.1. The depth at which the TCP test is performed will also influence the imposed stress because of the length and weight of the drilling rod.
Table 2.1: Weight and Dimension of TCP Test Equipment
Cone Weight, WC (lbs) 7 Cone Area, AC (ft2) 0.049 Drilling Rod Weight, WDR (lbs/ft) 4 Drilling Rod Length, LDR (ft) VariesDrilling Rod Area, ADR (ft2) 0.006 Hammer Weight, WH (lbs) 170
Finally, the drilling fluid used imposes a stress on the soil at the bottom of the borehole.
Mud rotary drilling with a mixture of the groundwater and drilling fluid was used for all the borings performed in this study. The total unit weight of the drilling fluid was estimated to be 70 lbs. per cubic foot (pcf). Based on the above the total stress (qTCP) imposed on the bottom of the borehole by the cone can be expressed by the following equation:
( ))+ + + −
= c H DR DR DR c DRTCP
c
W W W L D A Aq
Aγ
(2.3)
where Wc is cone weight, WH is hammer weight, WDR is drilling rod weight, LDR is drilling rod length, γDF is total unit weight of the drilling fluid, D is depth at which the TCP test is being performed, AC is cone area, and ADR is drilling rod area. The weights of the cone (WC), hammer (WH) and drill rod (WDR) are the total weights in air rather than the weights when submerged in drilling fluid.
The minimum undrained shear strength required to support the TCP cone can be back-calculated by equating the ultimate bearing capacity (qult) in Equation 2.1 to the total imposed stress (qTCP) in Equation 2.2.
(2.4)
Solving for the minimum undrained shear strength required to support the cone then gives,
(2.5)
Equation 2.5 is used in subsequent chapters to determine the minimum strength required to support the TCP cone for each site investigated.
F
6
2.3 Example of Application An example of the minimum strength required to support the TCP cone has been
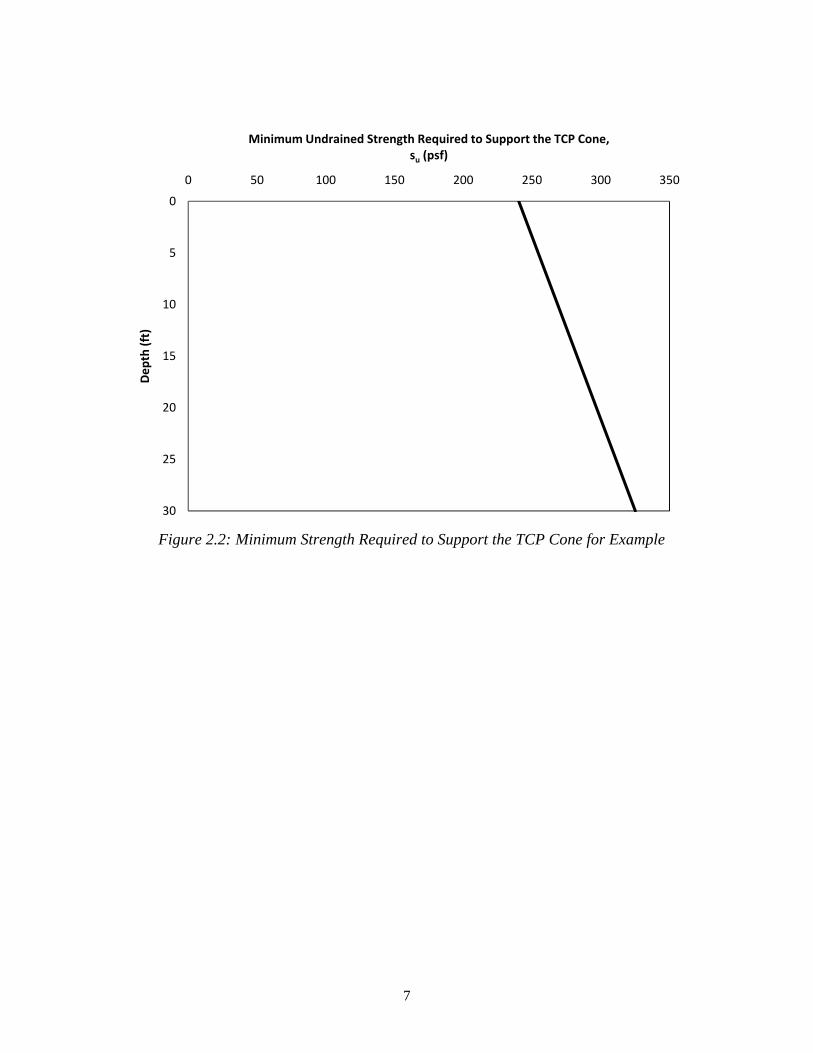
calculated for a simplified subsurface profile. The subsurface conditions consist of 25 feet of homogeneous clay with the groundwater table at the surface. The clay has a total unit weight of 100 lbs. per cubic foot (pcf). Table 2.2 summarizes the pertinent computations for undrained shear strength required to support the TCP cone for any given depth below the ground surface. The undrained strength profile is also plotted in Figure 2.2. For depths up to 30 feet, which are the depths of primary interest in this study, the required undrained shear strength varies from somewhat less than 300 psf (240 psf) to somewhat greater than 300 psf (325 psf). A value of 300 psf is a reasonable average value of the minimum undrained shear strength required to support the Texas Cone Penetrometer.
Table 2.2: Computations for Bearing Capacity Analysis Example Depth svo (psf) qTCP (psf) su (psf)
Figure 2.2: Minimum Strength Required to Support the TCP Cone for Example
0
5
10
15
20
25
30
0 50 100 150 200 250 300 350
Dep
th (f
t)Minimum Undrained Strength Required to Support the TCP Cone,
su (psf)
8
9
Chapter 3. Correlation of the Texas Cone Penetrometer Blow Count and Undrained Shear Strength
Several correlations exist between Texas Cone Penetrometer blow count and undrained shear strength. These were developed primarily from data for stronger soils and are typically used for the design of deep foundations. Studies have been performed by Hamoudi et al. (1974), Duderstadt et al. (1977), and Kim et al. (2007) to develop correlations between Texas Cone Penetrometer blow count and undrained shear strength of fine-grained soils. These studies are reviewed in this chapter.
3.1 Texas A&M University – Hamoudi et al. (1974), Research Report 10-1 Hamoudi et al. (1974) completed a study to improve the correlation between Texas Cone
Penetrometer blow count and unconsolidated-undrained shear strength of fine-grained soils. Hamoudi et al. (1974) considered the correlation previously being used by TxDOT to be overly conservative. They tested soils at four locations along the upper Texas Gulf Coast. The soil types investigated belonged to one of the following three categories based on the Unified Soil Classification System (USCS):
1) inorganic clays of high plasticity (CH classification); 2) inorganic clays of low plasticity which includes sandy clays, silty clays and lean
clays (CL classification); and 3) clayey sands (SC classification).
These classifications were broken down further into six categories that are described later.
At each of the four sites investigated, soil borings were made, Texas Cone Penetrometer tests were performed, and undisturbed samples were collected. Laboratory tests were performed on the undisturbed samples to classify the soil and measure the undrained shear strength. Undrained strength tests included the Texas Triaxial Test, Transmatic Triaxial Test, and ASTM Standard Unconsolidated-Undrained (UU) Triaxial Test. It has since been shown by O’Malley and Wright (1987) that the Texas Triaxial Test is unreliable for measuring the undrained shear strength of soft soils. Only the results obtained using the UU tests are examined for the purposes of this current report and analysis.
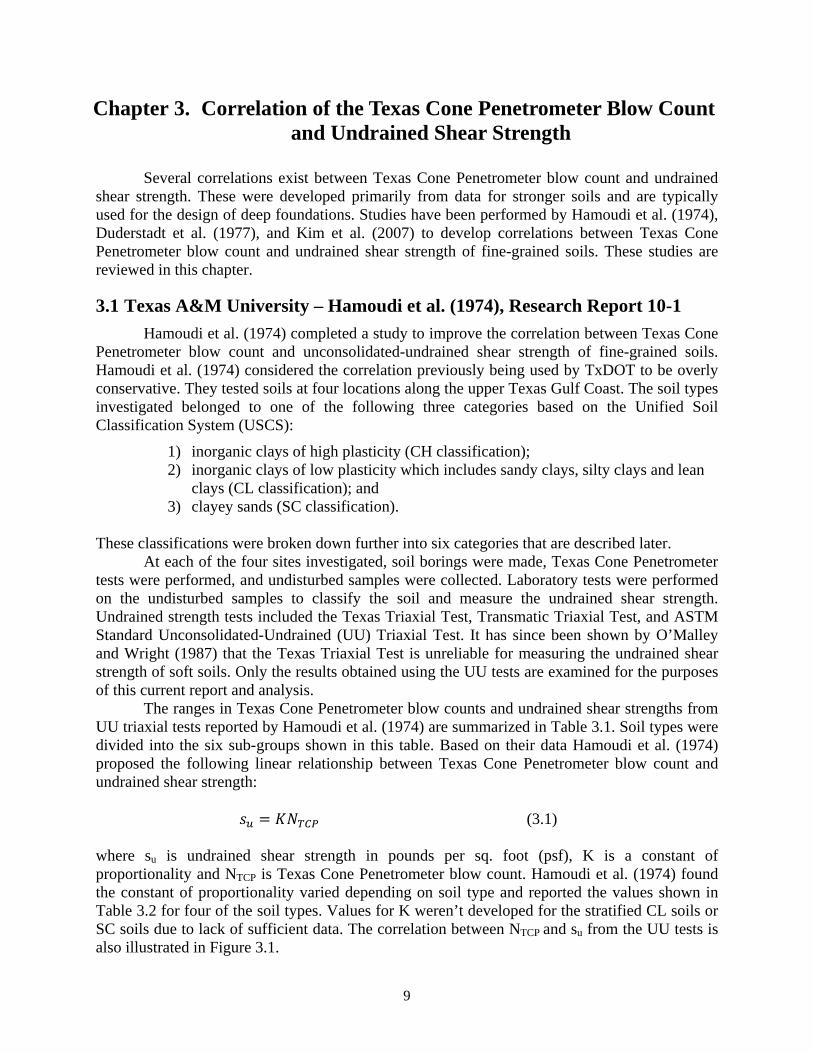
The ranges in Texas Cone Penetrometer blow counts and undrained shear strengths from UU triaxial tests reported by Hamoudi et al. (1974) are summarized in Table 3.1. Soil types were divided into the six sub-groups shown in this table. Based on their data Hamoudi et al. (1974) proposed the following linear relationship between Texas Cone Penetrometer blow count and undrained shear strength:
(3.1)
where su is undrained shear strength in pounds per sq. foot (psf), K is a constant of proportionality and NTCP is Texas Cone Penetrometer blow count. Hamoudi et al. (1974) found the constant of proportionality varied depending on soil type and reported the values shown in Table 3.2 for four of the soil types. Values for K weren’t developed for the stratified CL soils or SC soils due to lack of sufficient data. The correlation between NTCP and su from the UU tests is also illustrated in Figure 3.1.
10
Table 3.3: Texas Cone Penetrometer Blow Counts and Undrained Shear Strengths from Hamoudi et al. (1974)
Table 3.4: Constant of Proportionality for Various USCS Soil Classifications from Hamoudi et al. (1974)
USCS Soil Classification Constant of Proportionality, K, for UU Tests
Homogeneous CH Soils 140 CH Soils with Secondary
Structure 36
Silty CL Soils 126 Sandy CL Soils 106
11
Figure 3.3: Correlation of NTCP and su from Hamoudi et al. (1974)
3.2 Texas A&M University – Duderstadt et al. (1977), Research Report 10-3F Duderstadt et al. (1977) later extended the work by Hamoudi et al. (1974). Duderstadt et
al. (1977) tested one additional site located in the Texas Gulf Coast region. The additional site consisted exclusively of fine-grained soils. Two adjacent borings were made to obtain Texas Cone Penetrometer data and undisturbed samples. The field and laboratory investigation followed procedures similar to those of Hamoudi et al. (1974).
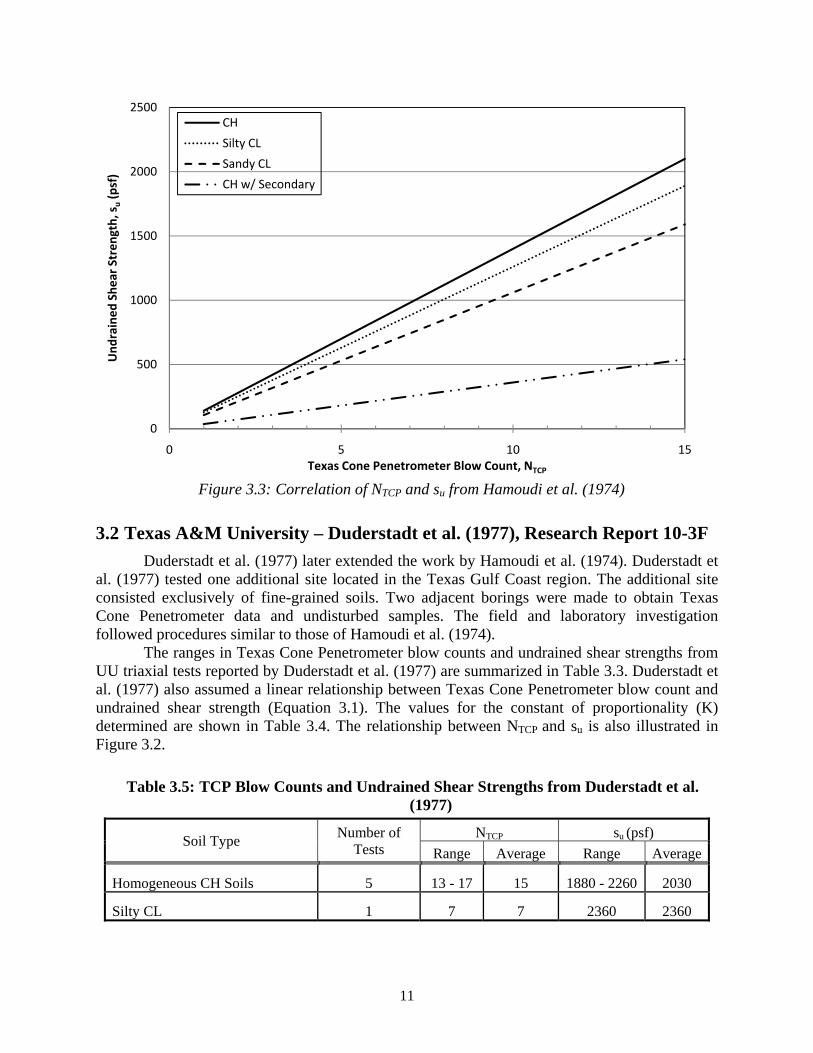
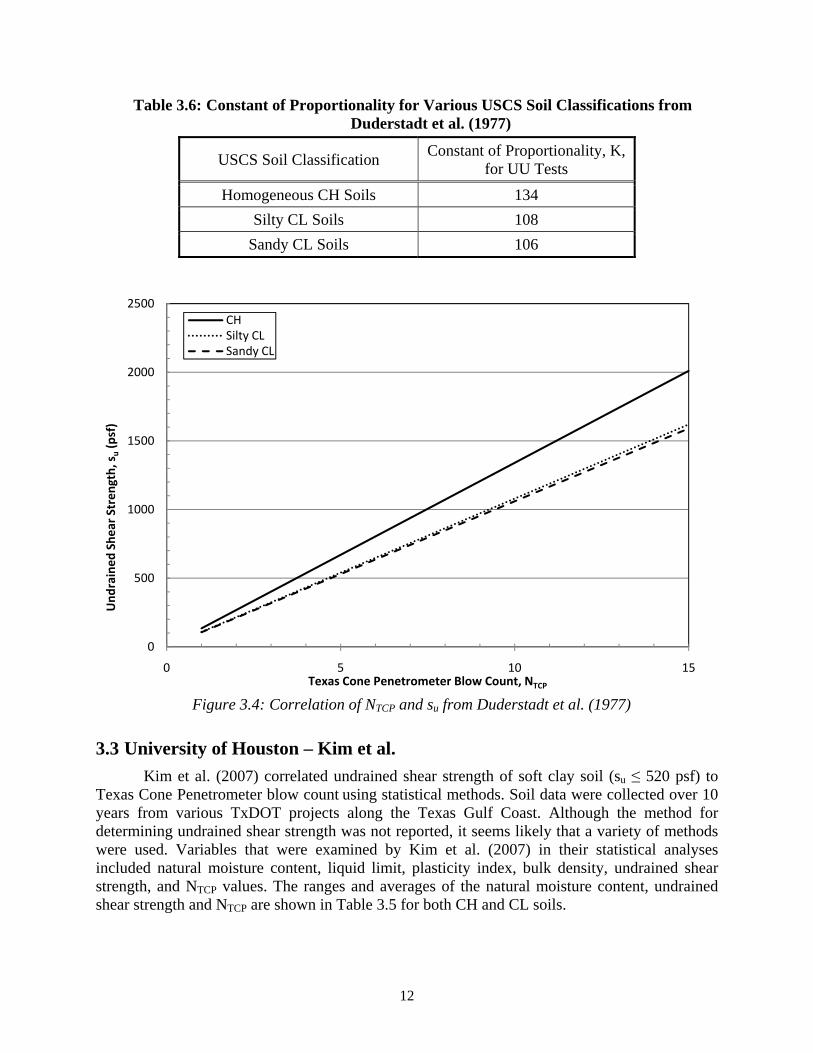
The ranges in Texas Cone Penetrometer blow counts and undrained shear strengths from UU triaxial tests reported by Duderstadt et al. (1977) are summarized in Table 3.3. Duderstadt et al. (1977) also assumed a linear relationship between Texas Cone Penetrometer blow count and undrained shear strength (Equation 3.1). The values for the constant of proportionality (K) determined are shown in Table 3.4. The relationship between NTCP and su is also illustrated in Figure 3.2.
Table 3.5: TCP Blow Counts and Undrained Shear Strengths from Duderstadt et al. (1977)
Table 3.6: Constant of Proportionality for Various USCS Soil Classifications from Duderstadt et al. (1977)
USCS Soil Classification Constant of Proportionality, K, for UU Tests
Homogeneous CH Soils 134 Silty CL Soils 108
Sandy CL Soils 106
Figure 3.4: Correlation of NTCP and su from Duderstadt et al. (1977)
3.3 University of Houston – Kim et al. Kim et al. (2007) correlated undrained shear strength of soft clay soil (su ≤ 520 psf) to
Texas Cone Penetrometer blow count using statistical methods. Soil data were collected over 10 years from various TxDOT projects along the Texas Gulf Coast. Although the method for determining undrained shear strength was not reported, it seems likely that a variety of methods were used. Variables that were examined by Kim et al. (2007) in their statistical analyses included natural moisture content, liquid limit, plasticity index, bulk density, undrained shear strength, and NTCP values. The ranges and averages of the natural moisture content, undrained shear strength and NTCP are shown in Table 3.5 for both CH and CL soils.
0
500
1000
1500
2000
2500
0 5 10 15
Und
rain
ed S
hear
Str
engt
h, s
u(p
sf)
Texas Cone Penetrometer Blow Count, NTCP
CHSilty CLSandy CL
13
Table 3.7: Ranges and Averages for Variables from Kim et al. (2007)
Soil Type w (%) su (psf) NTCP
CH Soils Range 24.6 - 79 115 - 533 2 - 25
Mean 43.3 418 7.6
CL Soils Range 19 - 59 58 - 511 2 - 55
Mean 34.6 346 18
Kim et al. (2007) concluded that Texas Cone Penetrometer blow count and undrained
shear strength of cohesive soils was affected by both depth and moisture content. Based on their analysis of the data, the following equation was proposed to relate the undrained shear strength of soft clay in the Texas Gulf Coast to Texas Cone Penetrometer blow count:
(3.2)
where su is undrained shear strength in lbs. per square inch (psi), d is the depth in feet and w is the moisture content in percent. The parameters α and β were determined for both fat clays (CH) and lean clays (CL) by least squares fitting of the data and are summarized in Table 3.6.
Table 3.8: Parameter from Least Squares Fitting of the Data for the Correlation from Kim et al. (2007)
3.4 Summary There are several limitations in the correlation developed by Kim et al. (2007). The
correlation suggests that strength may increase with an increase in moisture content which is not the typical behavior for most soils. Although moisture content probably reduces the NTCP value in Equation 3.2 to partially offset the increase in strength due to the moisture content multiplier (w), the equation still appears fundamentally illogical. Thus, basing a new correlation upon the findings of Kim et al. (2007) seems inappropriate.
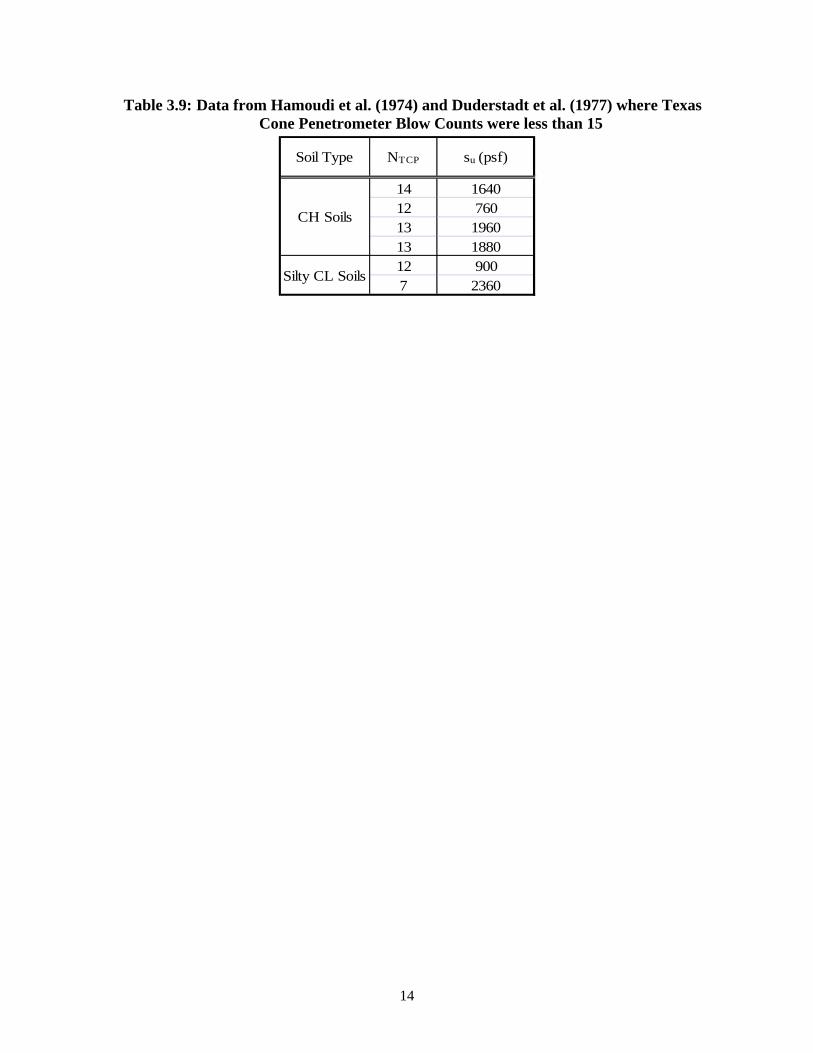
Although the correlations by Hamoudi et al. (1974) and Duderstadt et al. (1977) may be reasonable, there are only a total of 6 samples between the two studies where Texas Cone Penetrometer blow counts were less than 15 as shown in Table 3.7. Only one blow count value shown in this table is less than 10. A need exists to at least verify the correlations by Hamoudi et al. (1974) and Duderstadt et al. (1977) for weaker soils and possibly develop an alternative or improved correlation.
14
Table 3.9: Data from Hamoudi et al. (1974) and Duderstadt et al. (1977) where Texas Cone Penetrometer Blow Counts were less than 15
14 164012 76013 196013 188012 9007 2360
Soil Type NTCP su (psf)
CH Soils
Silty CL Soils
15
Chapter 4. Overview of Subsurface Explorations
Subsurface explorations were carried out by Tolunay-Wong Engineers, Inc. (TWEI) at six sites in the Texas Gulf Coast region where soft soils were expected to exist. Field testing included a series of borings with Texas Cone Penetrometer tests, conventional (“Dutch”) piezocone penetration tests, thin-walled tube sampling, and vane shear tests. Laboratory testing was subsequently performed at The University of Texas at Austin on the samples obtained in the field. The test boring logs with the subsurface data and observations are included in Appendix B.
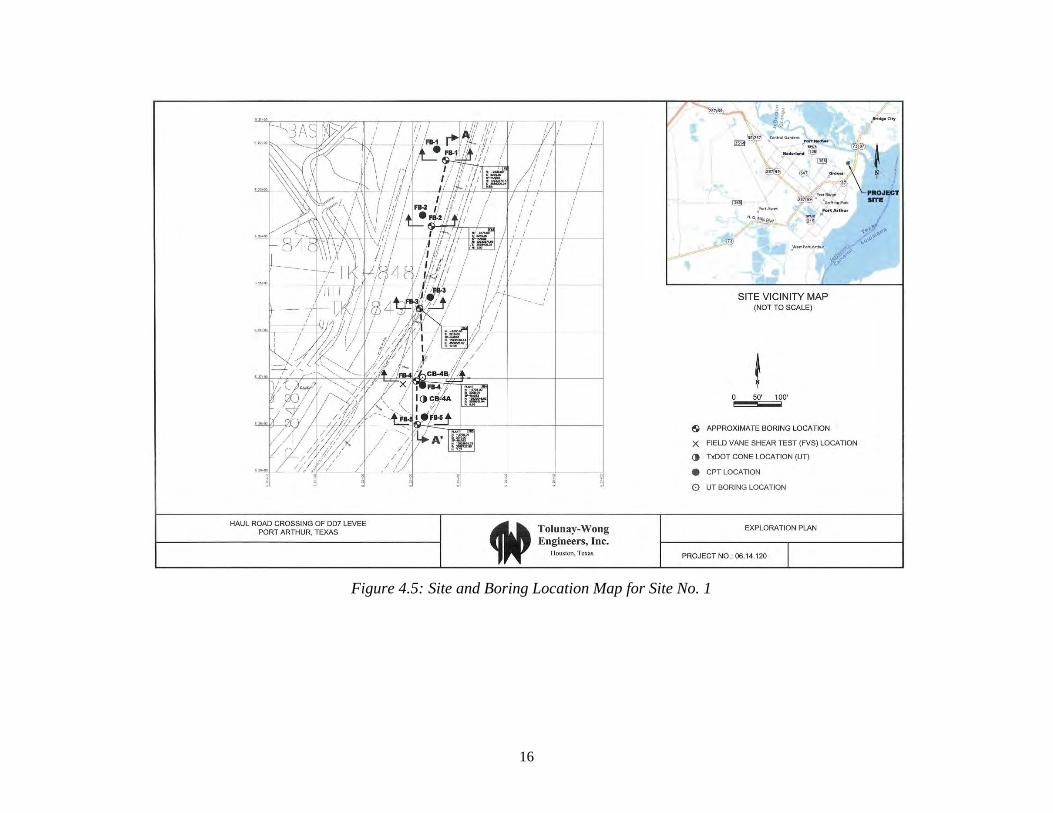
4.1 Site No. 1 – Port Arthur, TX (Site A) This site is located near the intersection of Procter Street and Main Avenue in Port
Arthur, Jefferson County, Texas (Figure 4.1). The site lies within the West Crane Bayou just west of Sabine Lake. The existing ground surface at the site is at an elevation of approximately +10 feet.
Review of Published Literature
According to the regional Geologic Atlas of Texas (Houston Sheet), the site is underlain by Alluvium (Qal) and the Beaumont Formation (Qb) (Flawn, 1968). The Alluvium consists of clay, silt, sand and organic matter. The depositional environments include point bar, natural levee, stream channel, backswamp, coastal marsh, mud flat, and narrow beach deposits. The Beaumont Formation consists of sand, silt, clay, and gravel. The depositional environments include point bar, natural levee, stream channel, and backswamp deposits.
Field Exploration
The field exploration program consisted of the following:
• drilling and sampling one 26-foot-deep boring with Texas Highway Department cone penetration (TCP) tests performed at 2-foot intervals;
• drilling, logging and obtaining thin-walled tube soil samples continuously for a second 26-foot-deep boring;
• conducting three field vane shear tests at varying depths; and
• conducting seven 6- to 30-foot-deep piezocone penetration tests. The location of the borings and additional field tests was selected by Tolunay-Wong Engineers, Inc. All of the borings were located in close proximity to one another within the subject site. The locations are shown on Figure 4.1.
16
Figure 4.5: Site and Boring Location Map for Site No. 1
17
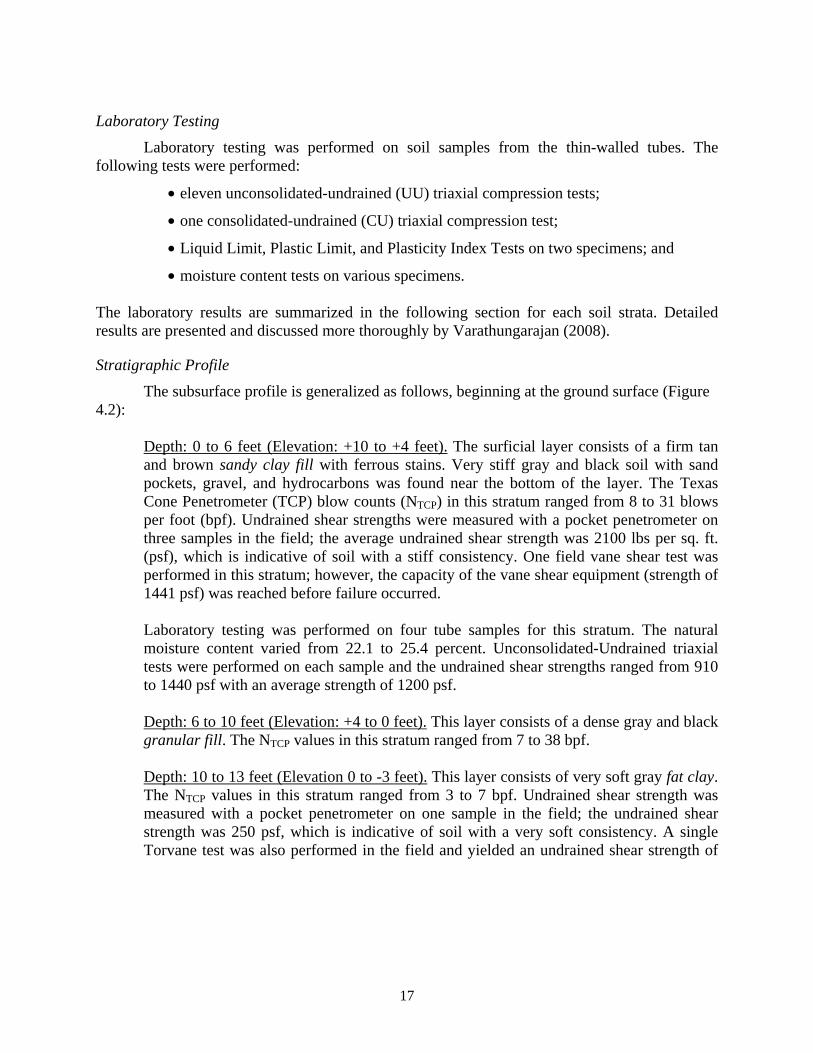
Laboratory Testing
Laboratory testing was performed on soil samples from the thin-walled tubes. The following tests were performed:
• one consolidated-undrained (CU) triaxial compression test;
• Liquid Limit, Plastic Limit, and Plasticity Index Tests on two specimens; and
• moisture content tests on various specimens. The laboratory results are summarized in the following section for each soil strata. Detailed results are presented and discussed more thoroughly by Varathungarajan (2008).
Stratigraphic Profile
The subsurface profile is generalized as follows, beginning at the ground surface (Figure 4.2):
Depth: 0 to 6 feet (Elevation: +10 to +4 feet). The surficial layer consists of a firm tan and brown sandy clay fill with ferrous stains. Very stiff gray and black soil with sand pockets, gravel, and hydrocarbons was found near the bottom of the layer. The Texas Cone Penetrometer (TCP) blow counts (NTCP) in this stratum ranged from 8 to 31 blows per foot (bpf). Undrained shear strengths were measured with a pocket penetrometer on three samples in the field; the average undrained shear strength was 2100 lbs per sq. ft. (psf), which is indicative of soil with a stiff consistency. One field vane shear test was performed in this stratum; however, the capacity of the vane shear equipment (strength of 1441 psf) was reached before failure occurred.
Laboratory testing was performed on four tube samples for this stratum. The natural moisture content varied from 22.1 to 25.4 percent. Unconsolidated-Undrained triaxial tests were performed on each sample and the undrained shear strengths ranged from 910 to 1440 psf with an average strength of 1200 psf.
Depth: 6 to 10 feet (Elevation: +4 to 0 feet). This layer consists of a dense gray and black granular fill. The NTCP values in this stratum ranged from 7 to 38 bpf. Depth: 10 to 13 feet (Elevation 0 to -3 feet). This layer consists of very soft gray fat clay. The NTCP values in this stratum ranged from 3 to 7 bpf. Undrained shear strength was measured with a pocket penetrometer on one sample in the field; the undrained shear strength was 250 psf, which is indicative of soil with a very soft consistency. A single Torvane test was also performed in the field and yielded an undrained shear strength of
18
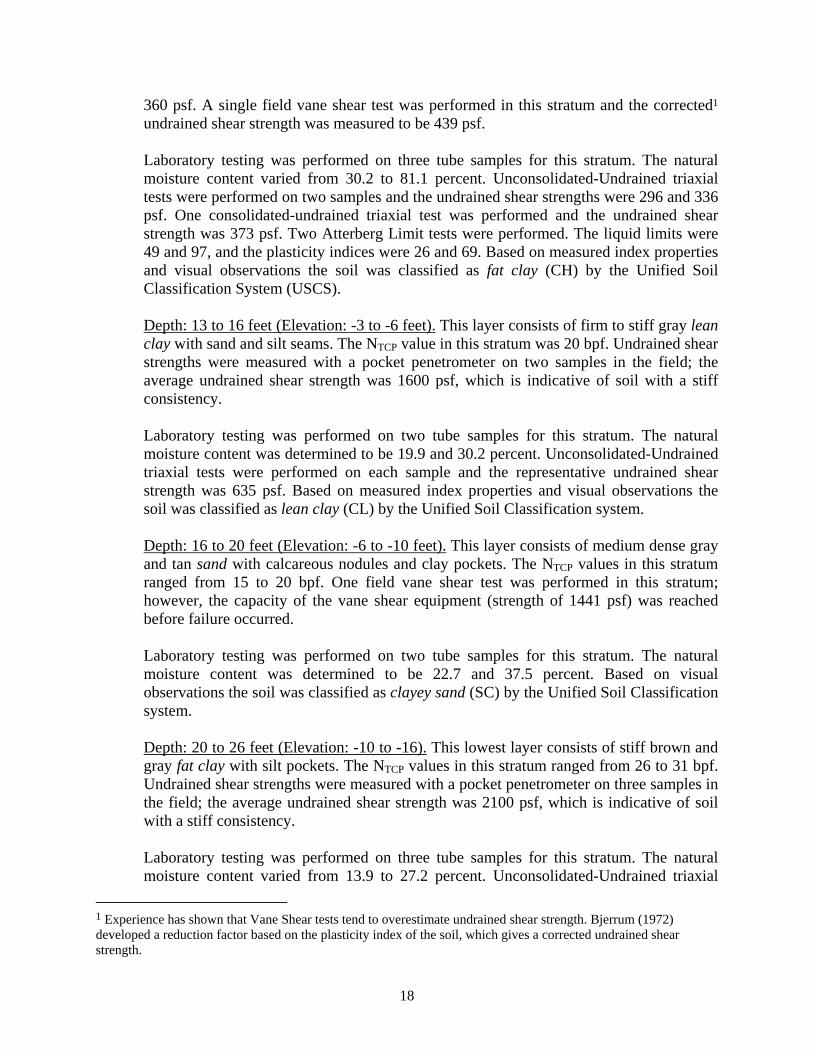
360 psf. A single field vane shear test was performed in this stratum and the corrected1 undrained shear strength was measured to be 439 psf.
Laboratory testing was performed on three tube samples for this stratum. The natural moisture content varied from 30.2 to 81.1 percent. Unconsolidated-Undrained triaxial tests were performed on two samples and the undrained shear strengths were 296 and 336 psf. One consolidated-undrained triaxial test was performed and the undrained shear strength was 373 psf. Two Atterberg Limit tests were performed. The liquid limits were 49 and 97, and the plasticity indices were 26 and 69. Based on measured index properties and visual observations the soil was classified as fat clay (CH) by the Unified Soil Classification System (USCS).
Depth: 13 to 16 feet (Elevation: -3 to -6 feet). This layer consists of firm to stiff gray lean clay with sand and silt seams. The NTCP value in this stratum was 20 bpf. Undrained shear strengths were measured with a pocket penetrometer on two samples in the field; the average undrained shear strength was 1600 psf, which is indicative of soil with a stiff consistency.
Laboratory testing was performed on two tube samples for this stratum. The natural moisture content was determined to be 19.9 and 30.2 percent. Unconsolidated-Undrained triaxial tests were performed on each sample and the representative undrained shear strength was 635 psf. Based on measured index properties and visual observations the soil was classified as lean clay (CL) by the Unified Soil Classification system.
Depth: 16 to 20 feet (Elevation: -6 to -10 feet). This layer consists of medium dense gray and tan sand with calcareous nodules and clay pockets. The NTCP values in this stratum ranged from 15 to 20 bpf. One field vane shear test was performed in this stratum; however, the capacity of the vane shear equipment (strength of 1441 psf) was reached before failure occurred.
Laboratory testing was performed on two tube samples for this stratum. The natural moisture content was determined to be 22.7 and 37.5 percent. Based on visual observations the soil was classified as clayey sand (SC) by the Unified Soil Classification system.
Depth: 20 to 26 feet (Elevation: -10 to -16). This lowest layer consists of stiff brown and gray fat clay with silt pockets. The NTCP values in this stratum ranged from 26 to 31 bpf. Undrained shear strengths were measured with a pocket penetrometer on three samples in the field; the average undrained shear strength was 2100 psf, which is indicative of soil with a stiff consistency.
Laboratory testing was performed on three tube samples for this stratum. The natural moisture content varied from 13.9 to 27.2 percent. Unconsolidated-Undrained triaxial
1 Experience has shown that Vane Shear tests tend to overestimate undrained shear strength. Bjerrum (1972) developed a reduction factor based on the plasticity index of the soil, which gives a corrected undrained shear strength.
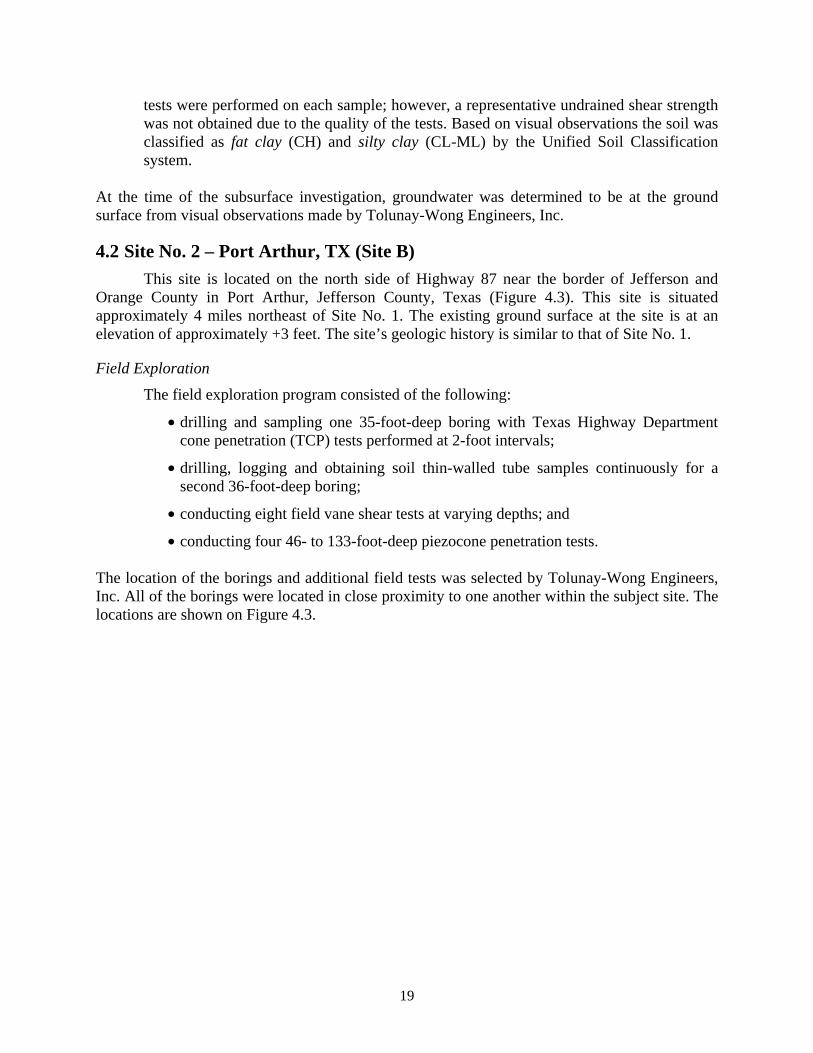
19
tests were performed on each sample; however, a representative undrained shear strength was not obtained due to the quality of the tests. Based on visual observations the soil was classified as fat clay (CH) and silty clay (CL-ML) by the Unified Soil Classification system.
At the time of the subsurface investigation, groundwater was determined to be at the ground surface from visual observations made by Tolunay-Wong Engineers, Inc.
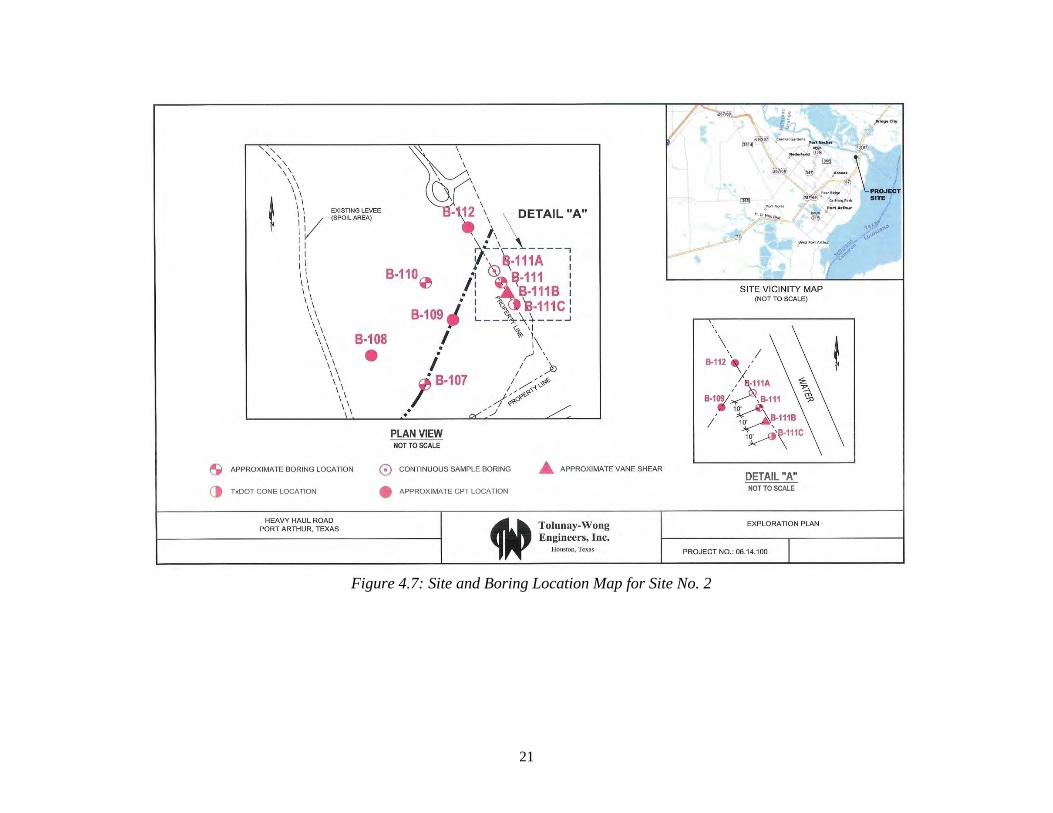
4.2 Site No. 2 – Port Arthur, TX (Site B) This site is located on the north side of Highway 87 near the border of Jefferson and
Orange County in Port Arthur, Jefferson County, Texas (Figure 4.3). This site is situated approximately 4 miles northeast of Site No. 1. The existing ground surface at the site is at an elevation of approximately +3 feet. The site’s geologic history is similar to that of Site No. 1.
Field Exploration
The field exploration program consisted of the following:
• drilling and sampling one 35-foot-deep boring with Texas Highway Department cone penetration (TCP) tests performed at 2-foot intervals;
• drilling, logging and obtaining soil thin-walled tube samples continuously for a second 36-foot-deep boring;
• conducting eight field vane shear tests at varying depths; and
• conducting four 46- to 133-foot-deep piezocone penetration tests. The location of the borings and additional field tests was selected by Tolunay-Wong Engineers, Inc. All of the borings were located in close proximity to one another within the subject site. The locations are shown on Figure 4.3.
20
Sandy Clay Fill
Granular Fill
Fat Clay (CH)
Lean Clay with Sand and Silt (CL)
Med. Dense Sand with Clay Pockets
Fat Clay with Silt Pockets (CH)
0
5
10
10
5
Depth (ft) Elevation (ft)
Ground Surface
Groundwater Table
15
20
25
0
-5
-10
-15
Figure 4.6: Stratigraphic Profile of Site No. 1
21
Figure 4.7: Site and Boring Location Map for Site No. 2
22
Laboratory Testing
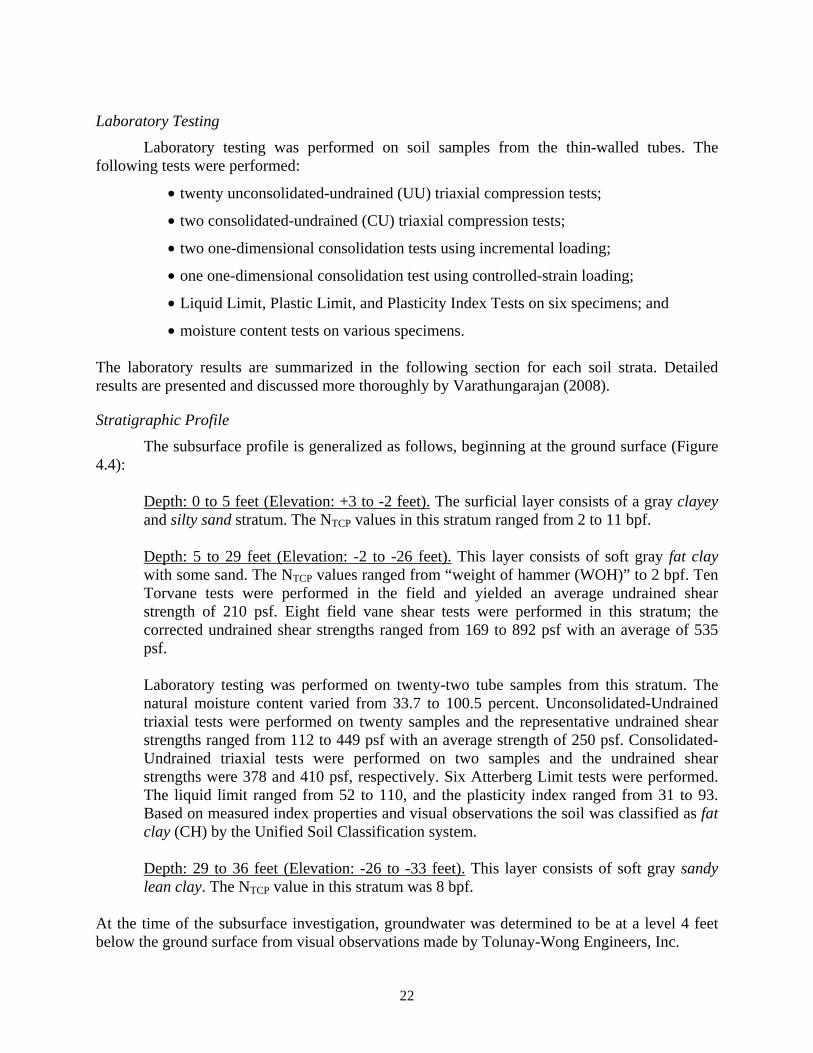
Laboratory testing was performed on soil samples from the thin-walled tubes. The following tests were performed:
• two consolidated-undrained (CU) triaxial compression tests;
• two one-dimensional consolidation tests using incremental loading;
• one one-dimensional consolidation test using controlled-strain loading;
• Liquid Limit, Plastic Limit, and Plasticity Index Tests on six specimens; and
• moisture content tests on various specimens. The laboratory results are summarized in the following section for each soil strata. Detailed results are presented and discussed more thoroughly by Varathungarajan (2008).
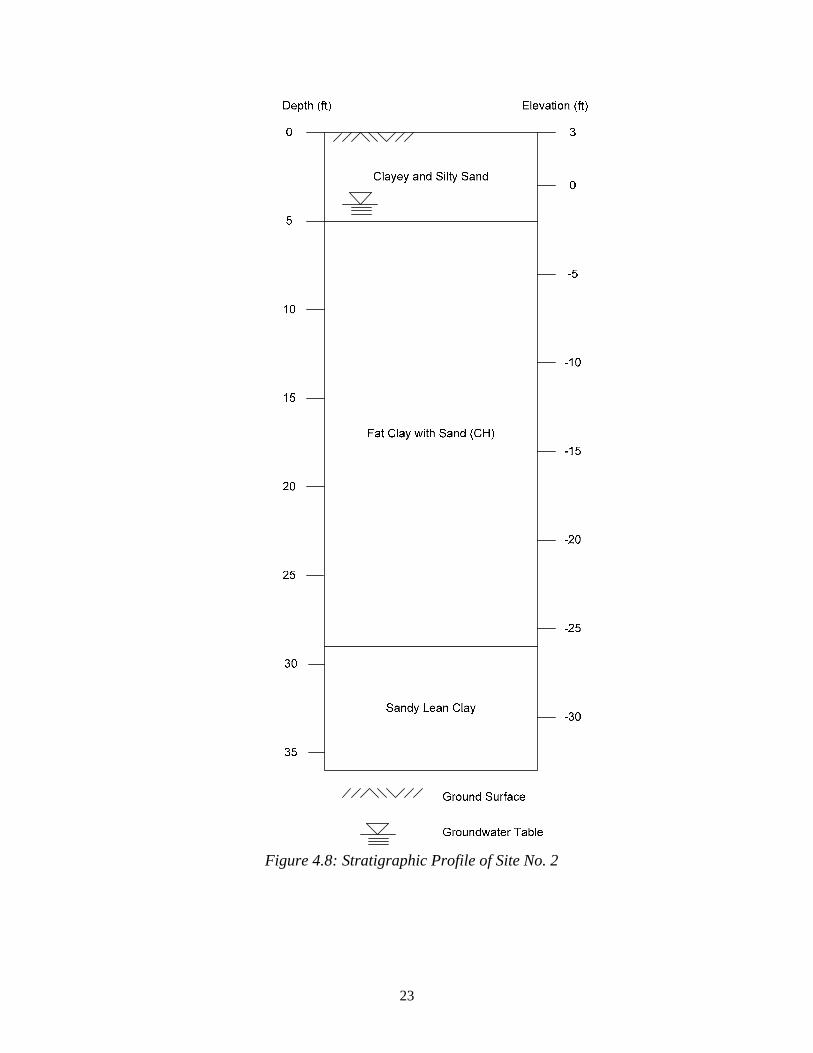
Stratigraphic Profile
The subsurface profile is generalized as follows, beginning at the ground surface (Figure 4.4):
Depth: 0 to 5 feet (Elevation: +3 to -2 feet). The surficial layer consists of a gray clayey and silty sand stratum. The NTCP values in this stratum ranged from 2 to 11 bpf.
Depth: 5 to 29 feet (Elevation: -2 to -26 feet). This layer consists of soft gray fat clay with some sand. The NTCP values ranged from “weight of hammer (WOH)” to 2 bpf. Ten Torvane tests were performed in the field and yielded an average undrained shear strength of 210 psf. Eight field vane shear tests were performed in this stratum; the corrected undrained shear strengths ranged from 169 to 892 psf with an average of 535 psf.
Laboratory testing was performed on twenty-two tube samples from this stratum. The natural moisture content varied from 33.7 to 100.5 percent. Unconsolidated-Undrained triaxial tests were performed on twenty samples and the representative undrained shear strengths ranged from 112 to 449 psf with an average strength of 250 psf. Consolidated-Undrained triaxial tests were performed on two samples and the undrained shear strengths were 378 and 410 psf, respectively. Six Atterberg Limit tests were performed. The liquid limit ranged from 52 to 110, and the plasticity index ranged from 31 to 93. Based on measured index properties and visual observations the soil was classified as fat clay (CH) by the Unified Soil Classification system.
Depth: 29 to 36 feet (Elevation: -26 to -33 feet). This layer consists of soft gray sandy lean clay. The NTCP value in this stratum was 8 bpf.
At the time of the subsurface investigation, groundwater was determined to be at a level 4 feet below the ground surface from visual observations made by Tolunay-Wong Engineers, Inc.
23
Figure 4.8: Stratigraphic Profile of Site No. 2
24
4.3 Site No. 3 – Mont Belvieu, TX This site is located north of FM 1942 and west of Cedar Bayou in Mont Belvieu, Harris,
and Chambers Counties, Texas (Figure 4.5). The existing ground surface at the site is at an elevation of approximately +31 feet.
Review of Published Literature
According to the regional Geologic Atlas of Texas (Houston Sheet), the site is underlain by the Beaumont Formation (Qb) (Flawn, 1968). The Beaumont Formation consists of sand, silt, clay, and gravel. The depositional environments include point bar, natural levee, stream channel, and backswamp deposits.
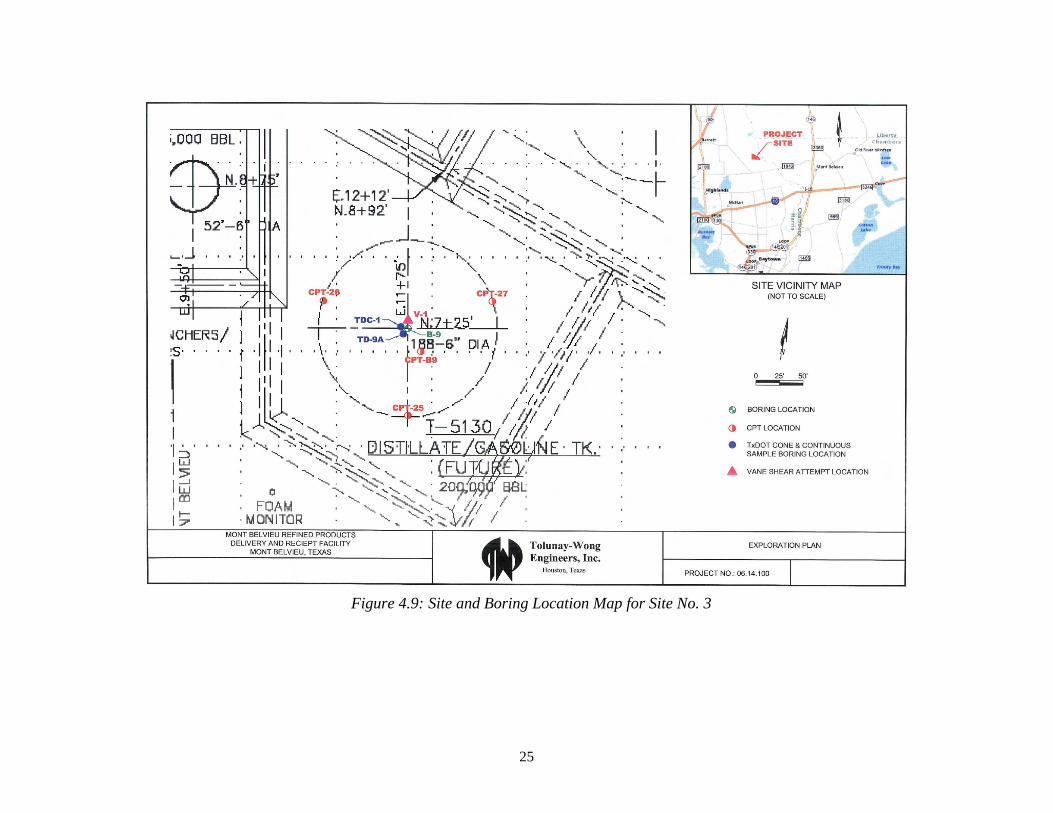
Field Exploration
The field exploration program consisted of the following:
• drilling and sampling one 26-foot-deep boring with Texas Highway Department cone penetration (TCP) tests performed at 2-foot intervals;
• drilling, logging and obtaining thin-walled tube soil samples continuously for a second 26-foot-deep boring; and
• conducting four 25- to 75-foot-deep piezocone penetration tests. Vane shear tests could not be performed due to the high strength of the soil at this site. The location of the borings and additional field tests was selected by Tolunay-Wong Engineers, Inc. All of the borings were located in close proximity to one another within the subject site. The locations are shown on Figure 4.5.
25
Figure 4.9: Site and Boring Location Map for Site No. 3
26
Laboratory Testing
Laboratory testing was performed on soil samples from the thin-walled tubes. The following tests were performed:
• nine unconsolidated-undrained (UU) triaxial compression tests;
• three consolidated-undrained (CU) triaxial compression tests;
• Liquid Limit, Plastic Limit, and Plasticity Index Tests on six specimens; and
• moisture content tests on various specimens. The laboratory results are summarized in the following section for each soil strata. Detailed results are presented and discussed more thoroughly by Varathungarajan (2008).
Stratigraphic Profile
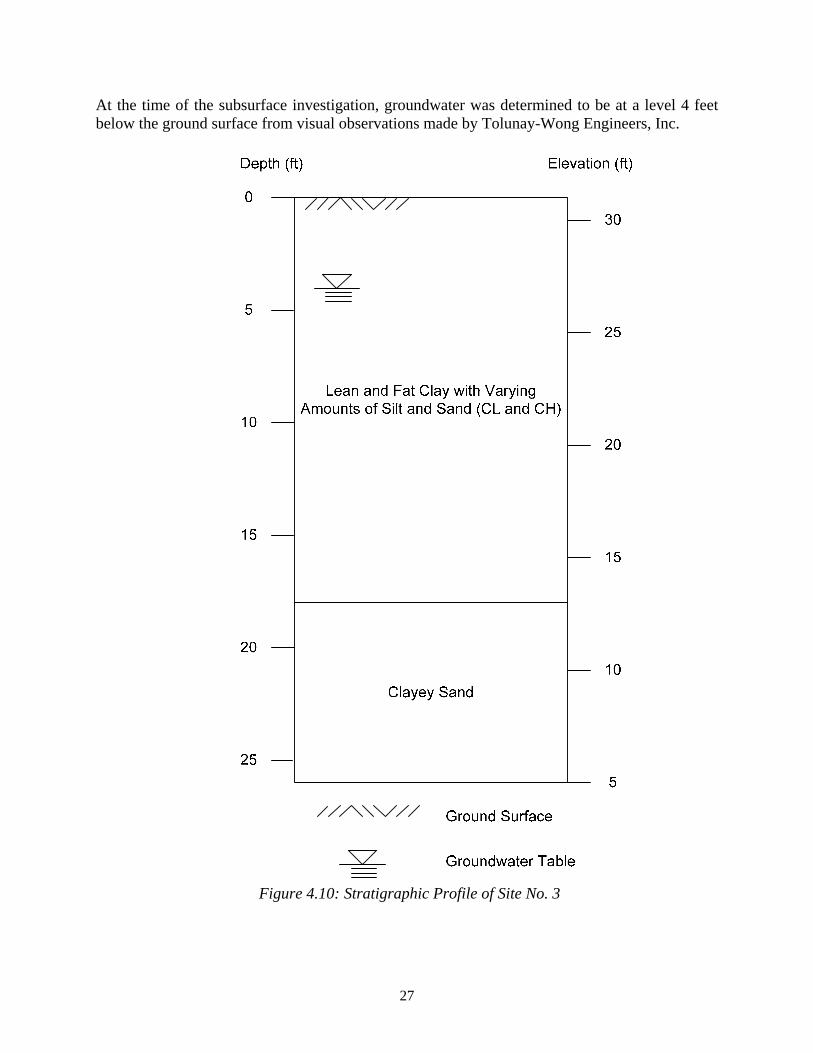
The subsurface profile is generalized as follows, beginning at the ground surface (Figure 4.6):
Depth: 0 to 18 feet (Elevation: +31 to +13 feet). The subsurface soil consists of a medium stiff to very stiff tan and gray clay stratum with varying amounts of silt and sand. The NTCP values in this stratum ranged from 6 to 14 bpf. Undrained shear strengths were measured with a pocket penetrometer on nine samples in the field; the average undrained shear strength was 1670 psf, which is indicative of soil with a stiff consistency.
Laboratory testing was performed on fourteen tube samples from this stratum. The natural moisture content varied from 25.0 to 42.3 percent. Unconsolidated-Undrained triaxial tests were performed on ten samples and the representative undrained shear strengths ranged from 172 to 1204 psf with an average of 700 psf. Consolidated-Undrained triaxial tests were performed on four samples and the representative undrained shear strengths ranged from 591 to 1262 psf with an average strength of 860 psf. Six Atterberg Limit tests were performed. The liquid limit ranged from 38 to 74, and the plasticity index ranged from 22 to 49. Based on measured index properties and visual observations the soil was classified as fat clay (CH) and lean clay (CL) by the Unified Soil Classification system. Depth: 18 to 26 feet (Elevation: +13 to +5 feet). This layer consists of tan and gray clayey sand. The NTCP values in this stratum ranged from 12 to 14 bpf. Undrained shear strengths were measured with a pocket penetrometer on three samples in the field; the average undrained shear strength was 1000 psf.
Laboratory testing was performed on four tube samples from this stratum. The natural moisture content varied from 25.4 to 28.8 percent. Unconsolidated-Undrained triaxial tests were performed on each sample; however, only one test was considered reasonable and the undrained shear strength was 1385 psf.
27
At the time of the subsurface investigation, groundwater was determined to be at a level 4 feet below the ground surface from visual observations made by Tolunay-Wong Engineers, Inc.
Figure 4.10: Stratigraphic Profile of Site No. 3
28
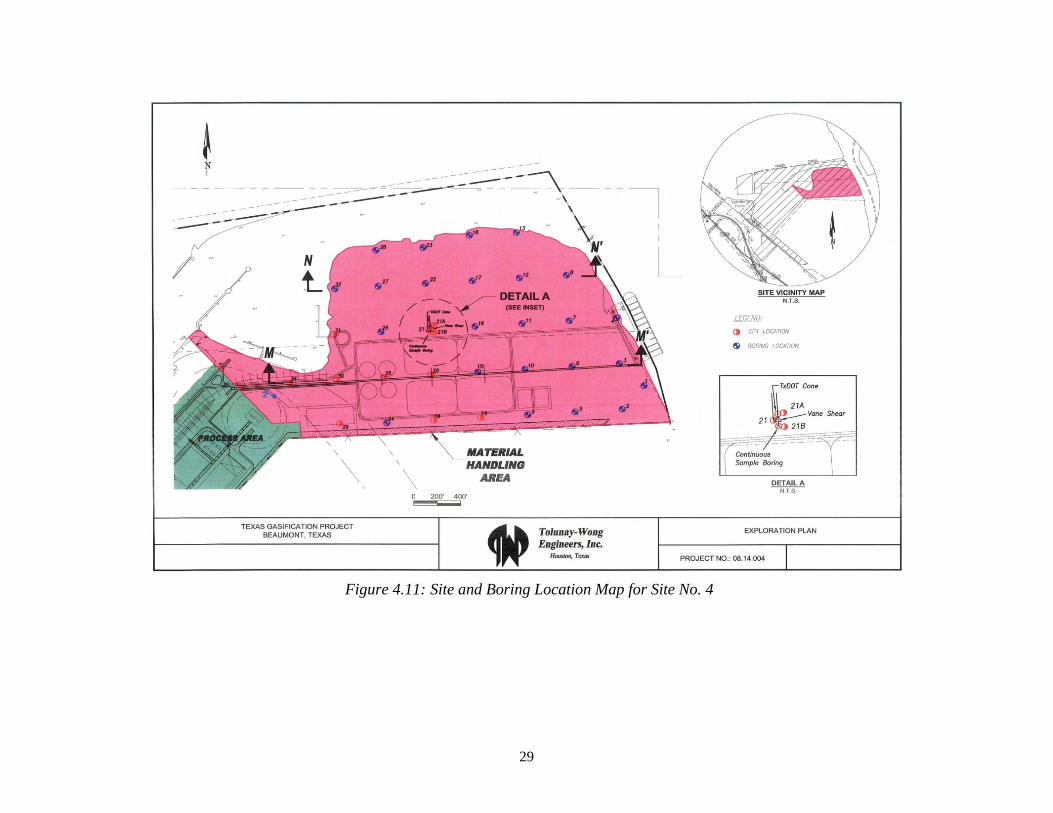
4.4 Site No. 4 – Beaumont, TX This site is located just north of the intersection of US-287 and TX-347W in Beaumont,
Jefferson County, Texas (Figure 4.7). The site is bordered by the Kansas City Southern Railway to the west and the Neches River to the east. The existing ground surface lies at an elevation of approximately +10 feet.
Review of Published Literature
According to the regional Geologic Atlas of Texas (Beaumont Sheet), the site is underlain by Alluvium (Qal) and the Beaumont Formation (Qb) (Flawn, 1968). The Alluvium consists of clay, silt, sand, and organic matter. The depositional environments include point bar, natural levee, stream channel, backswamp, coastal marsh, mud flat, and narrow beach deposits. The Beaumont Formation consists of sand, silt, clay, and gravel. The depositional environments include point bar, natural levee, stream channel, and backswamp deposits.
Field Exploration
The field exploration program consisted of the following:
• drilling and sampling one 26-foot-deep boring with Texas Highway Department cone penetration (TCP) tests performed at 2-foot intervals;
• drilling, logging and obtaining thin-walled tube soil samples continuously for a second 26-foot-deep boring;
• conducting three field vane shear tests at varying depths; and
• conducting three 25- to 50-foot-deep piezocone penetration tests. The location of the borings and additional field tests was selected by Tolunay-Wong Engineers, Inc. All of the borings were located in close proximity to one another within the subject site. The locations are shown on Figure 4.7.
29
Figure 4.11: Site and Boring Location Map for Site No. 4
30
Laboratory Testing
Laboratory testing was performed on soil samples from the thin-walled tubes. The following tests were performed:
• six consolidated-undrained (CU) triaxial compression tests;
• one one-dimensional consolidation test using controlled-strain loading;
• Liquid Limit, Plastic Limit, and Plasticity Index tests on five specimens; and
• moisture content tests on various specimens. The laboratory results are summarized in the following section for each soil strata. Detailed results are presented and discussed more thoroughly by Varathungarajan (2008).
Stratigraphic Profile
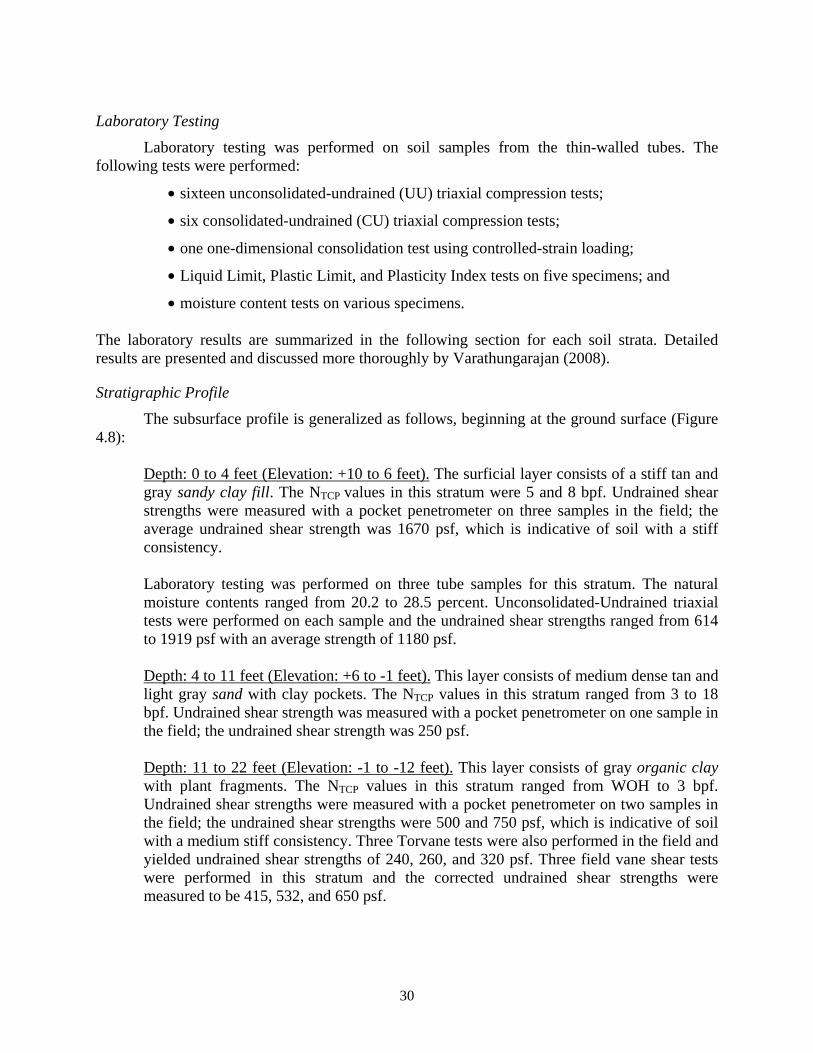
The subsurface profile is generalized as follows, beginning at the ground surface (Figure 4.8):
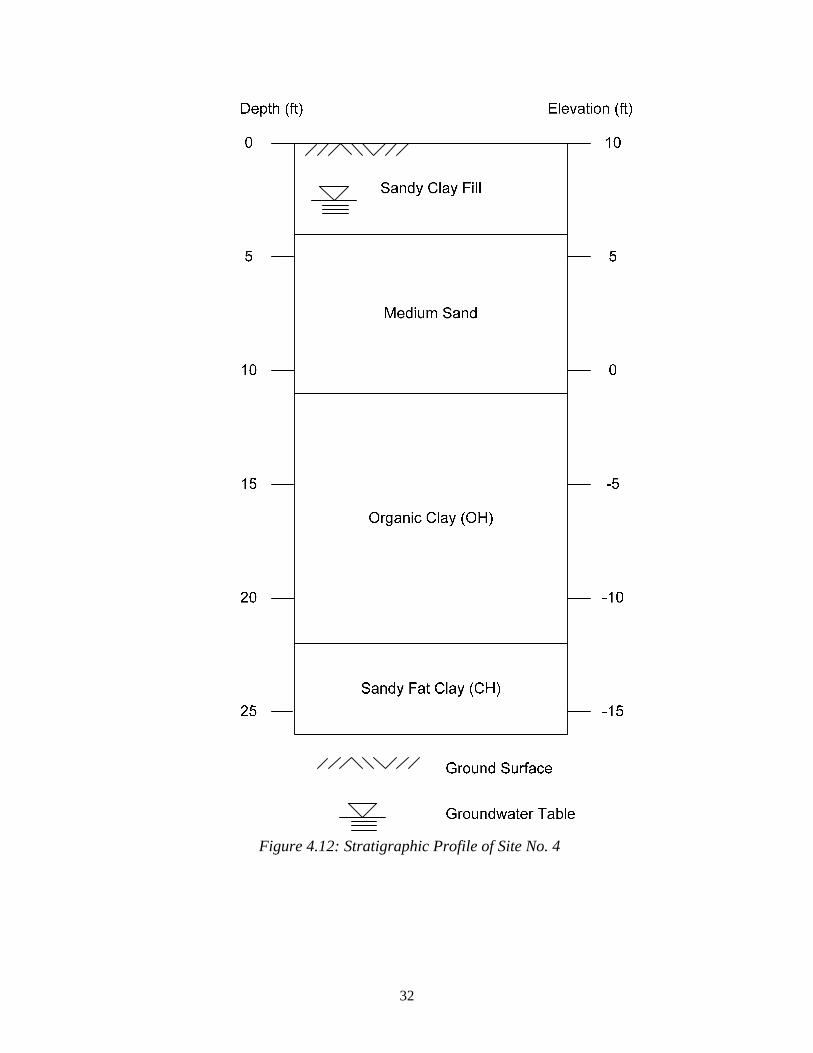
Depth: 0 to 4 feet (Elevation: +10 to 6 feet). The surficial layer consists of a stiff tan and gray sandy clay fill. The NTCP values in this stratum were 5 and 8 bpf. Undrained shear strengths were measured with a pocket penetrometer on three samples in the field; the average undrained shear strength was 1670 psf, which is indicative of soil with a stiff consistency.
Laboratory testing was performed on three tube samples for this stratum. The natural moisture contents ranged from 20.2 to 28.5 percent. Unconsolidated-Undrained triaxial tests were performed on each sample and the undrained shear strengths ranged from 614 to 1919 psf with an average strength of 1180 psf.
Depth: 4 to 11 feet (Elevation: +6 to -1 feet). This layer consists of medium dense tan and light gray sand with clay pockets. The NTCP values in this stratum ranged from 3 to 18 bpf. Undrained shear strength was measured with a pocket penetrometer on one sample in the field; the undrained shear strength was 250 psf.
Depth: 11 to 22 feet (Elevation: -1 to -12 feet). This layer consists of gray organic clay with plant fragments. The NTCP values in this stratum ranged from WOH to 3 bpf. Undrained shear strengths were measured with a pocket penetrometer on two samples in the field; the undrained shear strengths were 500 and 750 psf, which is indicative of soil with a medium stiff consistency. Three Torvane tests were also performed in the field and yielded undrained shear strengths of 240, 260, and 320 psf. Three field vane shear tests were performed in this stratum and the corrected undrained shear strengths were measured to be 415, 532, and 650 psf.
31
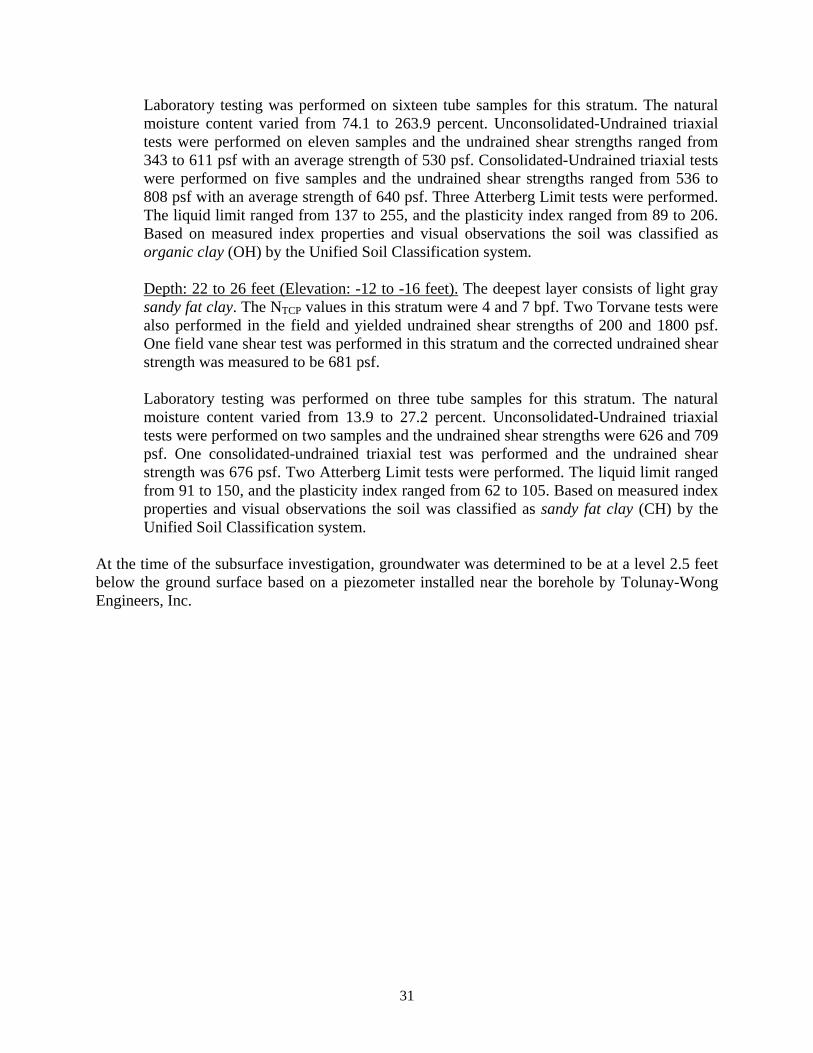
Laboratory testing was performed on sixteen tube samples for this stratum. The natural moisture content varied from 74.1 to 263.9 percent. Unconsolidated-Undrained triaxial tests were performed on eleven samples and the undrained shear strengths ranged from 343 to 611 psf with an average strength of 530 psf. Consolidated-Undrained triaxial tests were performed on five samples and the undrained shear strengths ranged from 536 to 808 psf with an average strength of 640 psf. Three Atterberg Limit tests were performed. The liquid limit ranged from 137 to 255, and the plasticity index ranged from 89 to 206. Based on measured index properties and visual observations the soil was classified as organic clay (OH) by the Unified Soil Classification system.
Depth: 22 to 26 feet (Elevation: -12 to -16 feet). The deepest layer consists of light gray sandy fat clay. The NTCP values in this stratum were 4 and 7 bpf. Two Torvane tests were also performed in the field and yielded undrained shear strengths of 200 and 1800 psf. One field vane shear test was performed in this stratum and the corrected undrained shear strength was measured to be 681 psf.
Laboratory testing was performed on three tube samples for this stratum. The natural moisture content varied from 13.9 to 27.2 percent. Unconsolidated-Undrained triaxial tests were performed on two samples and the undrained shear strengths were 626 and 709 psf. One consolidated-undrained triaxial test was performed and the undrained shear strength was 676 psf. Two Atterberg Limit tests were performed. The liquid limit ranged from 91 to 150, and the plasticity index ranged from 62 to 105. Based on measured index properties and visual observations the soil was classified as sandy fat clay (CH) by the Unified Soil Classification system.
At the time of the subsurface investigation, groundwater was determined to be at a level 2.5 feet below the ground surface based on a piezometer installed near the borehole by Tolunay-Wong Engineers, Inc.
32
Figure 4.12: Stratigraphic Profile of Site No. 4
33
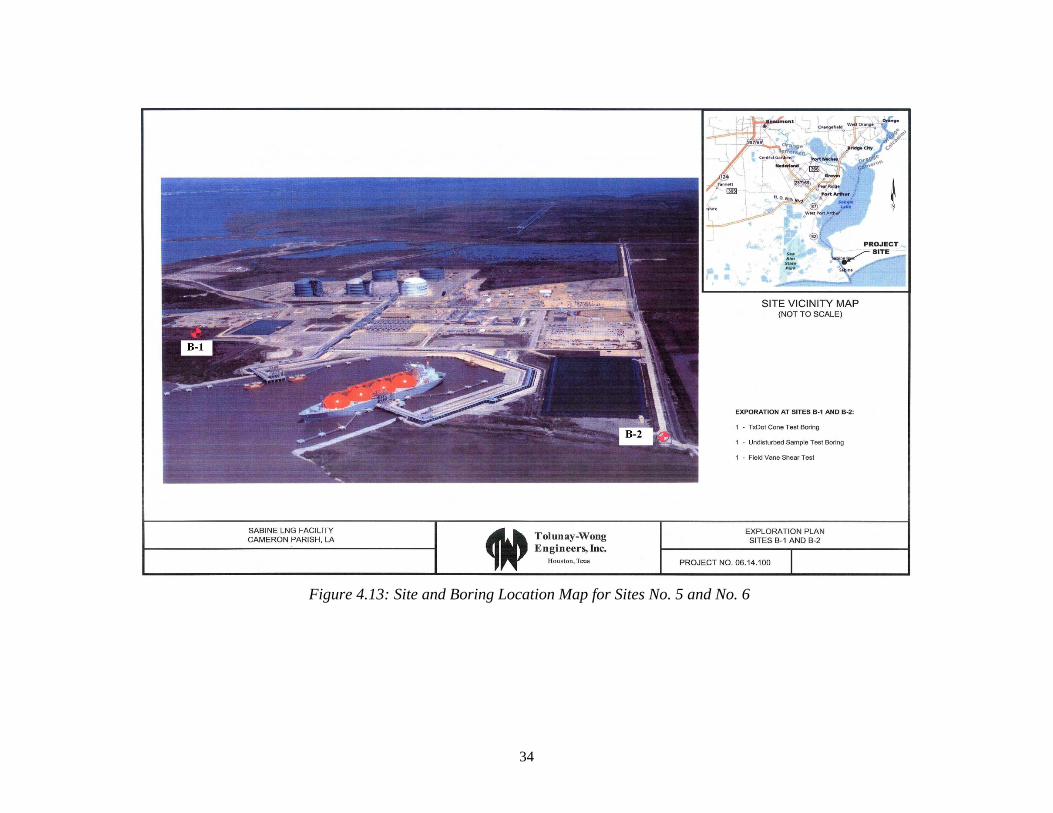
4.5 Site No. 5 – Cameron Parish, LA (Site A) This site and Site No. 6 are located south of the Gulf Coast Highway and slightly east of
Sabine Pass in Cameron Parish, Louisiana (Figure 4.9). The location of the Site No. 5 exploration is denoted as B-1 on this figure. The existing ground surface at the site is at an elevation of approximately 0 feet.
Review of Published Literature
According to the regional Geologic Atlas of Texas (Houston Sheet), the site is underlain by Alluvium (Qal) (Flawn, 1968). The Alluvium consists of clay, silt, sand, and organic matter. The depositional environments include point bar, natural levee, stream channel, backswamp, coastal marsh, mud flat, and narrow beach deposits.
Field Exploration
The field exploration program consisted of the following:
• drilling and sampling one 26-foot-deep boring with Texas Highway Department cone penetration (TCP) tests performed at 2-foot intervals;
• drilling, logging and obtaining thin-walled tube soil samples continuously for a second 26-foot-deep boring; and
• conducting eight field vane shear tests at varying depths. Standard (“Dutch”) piezocone penetration tests were not performed for this site. The location of the borings and additional field tests was selected by Tolunay-Wong Engineers, Inc. All of the borings were located in close proximity to one another within the subject site.
34
Figure 4.13: Site and Boring Location Map for Sites No. 5 and No. 6
35
Laboratory Testing
Laboratory testing was performed on soil samples from the thin-walled tubes. The following tests were performed:
• five consolidated-undrained (CU) triaxial compression tests;
• one one-dimensional consolidation test using controlled-strain loading;
• Liquid Limit, Plastic Limit, and Plasticity Index Tests on four specimens; and
• moisture content tests on various specimens. The laboratory results are summarized in the following section for each soil strata. Detailed results are presented and discussed more thoroughly by Varathungarajan (2008).
Stratigraphic Profile
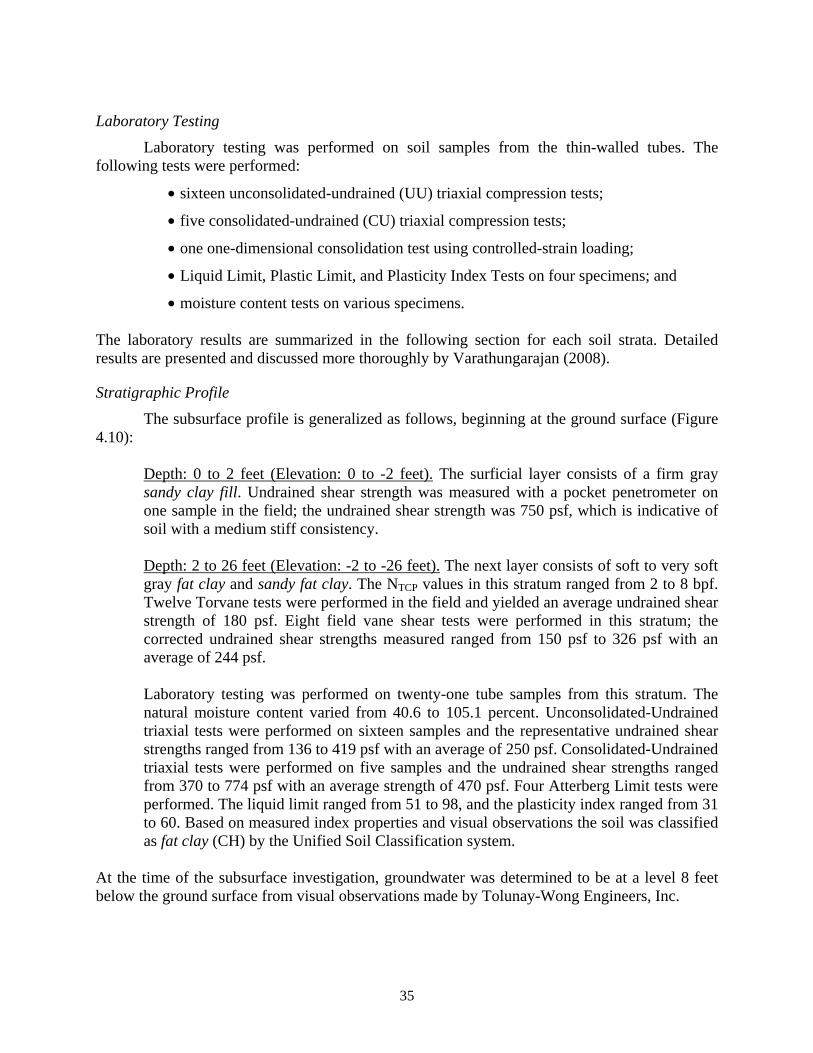
The subsurface profile is generalized as follows, beginning at the ground surface (Figure 4.10):
Depth: 0 to 2 feet (Elevation: 0 to -2 feet). The surficial layer consists of a firm gray sandy clay fill. Undrained shear strength was measured with a pocket penetrometer on one sample in the field; the undrained shear strength was 750 psf, which is indicative of soil with a medium stiff consistency.
Depth: 2 to 26 feet (Elevation: -2 to -26 feet). The next layer consists of soft to very soft gray fat clay and sandy fat clay. The NTCP values in this stratum ranged from 2 to 8 bpf. Twelve Torvane tests were performed in the field and yielded an average undrained shear strength of 180 psf. Eight field vane shear tests were performed in this stratum; the corrected undrained shear strengths measured ranged from 150 psf to 326 psf with an average of 244 psf. Laboratory testing was performed on twenty-one tube samples from this stratum. The natural moisture content varied from 40.6 to 105.1 percent. Unconsolidated-Undrained triaxial tests were performed on sixteen samples and the representative undrained shear strengths ranged from 136 to 419 psf with an average of 250 psf. Consolidated-Undrained triaxial tests were performed on five samples and the undrained shear strengths ranged from 370 to 774 psf with an average strength of 470 psf. Four Atterberg Limit tests were performed. The liquid limit ranged from 51 to 98, and the plasticity index ranged from 31 to 60. Based on measured index properties and visual observations the soil was classified as fat clay (CH) by the Unified Soil Classification system.
At the time of the subsurface investigation, groundwater was determined to be at a level 8 feet below the ground surface from visual observations made by Tolunay-Wong Engineers, Inc.
36
Figure 4.14: Stratigraphic Profile of Site No. 5
37
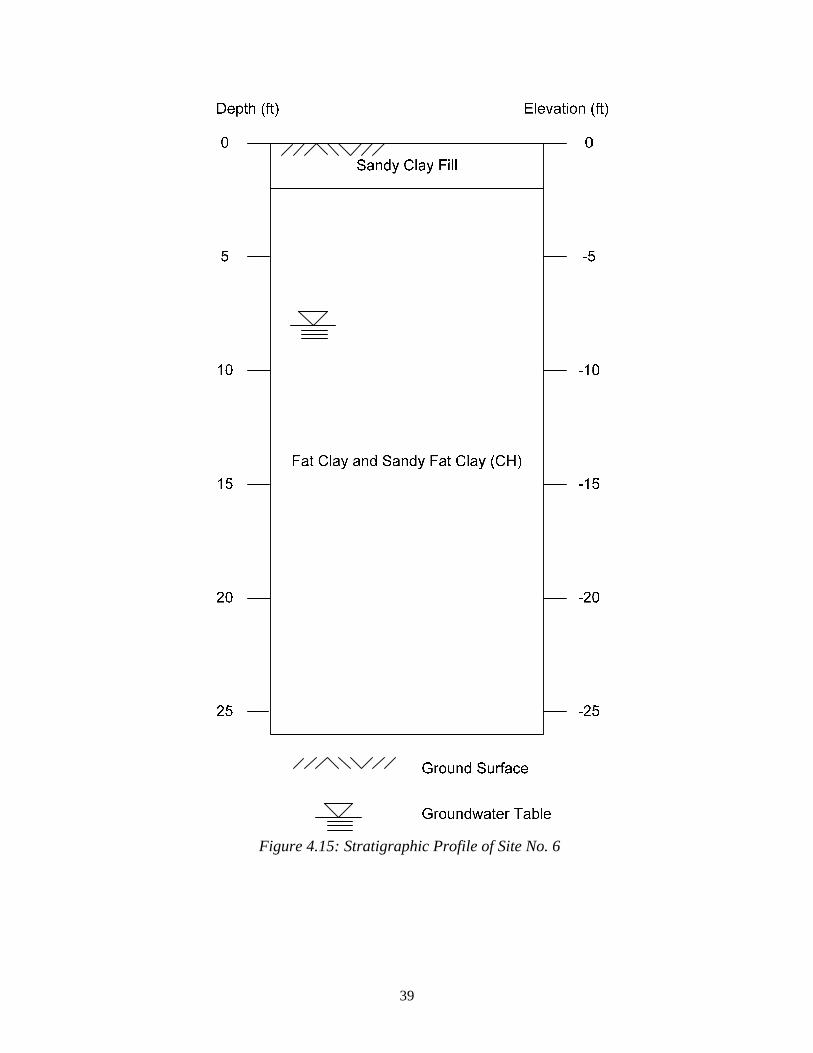
4.6 Site No. 6 – Cameron Parish, LA (Site B) This site is located approximately one mile southeast of Site No. 5 in Cameron Parish,
Louisiana (Figure 4.9). The location of the Site No. 6 exploration is denoted as B-2 on this figure. The existing ground surface at the site is at an elevation of approximately 0 feet. The site’s geologic history is similar to that of Site No. 5.
Field Exploration
The field exploration program consisted of the following:
• drilling and sampling one 26-foot-deep boring with Texas Highway Department cone penetration (TCP) tests performed at 2-foot intervals;
• drilling, logging and obtaining thin-walled tube soil samples continuously for a second 26-foot-deep boring; and
• conducting eight field vane shear tests at varying depths. Standard (“Dutch”) piezocone penetration tests were not performed for this site. The location of the borings and additional field tests was selected by Tolunay-Wong Engineers, Inc. All of the borings were located in close proximity to one another within the subject site.
Laboratory Testing
Laboratory testing was performed on soil samples from the thin-walled tubes. The following tests were performed:
• four consolidated-undrained (CU) triaxial compression tests;
• one one-dimensional consolidation test using controlled-strain loading;
• Liquid Limit, Plastic Limit, and Plasticity Index Tests on four specimens; and
• moisture content tests on various specimens. The laboratory results are summarized in the following section for each soil strata. Detailed results are presented and discussed more thoroughly by Varathungarajan (2008).
Stratigraphic Profile
The subsurface profile is generalized as follows, beginning at the ground surface (Figure 4.11):
Depth: 0 to 2 feet (Elevation: 0 to -2 feet). The surficial layer consists of a firm gray sandy clay fill. Undrained shear strength was measured with a pocket penetrometer on one sample in the field; the undrained shear strength was 750 psf, which is indicative of soil with a medium stiff consistency.
Depth: 2 to 26 feet (Elevation: -2 to -26 feet). The next layer consists of soft to very soft gray fat clay and sandy fat clay. The NTCP values in this stratum ranged from WOH to 7
38
bpf. Ten Torvane tests were performed in the field and yielded an average undrained shear strength of 250 psf. Two pocket penetrometer tests were also performed and undrained shear strengths of 750 psf were measured in each test. Eight field vane shear tests were performed in this stratum; the corrected undrained shear strengths measured ranged from 98 psf to 798 psf with an average of 406 psf. Laboratory testing was performed on twenty-one tube samples for this stratum. The natural moisture content varied from 25.5 to 89.2 percent. Unconsolidated-Undrained triaxial tests were performed on seventeen samples and the representative undrained shear strengths ranged from 176 to 822 psf with an average of 400 psf. Consolidated-Undrained triaxial tests were performed on four samples and the representative undrained shear strengths ranged from 498 to 732 psf with an average strength of 620 psf. Four Atterberg Limit tests were performed. The liquid limit ranged from 52 to 84, and the plasticity index ranged from 30 to 49. Based on measured index properties and visual observations the soil was classified as fat clay (CH) by the Unified Soil Classification system.
At the time of the subsurface investigation, groundwater was determined to be at a level 8 feet below the ground surface from visual observations made by Tolunay-Wong Engineers, Inc.
4.7 Summary Data from the conventional (“Dutch”) piezocone penetration tests, vane shear tests and
triaxial tests are presented and analyzed in more detail by Varathungarajan (2008). Varathungarajan (2008) also developed representative strength profiles for each site (Appendix A). These strength profiles are used in subsequent chapters to evaluate the reliability of existing Texas Cone Penetrometer correlations between NTCP and undrained shear strength. The development of a new improved correlation will also be investigated.
39
Figure 4.15: Stratigraphic Profile of Site No. 6
40
41
Chapter 5. Analysis of the Texas Cone Penetrometer Correlations
For each of the six sites described in Chapter 4, representative shear strength profiles were developed using the laboratory data and data from the field vane and piezocone penetration tests. The development of the undrained strength profiles is described by Varathungarajan (2008). He developed three strength profiles—an average, lower- and upper-bound—for each site (Appendix A). Once the strength profiles were established, they were used to establish and examine correlations between undrained shear strength and Texas Cone Penetrometer blow counts. The examination of these correlations is presented in this chapter and an improved correlation is proposed.
5.1 Evaluation of Existing Correlations For each of the six sites, undrained shear strengths were computed using the correlations
proposed by Hamoudi et al. (1974), Duderstadt et al. (1977) and Kim et al. (2007). The correlations from Hamoudi et al. (1974) and Duderstadt et al. (1977) produced very similar strengths, which is expected since the correlation proposed by Duderstadt et al. (1977) was developed as an improvement to the correlation proposed by Hamoudi et al. (1974).
A strength profile corresponding to the minimum strength required to support the Texas Cone Penetrometer cone was also developed for each site. Details of these strength profiles are presented in Appendix C. In most cases, when a blow count of “weight of hammer” (W.O.H.) was recorded, the undrained shear strength of the soil was less than the calculated minimum strength required to support the cone.
Site No. 1 – Port Arthur, TX (Site A)
The undrained shear strengths computed using the correlations proposed by Hamoudi et al. (1974), Duderstadt et al. (1977), and Kim et al. (2007) for Site No. 1 are shown in Table 5.1. Undrained shear strengths at several locations in the sandy clay fill, granular fill and sand strata were not computed using the correlations because the soil was considered to be non-clay. For several of the sites there are strata that contain both clay and non-clay soils and undrained shear strengths are only computed where the soil was believed to be clay. In addition, moisture content was not taken at a depth of 25 feet and thus an undrained shear strength could not be computed using the correlation by Kim et al. (2007). The undrained shear strength profiles developed by Varathungarajan (2008) along with the undrained shear strengths computed from the Texas Cone Penetrometer tests using the correlations from Duderstadt et al. (1977) and Kim et al. (2007) are plotted versus depth in Figure 5.1. Undrained shear strengths computed using the correlations ranged from approximately 10 percent to 325 percent of the average undrained shear strength profile developed by Varathungarajan (2008). The strata considered to be non-clay are represented by a shaded area.
42
Table 5.10: Summary of Undrained Shear Strengths for Site No. 1 using Existing Texas Cone Penetrometer Correlations
The undrained shear strengths computed using the correlations proposed by Hamoudi et al. (1974), Duderstadt et al. (1977), and Kim et al. (2007) for Site No. 2 are shown in Table 5.2. Undrained shear strengths at several locations in the clayey and silty sand and sandy lean clay strata were not computed using the correlations because the soil was considered to be non-clay. Also, many of the Texas Cone Penetrometer blow counts were recorded as “weight of hammer” (W.O.H.) within the fat clay and thus undrained shear strengths could also not be computed. The undrained shear strength profiles developed by Varathungarajan (2008) along with the undrained shear strengths computed from the Texas Cone Penetrometer tests using the correlations from Duderstadt et al. (1977) and Kim et al. (2007) are plotted versus depth in Figure 5.2. All undrained shear strengths computed using the correlations were within approximately 20 percent of the average undrained shear strength profile developed by Varathungarajan (2008). The arrows indicating a range and question marks in Figure 5.2 correspond to depths where the undrained shear strength was less than the strength required to support the Texas Cone Penetrometer as discussed earlier and in Appendix C. While the Texas Cone Penetrometer test could not be performed at many depths, it is worth noting that the theoretical calculations presented in Chapter 2 regarding the minimum strength required to support the cone are in agreement with the field observations at this site.
45
Table 5.11: Summary of Undrained Shear Strengths for Site No. 2 using Existing Texas Cone Penetrometer Correlations
Figure 5.17: Undrained Shear Strengths for Site No. 2 using the Texas Cone Penetrometer Correlations from Duderstadt et al.
(1977) and Kim et al. (2007)
-35
-30
-25
-20
-15
-10
-5
0
5
0 100 200 300 400 500 600 700 800 900 1000
Elev
atio
n (f
t)
Undrained Shear Strength (psf)
DuderstadtKim
Clayey and Silty Sand
Fat Clay with Sand
Sandy Lean Clay
Strength required to support the TCP cone
Lower bound
Upper bound
Average
47
Site No. 3 – Mont Belvieu, TX
The undrained shear strengths computed using the correlations proposed by Hamoudi et al. (1974), Duderstadt et al. (1977), and Kim et al. (2007) for Site No. 3 are shown in Table 5.3. Undrained shear strengths were not computed in the clayey sand stratum because the soil was considered to be non-clay. The undrained shear strength profiles developed by Varathungarajan (2008) along with the undrained shear strengths computed from the Texas Cone Penetrometer tests using the correlations from Duderstadt et al. (1977) and Kim et al. (2007) are plotted versus depth in Figure 5.3. Undrained shear strengths computed using the correlations ranged from approximately 40 percent to 155 percent of the average undrained shear strength profile developed by Varathungarajan (2008).
Table 5.12: Summary of Undrained Shear Strengths for Site No. 3 using Existing Texas Cone Penetrometer Correlations
Figure 5.18: Undrained Shear Strengths for Site No. 3 using the Texas Cone Penetrometer Correlations from Duderstadt et al.
(1977) and Kim et al. (2007)
5
10
15
20
25
30
35
0 500 1000 1500 2000
Elev
atio
n (f
t)
Undrained Shear Strength (psf)
DuderstadtKim
Lean and Fat Clay with Some Silt and Sand
Tan and Gray Clayey Sand
Strength required to support the TCP cone
Lower boundUpper bound
Average
49
Site No. 4 – Beaumont, TX
The undrained shear strengths computed using the correlations proposed by Hamoudi et al. (1974), Duderstadt et al. (1977) and Kim et al. (2007) for Site No. 4 are shown in Table 5.4. Undrained shear strengths at most locations in the sand stratum were not computed using the correlations because the soil was considered to be non-clay. Also, two of the Texas Cone Penetrometer blow counts were recorded as “weight of hammer” (W.O.H.) in the organic clay and thus undrained shear strengths could also not be computed. The undrained shear strength profiles developed by Varathungarajan (2008) along with the undrained shear strengths computed from the Texas Cone Penetrometer tests using the correlations from Duderstadt et al. (1977) and Kim et al. (2007) are plotted versus depth in Figure 5.4. Undrained shear strengths computed using the correlations ranged from approximately 45 percent to 335 percent of the average undrained shear strength profile developed by Varathungarajan (2008). The arrows indicating a range and question marks correspond to depths where the undrained shear strength was less than the strength required to support the Texas Cone Penetrometer as discussed earlier and in Appendix C.
50
Table 5.13: Summary of Undrained Shear Strengths for Site No. 4 using Existing Texas Cone Penetrometer Correlations
0 100.5 9.51 9 8 848 848
1.5 8.52 8 20.2 934
2.5 7.53 7 5 28.5 530 530 907
3.5 6.5 25.1 6964 6
4.5 5.55 5 17 --- --- --- ---
5.5 4.56 4
6.5 3.57 3 18 --- --- --- ---
7.5 2.58 2
8.5 1.59 1 8 --- --- --- ---
9.5 0.510 0
10.5 -0.511 -1 3 --- 318 318 ---
11.5 -1.512 -2
12.5 -2.5 83.8 64713 -3 3 114.9 420 402 882
13.5 -3.5 113.1 86314 -4 74.1 ---
14.5 -4.515 -5 W.O.H. 172.7 --- --- ---
15.5 -5.5 123.1 ---16 -6 94.7 ---
16.5 -6.517 -7 W.O.H. 127.5 --- --- ---
17.5 -7.5 181.7 ---18 -8 169.7 1246
18.5 -8.519 -9 3 263.9 420 402 1926
19.5 -9.5 162.9 118620 -10 192.7 1349
20.5 -10.521 -11 2 162.7 280 268 1135
21.5 -11.5 163.0 113522 -12 124.6 866
22.5 -12.5 134.3 99423 -13 4 88.1 424 424 650
23.5 -13.5 99.4 73224 -14 96.7 773
24.5 -14.525 -15 7 65.8 742 742 522
25.5 -15.526 -16
Sandy Fat Clay
TCP Correlation
Sand
Organic Clay
Hamoudi,
s u (psf)
Duderstadt,
s u (psf)
Kim,
s u (psf)
Sandy Clay Fill
Water Content (%)
Depth (ft)
Elevation (ft)
Soil Type N TCP (bpf)
51
Figure 5.19: Undrained Shear Strengths for Site No. 4 using the Texas Cone Penetrometer Correlations from Duderstadt et al.
(1977) and Kim et al. (2007)
-20
-15
-10
-5
0
5
10
15
0 500 1000 1500 2000 2500
Elev
atio
n (f
t)
Undrained Shear Strength (psf)
DuderstadtKim
Organic Clay
Sandy Clay Fill
Medium Sand
Sandy Fat Clay
Strength required to support the TCP cone
Lower bound Upper boundAverage
52
Site No. 5 – Cameron Parish, LA (Site A)
The undrained shear strengths computed using the correlations proposed by Hamoudi et al. (1974), Duderstadt et al. (1977), and Kim et al. (2007) for Site No. 5 are shown in Table 5.5. Undrained shear strengths were not computed in the sandy clay fill stratum because the soil was considered to be non-clay. The undrained shear strength profiles developed by Varathungarajan (2008) along with the undrained shear strengths computed from the Texas Cone Penetrometer tests using the correlations from Duderstadt et al. (1977) and Kim et al. (2007) are plotted versus depth in Figure 5.5. Undrained shear strengths computed using the correlations ranged from approximately 105 percent to 340 percent of the average undrained shear strength profile developed by Varathungarajan (2008).
53
Table 5.14: Summary of Undrained Shear Strengths for Site No. 5 using Existing Texas Cone Penetrometer Correlations
Hamoudi, Duderstadt, Kim,
s u (psf) s u (psf) s u (psf)
0 00.5 -0.51 -1
1.5 -1.52 -2
2.5 -2.53 -3 3 48.4 420 402 565
3.5 -3.5 57.2 6254 -4
4.5 -4.55 -5 2 41.6 280 268 356
5.5 -5.5 40.6 3406 -6 53.8 333
6.5 -6.57 -7 2 48.1 280 268 383
7.5 -7.5 43.0 3388 -8 92.6 720
8.5 -8.59 -9 2 95.8 280 268 731
9.5 -9.5 92.7 70210 -10 97.6 784
10.5 -10.511 -11 3 96.1 318 318 759
11.5 -11.5 105.1 82312 -12 83.6 614
12.5 -12.513 -13 2 78.3 280 268 570
13.5 -13.5 88.3 64014 -14 65.1 470
14.5 -14.515 -15 2 52.5 280 268 376
15.5 -15.5 58.0 41516 -16 83.0 592
16.5 -16.517 -17 2 78.0 280 268 553
17.5 -17.5 51.3 36318 -18
18.5 -18.519 -19 3 318 318
19.5 -19.520 -20
20.5 -20.521 -21 3 45.1 318 318 326
21.5 -21.5 50.2 36222 -22
22.5 -22.523 -23 7 68.5 742 742 552
23.5 -23.524 -24
24.5 -24.525 -25 8 76.1 848 848 619
25.5 -25.5 77.2 62626 -26
Fat Clay and Sandy Fat
Clay
Sandy Clay Fill
Depth (ft)
Elevation (ft)
Soil Type
TCP Correlations
N TCP (bpf)Water
Content (%)
54
Figure 5.20: Undrained Shear Strengths for Site No. 5 using the Texas Cone Penetrometer Correlations from Duderstadt et al.
(1977) and Kim et al. (2007)
-30
-25
-20
-15
-10
-5
0
0 200 400 600 800 1000
Elev
atio
n (f
t)
Undrained Shear Strength (psf)
Duderstadt
Kim
Fat Clay and Sandy Fat
Clay
Sandy Clay Fill
Lower bound Upper boundAverage
Strength required to support the TCP cone
55
Site No. 6 – Cameron Parish, LA (Site B)
The undrained shear strengths computed using the correlations proposed by Hamoudi et al. (1974), Duderstadt et al. (1977), and Kim et al. (2007) for Site No. 6 are shown in Table 5.6. Undrained shear strengths were not computed in the sandy clay fill stratum because the soil was considered to be non-clay. Also, one of the Texas Cone Penetrometer blow counts was recorded as “weight of hammer” (W.O.H.) within the Clay and thus an undrained shear strength could also not be computed. The undrained shear strength profiles developed by Varathungarajan (2008) along with the undrained shear strengths computed from the Texas Cone Penetrometer tests using the correlations from Duderstadt et al. (1977) and Kim et al. (2007) are plotted versus depth in Figure 5.6. Undrained shear strengths computed using the correlations ranged from approximately 35 percent to 175 percent of the average undrained shear strength profile developed by Varathungarajan (2008). The arrow indicating a range and question mark correspond to the depth where the undrained shear strength was less than the strength required to support the Texas Cone Penetrometer as discussed earlier and in Appendix C.
56
Table 5.15: Summary of Undrained Shear Strengths for Site No. 6 using Existing Texas Cone Penetrometer Correlations
Hamoudi, Duderstadt, Kim,
s u (psf) s u (psf) s u (psf)
0 00.5 -0.51 -1
1.5 -1.52 -2
2.5 -2.53 -3 2 280 268
3.5 -3.5 52.7 4984 -4
4.5 -4.5 49.0 4305 -5 2 57.8 280 268 494
5.5 -5.5 37.5 3146 -6
6.5 -6.57 -7 2 50.5 280 268 402
7.5 -7.5 37.5 2958 -8 40.7 369
8.5 -8.59 -9 4 560 536
9.5 -9.5 45.0 39010 -10
10.5 -10.511 -11 6 840 804
11.5 -11.5 50.7 46612 -12
12.5 -12.5 69.7 ---13 -13 W.O.H 78.7 --- --- ---
13.5 -13.5 76.6 ---14 -14 67.5 487
14.5 -14.515 -15 2 89.2 280 268 640
15.5 -15.516 -16
16.5 -16.5 79.0 56217 -17 2 55.5 212 212 393
17.5 -17.5 48.7 34418 -18
18.5 -18.519 -19 3 318 318
19.5 -19.520 -20 83.2 582
20.5 -20.521 -21 2 64.6 280 268 451
21.5 -21.5 62.7 43722 -22
22.5 -22.523 -23 3 25.4 318 318 182
23.5 -23.524 -24
24.5 -24.525 -25 7 980 938
25.5 -25.526 -26
Fat Clay and Sandy Fat Clay
Depth (ft)
Elevation (ft)
Soil Type
TCP Correlation
Sandy Clay Fill
N TCP (bpf)Water Content
(%)
57
Figure 5.21: Undrained Shear Strengths for Site No. 6 using the Texas Cone Penetrometer Correlations from Duderstadt et al.
(1977) and Kim et al. (2007)
-30
-25
-20
-15
-10
-5
0
0 200 400 600 800 1000
Elev
atio
n (f
t)
Undrained Shear Strength (psf)
DuderstadtKim
Sandy Clay Fill
Fat Clay and Sandy Fat
Clay
Strength required to support the TCP cone
Lower boundUpper bound
Average
58
5.2 Discussion of Existing Correlations The correlations by Kim et al. (2007) tend to produce highly variable undrained
strengths, in many cases ranging from either significantly greater or less than what are believed to be the actual strengths. The maximum underestimates for each site ranged from 8 to 95 percent of the average undrained shear strength profile developed by Varathungarajan (2008) while the maximum overestimates for each site ranged from 118 to 336 percent of the average undrained shear strength profile developed by Varathungarajan (2008). Furthermore, the correlation suggests that as the moisture content increases, the strength increases, which seems fundamentally unsound. As a result, this correlation was not considered further in this study.
The correlation by Duderstadt et al. (1977) showed reasonable agreement with the upper portions of the undrained shear strength profiles developed for the sites, but showed a tendency to overestimate the strengths in the deeper portion of the soil profiles. Furthermore, it seems reasonable that even with a zero (“weight of hammer”) blow count, if the soil can support the weight of the cone, it has some strength. This suggests that the equation for computing the undrained shear strength of the soil should be of the form,
(5.1)
where s0 is the strength required to support the weight of the cone and K is the increase in strength associated with each blow count. Referring to Chapter 2 where the minimum strengths required to support the weight of the cone were examined, a nominal strength of approximately 300 (± 50) psf would be required to support the weight of the cone for depths up to approximately 30 feet, which is the depth range of interest. Thus, Equation 5.1 could be written as,
300 (5.2) in units of psf for undrained shear strength. The ratio of the average undrained shear strength profile from Varathungarajan (2008) to the minimum undrained shear strength required to support the cone is plotted versus depth in Figure 5.7. All ratios were approximately equal to or greater than 1.0 suggesting that the Texas Cone Penetrometer test could be performed. The correlation provided by Duderstadt et al. (1977) suggested that for clays the undrained shear strength increased at a rate ranging from 106 to 134 psf per blow with a nominal average value of 120 psf per blow. A line corresponding to 120 psf per blow is plotted in Figure 5.8 along with measured undrained shear strength and Texas Cone Penetrometer blow count values. Data from Hamoudi et al. (1974) and Duderstadt et al. (1977) as well as the current study are all shown in this figure. Examination of the data in this figure suggests that the strengths may be overestimated by nearly a factor of two in some cases by using a factor of 120 psf per blow. Strength increasing at a rate of 60 psf per blow count is probably a more reasonable, safe lower bound. Based on the above reasoning, the following improved equation is proposed:
300 60 (5.3) Equation 5.3 can also be presented in the following form where the constants are independent of units:
59
0.142 0.028 (5.4)
where patmosphere is atmospheric pressure. In this form the units for su will be the same as the units for atmospheric pressure and any set of units can be chosen. For example if the units are in pounds per square inch (psi), atmospheric pressure is 14.7 psi and Equation 5.4 appears as
14.7 0.142 0.028 (5.5) In this case Equation 5.5 yields the undrained shear strength in units of psi.
A line corresponding to Equation 5.3 for blow counts of 15 or less is plotted in Figure 5.9. Also plotted in this figure are the measured undrained shear strength and blow count values for the six sites from this study as well as the data from Hamoudi et al. (1974) and Duderstadt et al. (1977). Finally, a line corresponding to the correlation by Duderstadt eta al. (1977) using a nominal value of 120 for the strength-to-blow count value is shown. The line corresponding to Equation 5.3 is believed to represent a better, but conservative estimate of the undrained shear strengths. The correlation provided in Equation 5.3 will be referred to as the improved correlation from this point on. This correlation is intended primarily for soft clays with undrained shear strengths of 1200 psf or less (TCP blow counts of 15 or less), which is the range of interest in this present study.
60
Figure 5.22: Ratio of the Undrained Shear Strength Determined Using the Average Undrained Strength Profile from
Varathungarajan (2008) to the Minimum Undrained Shear Strength Required to Support the TCP Cone
0
5
10
15
20
25
30
0.00 1.00 2.00 3.00 4.00 5.00 6.00 7.00 8.00 9.00
Dep
th (f
t)
su-avg/su-min
61
Figure 5.23: All Texas Cone Penetrometer Data from Hamoudi et al. (1974), Duderstadt et al. (1977) and the Additional Six Sites of
this Study
0
1000
2000
3000
4000
5000
6000
7000
8000
0 10 20 30 40 50 60
Und
rain
ed S
hear
Str
engt
h, s
u(p
sf)
Texas Cone Penetrometer Blow Count, NTCP
Hamoudi and Duderstadt
Site 1
Site 2
Site 3Site 4
Site 5
Site 6
su = 120*N
62
Figure 5.24: Texas Cone Penetrometer Data from Hamoudi et al. (1974), Duderstadt et al. (1977) and the Additional Six Sites of this
Study for Blow Counts of 15 or less
0
500
1000
1500
2000
2500
0 2 4 6 8 10 12 14
Und
rain
ed S
hear
Str
engt
h, s
u(p
sf)
Texas Cone Penetrometer Blow Count, NTCP
Hamoudi and Duderstadt
Site 1
Site 2
Site 3
Site 4
Site 5
Site 6
su = 300+60*N (Improved Correlation)
su = 120*N
63
5.3 Evaluation of Improved Correlation A summary of the undrained shear strengths computed using the improved correlation
(Equation 5.3) are shown for each of the six sites in Tables 5.7 through 5.12. The undrained shear strengths determined using this correlation for each of the six sites are plotted in Figures 5.10 through 5.15 along with the undrained shear strength profiles developed by Varathungarajan (2008). A range corresponding to ± ½ blow count is shown to indicate the range of possible error and uncertainty associated with recording the Texas Cone Penetrometer blow count to the nearest integer value.
Table 5.16: Summary of Undrained Shear Strengths for Site No. 1 using the Improved Correlation
Figure 5.27: Undrained Shear Strengths for Site No. 3 using the Improved Correlation
5
10
15
20
25
30
35
0 500 1000 1500
Elev
atio
n (f
t)
Undrained Shear Strength (psf)
Improved Correlation
Lean and Fat Clay with Some Silt and Sand
Tan and Gray Clayey Sand
Strength required to support the TCP cone
Lower bound
Upper bound
Average
69
Table 5.19: Summary of Undrained Shear Strengths for Site No. 4 using the Improved Correlation
0 100.5 9.51 9 8 780
1.5 8.52 8
2.5 7.53 7 5 600
3.5 6.54 6
4.5 5.55 5 17 ---
5.5 4.56 4
6.5 3.57 3 18 ---
7.5 2.58 2
8.5 1.59 1 8 ---
9.5 0.510 0
10.5 -0.511 -1 3 480
11.5 -1.512 -2
12.5 -2.513 -3 3 480
13.5 -3.514 -4
14.5 -4.515 -5 W.O.H. ---
15.5 -5.516 -6
16.5 -6.517 -7 W.O.H. ---
17.5 -7.518 -8
18.5 -8.519 -9 3 480
19.5 -9.520 -10
20.5 -10.521 -11 2 420
21.5 -11.522 -12
22.5 -12.523 -13 4 540
23.5 -13.524 -14
24.5 -14.525 -15 7 720
25.5 -15.526 -16
Sand
Organic Clay
Sandy Fat Clay
Sandy Clay Fill
Depth (ft)
Elevation (ft)
Soil Type N TCP (bpf) s u (psf)
70
Figure 5.28: Undrained Shear Strengths for Site No. 4 using the Improved Correlation
-20
-15
-10
-5
0
5
10
15
0 500 1000 1500 2000 2500
Elev
atio
n (f
t)
Undrained Shear Strength (psf)
Improved Correlation
Organic Clay
Sandy Clay Fill
MediumSand
Sandy Fat Clay
Strength required to support the TCP cone
Lower bound Upper boundAverage
71
Table 5.20: Summary of Undrained Shear Strengths for Site No. 5 using the Improved Correlation
0 00.5 -0.51 -1
1.5 -1.52 -2
2.5 -2.53 -3 3 480
3.5 -3.54 -4
4.5 -4.55 -5 2 420
5.5 -5.56 -6
6.5 -6.57 -7 2 420
7.5 -7.58 -8
8.5 -8.59 -9 2 420
9.5 -9.510 -10
10.5 -10.511 -11 3 480
11.5 -11.512 -12
12.5 -12.513 -13 2 420
13.5 -13.514 -14
14.5 -14.515 -15 2 420
15.5 -15.516 -16
16.5 -16.517 -17 2 420
17.5 -17.518 -18
18.5 -18.519 -19 3 480
19.5 -19.520 -20
20.5 -20.521 -21 3 480
21.5 -21.522 -22
22.5 -22.523 -23 7 720
23.5 -23.524 -24
24.5 -24.525 -25 8 780
25.5 -25.526 -26
Sandy Clay Fill
Fat Clay and Sandy Fat Clay
Depth (ft)
Elevation (ft)
Soil TypeN TCP
(bpf)s u (psf)
72
Figure 5.29: Undrained Shear Strengths for Site No. 5 using the Improved Correlation
-30
-25
-20
-15
-10
-5
0
0 200 400 600 800 1000
Elev
atio
n (f
t)
Undrained Shear Strength (psf)
Improved Correlation
Sandy Clay Fill
Fat Clay and Sandy Fat
Clay
Lower bound Upper boundAverage
Strength required to support the TCP cone
73
Table 5.21: Summary of Undrained Shear Strengths for Site No. 6 using the Improved Correlation
0 00.5 -0.51 -1
1.5 -1.52 -2
2.5 -2.53 -3 2 420
3.5 -3.54 -4
4.5 -4.55 -5 2 420
5.5 -5.56 -6
6.5 -6.57 -7 2 420
7.5 -7.58 -8
8.5 -8.59 -9 4 540
9.5 -9.510 -10
10.5 -10.511 -11 6 660
11.5 -11.512 -12
12.5 -12.513 -13 W.O.H ---
13.5 -13.514 -14
14.5 -14.515 -15 2 420
15.5 -15.516 -16
16.5 -16.517 -17 2 420
17.5 -17.518 -18
18.5 -18.519 -19 3 480
19.5 -19.520 -20
20.5 -20.521 -21 2 420
21.5 -21.522 -22
22.5 -22.523 -23 3 480
23.5 -23.524 -24
24.5 -24.525 -25 7 720
25.5 -25.526 -26
Sandy Clay Fill
Fat Clay and Sandy Fat Clay
Depth (ft)
Elevation (ft)
s u (psf)Soil TypeN TCP
(bpf)
74
Figure 5.30: Undrained Shear Strengths for Site No. 6 using the Improved Correlation
-30
-25
-20
-15
-10
-5
0
0 200 400 600 800 1000
Elev
atio
n (f
t)
Undrained Shear Strength (psf)
Improved Correlation
Sandy Clay Fill
Fat Clay and Sandy Fat
Clay
Strength required to support the TCP cone
Lower bound
Upper bound
Average
75
5.4 Discussion of Improved Correlation The improved correlation presented in this chapter is intended primarily for soft clays
with undrained shear strengths of 1200 psf or less (TCP blow counts of 15 or less), which is the range of interest in this present study. The results presented in Figures 5.10 through 5.15 show that the improved correlation provides a reasonable estimate of undrained shear strength that is in good agreement with the undrained shear strength profiles provided by Varathungarajan (2008). However, with any correlation there is error and uncertainty with the correlation. The ratio of the undrained shear strength computed from the improved correlation to the undrained shear strength determined using the average undrained strength profile from Varathungarajan (2008) ranges from 0.60 to 3.12 as shown in Figure 5.16. The potential significance of this variation and uncertainty is examined in the next chapter.
76
Figure 5.31: Ratio of the Undrained Shear Strength Computed from the Improved Correlation to the Undrained Shear Strength
Determined Using the Average Undrained Strength Profile from Varathungarajan (2008)
0
5
10
15
20
25
30
0.00 0.50 1.00 1.50 2.00 2.50 3.00 3.50
Dep
th (f
t)
su-TCP/su-avg
77
Chapter 6. Application of Improved Correlation
One of the primary uses of undrained shear strengths by TxDOT, particularly for soil at shallow (less than 30 feet) depths, is to evaluate bearing capacity for embankments, retaining walls, and shallow footings. In order to evaluate the correlations between undrained shear strength and Texas Cone Penetrometer blow count developed in this study and described in Chapter 5, a series of bearing capacity analyses was performed. Bearing capacity analyses were performed first for the average and lower- and upper-bound undrained shear strength profiles established from laboratory, field vane and piezocone penetration tests by Varathungarajan (2008). These analyses are assumed to represent the correct bearing capacity and expected uncertainty. Next, similar analyses were performed using undrained shear strength profiles determined from the Texas Cone Penetrometer blow counts and the improved correlation (Equation 5.3) developed in this study. Analyses were performed for all the sites described in Chapter 5 with the exception of Site No. 2, where Texas Cone Penetrometer tests could not be performed due to the very soft soils encountered. The procedures used and results of these analyses are presented in this chapter.
6.1 Approach For each soil strength profile the factor of safety was calculated for a uniform load at the
ground surface (Figure 6.1). Three different widths—5, 10, and 20 feet—were assumed for the distributed load. As the width of the load varied the depth of the most critical (lowest factor of safety) slip surface varied also, thus influencing how much of the soil strength profile influenced the bearing capacity. As the width of the load increased the depth of the critical slip surface generally increased. Widths of 5, 10, and 20 feet were considered to represent the range of widths of retaining walls as well as include the probable width of most shallow foundations.
Because the undrained shear strength varied with depth throughout most of the undrained shear strength profiles, a conventional bearing capacity equation, which assumes a constant strength profile could not be used. Instead, bearing capacity analyses were performed using the computer software UTEXAS4 (Wright, 1999). Although this software is intended primarily for slope stability analyses, it can also be used to evaluate bearing capacity. The software allows analyses to be performed for a horizontal “slope” subjected to a distributed load (Figure 6.2).
78
Figure 6.32: Graphic File for Site 1 using the Average Undrained Shear Strength Profile and a
Load Width of 10 Feet
Figure 6.33: Simplified Graphic File for Site 1 using the Average Undrained Shear Strength
Profile and a Load Width of 5 Feet
79
UTEXAS4 calculates a factor of safety applied to the soil shear strength. This differs from the factor of safety normally applied in bearing capacity analyses, where the factor of safety is defined with respect to load, rather than shear strength. However, for the case where the friction angle (φ) is equal to zero, which applies to the undrained shear strengths for all of the clays in the soil profiles considered, there is no difference in the numerical values of a factor of safety defined with respect to shear strength and a factor of safety defined with respect to load. The only times there are differences in factor of safety depending on definition is when the friction angle (φ) is greater than zero. This (φ > 0) only occurs for the sands in the soil profiles, and was not considered to be significant enough to warrant further consideration of the definitions of factor of safety. All of the factors of safety reported in this chapter are defined with respect to soil shear strength as computed by the UTEXAS4 software.
UTEXAS4 permits computations to be performed using either circular or general, noncircular slip surfaces. However, for all of the analyses presented in this chapter only circular slip surfaces were used. Because the primary interest in the analyses was in comparing values of the factor of safety for different representations of the undrained shear strength profile, use of circular slip surfaces was considered adequate.
A general procedure was followed regarding the analysis and computations made by UTEXAS4. The Simplified Bishop procedure was used and a floating grid search scheme with a grid spacing equal to 1% of the width of the loaded area was used. The circular slip surfaces were forced through the right edge of the loaded area and the starting center point was typically positioned at the left edge of the loaded area. Judgment was used with regard to the starting center point of the search to ensure that the minimum factor of safety was determined for each analysis.
For each site the magnitude of the load was selected to produce a factor of safety of 1.0 based on the average undrained strength profile determined by Varathungarajan (2008). The magnitude of the load varied depending on the width of the load. The load (bearing pressure) required to produce a factor of safety of 1.0 for each site and load widths of 5, 10, and 20 feet are summarized in Table 6.1. Once these loads were determined they were used to compute the factors of safety for bearing capacity for the lower- and upper-bound strength profiles determined by Varathungarajan (2008) as well as the undrained shear strength profile computed from the Texas Cone Penetrometer blow counts using the improved correlation presented in Chapter 5 (Equation 5.3).
80
Table 6.22: Load (Bearing Pressure) Required to Produce a Factor of Safety of 1.0 for each Site
Site Load Width (ft) Load Magnitude (lbs)
5 6620
10 6215
20 4355
5 4392
10 4635
20 5088
5 5520
10 6375
20 5325
5 1815
10 1572
20 1502
5 2145
10 1980
20 2097Site
No.
6Si
te N
o. 5
Site
No.
1Si
te N
o. 3
Site
No.
4
Site No. 1 – Port Arthur, TX (Site A)
The average, lower- and upper-bound strength profiles from Varathungarajan (2008) along with the strength profile using the improved correlation are shown in Figure 6.3 for Site No. 1. The undrained shear strength values for the improved correlation were taken from Figure 5.10 in the previous chapter. For the granular fill and medium dense sand strata, the shear strength was assumed to be represented in terms of effective stresses with no cohesion and an angle of internal friction of 30 degrees. The groundwater table was at the ground surface.
81
Figure 6.34: Undrained Shear Strength Profiles for Site No. 1
-20
-15
-10
-5
0
5
10
15
0 500 1000 1500 2000 2500 3000
Elev
atio
n (f
t)
Undrained Shear Strength (psf)
Improved Correlation
su (lower)
su (average)
su (upper)
Sandy Clay Fill
Fat Clay
Lean Clay with Sand and Silt
Med. Dense Sand with Clay Pockets
Fat Clay with Silt Pockets
Granular Fill
82
Site No. 2 – Port Arthur, TX (Site B)
An undrained shear strength profile could not be developed for Site No. 2 from the Texas Cone Penetrometer tests due to the numerous “weight of hammer” (W.O.H.) blow counts. As a result no analysis was conducted for this site. Referring to Figure 5.11 in Chapter 5, the Texas Cone Penetrometer test would have been expected to produce “weight of hammer” (W.O.H.) blow counts due to the insufficient strength of the soil to support the weight of the Texas Cone Penetrometer cone.
Site No. 3 – Mont Belvieu, TX
The average, lower- and upper-bound strength profiles from Varathungarajan (2008) along with the strength profile using the improved correlation are shown in Figure 6.4 for Site No. 3. The undrained shear strength values for the improved correlation were taken from Figure 5.12 in the previous chapter. For the clayey sand stratum, the shear strength was assumed to be represented in terms of effective stresses with no cohesion and an angle of internal friction of 30 degrees. The groundwater table was at a depth of 4 feet.
Figure 6.35: Undrained Shear Strength Profiles for Site No. 3
5
10
15
20
25
30
35
0 500 1000 1500
Elev
atio
n (f
t)
Undrained Shear Strength (psf)
Improved Correlation
su (lower)
su (average)
su (upper)
Lean and Fat Clay
with SomeSilt and
Sand
Tan and Gray Clayey
Sand
83
Site No. 4 – Beaumont, TX
The average, lower- and upper-bound strength profiles from Varathungarajan (2008) along with the strength profile using the improved correlation are shown in Figure 6.5 for Site No. 4. The undrained shear strength values for the improved correlation were taken from Figure 5.13 in the previous chapter. For the medium sand stratum, the shear strength was assumed to be represented in terms of effective stresses with no cohesion and an angle of internal friction of 30 degrees. The groundwater table was at a depth of 2.5 feet.
Site No. 5 – Cameron Parish, LA (Site A)
The average, lower- and upper-bound strength profiles from Varathungarajan (2008) along with the strength profile using the improved correlation are shown in Figure 6.6 for Site No. 5. The undrained shear strength values for the improved correlation were taken from Figure 5.14 in the previous chapter. For the sandy clay fill stratum, the shear strength was assumed to be represented in terms of effective stresses with no cohesion and an angle of internal friction of 30 degrees. The groundwater table was at a depth of 8 feet.
84
Figure 6.36: Undrained Shear Strength Profiles for Site No. 4
-20
-15
-10
-5
0
5
10
15
0 500 1000 1500 2000
Elev
atio
n (f
t)
Undrained Shear Strength (psf)
Improved Correlation
su (lower)
su (average)
su (upper)
Organic Clay
Sandy Clay Fill
MediumSand
Sandy Fat Clay
85
Figure 6.37: Undrained Shear Strength Profiles for Site No. 5
-30
-25
-20
-15
-10
-5
0
0 200 400 600 800 1000
Elev
atio
n (f
t)
Undrained Shear Strength (psf)
Improved Correlation
su (lower)
su (average)
su (upper)
Sandy Clay Fill
Fat Clay and Sandy Fat
Clay
86
Site No. 6 – Cameron Parish, LA (Site B)
The average, lower- and upper-bound strength profiles from Varathungarajan (2008) along with the strength profile using the improved correlation are shown in Figure 6.7 for Site No. 6. The undrained shear strength values for the improved correlation were taken from Figure 5.15 in the previous chapter. For the sandy clay fill stratum, the shear strength was assumed to be represented in terms of effective stresses with no cohesion and an angle of internal friction of 30 degrees. The groundwater table was at a depth of 8 feet.
87
Figure 6.38: Undrained Shear Strength Profiles for Site No. 6
-30
-25
-20
-15
-10
-5
0
0 200 400 600 800 1000
Elev
atio
n (f
t)
Undrained Shear Strength (psf)
Improved Correlation
su (lower)
su (design)
su (upper)
Sandy Clay Fill
Fat Clay and Sandy Fat
Clay
88
6.2 Results and Discussion of Bearing Capacity Analyses Summaries of the results of the stability (bearing capacity) analyses for each site are
provided in Tables 6.2 through 6.6. Because the loads were selected to produce a factor of safety of 1.0 for the average strength profile all the values shown in these tables for the average strength profile are 1.0. The factors of safety computed using the lower-bound strength profiles ranged from 0.60 to 0.88; for the upper-bound strength profiles factors of safety ranged from and 1.14 to 1.61. Factors of safety computed using the strength profile based on the improved correlation ranged from 0.64 to 1.59.
The factors of safety for the lower- and upper-bound strength profiles as well as the strength profile based on the improved correlation are plotted versus the width of the loaded area for each site in Figures 6.8 through 6.12. Again factors of safety for the average strength profiles were 1.0 as shown in the figures by a dashed line.
Table 6.23: Factors of Safety and Depth of Critical Slip Surface Computed for Site No. 1
Table 6.24: Factors of Safety and Depth of Critical Slip Surface Computed for Site No. 3
FSDepth of Critical Slip Surface (ft)
FSDepth of Critical Slip Surface (ft)
FSDepth of Critical Slip Surface (ft)
Lower Bound 0.68 3.0 0.69 5.7 0.70 10.3
Average 1.00 3.1 1.00 5.8 1.00 10.8
Upper Bound 1.19 3.1 1.18 5.9 1.17 11.0
Improved Correlation 0.83 3.3 0.79 6.0 0.82 10.0
Strength Profile
Site
No.
3
Load Width = 5 ft Load Width = 10 ft Load Width = 20 ft
89
Table 6.25: Factors of Safety and Depth of Critical Slip Surface Computed for Site No. 4
FSDepth of Critical Slip Surface (ft)
FSDepth of Critical Slip Surface (ft)
FSDepth of Critical Slip Surface (ft)
Lower Bound 0.60 3.3 0.61 4.0 0.88 16.8
Average 1.00 3.3 1.00 4.0 1.00 16.5
Upper Bound 1.61 5.7 1.46 9.4 1.16 17.3
Improved Correlation 0.64 4.3 0.67 4.0 0.83 18.0
Strength ProfileSi
te N
o. 4
Load Width = 5 ft Load Width = 10 ft Load Width = 20 ft
Table 6.26: Factors of Safety and Depth of Critical Slip Surface Computed for Site No. 5
FSDepth of Critical Slip Surface (ft)
FSDepth of Critical Slip Surface (ft)
FSDepth of Critical Slip Surface (ft)
Lower Bound 0.85 3.6 0.77 5.4 0.73 9.4
Average 1.00 3.4 1.00 5.8 1.00 11.1
Upper Bound 1.16 3.3 1.26 6.2 1.30 12.1
Improved Correlation 1.39 3.2 1.49 6.6 1.59 13.7
Strength Profile
Site
No.
5
Load Width = 5 ft Load Width = 10 ft Load Width = 20 ft
Table 6.27: Factors of Safety and Depth of Critical Slip Surface Computed for Site No. 6
FSDepth of Critical Slip Surface (ft)
FSDepth of Critical Slip Surface (ft)
FSDepth of Critical Slip Surface (ft)
Lower Bound 0.82 3.5 0.74 5.0 0.71 8.3
Average 1.00 3.3 1.00 5.6 1.00 10.1
Upper Bound 1.14 3.2 1.21 5.8 1.23 10.9
Improved Correlation 1.16 3.3 1.20 6.1 1.05 14.0
Strength Profile
Site
No.
6
Load Width = 5 ft Load Width = 10 ft Load Width = 20 ft
90
Figure 6.39: Factors of Safety Computed using UTEXAS4 for Site No. 1
0.00
0.20
0.40
0.60
0.80
1.00
1.20
1.40
1.60
0 5 10 15 20 25
Fact
or o
f Saf
ety
Load Width (ft)
Lower Bound
Upper Bound
Average
Improved Correlation
91
Figure 6.40: Factors of Safety Computed using UTEXAS4 for Site No. 3
0.00
0.20
0.40
0.60
0.80
1.00
1.20
1.40
0 5 10 15 20 25
Fact
or o
f Saf
ety
Load Width (ft)
Lower BoundUpper BoundAverageImproved Correlation
92
Figure 6.41: Factors of Safety Computed using UTEXAS4 for Site No. 4
0.00
0.20
0.40
0.60
0.80
1.00
1.20
1.40
1.60
1.80
0 5 10 15 20 25
Fact
or o
f Saf
ety
Load Width (ft)
Lower BoundUpper BoundAverageImproved Correlation
93
Figure 6.42: Factors of Safety Computed using UTEXAS4 for Site No. 5
0.00
0.20
0.40
0.60
0.80
1.00
1.20
1.40
1.60
0 5 10 15 20 25
Fact
or o
f Saf
ety
Load Width (ft)
Lower BoundUpper BoundAverageImproved Correlation
94
Figure 6.43: Factors of Safety Computed using UTEXAS4 for Site No. 6
0.00
0.20
0.40
0.60
0.80
1.00
1.20
1.40
0 5 10 15 20 25
Fact
or o
f Saf
ety
Load Width (ft)
Lower BoundUpper BoundAverageImproved Correlation
95
Ten of the fifteen factors of safety shown in Figures 6.8 through 6.12 and computed using the shear strength profiles based on the improved correlation fall within the range of values computed using the lower- and upper-bound shear strength profiles; two more factors of safety are within 5 percent of the range. The factors of safety computed for Site No. 5 are the only ones showing a larger deviation.
The average and standard deviation of the factors of safety computed for the lower- and upper-bound strength profiles along with the strength profiles based on the improved correlation are shown in Table 6.7. The factors of safety computed using the lower- and upper- bound shear strength profiles were on average underestimated or overestimated by approximately 25 percent with a standard deviation of approximately 10 percent. On average, the factors of safety computed using the shear strength profiles based on the improved correlation were roughly 1.0 with a standard deviation of 30 percent. The width of the loaded area had little effect on the values shown in Table 6.7.
Table 6.28: Average and Standard Deviation of the Factors of Safety Computed using UTEXAS4
Strength ProfileAverage,
μStandard Deviation,
σ
Lower Bound 0.73 0.08
Upper Bound 1.26 0.13
Improved Correlation 1.03 0.30
96
97
Chapter 7. Summary, Conclusions and Recommendations
The objective of this project was to develop an improved correlation between Texas Cone Penetrometer blow count and undrained shear strength for soft, clay soils in the upper approximately thirty feet of the ground.
7.1 Summary Subsurface explorations were carried out by Tolunay-Wong Engineers, Inc. (TWEI) at
six sites in the Texas Gulf Coast region where soft soils were expected to exist. Field testing included a series of borings with Texas Cone Penetrometer tests, conventional (“Dutch”) piezocone penetration tests, thin-walled tube sampling, and vane shear tests. Laboratory testing was subsequently performed at The University of Texas at Austin on the samples obtained in the field.
Varathungarajan (2008) used the results of these field and laboratory tests to develop average, lower- and upper-bound undrained shear strength profiles for each of the sites. Undrained shear strengths were then computed using existing correlations between Texas Cone Penetrometer blow count and undrained shear strength developed by Hamoudi et al. (1974), Duderstadt et al. (1977), and Kim et al. (2007). The validity of these correlations was analyzed in comparison to the strength profiles developed by Varathungarajan (2008) and an improved correlation was developed.
Finally, bearing capacity analyses were performed for the average, lower- and upper-bound undrained shear strength profiles established by Varathungarajan (2008) as well as for the undrained shear strength profiles determined from the Texas Cone Penetrometer blow counts using the improved correlation developed in this study. The computer software UTEXAS4 (Wright 1999) was utilized to carry out the analyses. Factors of safety were then compared to estimate the reliability of the improved correlation.
7.2 Conclusions The correlations by Kim et al. (2007) tended to produce strengths that ranged from
significantly lower to significantly higher than what are believed to be the undrained shear strength. The correlation suggests that as the moisture content increases the strength increases, which seems fundamentally unsound. An improved correlation (Equations 7.1 and 7.2) was developed based in part on the earlier correlations by Hamoudi et al. (1974) and Duderstadt et al. (1977). It was determined that even with a zero (“weight of hammer”) blow count, if the soil can support the weight of the cone, it has some strength. Thus, an intercept value of 300 psf was adopted and the following improved equation is proposed:
300 60 (7.1) where su is in psf. Equation 7.1 can also be expressed in the following form independent of the units used:
0.142 0.028 (7.2) where patmosphere is atmospheric pressure.
98
From the bearing capacity analyses, the factors of safety determined using the improved correlation showed good agreement with factors of safety determined using the strength profiles developed by Varathungarajan (2008); however, in some cases the factor of safety was apparently overestimated by as much as 60 percent.
7.3 Recommendations The improved correlation is recommended over the existing correlations and is intended
primarily for soft, shallow (less than 30 feet) clays with undrained shear strengths of 1200 psf (approximately 0.47 atmospheres) or less (TCP blow counts of 15 or less). Accordingly, this correlation should be used cautiously. In addition, higher design undrained shear strengths might be realized if more extensive field and laboratory testing. Guidance for such further testing can be found in Varathungarajan (2008). Further studies of the improved correlation for very soft soils would be useful, particularly for evaluation of the “intercept” value in Equation 7.2.
99
Appendix A
Undrained shear strength profiles, including upper- and lower-bounds, were developed for each site based on the results of the laboratory and field tests. Representative undrained shear strength profiles were selected based on judgment and the evaluation and interpretation of results of field and laboratory tests. These profiles are referred to as the average undrained shear strength profiles. The coordinates of the lines representing these profiles are presented in tables in this appendix. Elevation ranges where soils were identified as being non-clay and thus no undrained strengths were considered are indicated in these tables. The details of this data and how the strength profiles were established are presented by Varathungarajan (2008). The strength profiles are plotted in Figures 5.1 through 5.6, 5.10 through 5.15, and 6.3 through 6.7.
Table A.1: Site 1 undrained shear strength profile bounds.
Table A.2: Site 2 undrained shear strength profile bounds.
Table A.3: Site 3 undrained shear strength profile bounds.
Boring logs were prepared by Tolunay-Wong Engineers, Inc. (TWEI) for each of the six sites and are included in this appendix. Two boring logs were prepared for each site, one for the boring where Texas Highway Department cone penetration tests were performed and the other for the boring where thin-walled tube soil samples were taken. In addition, a summary table was prepared for the vane shear tests for each site with the exception of Site No. 3 due to the high strength of soil at this site. These boring logs and summary tables are presented in the following pages.
102
Site No. 1 – Port Arthur, TX (Site A)
Figure B.1: Boring log with Texas Cone Penetrometer tests for Site No. 1
103
Figure B.2: Boring log with thin-walled tube samples for Site No. 1
104
Table B.1: Field vane tests for Site No. 1
105
Site No. 2 – Port Arthur, TX (Site B)
Figure B.3: Boring log with thin-walled tube samples for Site No. 2
106
Figure B.4: Boring log with Texas Cone Penetrometer tests for Site No. 2
107
Table B.2: Field vane tests for Site No. 2
108
Site No. 3 – Mont Belvieu, TX
Figure B.5: Boring log with thin-walled tube samples for Site No. 3
109
Figure B.6: Boring log with Texas Cone Penetrometer tests for Site No. 2
110
Site No. 4 – Beaumont, TX
Figure B.7: Boring log with thin-walled tube samples for Site No. 4
111
Figure B.8: Boring log with thin-walled tube samples for Site No. 4
112
Table B.3: Field vane tests for Site No. 4
113
Site No. 5 – Cameron Parish, LA (Site A)
Figure B.9: Boring log with thin-walled tube samples for Site No. 5
114
Figure B.10: Boring log with Texas Cone Penetrometer tests for Site No. 5
115
Table B.4: Field vane tests for Site No. 5
116
Site No. 6 – Cameron Parish, LA (Site B)
Figure B.11: Boring log with thin-walled tube samples for Site No. 6
117
Figure B.12: Boring log with Texas Cone Penetrometer tests for Site No. 6
118
Table B.5: Field vane tests for Site No. 6
119
Appendix C
In Chapter 2, the minimum undrained shear strength required to support the Texas Cone Penetrometer cone was computed. A strength profile corresponding to the minimum strength required to support the cone was developed for each site and is shown in Figure 5.1 through 5.6 and 5.10 through 5.15. The computations for these strength profiles were made using Equations C.1, C.2, and C.3 and are presented in Tables C.2 to C.7. All constants are shown in Table C.1.
(C.1) (C.2)
(C.3)
Table C.1: Constants used in the Computations
Cone Weight, WC (lbs) 7 Cone Area, AC (ft2) 0.049 Drilling Rod Weight, WDR (lbs/ft) 4 Drilling Rod Length, LDR (ft) VariesDrilling Rod Area, ADR (ft2) 0.006 Hammer Weight, WH (lbs) 170
120
Table C.2: Minimum undrained shear strengths required to support the Texas Cone Penetrometer cone for Site No. 1
Elevation (ft) Depth (ft) Soil Type Unit Weight, γs (pcf) N σvο (psf) qTCP (psf) Su Req'd (psf)
Bjerrum, L., “Embankments on soft ground.” ASCE Conference on Performance of Earth-Supported Structures, Purdue University, 2, 1-54, 1972. Bridge Division, Texas Highway Department, Foundation Exploration and Design Manual, Second Edition, July, 1972. Duderstadt, Franklin J., Coyle, Harry M., and Bartoskewitz, Richard E., Correlation of the Texas Cone Penetrometer Test N-Value with Soil Shear Strength, Research Report 10-3F, Texas Transportation Institute, August, 1977. Flawn, Peter T., “Geologic Atlas of Texas, Houston Sheet,” Bureau of Economic Geology, The University of Texas at Austin, 1968. Flawn, Peter T., “Geologic Atlas of Texas, Beaumont Sheet,” Bureau of Economic Geology, The University of Texas at Austin, 1968. Hamoudi, Manaf M., Coyle, Harry M., and Bartoskewitz, Richard E., Correlation of the Texas Highway Department Cone Penetrometer Test with Unconsolidated-Undrained Shear Strength of Cohesive Soils¸ Research Report 10-1, Texas Transportation Institute, August, 1974. Kim, M. S., et al., Characterizing the Soft Clays in the Texas Gulf Coast Using the Texas Cone Penetrometer (TCP), The University of Houston, 2007. Lunne, Tom, Robertson, Peter K. and Powell, John J.M., “Cone Penetration Testing in Geotechnical Practice,” Blackie Academic & Professional, 1997. O’Malley, Edward S. and S. G. Wright, “Review of Undrained Shear Strength Testing Methods used by the Texas State Department of Highways and Public Transportation,” Research Report 446-1F, Center of Transportation Research, The University of Texas at Austin, November 1987. Texas Department of Transportation, “Geotechnical Manual,” Manual Notice 2000-1, October, 2000. Varathungarajan, David, Characterization of Undrained Shear Strength Profiles for Soft Clays at Six Texas Sites, Center of Transportation Research, The University of Texas at Austin, August 2008. Vijayvergiya, Vasant N., Hudson, W. Ronald, and Reese, Lymon C., Load Distribution of a Drilled Shaft in Clay Shale, Research Report No. 89-5, Center for Highway Research, March, 1969.