30 CHAPTER 2 - TOURISM The indicators under this theme measure the amount of forest area kept and governed by the respective regulatory authorities. An important section of the forested areas are those areas that are protected. The categories under this area include Strict Nature Reserve; Wilderness Area; Na- tional Park; National Monument; Habitat/Species Man- agement Area; Protected Landscape/Seascape and the Managed Resource Protected Area. The data provides information on the main characteristics of the various types of forest as a percentage of total for- est area and the amount of forest area as a percentage of total land. There are four (4) indicators covered in this section: 1. Forest Area; 2. Protected Forest Area 3. Protected forest area as % of total forest area 4. Proportion of land area covered by forest (MDG; CSMDG) These indicators are used to measure the possible impact that changes in the extent of forest cover would have on the conservation of biological diversity and eco-tourism, and on weather patterns. In addition, forest serve as a main barrier against high winds due to hur- ricanes and tropical storms. They hold the earth together preventing landslides and erosion The effects on the environment are also far-reaching as it relates to land use, energy and water consumption, and waste disposal. The data can be sourced from Forestry Commission Tourism contributes significantly to economies of the Caribbean region through direct earnings from the sector as well as indirectly through infrastructure development and the development of the hotel industry and craft industry among others. Tourism activities, however, can have adverse environmental effects as it exerts significant pressure on scarce resources such as land, water and energy. It also generates a large amount of waste. The situation with the use of water is improving as Tourism facilities have over the years implemented programmes to reduce their water use and initiatives such as Blue flag that encourage sustainable tourism. Regional groups such as the Caribbean Tourism Organisation have encouraged sustainable tourism projects to reduce the impact of tourism on the local environment. The data provided under this theme seek to measure and quantify the environmental and social implications such as accommodation, transportation, employment and catering as well as the country’s capacity to cater to and meet these demands. There are six (6) Indicators covered in this section: Tourist Arrivals by Type of Arrival and Number of Tourist Nights Spent; Tourist Intensity, Tourism Density and Tourist Penetration Ratio; Number of Hotels Classified by Number of Rooms, Beds and Rooms occupied by Year; Visitor Expenditure and Number Employed in Tourism; Tourist Arrivals by Type of Accommodation; and Tourist Arrivals by Country of Origin. The data were compiled from National Statistical Offices of the Member States and National Tourism Agencies. It should be noted that the Caribbean Tourism Organisation (CTO) provided a significant amount of data which allowed most of the data gaps in this area to be filled.
Transcript
30
CHAPTER 2 - TOURISM
The indicators under this theme measure the amount of
forest area kept and governed by the respective regulatory
authorities. An important section of the forested areas are
those areas that are protected. The categories under this
area include Strict Nature Reserve; Wilderness Area; Na-
tional Park; National Monument; Habitat/Species Man-
agement Area; Protected Landscape/Seascape and the
Managed Resource Protected Area.
The data provides information on the main characteristics
of the various types of forest as a percentage of total for-
est area and the amount of forest area as a percentage of
total land. There are four (4) indicators covered in this
section:
1. Forest Area;
2. Protected Forest Area
3. Protected forest area as % of total forest area
4. Proportion of land area covered by forest
(MDG; CSMDG)
These indicators are used to measure the possible impact
that changes in the extent of forest cover would have on
the conservation of biological diversity and eco-tourism,
and on weather patterns. In addition, forest serve
as a main barrier against high winds due to hur-
ricanes and tropical storms. They hold the earth
together preventing landslides and erosion The effects on
the environment are also far-reaching as it relates to land
use, energy and water consumption, and waste disposal.
The data can be sourced from Forestry Commission
Tourism contributes significantly to economies of the
Caribbean region through direct earnings from the
sector as well as indirectly through infrastructure
development and the development of the hotel industry
and craft industry among others. Tourism activities,
however, can have adverse environmental effects as it
exerts significant pressure on scarce resources such as
land, water and energy. It also generates a large amount
of waste.
The situation with the use of water is improving as
Tourism facilities have over the years implemented
programmes to reduce their water use and initiatives
such as Blue flag that encourage sustainable tourism.
Regional groups such as the Caribbean Tourism
Organisation have encouraged sustainable tourism
projects to reduce the impact of tourism on the local
environment.
The data provided under this theme seek to measure
and quantify the environmental and social implications
such as accommodation, transportation, employment
and catering as well as the country’s capacity to cater
to and meet these demands. There are six (6) Indicators
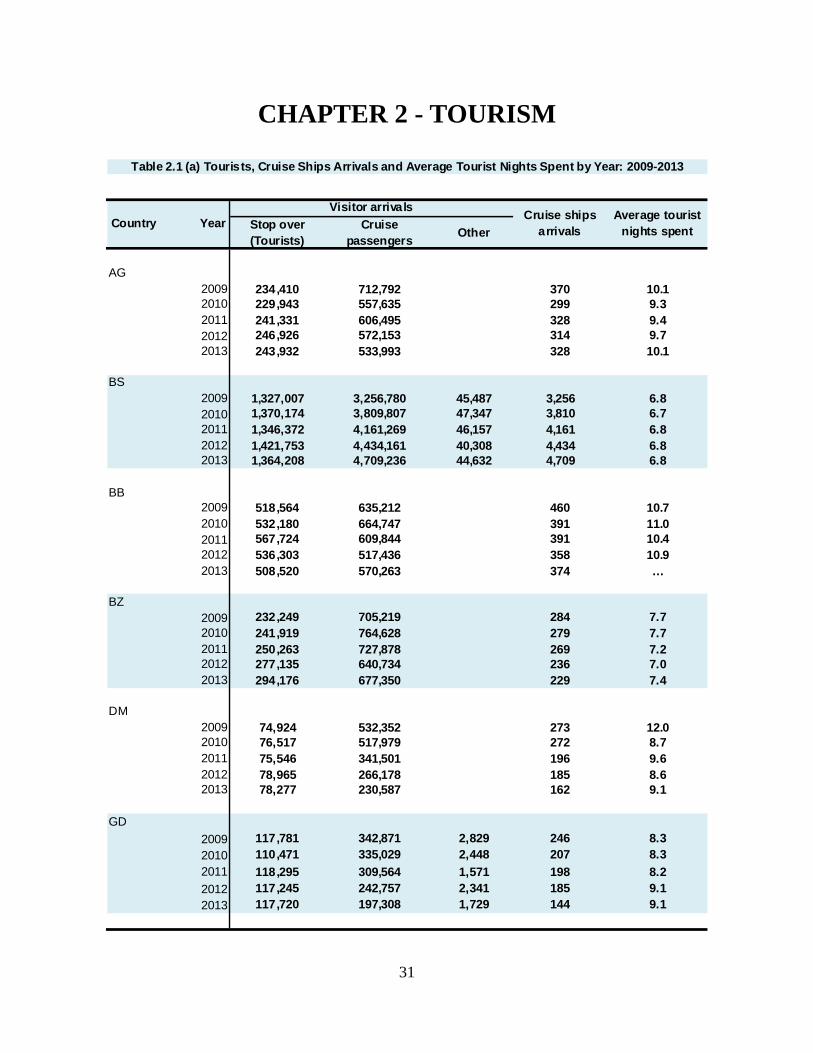
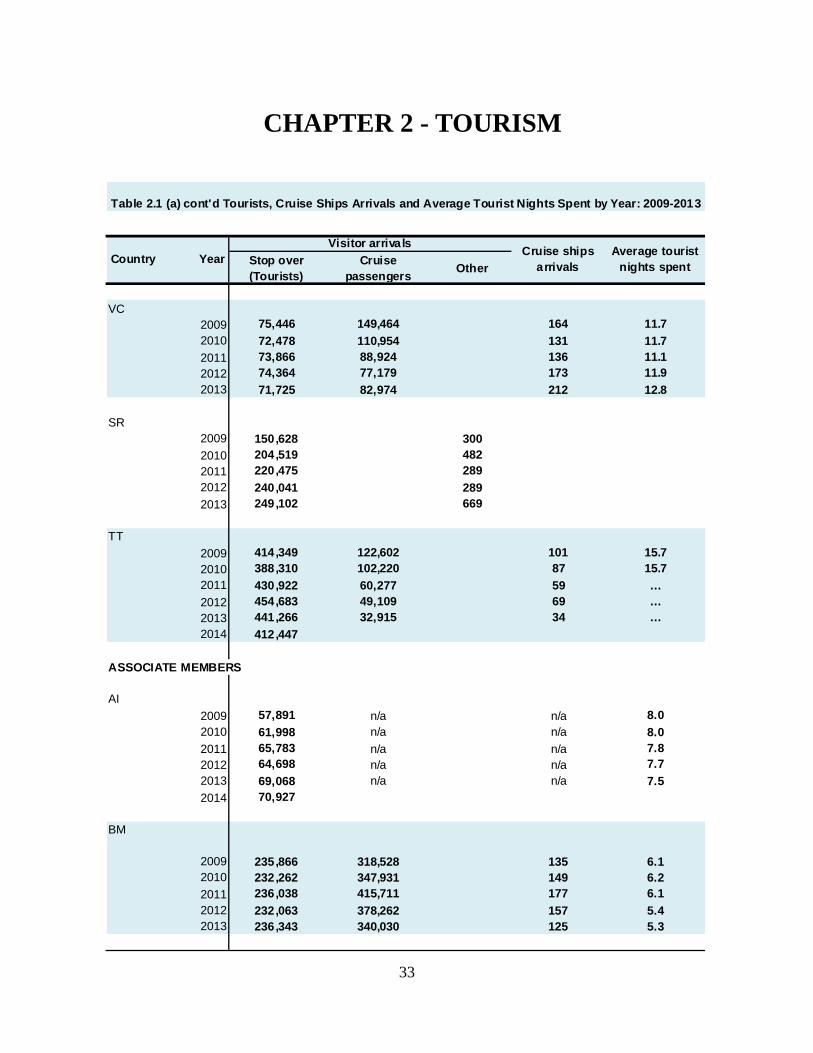
covered in this section: Tourist Arrivals by Type of
Arrival and Number of Tourist Nights Spent; Tourist
Intensity, Tourism Density and Tourist Penetration
Ratio; Number of Hotels Classified by Number of
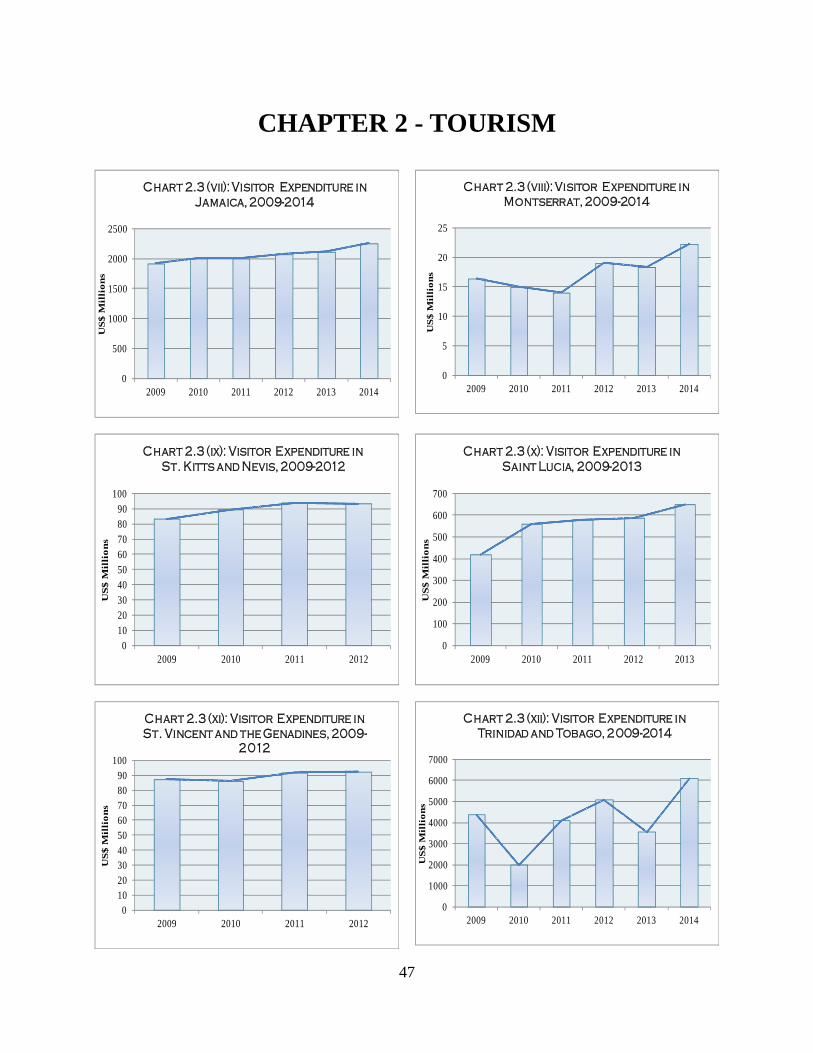
Rooms, Beds and Rooms occupied by Year; Visitor
Expenditure and Number Employed in Tourism;
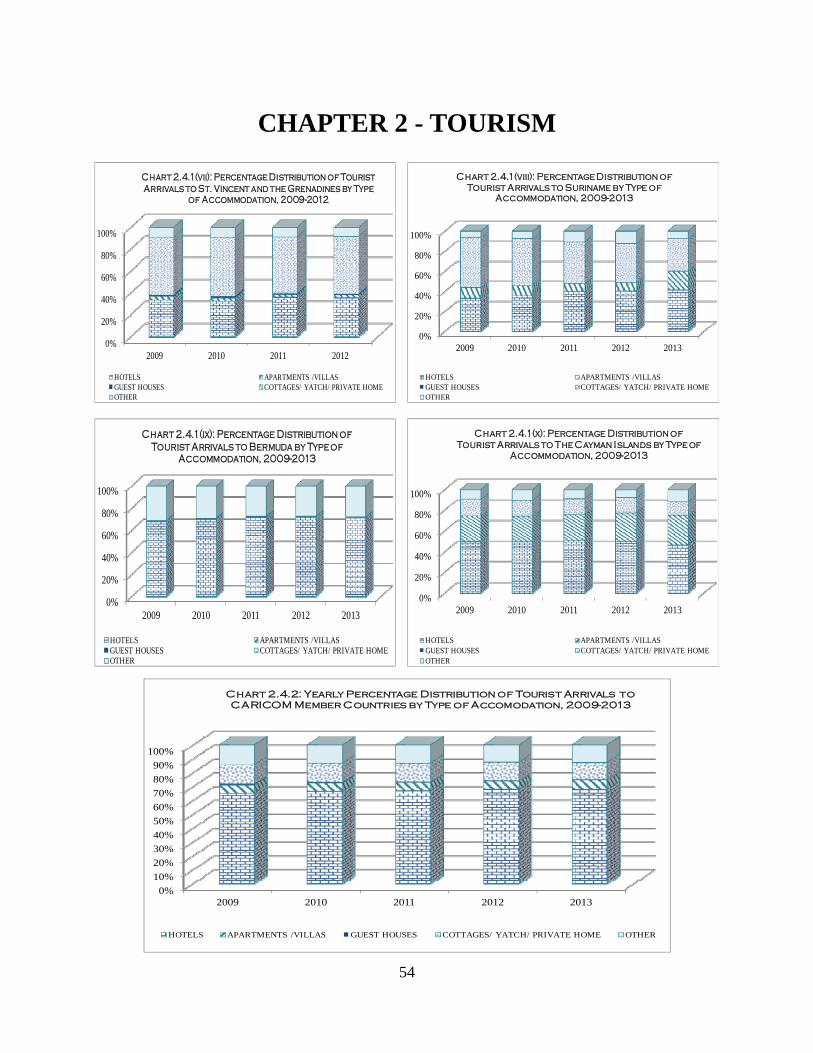
Tourist Arrivals by Type of Accommodation; and
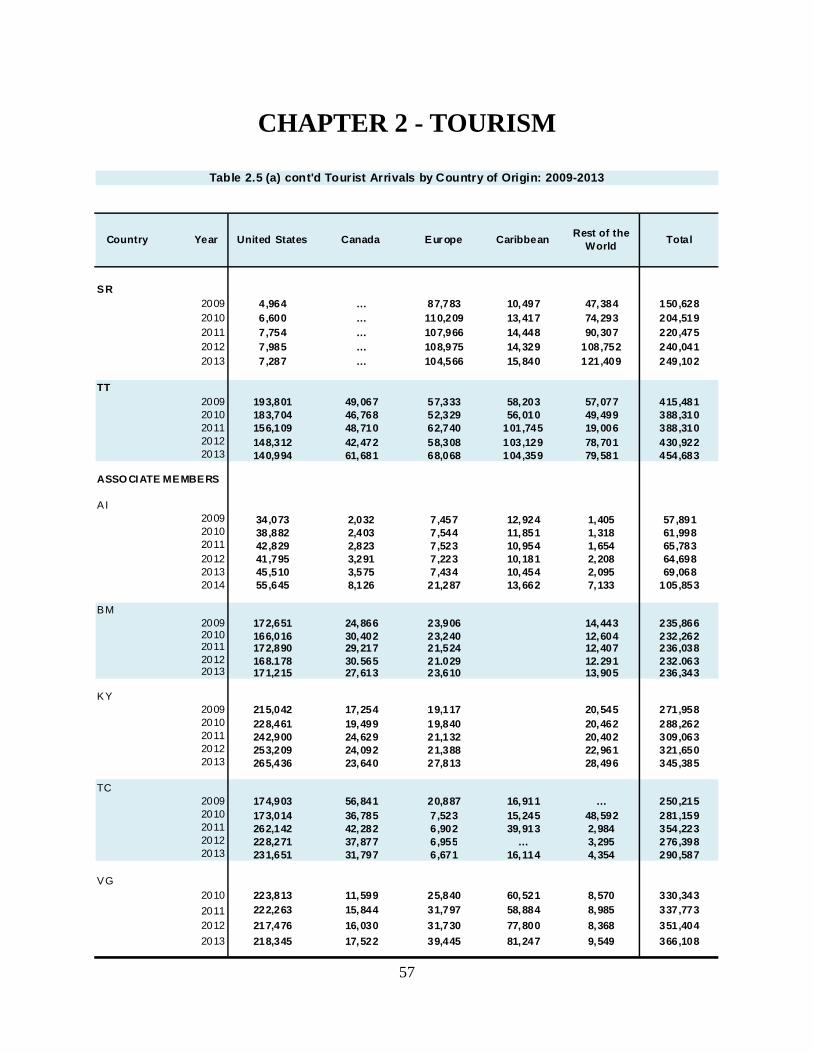
Tourist Arrivals by Country of Origin.
The data were compiled from National Statistical
Offices of the Member States and National Tourism
Agencies. It should be noted that the Caribbean
Tourism Organisation (CTO) provided a significant
amount of data which allowed most of the data gaps in
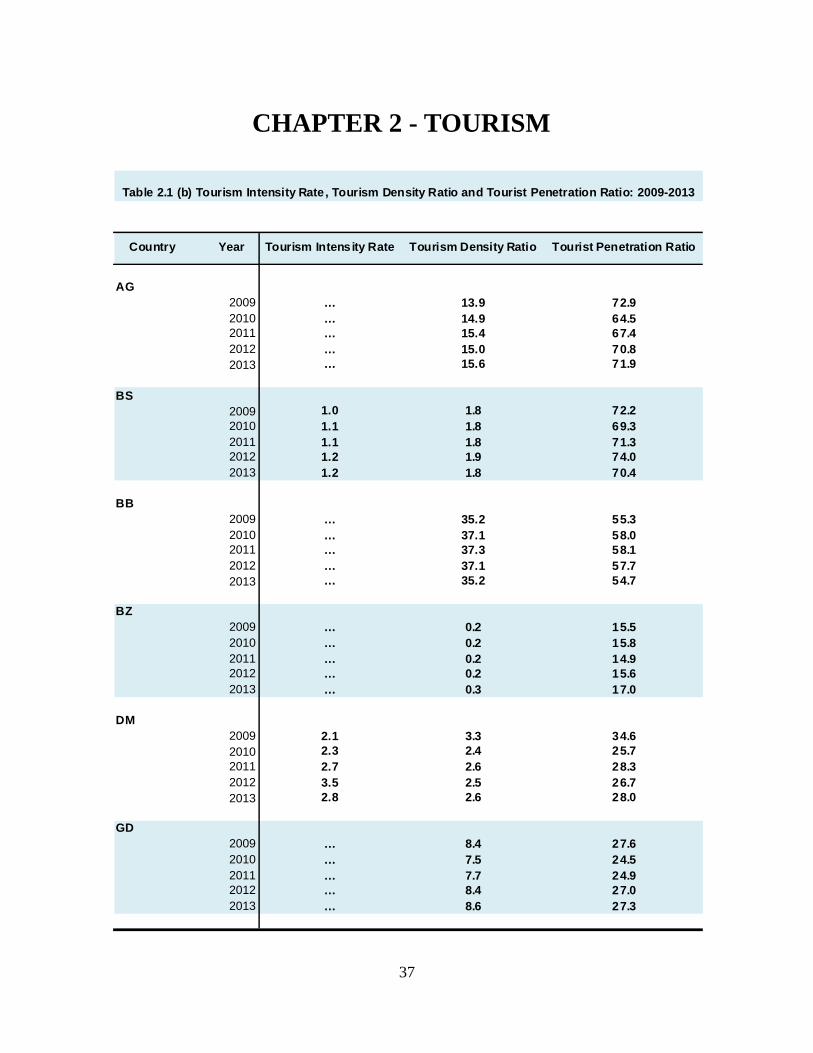
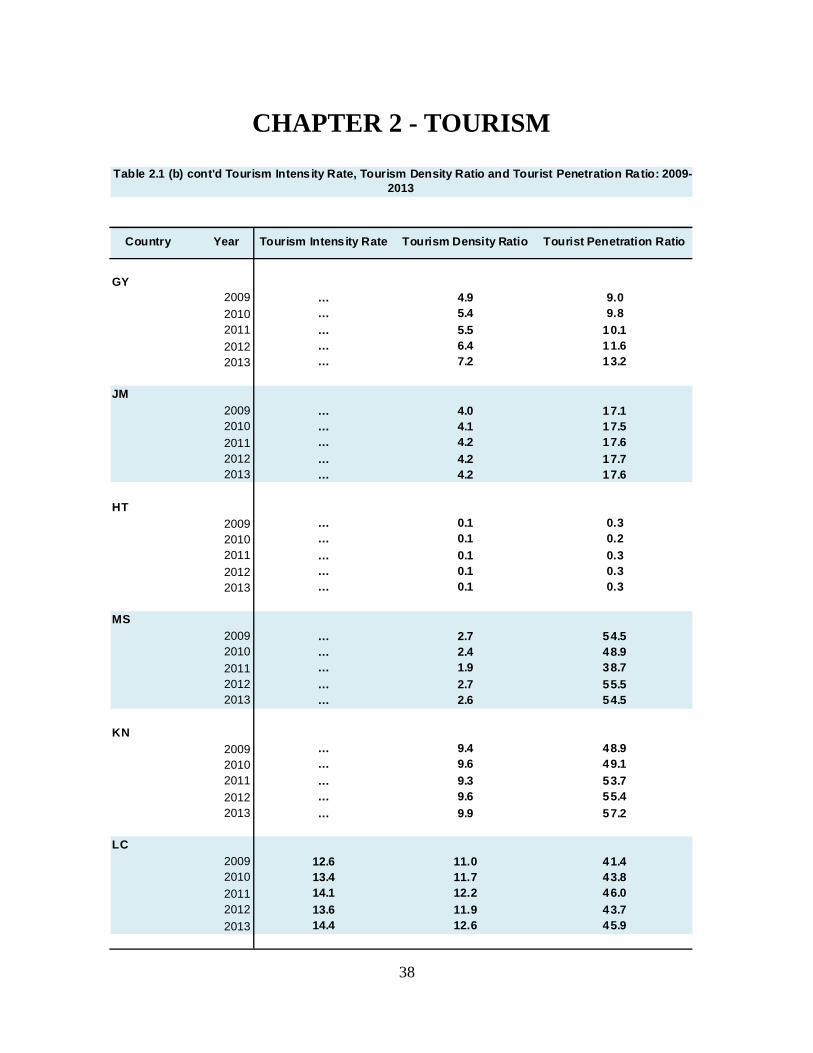
Table 2.1 (b) cont'd Tourism Intensity Rate, Tourism Density Ratio and Tourist Penetration Ratio: 2009-2013
Tourism Intensity Rate Tourist Penetration RatioCountry Year Tourism Density Ratio
40
CHAPTER 2 - TOURISM
Tourism Intensity Rate (TIR): The indicator “arrivals/population” provides an estimate of tourism intensity in the country of reference. This indicator is calculated by World Tourism Organization (UNWTO) based on the available basic data on inbound and domestic tourism, which can be either the number of visitors or the number of tourists. (UNWTO Methodological Notes to the Tourism Statistics Database at http://cf.cdn.unwto.org/sites/all/files/pdf/2015_metho_notes_eng_0.pdf) Tourism Intensity Rate is calculated as the Number of Visitors/tourists divided by per 1,000 population divided by the Country area in square kilometers
Tourism Density Ratio (TDR): This ratio attempts to show the density of tourist in the country at any one time on average. Its value is limited by the fact that tourist flows are season and tourism activity tends to be concentrated in specific geographical areas.(Caribbean Tourism Organization) Tourism Density Ratio is calculated as the Number of Visitors times average stay divided by land area times 365. Tourist Penetration Ratio (TPR): The penetration ratio quantifies the average number of tourists, per thousand local inhabitants, in the country at any one time. The value of this ratio is constrained by the fact that tourist flows are seasonal and cruise passengers are not. (Caribbean Tourism Organization) Tourist Penetration Ratio is calculated as the Average stay times number of visitors divided by 365 times mid year population estimates.
Table 2 .3 cont'd Visitor Expenditure and Number Employed in Tourism: 2009-2013
Expenditure on accommodation,
meals and drinks, shopping,
entertainment etc. ('000US$)
Total directly employed in tourism
Country YearVisitor
expenditure (US$M)
Int'l and domestic tourism
expenditure ('000US$)
Expenditure on same-day
visits ('000US$)
45
CHAPTER 2 - TOURISM
Concept and Definitions
Tourism Expenditure refers to the amount paid for the acquisition of consumption goods and services, as well as valuables, for own use or to give away, for and during tourism trips. It includes expenditures by visitors themselves, as well as expenses that are paid for or reimbursed by others.
It excludes the acquisition of certain items such as social transfers in kind that benefit visitors, the imputation of accommodation services from owned vacation homes and financial intermediation services indirectly measured.
Expenditures on same-day visits are defined as the expenditures of visitors who spend less than twenty-four hours in the country being visited.
Categories of Tourism Expenditures
Three categories of tourism expenditure based on the country of residence of the transactors involved, can be defined as follows:
Domestic tourism expenditure is the tourism expenditure of a resident visitor within the economy of reference;
Inbound tourism expenditure is the tourism expenditure of a non-resident visitor within the economy of reference;
Outbound tourism expenditure is the tourism expenditure of a resident visitor outside the economy of reference.
(Please refer to the International Recommendations for Tourism Statistics 2008 (IRTS 2008) )
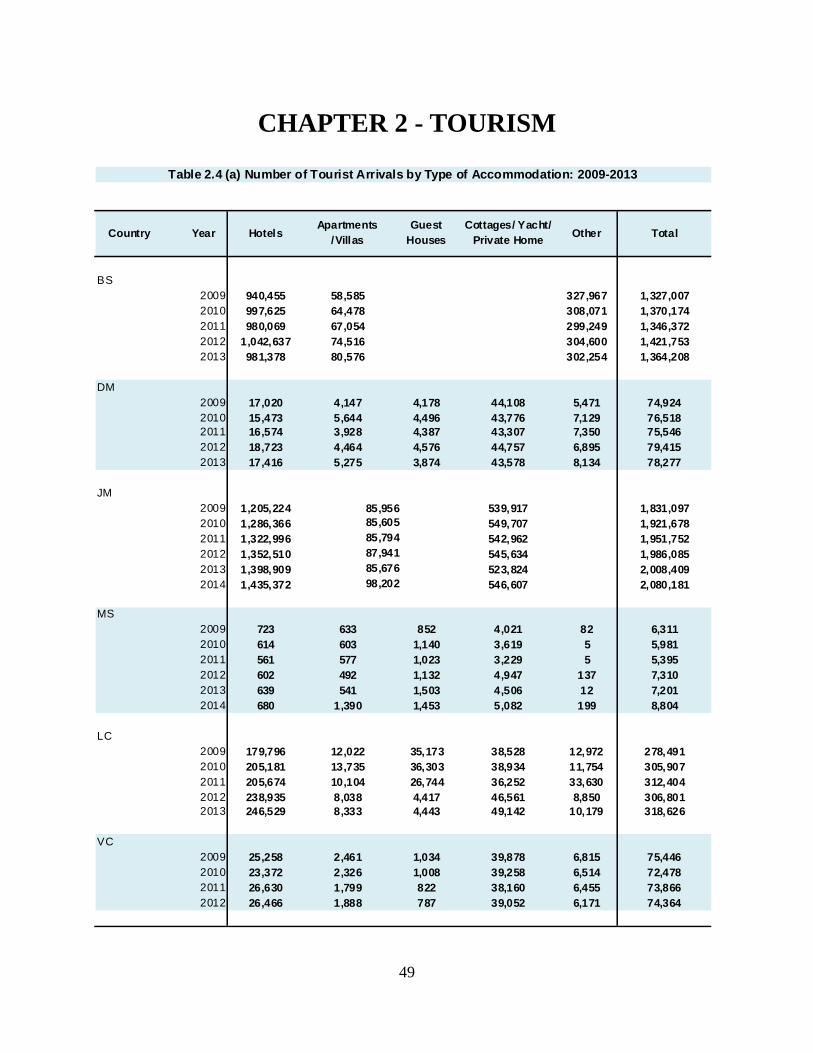
Table 2.4 (a) Number of Tourist Arrivals by Type of Accommodation: 2009-2013
TotalCountry Year HotelsApartments
/VillasGuest
HousesOther
Cottages/ Yacht/ Private Home
85,95685,60585,79487,94185,67698,202
50
CHAPTER 2 - TOURISM
Concept and Definition Tourist accommodation refers to any facility that regularly or occasionally provides overnight accommodation for tourists. There are two basic categories of tourist accommodations: Collective accommodation establishments: e.g. Hotels and similar establishments; and, Private tourist accommodations: e.g. owned dwellings, rented rooms in family homes, accommodation provided by
friends and relatives. (Please refer to the Caribbean Tourism Organisation Statistical Report)
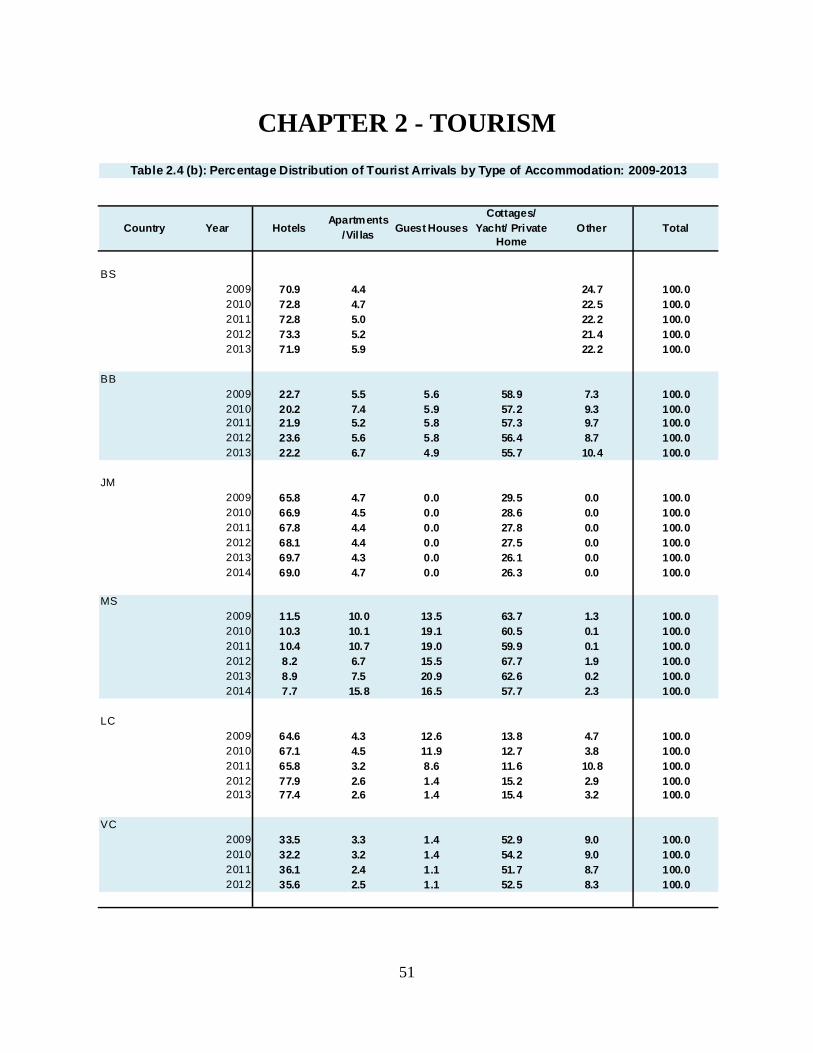
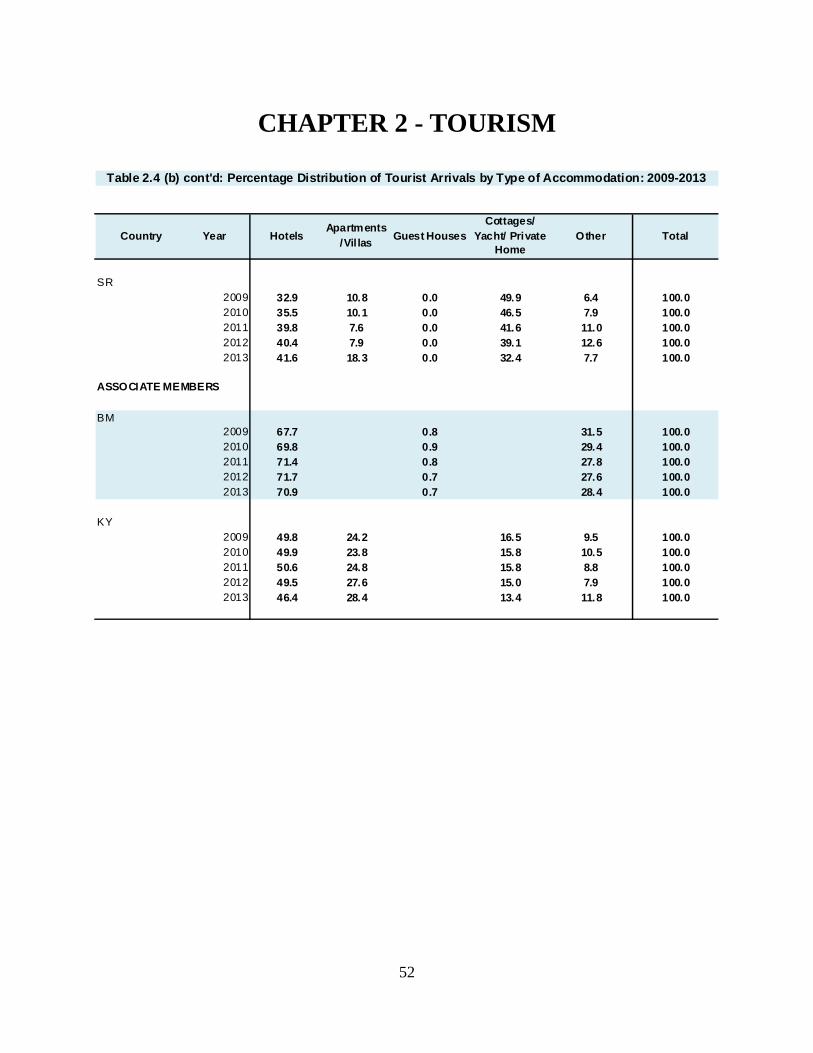
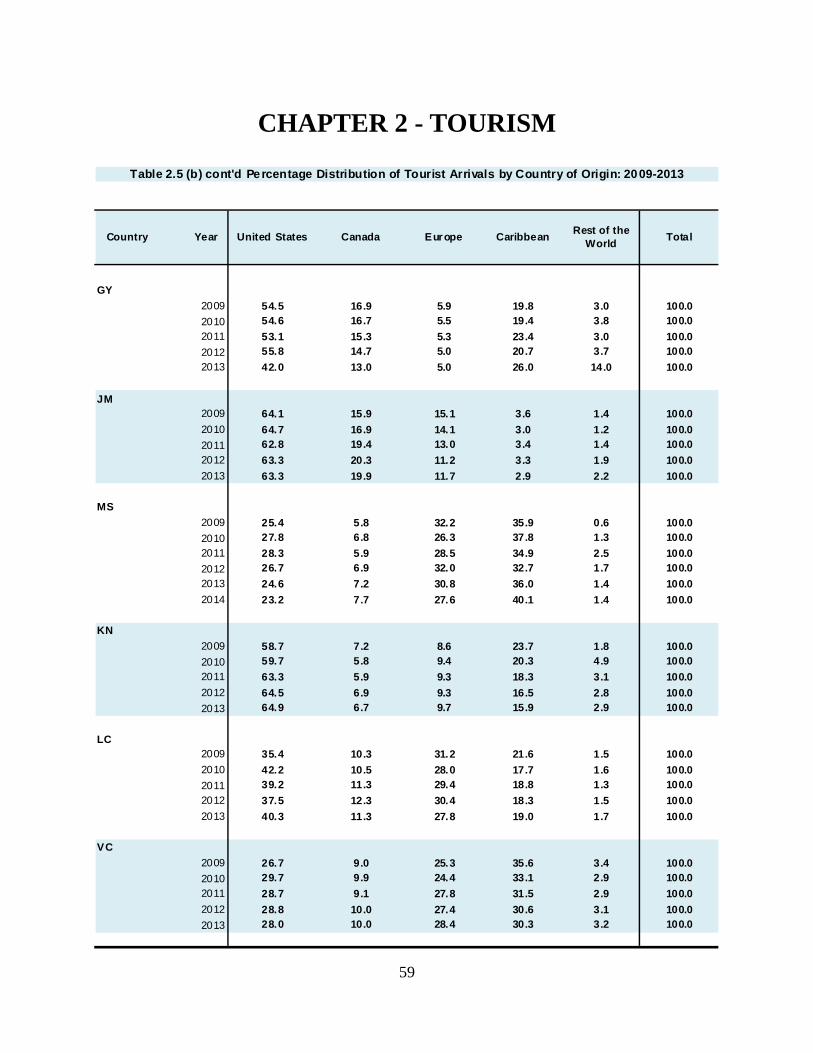
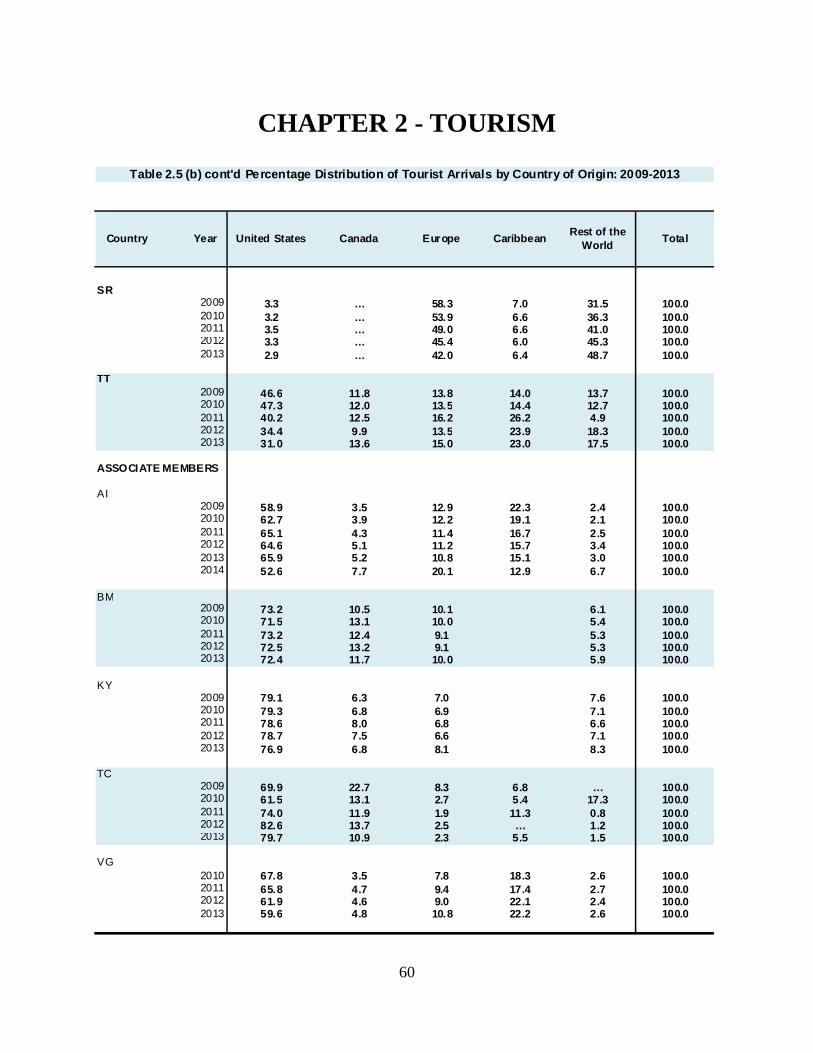
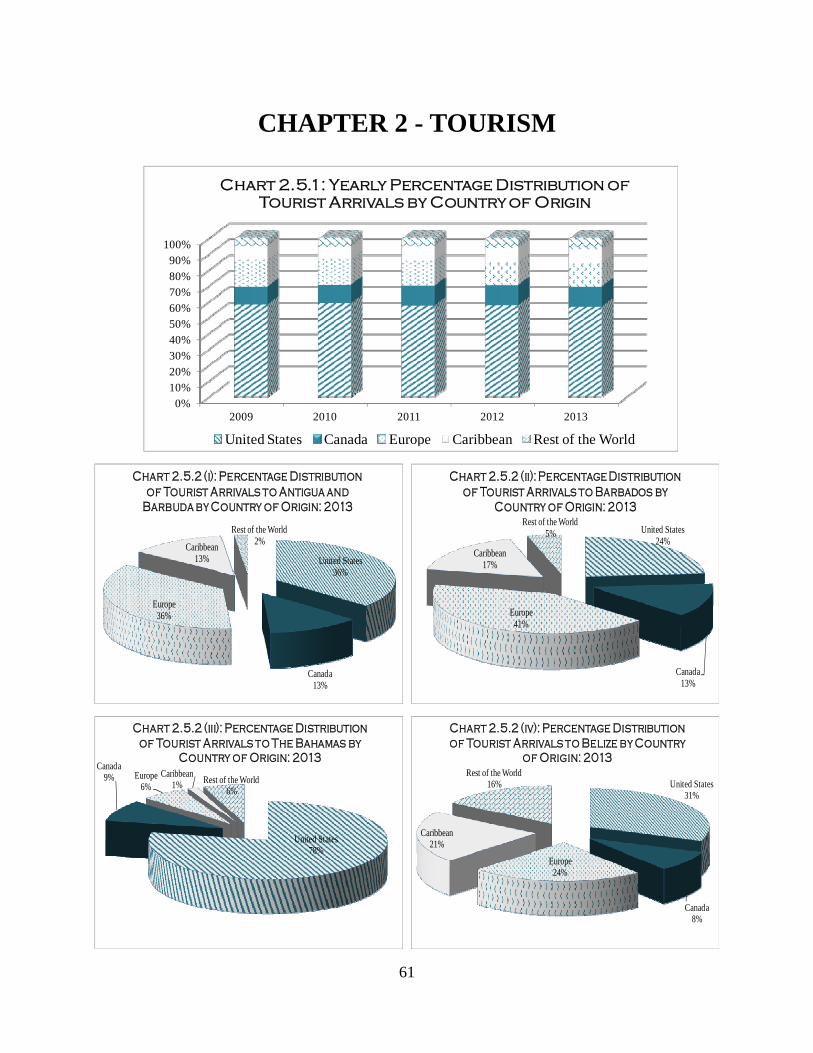
Table 2.5 (b) cont'd Percentage Distribution of Tourist Arrivals by Country of Origin: 2009-2013
Country Year United States Canada Europe CaribbeanRest of the
WorldTotal
61
CHAPTER 2 - TOURISM
United States78%
Canada9% Europe
6%Caribbean
1% Rest of the World6%
Chart 2.5.2 (iii): Percentage Distribution of Tourist Arrivals to The Bahamas by
Country of Origin: 2013
United States31%
Canada8%
Europe24%
Caribbean21%
Rest of the World16%
Chart 2.5.2 (iv): Percentage Distribution of Tourist Arrivals to Belize by Country
of Origin: 2013
United States24%
Canada13%
Europe41%
Caribbean17%
Rest of the World5%
Chart 2.5.2 (ii): Percentage Distribution of Tourist Arrivals to Barbados by
Country of Origin: 2013
United States36%
Canada13%
Europe36%
Caribbean13%
Rest of the World2%
Chart 2.5.2 (i): Percentage Distribution of Tourist Arrivals to Antigua and
Barbuda by Country of Origin: 2013
0%
10%
20%
30%
40%
50%
60%
70%
80%
90%
100%
2009 2010 2011 2012 2013
Chart 2.5.1: Yearly Percentage Distribution of Tourist Arrivals by Country of Origin
United States Canada Europe Caribbean Rest of the World
62
CHAPTER 2 - TOURISM
United States42%
Canada13%
Europe5%
Caribbean26%
Rest of the World14%
Chart 2.5.2 (vii): Percentage Distribution of Tourist Arrivals to The Guyana by
Country of Origin: 2013
United States63%
Canada20%
Europe12%
Caribbean3% Rest of the World
2%
Chart 2.5.2 (viii): Percentage Distribution of Tourist Arrivals to Jamaica by
Country of Origin: 2013
United States25%
Canada7%
Europe31%
Caribbean36%
Rest of the World1%
Chart 2.5.2 (ix): Percentage Distribution of Tourist Arrivals to The Montserrat by
Country of Origin: 2013
United States65%
Canada6%
Europe10%
Caribbean16%
Rest of the World3%
Chart 2.5.2 (x): Percentage Distribution of Tourist Arrivals to St. Kitts and Nevis
by Country of Origin: 2013
United States23%
Canada4%
Europe17%
Caribbean53%
Rest of the World3%
Chart 2.5.2 (v): Percentage Distribution of Tourist Arrivals to The Dominica by
Country of Origin: 2013
United States31%
Canada8%
Europe24%
Caribbean21%
Rest of the World16%
Chart 2.5.2 (vi): Percentage Distribution of Tourist Arrivals to Grenada by
Country of Origin: 2013
63
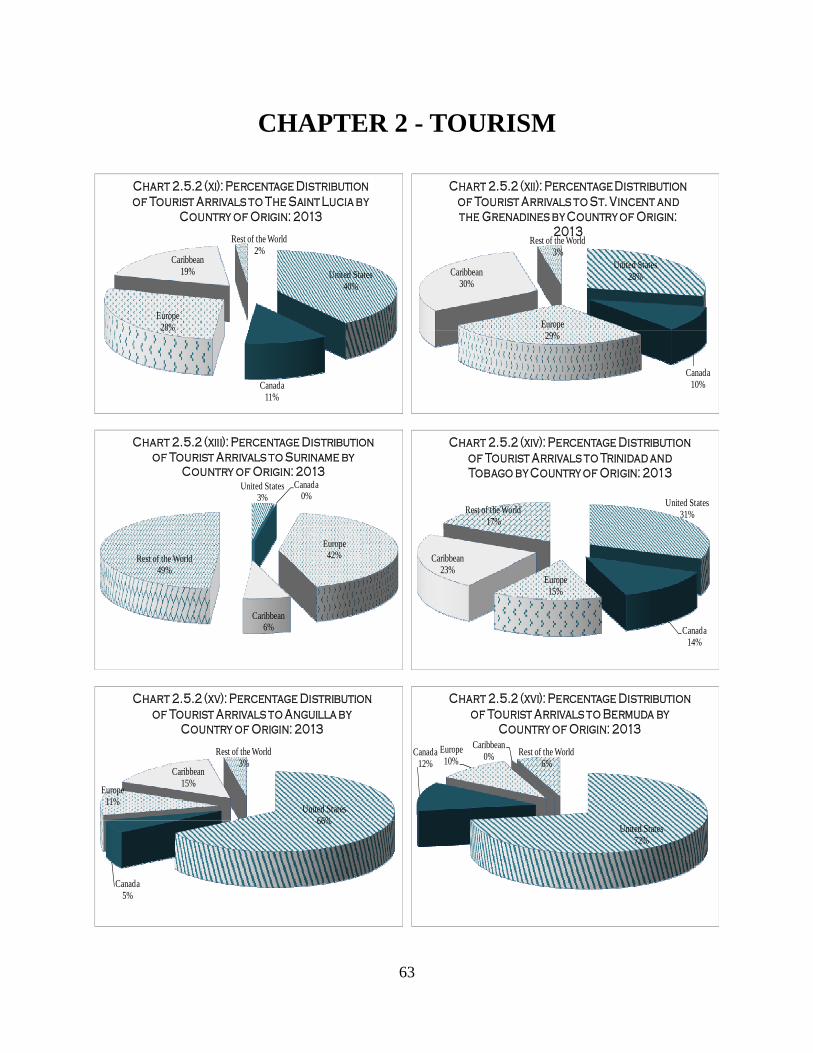
CHAPTER 2 - TOURISM
United States40%
Canada11%
Europe28%
Caribbean19%
Rest of the World2%
Chart 2.5.2 (xi): Percentage Distribution of Tourist Arrivals to The Saint Lucia by
Country of Origin: 2013
United States28%
Canada10%
Europe29%
Caribbean30%
Rest of the World3%
Chart 2.5.2 (xii): Percentage Distribution of Tourist Arrivals to St. Vincent and the Grenadines by Country of Origin:
2013
United States3%
Canada0%
Europe42%
Caribbean6%
Rest of the World49%
Chart 2.5.2 (xiii): Percentage Distribution of Tourist Arrivals to Suriname by
Country of Origin: 2013
United States31%
Canada14%
Europe15%
Caribbean23%
Rest of the World17%
Chart 2.5.2 (xiv): Percentage Distribution of Tourist Arrivals to Trinidad and Tobago by Country of Origin: 2013
United States66%
Canada5%
Europe11%
Caribbean15%
Rest of the World3%
Chart 2.5.2 (xv): Percentage Distribution of Tourist Arrivals to Anguilla by
Country of Origin: 2013
United States72%
Canada12%
Europe10%
Caribbean0% Rest of the World
6%
Chart 2.5.2 (xvi): Percentage Distribution of Tourist Arrivals to Bermuda by
Country of Origin: 2013
64
CHAPTER 2 - TOURISM
Concepts and Definitions
Tourist Arrivals include all stay-over (or overnight) visitors. It does not, however, include same-day visitors such as cruise passengers and yacht arrivals.
Country of Origin: This is the place/country from which the trip originates. It is usually the same as the place and country of residence.
The trip may also start from the place of work or education. This is not relevant for tourism since the place of residence may still be considered as the origin. When people live in another place than their usual residence during the survey period (e.g. short-term migrants and seasonal workers), this place should be taken as the origin. For day trips the place of origin may be the second regular residence of the person although it is useful to distinguish them from trips originating from the first residence.
Country of Residence: A person is considered to be a resident in a country (place) if the person (i) has lived for most of the past year or 12 months in that country (place), or (ii) has lived in that country (place) for a shorter period and intends to return within 12 months to live in that country (place).
Please refer to Eurostat (1996). Applying the Eurostat Methodological Guidelines In Basic Tourism and Travel Statistics. http://epp.eurostat.ec.europa.eu/
United States77%
Canada7%
Europe8%
Caribbean0% Rest of the World
8%
Chart 2.5.2 (xviii): Percentage Distribution of Tourist Arrivals to The Cayman Islands by
Country of Origin: 2013
United States60%
Canada5%
Europe11%
Caribbean22%
Rest of the World2%
Chart 2.5.2 (xvii): Percentage Distribution of Tourist Arrivals to The British Virgin Islands
by Country of Origin: 2013
United States80%
Canada11%
Europe2%
Caribbean6% Rest of the World
1%
Chart 2.5.2 (xix): Percentage Distribution of Tourist Arrivals to The Turks and
CaicosIslands by Country of Origin: 2013
65
CHAPTER 2 - TOURISM
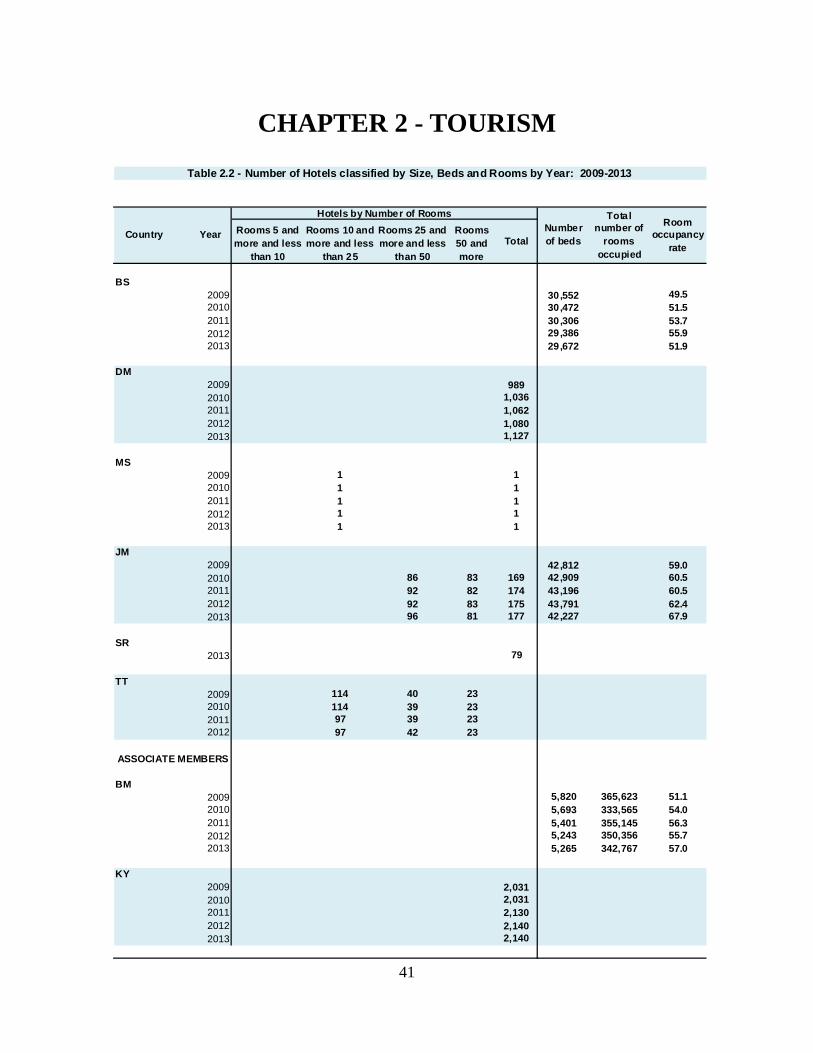
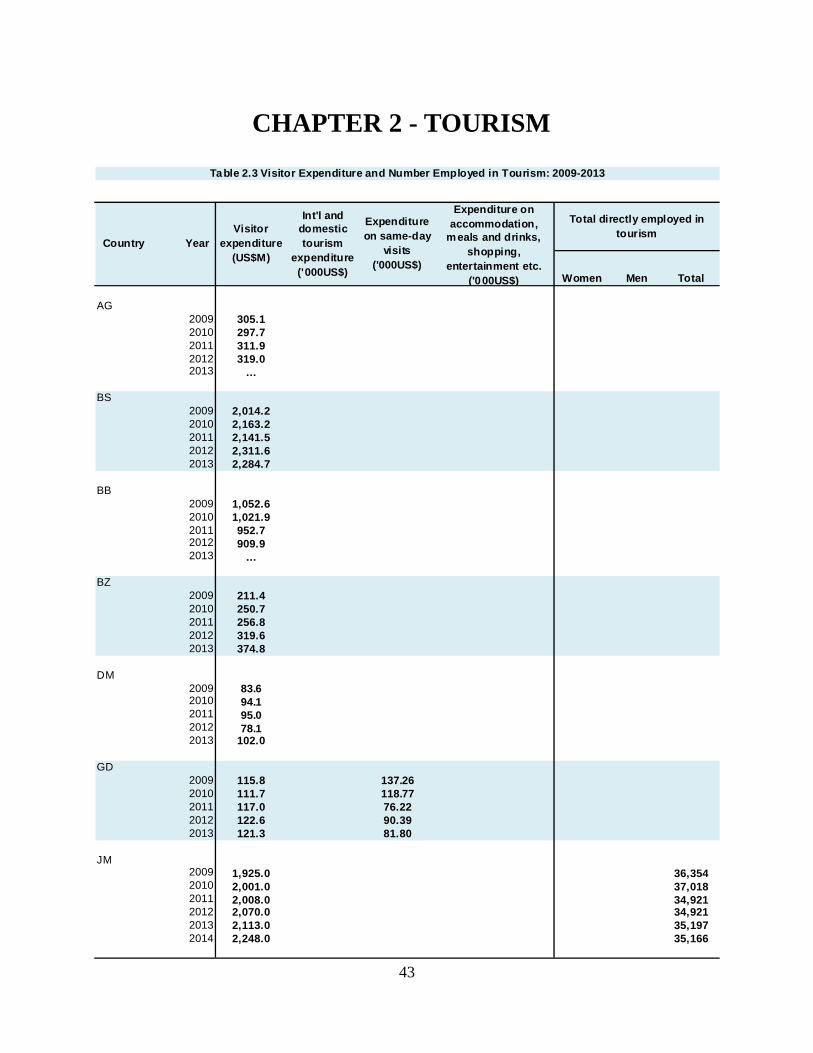
DATA GAPS Table 2.1 (a) Tourists, Cruise Ships Arrivals and Average tourist nights spent by year Twelve (12) countries submitted data from 2009 -2013 for this table with the remaining gaps filled with data from the Caribbean Tourism Organisation (CTO). Data on the indicator the average tourist nights spent were submitted by six (6) countries and CTO data were used to fill this particular data gap. Table 2.1 (b) Tourism Intensity Rate, Tourism Density Ratio and Tourist Penetration Ratio Five (5) countries supplied the requested data on the Tourism Intensity Rate and Tourist Penetration Ratio while remaining countries with missing data were filled with data from the CTO. Table 2.2 - Number of Hotels classified by Size, Beds and Rooms by Year Table 2.2 presents data on four indicators for the period 2009-2013. Eight (8) countries reported on this table of which six (6) countries reported for the entire period 2009-2013, one country up to 2012 and one country for 2013 only. Three (3) countries providing details for the Hotels by Number of Rooms and two (2) countries providing totals only. Two (2) countries provided data for the Number of beds as well as the Room occupancy rate and one country provided data for the Number of beds, Room occupancy rate and the Total number of rooms occupied. There are no data for twelve (12) countries for this table. Table 2.3 Visitor expenditure and Number Employed in Tourism Seven (7) countries submitted data on the Total Visitor Expenditure with three (3) countries also submitting data on expenditure by category. Data for ten (10) countries were sourced from the CTO. Total number of persons directly employed in tourism was submitted by two (2) countries with one country also submitting data disaggregated by sex. Large data gaps exists for Visitor expenditure by category and the Total number of persons directly employed in tourism by sex. Table 2.4 Number of Tourist Arrivals by Type of Accommodation Data were received from eight (8) countries for the entire period 2009-2014. Twelve countries (12) have therefore not submitted data for this table. Table 2.5 Tourist Arrivals by Country of Origin Data were submitted by twelve (12) countries, however, the table has been updated with data for a total of eighteen (18) countries; six (6) through the use of the CTO database. Missing data exists for two (2) countries. In summary, the tables that require data on tourism accommodation contained the most data gaps. Most countries also did not submit data on the indicators which measure the impact of tourism.
66
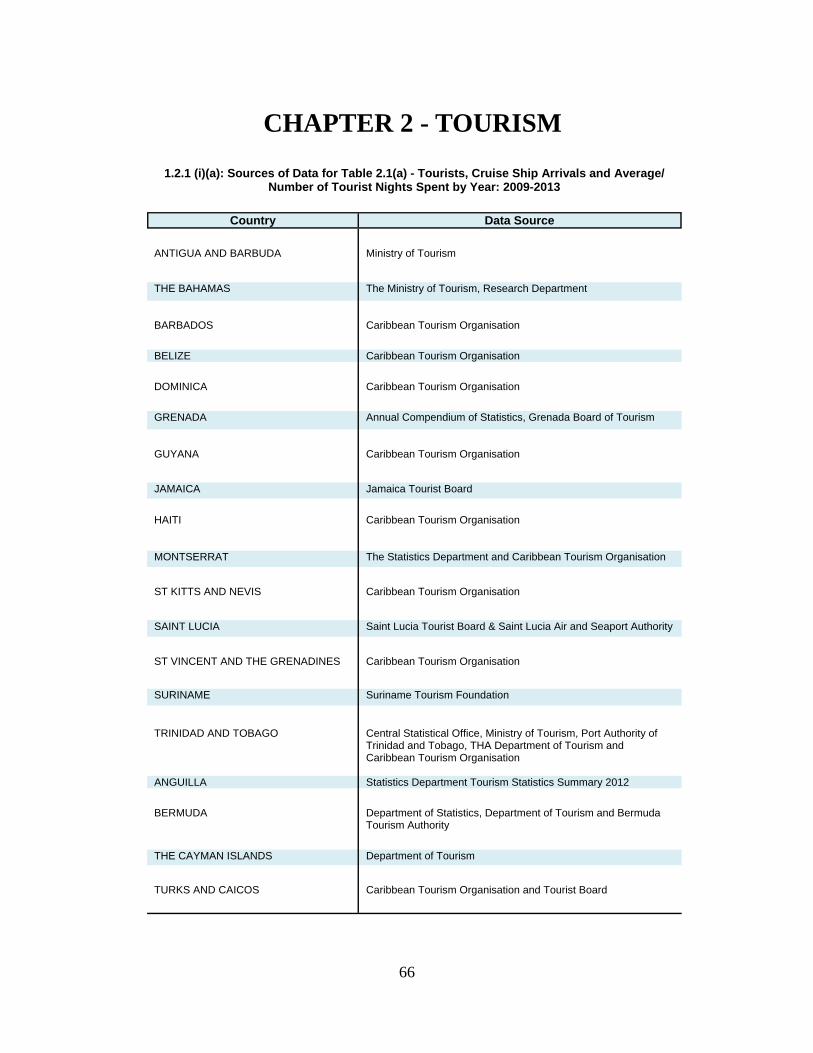
CHAPTER 2 - TOURISM
1.2.1 (i)(a): Sources of Data for Table 2.1(a) - Tourists, Cruise Ship Arrivals and Average/Number of Tourist Nights Spent by Year: 2009-2013
Country Data Source
ANTIGUA AND BARBUDA Ministry of Tourism
THE BAHAMAS The Ministry of Tourism, Research Department
GRENADA Annual Compendium of Statistics, Grenada Board of Tourism
GUYANA Caribbean Tourism Organisation
JAMAICA Jamaica Tourist Board
HAITI Caribbean Tourism Organisation
ST KITTS AND NEVIS Caribbean Tourism Organisation
SAINT LUCIA Saint Lucia Tourist Board & Saint Lucia Air and Seaport Authority
ST VINCENT AND THE GRENADINES Caribbean Tourism Organisation
SURINAME Suriname Tourism Foundation TRINIDAD AND TOBAGO Central Statistical Office, Ministry of Tourism, Port Authority of
Trinidad and Tobago, THA Department of Tourism and Caribbean Tourism Organisation
ANGUILLA Statistics Department Tourism Statistics Summary 2012 BERMUDA Department of Statistics, Department of Tourism and Bermuda
Tourism Authority
THE CAYMAN ISLANDS Department of Tourism
TURKS AND CAICOS Caribbean Tourism Organisation and Tourist Board
MONTSERRAT The Statistics Department and Caribbean Tourism Organisation
67
CHAPTER 2 - TOURISM
1.2.1(i)(b): Notes for Table 2.1 (a) Tourists, Cruise Ship Arrivals and Average/Number of Tourist Nights Spent by Year: 2009-2013
Country Notes
JAMAICA Cruise passengers include armed forces on naval vessels.
1.2.1(ii) (a): Sources of Data for Table 2.1 (b): Tourism Intensity Rate, Tourism Density Ratio and Tourist Penetration Ratio: 2009-2013
Country Data Source
ANTIGUA AND BARBUDA Caribbean Tourism Organisation
THE BAHAMAS The Ministry of Tourism
BARBADOS Caribbean Tourism Organisation BELIZE Caribbean Tourism Organisation DOMINICA Environment Statistics 2014 report and the Caribbean Tourism Organisation
GRENADA Caribbean Tourism Organisation
GUYANA Caribbean Tourism Organisation
JAMAICA Caribbean Tourism Organisation
HAITI Caribbean Tourism Organisation
MONTSERRAT Caribbean Tourism Organisation
ST KITTS AND NEVIS Caribbean Tourism Organisation
68
CHAPTER 2 - TOURISM
1.2.2 (a): Sources of Data for Table 2.2: Number of Hotels Classified by Number of Rooms, Beds and Rooms occupied by Year
Country Data Source
THE BAHAMAS The Ministry of Tourism
DOMINICA Environment Statistics 2014 report MONTSERRAT The Statistics Department
JAMAICA Jamaica Tourist Board
BERMUDA Department of Statistics, Department of Tourism and Bermuda Tourism Authority
THE CAYMAN ISLANDS Cayman Islands Department of Tourism
TRINIDAD AND TOBAGO Central Statistical Office
SURINAME Suriname Tourism Board
1.2.1(ii) (a): Sources of Data for Table 2.1 (b): Tourism Intensity Rate, Tourism Density Ratio and Tourist Penetration Ratio: 2009-2013
Country Data Source
SAINT LUCIA Central Statistics Office and Caribbean Tourism Organisation ST VINCENT AND THE GRENADINES Caribbean Tourism Organisation
SURINAME Caribbean Tourism Organisation
TRINIDAD AND TOBAGO Caribbean Tourism Organisation ANGUILLA Caribbean Tourism Organisation BERMUDA Department of Statistics, Department of Tourism and Bermuda Tourism Au-
thority and Caribbean Tourism Organisation
THE BRITISH VIRGIN ISLANDS Caribbean Tourism Organisation
THE CAYMAN ISLANDS Caribbean Tourism Organisation
TURKS AND CAICOS Caribbean Tourism Organisation
Tourist Board
69
CHAPTER 2 - TOURISM
1.2.3(a): Sources of Data for Table 2.3: Visitor Expenditure and Number Employed in Tourism
Country Data Source
ANTIGUA AND BARBUDA Caribbean Tourism Organisation
THE BAHAMAS Department of Statistics, Expenditure Surveys
BARBADOS Barbados Statistical Service BELIZE Statistical Institute of Belize DOMINICA Caribbean Tourism Organisation
GRENADA Annual Compendium of Statistics, Grenada Board of Tourism
JAMAICA Jamaica Tourist Board
HAITI Caribbean Tourism Organisation
ST KITTS AND NEVIS Caribbean Tourism Organisation
SAINT LUCIA Saint Lucia Tourist Board ST VINCENT AND THE GRENADINES Caribbean Tourism Organisation
SURINAME Caribbean Tourism Organisation
TRINIDAD AND TOBAGO Central Statistics Office ANGUILLA Caribbean Tourism Organisation BERMUDA Department of Statistics, Department of Tourism and Bermuda
Tourism Authority
THE BRITISH VIRGIN ISLANDS Caribbean Tourism Organisation
THE CAYMAN ISLANDS Cayman Islands Department of Tourism, Visitor Exit Survey
TURKS AND CAICOS Tourist Board
MONTSERRAT The Statistics Department of Montserrat
70
CHAPTER 2 - TOURISM
1.2.4 (a): Sources of Data for Table 2.4: Tourist Arrivals by Type of Accommodation
Country Data Source THE BAHAMAS The Ministry of Tourism
DOMINICA Environment Statistics 2014 report
MONTSERRAT Statistics Department
SAINT LUCIA Saint Lucia Tourist Board
SURINAME Traffic and Transport statistics and the Environment publication 2014
BERMUDA Department of Statistics, Department of Tourism and Bermuda Tourism Authority
THE CAYMAN ISLANDS Cayman Islands Immigration Department and Cayman Islands Depart-ment of Tourism
JAMAICA Jamaica Tourist Board
ST VINCENT AND THE GRENADINES 2012 Compendium of Environmental Statistics
1.2.4(b): Notes for Table 2.4: Tourist Arrivals by Type of Accommodation
Country Notes
THE CAYMAN ISLANDS Hotels include guest houses Other includes timeshare
SURINAME Apartment include guest houses
JAMAICA Data includes visitors and non-resident Jamaicans. Apartments/Villas include guest houses Data for Apartments/Villas and Guest Houses are for "Non-hotels".
71
CHAPTER 2 - TOURISM
1.2.5(a): Sources of Data for Table 2.5: Tourist Arrivals by Country of Origin: 2009-2013
Country Data Source
ANTIGUA AND BARBUDA Ministry of Tourism
THE BAHAMAS Department of Immigration and Bahamas Ministry of Tourism
Research and Statistics Department . BARBADOS Caribbean Tourism Organisation BELIZE Caribbean Tourism Organisation DOMINICA Caribbean Tourism Organisation
GRENADA Annual Compendium of Statistics, Grenada Board of Tourism
GUYANA Caribbean Tourism Organisation
JAMAICA Caribbean Tourism Organisation
MONTSERRAT Statistics Department
ST KITTS AND NEVIS Caribbean Tourism Organisation SAINT LUCIA Saint Lucia Tourist Board and Central Statistics Office ST VINCENT AND THE GRENADINES Caribbean Tourism Organisation
SURINAME Traffic and Transport statistics and the Environment publication
2014 TRINIDAD AND TOBAGO Central Statistical Office / Caribbean Tourism Organisation ANGUILLA Caribbean Tourism Organisation BERMUDA Department of Statistics, Department of Tourism and Bermuda
Tourism Authority
THE CAYMAN ISLANDS Department of Tourism, Cayman Islands Government
TURKS AND CAICOS Tourist Board
THE BRITISH VIRGIN ISLANDS Caribbean Tourism Organisation