

30
CHAPTER 2 - TOURISM
The indicators under this theme measure the amount of
forest area kept and governed by the respective regulatory
authorities. An important section of the forested areas are
those areas that are protected. The categories under this
area include Strict Nature Reserve; Wilderness Area; Na-
tional Park; National Monument; Habitat/Species Man-
agement Area; Protected Landscape/Seascape and the
Managed Resource Protected Area.
The data provides information on the main characteristics
of the various types of forest as a percentage of total for-
est area and the amount of forest area as a percentage of
total land. There are four (4) indicators covered in this
section:
1. Forest Area;
2. Protected Forest Area
3. Protected forest area as % of total forest area
4. Proportion of land area covered by forest
(MDG; CSMDG)
These indicators are used to measure the possible impact
that changes in the extent of forest cover would have on
the conservation of biological diversity and eco-tourism,
and on weather patterns. In addition, forest serve
as a main barrier against high winds due to hur-
ricanes and tropical storms. They hold the earth
together preventing landslides and erosion The effects on
the environment are also far-reaching as it relates to land
use, energy and water consumption, and waste disposal.
The data can be sourced from Forestry Commission
Tourism contributes significantly to economies of the
Caribbean region through direct earnings from the
sector as well as indirectly through infrastructure
development and the development of the hotel industry
and craft industry among others. Tourism activities,
however, can have adverse environmental effects as it
exerts significant pressure on scarce resources such as
land, water and energy. It also generates a large amount
of waste.
The situation with the use of water is improving as
Tourism facilities have over the years implemented
programmes to reduce their water use and initiatives
such as Blue flag that encourage sustainable tourism.
Regional groups such as the Caribbean Tourism
Organisation have encouraged sustainable tourism
projects to reduce the impact of tourism on the local
environment.
The data provided under this theme seek to measure
and quantify the environmental and social implications
such as accommodation, transportation, employment
and catering as well as the country’s capacity to cater
to and meet these demands. There are six (6) Indicators
covered in this section: Tourist Arrivals by Type of
Arrival and Number of Tourist Nights Spent; Tourist
Intensity, Tourism Density and Tourist Penetration
Ratio; Number of Hotels Classified by Number of
Rooms, Beds and Rooms occupied by Year; Visitor
Expenditure and Number Employed in Tourism;
Tourist Arrivals by Type of Accommodation; and
Tourist Arrivals by Country of Origin.
The data were compiled from National Statistical
Offices of the Member States and National Tourism
Agencies. It should be noted that the Caribbean
Tourism Organisation (CTO) provided a significant
amount of data which allowed most of the data gaps in
this area to be filled.
31
CHAPTER 2 - TOURISM
Stop over (Tourists)
Cruise passengers
Other
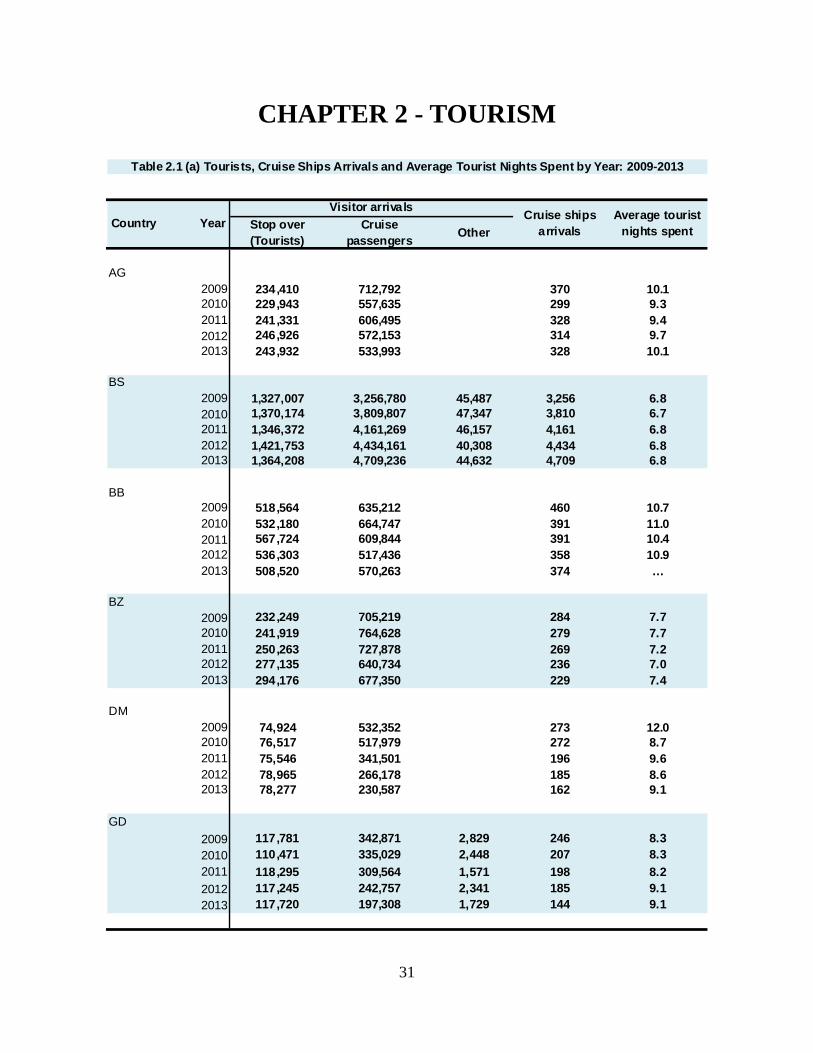
AG2009 234,410 712,792 370 10.12010 229,943 557,635 299 9.32011 241,331 606,495 328 9.42012 246,926 572,153 314 9.72013 243,932 533,993 328 10.1
BS2009 1,327,007 3,256,780 45,487 3,256 6.82010 1,370,174 3,809,807 47,347 3,810 6.72011 1,346,372 4,161,269 46,157 4,161 6.82012 1,421,753 4,434,161 40,308 4,434 6.82013 1,364,208 4,709,236 44,632 4,709 6.8
BB2009 518,564 635,212 460 10.72010 532,180 664,747 391 11.02011 567,724 609,844 391 10.42012 536,303 517,436 358 10.92013 508,520 570,263 374 …
BZ2009 232,249 705,219 284 7.72010 241,919 764,628 279 7.72011 250,263 727,878 269 7.22012 277,135 640,734 236 7.02013 294,176 677,350 229 7.4
DM2009 74,924 532,352 273 12.02010 76,517 517,979 272 8.72011 75,546 341,501 196 9.62012 78,965 266,178 185 8.62013 78,277 230,587 162 9.1
GD
2009 117,781 342,871 2,829 246 8.3
2010 110,471 335,029 2,448 207 8.3
2011 118,295 309,564 1,571 198 8.2
2012 117,245 242,757 2,341 185 9.1
2013 117,720 197,308 1,729 144 9.1
Average tourist nights spent
Cruise ships arrivals
Table 2.1 (a) Tourists, Cruise Ships Arrivals and Average Tourist Nights Spent by Year: 2009-2013
Country YearVisitor arrivals

32
CHAPTER 2 - TOURISM
Stop over (Tourists)
Cruise passengers
Other
GY2009 141 ,281 n.a n.a n.a
2010 151 ,926 n.a n.a n.a
2011 156 ,910 n.a n.a n.a
2012 176 ,642 n.a n.a n.a
2013 193 ,425 n.a n.a n.a
HT2009 387 ,220 439 n.a n.a
2010 254 ,732 538 n.a n.a
2011 348 ,755 597 n.a n.a
2012 349 ,237 610 139 n.a
2013 419 ,736 644 n.a n.a
JM
2009 1,831,097 923,234 329 9.2
2010 1,921,678 909,899 322 9.0
2011 1,951,752 1,126,646 364 8.9
2012 1,986,085 1,320,547 384 8.8
2013 2,008,409 1,265,693 364 8.7
2014 2,080,181 1,423,797 405 8.7
MS2009 6,311 189 1,024 1 15.9
2010 5,981 878 1,726 1 15.0
2011 5,395 1,114 1,997 3 12.9
2012 7,310 840 2,606 2 13.7
2013 7,201 364 1,520 2 n.a
2014 8,804 184 1,749 2
KN2009 96,077 450,553 235
2010 98,329 514,825 286
2011 94,843 605,407 337
2012 97,857 526,305 299
2013 100 ,997 575,716 301
LC2009 278 ,491 699,306 4,967 397 8.9
2010 305 ,937 670,043 7,613 380 8.6
2011 312 ,404 630,444 10,523 351 8.8
2012 306 ,801 571,894 9,054 336 8.72013 318 ,626 594,118 8,228 344 8.9
Average tourist nights spent
Cruise ships arrivals
Table 2.1 (a) cont'd Tourists, Cruise Ships Arrivals and Average Tourist Nights Spent by Year: 2009-2013
Country YearVisitor arriva ls
33
CHAPTER 2 - TOURISM
Stop over (Tourists)
Cruise passengers
Other
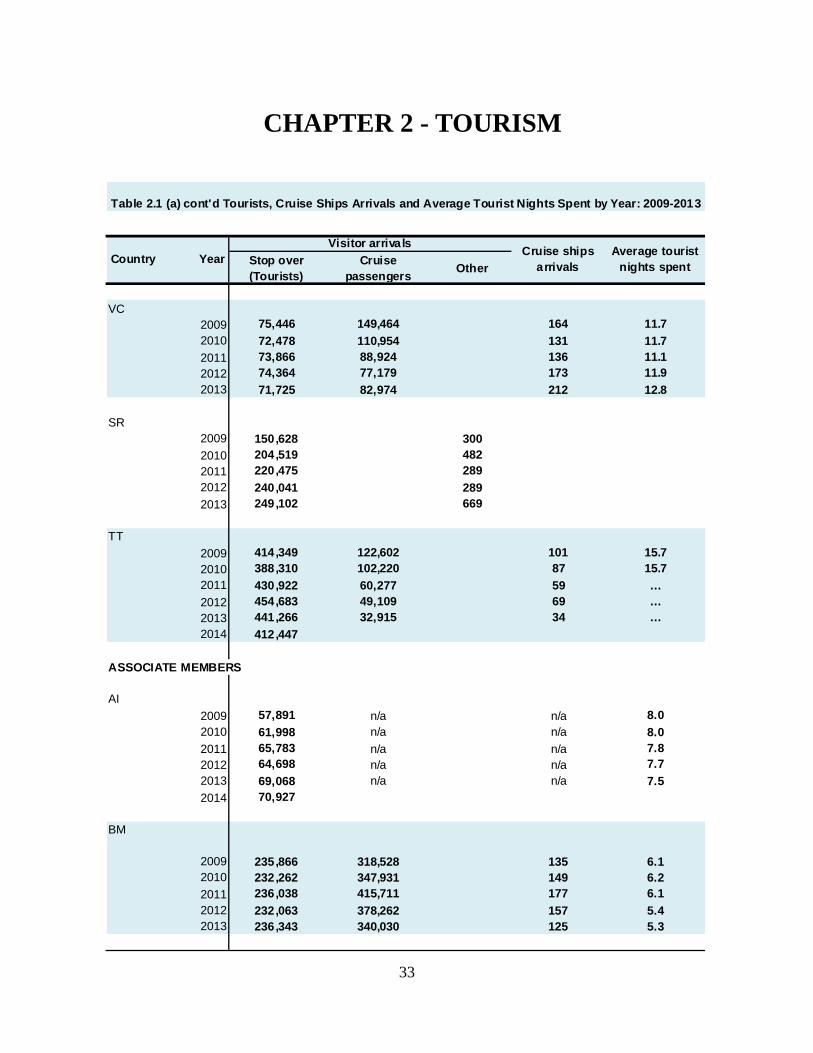
VC2009 75,446 149,464 164 11.7
2010 72,478 110,954 131 11.7
2011 73,866 88,924 136 11.1
2012 74,364 77,179 173 11.9
2013 71,725 82,974 212 12.8
SR2009 150,628 300
2010 204,519 482
2011 220,475 289
2012 240,041 289
2013 249,102 669
TT
2009 414,349 122,602 101 15.7
2010 388,310 102,220 87 15.7
2011 430,922 60,277 59 …
2012 454,683 49,109 69 …
2013 441,266 32,915 34 …
2014 412,447
ASSOCIATE MEMBERS
AI
2009 57,891 n/a n/a 8.0
2010 61,998 n/a n/a 8.0
2011 65,783 n/a n/a 7.8
2012 64,698 n/a n/a 7.7
2013 69,068 n/a n/a 7.5
2014 70,927
BM
2009 235,866 318,528 135 6.12010 232,262 347,931 149 6.2
2011 236,038 415,711 177 6.1
2012 232,063 378,262 157 5.42013 236,343 340,030 125 5.3
Average tourist nights spent
Cruise ships arrivals
Table 2.1 (a) cont'd Tourists, Cruise Ships Arrivals and Average Tourist Nights Spent by Year: 2009-2013
Country YearVisitor arrivals

34
CHAPTER 2 - TOURISM
A Visitor is a traveler taking a trip to a
main destination outside his/her usual
environment, for less than a year, for any
main purpose (business, leisure or other
personal purpose) other than to be
employed by a resident entity in the
country or place visited. These trips taken
by visitors qualify as tourism trips.
Tourism refers to the activity of visitors.
Tourist (or overnight visitor): A visitor
(domestic, inbound or outbound) is
classified as a tourist (or overnight
visitor), if his/her trip includes an
overnight stay, or as a same-day visitor
(or excursionist) otherwise.
Cruise passengers are regarded as a
special type of same-day visitor (even if
the ship overnights at the port) who stay
less than twenty-four hours in the country
visited.
Cruise ship arrivals refer to the number
of times cruise ships enter the country. A
cruise ship can be counted multiple times
if it leaves the country, then returns with
new passengers within the same month.
The average length of stay for a number
of holiday trips is calculated by dividing
the total number of nights spent by the
total number of tourism trips. Tourism
trips are trips taken by visitors (see
definition of visitors). A domestic or an
outbound tourism trip refers to the travel
of a visitor from the time of leaving his/
her usual residence until he/she returns.
An inbound tourism trip refers to the
travel of a visitor from the time of arriving
in a country to the time of leaving. The
term tourism visit refers to a stay in a
place visited during a tourism trip.
Observing tourism trips and visits is not
the same a observing visitors, as an
individual might make more than one trip
or visit during the period of observing
visitors, as an individual might make more
than one trip or visit during the period of
observation.
(International Recommendations for
Tourism Statistics 2008 https://
unstats.un.org/unsd/publication/Seriesm/
SeriesM_83rev1e.pdf)
Stop over (Tourists)
Cruise passengers
Other
KY2009 271,958 1,520,372 542 6.92010 288,272 1,597,838 577 6.12011 309,092 1,401,495 529 4.82012 321,650 1,507,370 525 n.a2013 345,385 1,375,872 481 n.a
TC2009 250,215 513,928 2152010 281,159 617,863 2452011 354,223 657,497 2702012 298,936 676,647 2612013 290,587 778,920 258
VG2009 308,793 530,327 5392010 330,343 501,451 3722011 337,773 484,715 3872012 351,404 390,579 3972013 366,108 367,362 384
Average tourist nights spent
Cruise ships arrivals
Table 2.1 (a) cont'd Tourists, Cruise Ships Arrivals and Average Tourist Nights Spent by Year: 2009-2013
Country YearVisitor arrivals
35
CHAPTER 2 - TOURISM
0
1,000
2,000
3,000
4,000
5,000
6,000
7,000
8,000
9,000
2009 2010 2011 2012 2013
Num
ber
of T
ouri
sts
(Tho
usan
ds)
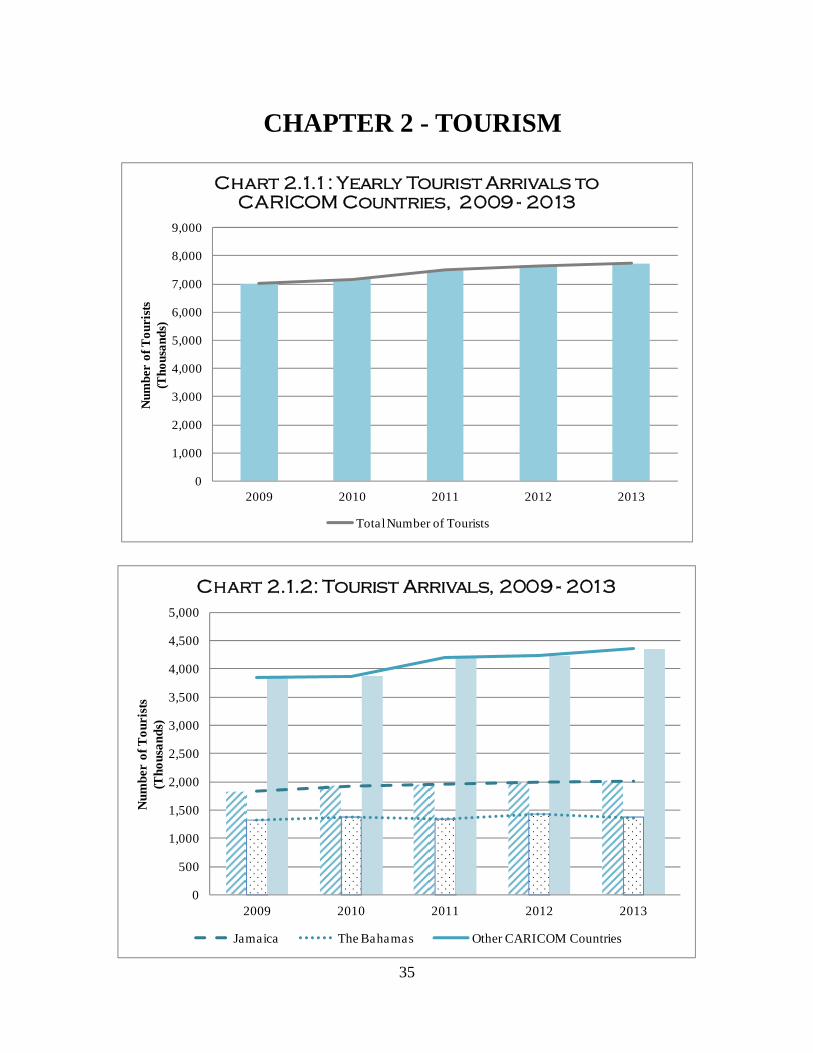
Chart 2.1.1: Yearly Tourist Arrivals to CARICOM Countries, 2009 - 2013
Total Number of Tourists
0
500
1,000
1,500
2,000
2,500
3,000
3,500
4,000
4,500
5,000
2009 2010 2011 2012 2013
Num
ber
of T
ouri
sts
(Tho
usan
ds)
Chart 2.1.2: Tourist Arrivals, 2009 - 2013
Jamaica The Bahamas Other CARICOM Countries
36
CHAPTER 2 - TOURISM
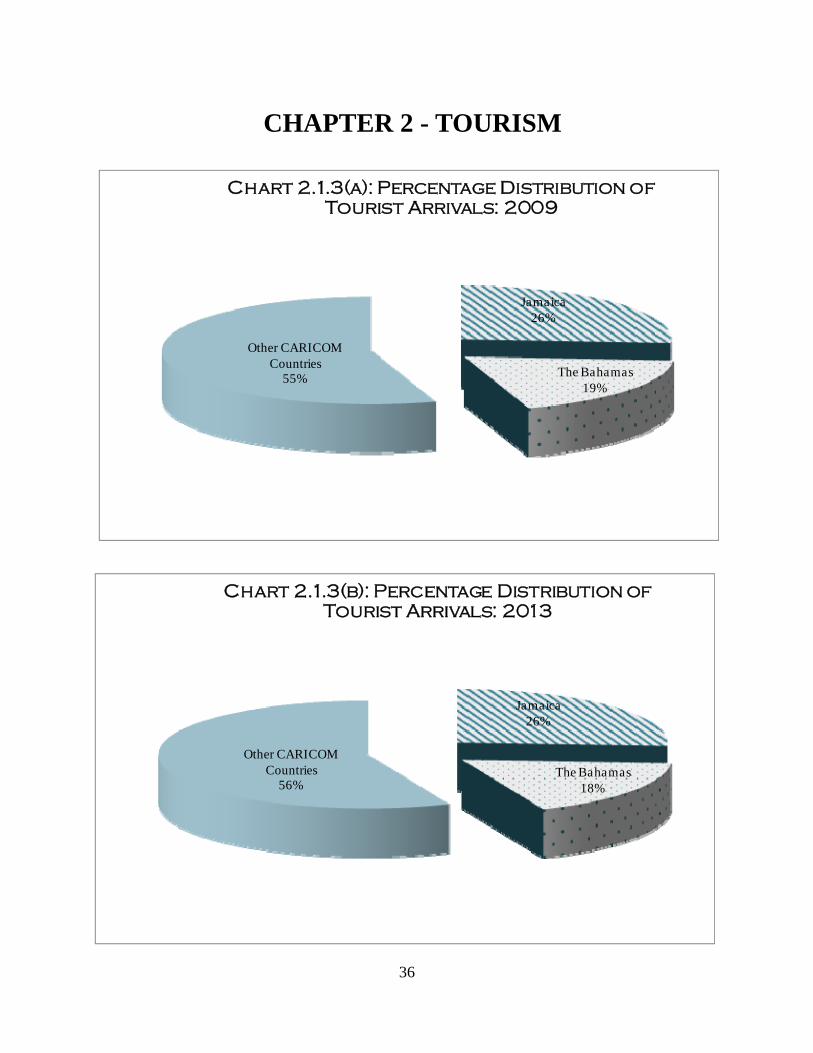
Jamaica26%
The Bahamas19%
Other CARICOM Countries
55%
Chart 2.1.3(a): Percentage Distribution of Tourist Arrivals: 2009
Jamaica26%
The Bahamas18%
Other CARICOM Countries
56%
Chart 2.1.3(b): Percentage Distribution of Tourist Arrivals: 2013
37
CHAPTER 2 - TOURISM
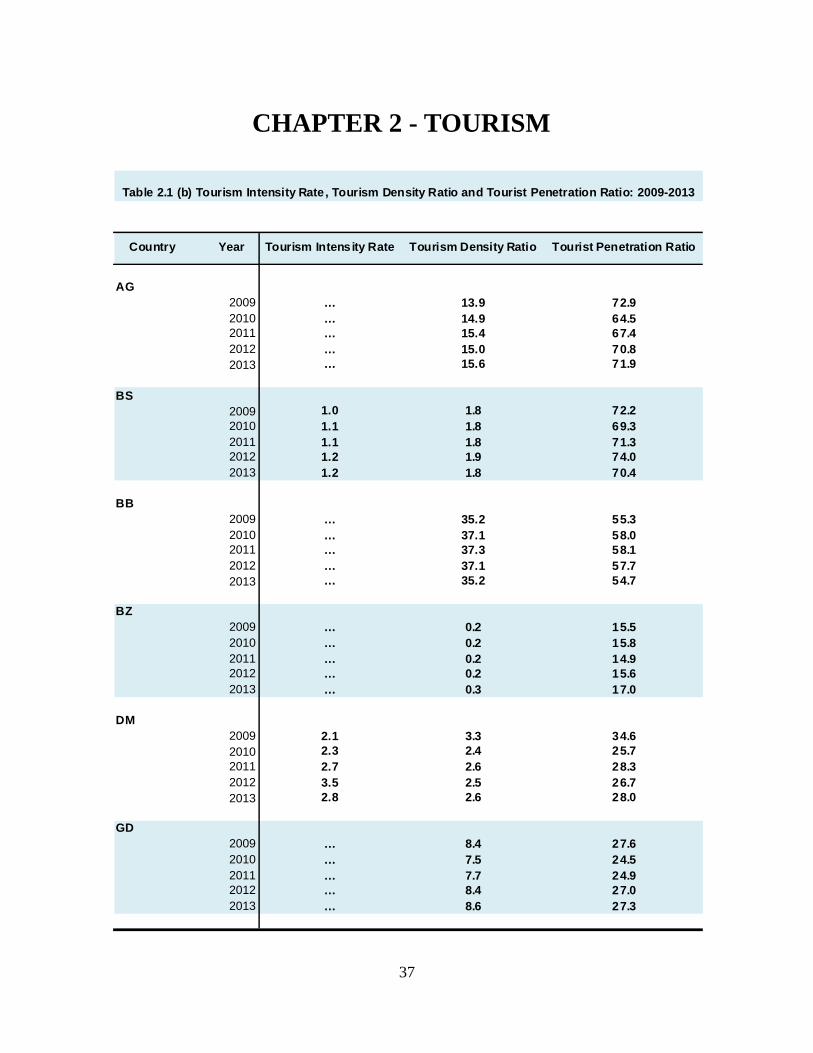
AG2009 … 13.9 72.92010 … 14.9 64.52011 … 15.4 67.42012 … 15.0 70.82013 … 15.6 71.9
BS2009 1.0 1.8 72.22010 1.1 1.8 69.32011 1.1 1.8 71.32012 1.2 1.9 74.02013 1.2 1.8 70.4
BB2009 … 35.2 55.32010 … 37.1 58.02011 … 37.3 58.12012 … 37.1 57.72013 … 35.2 54.7
BZ2009 … 0.2 15.52010 … 0.2 15.82011 … 0.2 14.92012 … 0.2 15.62013 … 0.3 17.0
DM2009 2.1 3.3 34.62010 2.3 2.4 25.72011 2.7 2.6 28.32012 3.5 2.5 26.72013 2.8 2.6 28.0
GD2009 … 8.4 27.62010 … 7.5 24.52011 … 7.7 24.92012 … 8.4 27.02013 … 8.6 27.3
Table 2.1 (b) Tourism Intensity Rate, Tourism Density Ratio and Tourist Penetration Ratio: 2009-2013
Tourism Intensity Rate Tourist Penetration RatioCountry Year Tourism Density Ratio
38
CHAPTER 2 - TOURISM
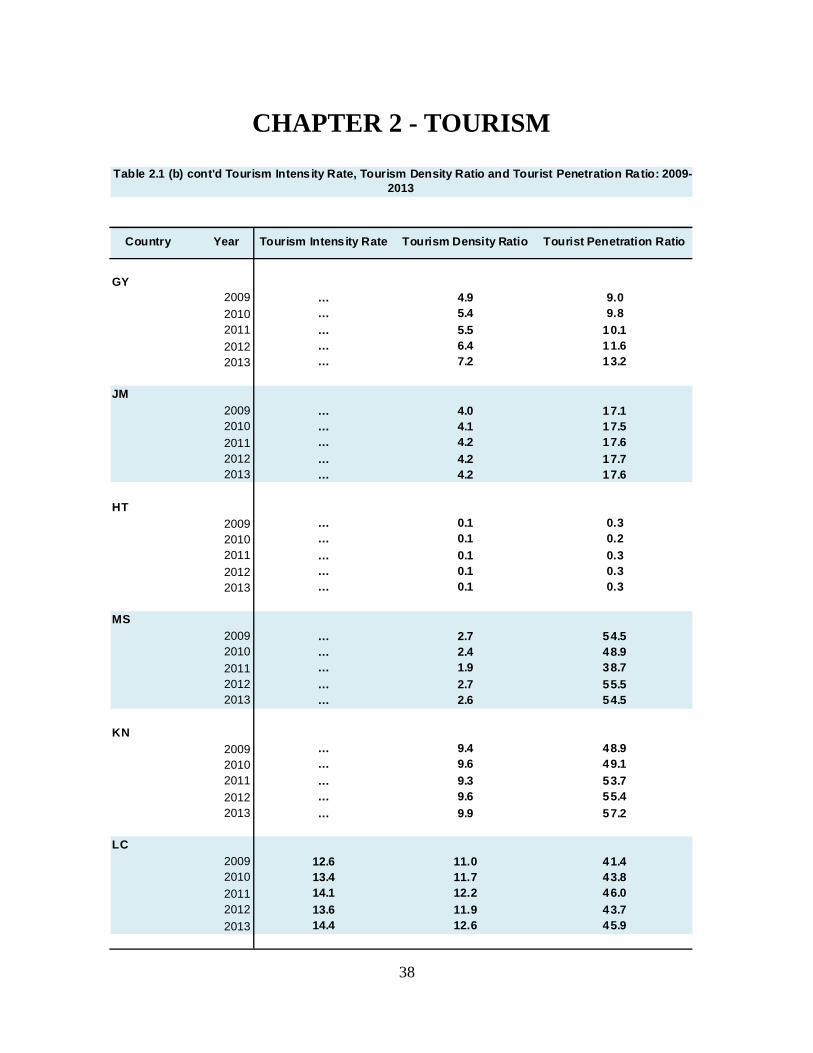
GY2009 … 4.9 9.0
2010 … 5.4 9.8
2011 … 5.5 10.1
2012 … 6.4 11.6
2013 … 7.2 13.2
JM
2009 … 4.0 17.12010 … 4.1 17.5
2011 … 4.2 17.6
2012 … 4.2 17.72013 … 4.2 17.6
HT
2009 … 0.1 0.3
2010 … 0.1 0.2
2011 … 0.1 0.3
2012 … 0.1 0.3
2013 … 0.1 0.3
MS
2009 … 2.7 54.52010 … 2.4 48.9
2011 … 1.9 38.7
2012 … 2.7 55.52013 … 2.6 54.5
KN
2009 … 9.4 48.9
2010 … 9.6 49.1
2011 … 9.3 53.7
2012 … 9.6 55.4
2013 … 9.9 57.2
LC
2009 12.6 11.0 41.42010 13.4 11.7 43.8
2011 14.1 12.2 46.0
2012 13.6 11.9 43.7
2013 14.4 12.6 45.9
Table 2.1 (b) cont'd Tourism Intensity Rate, Tourism Density Ratio and Tourist Penetration Ratio: 2009-2013
Tourism Intensity Rate Tourist Penetration RatioCountry Year Tourism Density Ratio

39
CHAPTER 2 - TOURISM
VC2009 … 6.2 22.0
2010 … 6.0 21.1
2011 … 5.8 20.4
2012 … 6.2 22.0
2013 … 6.5 22.8
TT
2009 … 3.6 14.12010 … 3.2 12.6
2011 … 3.6 13.9
2012 … 3.8 14.62013 … 3.6 13.9
ASSOCIATE MEMBERS
AI2009 … 13.9 79.4
2010 … 14.9 82.9
2011 … 15.4 84.1
2012 … 15.0 101.9
2013 … 15.6 104.8
BM2009 72.4 74.2 59.82010 72.7 74.5 61.52011 72.1 73.9 62.02012 63.2 72.5 55.0
2013 63.1 86.7 55.4
VG
2009 … 56.4 301.7
2010 … 62.7 335.52011 … 64.1 342.2
2012 … 66.1 350.4
2013 … 70.8 372.6
Table 2.1 (b) cont'd Tourism Intensity Rate, Tourism Density Ratio and Tourist Penetration Ratio: 2009-2013
Tourism Intensity Rate Tourist Penetration RatioCountry Year Tourism Density Ratio

40
CHAPTER 2 - TOURISM
Tourism Intensity Rate (TIR): The indicator “arrivals/population” provides an estimate of tourism intensity in the country of reference. This indicator is calculated by World Tourism Organization (UNWTO) based on the available basic data on inbound and domestic tourism, which can be either the number of visitors or the number of tourists. (UNWTO Methodological Notes to the Tourism Statistics Database at http://cf.cdn.unwto.org/sites/all/files/pdf/2015_metho_notes_eng_0.pdf) Tourism Intensity Rate is calculated as the Number of Visitors/tourists divided by per 1,000 population divided by the Country area in square kilometers
Tourism Density Ratio (TDR): This ratio attempts to show the density of tourist in the country at any one time on average. Its value is limited by the fact that tourist flows are season and tourism activity tends to be concentrated in specific geographical areas.(Caribbean Tourism Organization) Tourism Density Ratio is calculated as the Number of Visitors times average stay divided by land area times 365. Tourist Penetration Ratio (TPR): The penetration ratio quantifies the average number of tourists, per thousand local inhabitants, in the country at any one time. The value of this ratio is constrained by the fact that tourist flows are seasonal and cruise passengers are not. (Caribbean Tourism Organization) Tourist Penetration Ratio is calculated as the Average stay times number of visitors divided by 365 times mid year population estimates.
KY2005 … 19.8 93.5
2006 … 18.5 87.7
2007 … 15.6 73.2
2008 … 16.6 76.1
2009 … 17.8 83.2
TC2005 … 11.5 133.22006 … 12.9 157.42007 … 16.3 202.62008 … 13.4 173.62009 … 13.4 165.4
Table 2.1 (b) cont'd Tourism Intensity Rate, Tourism Density Ratio and Tourist Penetration Ratio: 2009-2013
Tourism Intensity Rate Tourist Penetration RatioCountry Year Tourism Density Ratio
41
CHAPTER 2 - TOURISM
Rooms 5 and more and less
than 10
Rooms 10 and more and less
than 25
Rooms 25 and more and less
than 50
Rooms 50 and more
Total
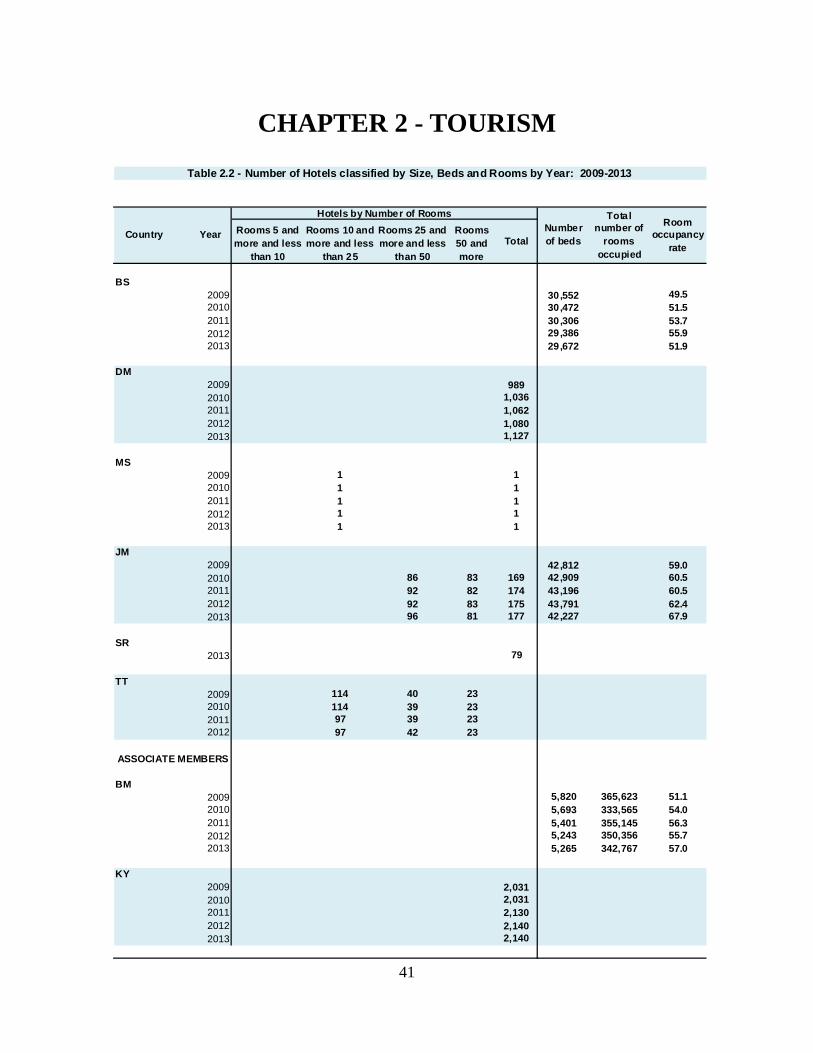
BS2009 30,552 49.52010 30,472 51.52011 30,306 53.72012 29,386 55.92013 29,672 51.9
DM2009 9892010 1,0362011 1,0622012 1,0802013 1,127
MS2009 1 12010 1 12011 1 12012 1 12013 1 1
JM2009 42,812 59.02010 86 83 169 42,909 60.52011 92 82 174 43,196 60.52012 92 83 175 43,791 62.42013 96 81 177 42,227 67.9
SR2013 79
TT2009 114 40 232010 114 39 232011 97 39 232012 97 42 23
ASSOCIATE MEMBERS
BM2009 5,820 365,623 51.12010 5,693 333,565 54.02011 5,401 355,145 56.32012 5,243 350,356 55.72013 5,265 342,767 57.0
KY2009 2,0312010 2,0312011 2,1302012 2,1402013 2,140
Table 2.2 - Number of Hotels classified by Size, Beds and Rooms by Year: 2009-2013
Country YearNumber of beds
Room occupancy
rate
Hotels by Number of Rooms Total number of
rooms occupied

42
CHAPTER 2 - TOURISM
Room Occupancy Rate: For Hotels and similar establishments the net rate of room occupancy is a measure of capacity
utilization. It is calculated by dividing the monthly or yearly sum of occupied rooms by the number of rooms available for
use, then multiplying the quotient by 100 to express as a percentage. (Caribbean Tourism Organisation Statistical Report )
0.0
10.0
20.0
30.0
40.0
50.0
60.0
70.0
The Bahamas Jamaica Bermuda
Roo
m O
ccup
ancy
Rat
e
Country
Chart 2.2: Room OccupanCy Rate: 2009-2013
2009 2010 2011 2012 2013
43
CHAPTER 2 - TOURISM
Women Men Total
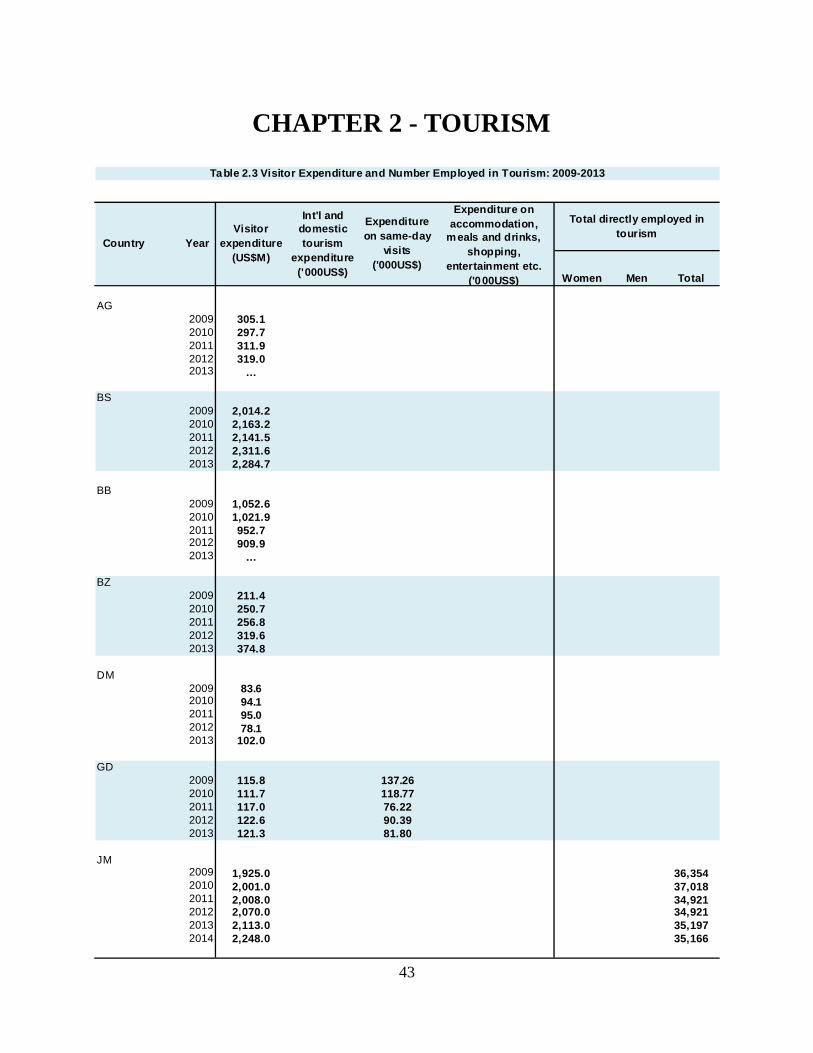
AG2009 305.12010 297.72011 311.92012 319.02013 …
BS2009 2,014.22010 2,163.22011 2,141.52012 2,311.62013 2,284.7
BB2009 1,052.62010 1,021.92011 952.72012 909.92013 …
BZ2009 211.42010 250.72011 256.82012 319.62013 374.8
DM2009 83.62010 94.12011 95.02012 78.12013 102.0
GD2009 115.8 137.262010 111.7 118.772011 117.0 76.222012 122.6 90.392013 121.3 81.80
JM2009 1,925.0 36,3542010 2,001.0 37,0182011 2,008.0 34,9212012 2,070.0 34,9212013 2,113.0 35,1972014 2,248.0 35,166
Table 2.3 Visitor Expenditure and Number Employed in Tourism: 2009-2013
Expenditure on accommodation,
meals and drinks, shopping,
entertainment etc. ('000US$)
Total directly employed in tourism
Country YearVisitor
expenditure (US$M)
Int'l and domestic tourism
expenditure ('000US$)
Expenditure on same-day
visits ('000US$)

44
CHAPTER 2 - TOURISM
Women Men Total
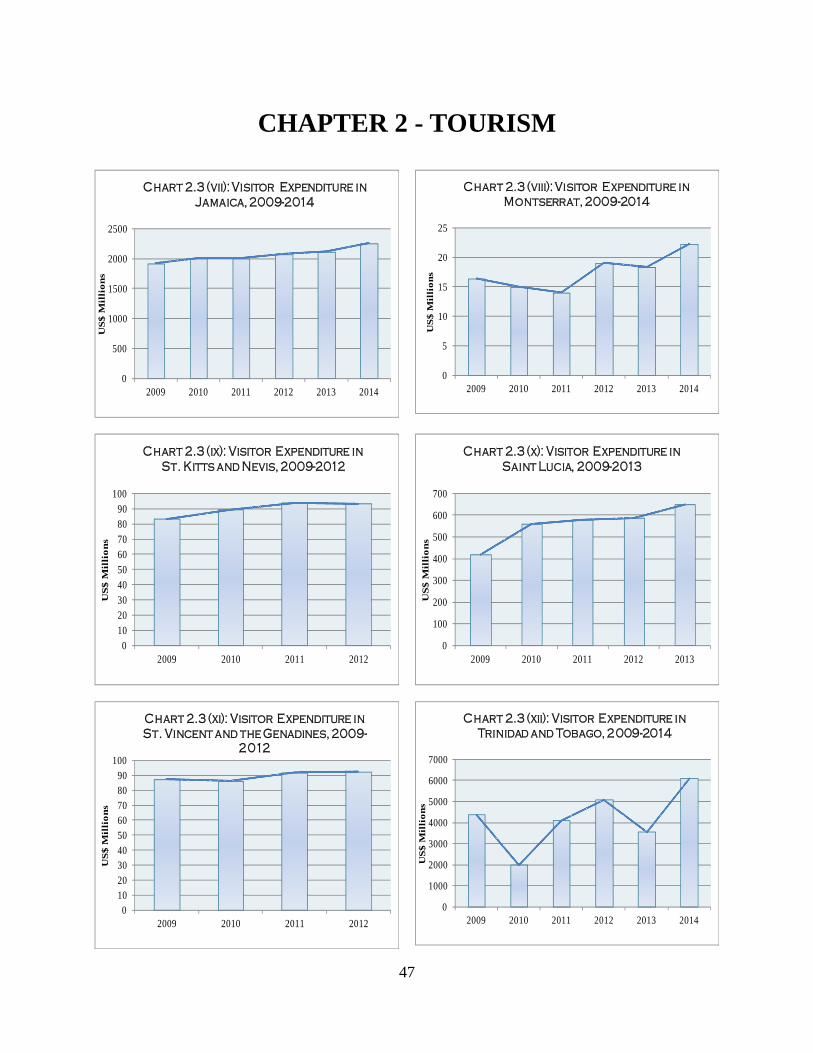
MS2009 16.42010 15.02011 14.02012 19.02013 18.32014 22.2
KN2009 83.52010 89.52011 94.12012 93.72013 …
LC2009 419.82010 562.02011 582.22012 590.12013 650.8
VC2009 87.52010 86.22011 91.72012 94.12013 92.3
SR2009 63.62010 61.02011 60.92012 71.02013 84.0
TT2009 4,400 3,6052010 2,013 1,6832011 4,116 3,5712012 5,103 4,5332013 3,579 3,0112014 6,111 5,363
Table 2 .3 cont'd Visitor Expenditure and Number Employed in Tourism: 2009-2013
Expenditure on accommodation,
meals and drinks, shopping,
entertainment etc. ('000US$)
Total directly employed in tourism
Country YearVisitor
expenditure (US$M)
Int'l and domestic tourism
expenditure ('000US$)
Expenditure on same-day
visits ('000US$)

45
CHAPTER 2 - TOURISM
Concept and Definitions
Tourism Expenditure refers to the amount paid for the acquisition of consumption goods and services, as well as valuables, for own use or to give away, for and during tourism trips. It includes expenditures by visitors themselves, as well as expenses that are paid for or reimbursed by others.
It excludes the acquisition of certain items such as social transfers in kind that benefit visitors, the imputation of accommodation services from owned vacation homes and financial intermediation services indirectly measured.
Expenditures on same-day visits are defined as the expenditures of visitors who spend less than twenty-four hours in the country being visited.
Categories of Tourism Expenditures
Three categories of tourism expenditure based on the country of residence of the transactors involved, can be defined as follows:
Domestic tourism expenditure is the tourism expenditure of a resident visitor within the economy of reference;
Inbound tourism expenditure is the tourism expenditure of a non-resident visitor within the economy of reference;
Outbound tourism expenditure is the tourism expenditure of a resident visitor outside the economy of reference.
(Please refer to the International Recommendations for Tourism Statistics 2008 (IRTS 2008) )
Women Men Total
ASSOCIATE MEMBERS
AI2009 93.82010 99.42011 112.02012 114.02013 123.0
BM2009 321.2 54,800 266,400 1,838 2,836 4,6742010 385.5 62,600 322,900 1,759 2,590 4,3492011 434.9 84,600 348,500 1,872 2,661 4,5332012 392.1 80,100 312,000 1,823 2,562 4,3852013 391.0 72,800 318,200 1,723 2,494 4,217
VG2009 373.82010 389.42011 388.22012 397.82013 420.5
KY2009 547.82010 394.12011 453.82012 605.12013 470.0
Table 2 .3 cont'd Visitor Expenditure and Number Employed in Tourism: 2009-2013
Expenditure on accommodation,
m eals and drinks, shopping,
entertainment etc. ('000US$)
Total directly employed in tourism
Country YearVisitor
expenditure (US$M)
Int'l and domestic tourism
expenditure ('000US$)
Expenditure on same-day
visits ('000US$)

46
CHAPTER 2 - TOURISM
0
50
100
150
200
250
300
350
2009 2010 2011 2012
US
$ M
illi
on
s
Chart 2.3 (i): Visitor Expenditure in Antigua and Barbuda, 2009-2013
0
500
1000
1500
2000
2500
2009 2010 2011 2012 2013
US
$ M
illi
on
s
Chart 2.3 (ii): Visitor Expenditure in The Bahamas, 2009-2013
0
200
400
600
800
1000
1200
2009 2010 2011 2012
US
$ M
illi
on
s
Chart 2.3 (ii): Visitor Expenditure in Barbados, 2009-2012
0
50
100
150
200
250
300
350
400
2009 2010 2011 2012 2013
US
$ M
illi
on
s
Chart 2.3 (iv): Visitor Expenditure in Belize, 2009-2013
0102030405060708090
100
2009 2010 2011 2012
US
$ M
illi
on
s
Chart 2.3 (v): Visitor Expenditure in Dominica, 2009-2012
0
20
40
60
80
100
120
140
2009 2010 2011 2012 2013
US
$ M
illi
on
s
Chart 2.3 (vi): Visitor Expenditure in Grenada, 2009-2013
47
CHAPTER 2 - TOURISM
0
500
1000
1500
2000
2500
2009 2010 2011 2012 2013 2014
US
$ M
illi
on
s
Chart 2.3 (vii): Visitor Expenditure in Jamaica, 2009-2014
0
5
10
15
20
25
2009 2010 2011 2012 2013 2014
US
$ M
illi
on
s
Chart 2.3 (viii): Visitor Expenditure in Montserrat, 2009-2014
0102030405060708090
100
2009 2010 2011 2012
US
$ M
illi
on
s
Chart 2.3 (ix): Visitor Expenditure in St. Kitts and Nevis, 2009-2012
0
100
200
300
400
500
600
700
2009 2010 2011 2012 2013
US
$ M
illi
on
s
Chart 2.3 (x): Visitor Expenditure in Saint Lucia, 2009-2013
0102030405060708090
100
2009 2010 2011 2012
US
$ M
illi
on
s
Chart 2.3 (xi): Visitor Expenditure in St. Vincent and the Genadines, 2009-
2012
0
1000
2000
3000
4000
5000
6000
7000
2009 2010 2011 2012 2013 2014
US
$ M
illi
on
s
Chart 2.3 (xii): Visitor Expenditure in Trinidad and Tobago, 2009-2014

48
CHAPTER 2 - TOURISM
0
20
40
60
80
100
120
140
2009 2010 2011 2012 2013
US
$ M
illi
on
s
Chart 2.3 (xiii): Visitor Expenditure in Anguilla, 2009-2013
050
100150200250300350400450500
2009 2010 2011 2012 2013
US
$ M
illi
on
s
Chart 2.3 (xiv): Visitor Expenditure in Bermuda, 2009-2013
0
50
100
150
200
250
300
350
400
450
2009 2010 2011 2012 2013
US
$ M
illi
on
s
Chart 2.3 (xv): Visitor Expenditure in The British Virgin Islands, 2009-2013
0
100
200
300
400
500
600
700
2009 2010 2011 2012
US
$ M
illi
on
s
Chart 2.3 (xvi): Visitor Expenditure in The Cayman Islands, 2009-2012
49
CHAPTER 2 - TOURISM
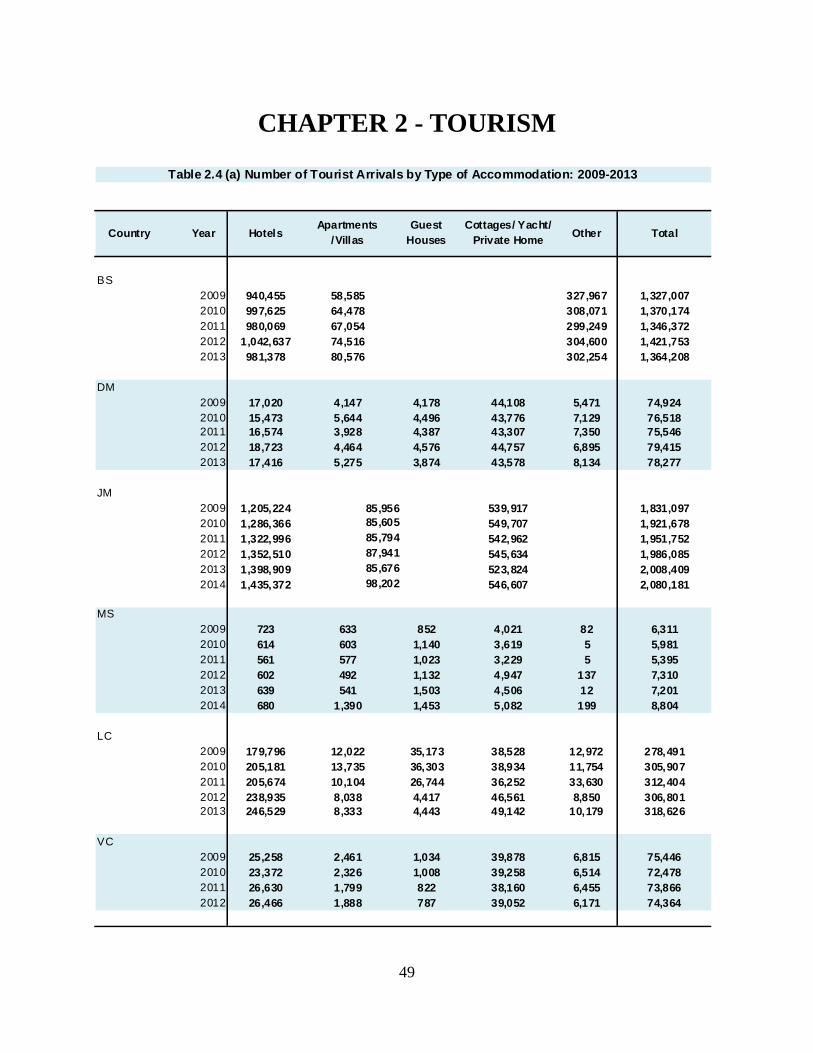
BS2009 940,455 58,585 327,967 1,327,0072010 997,625 64,478 308,071 1,370,1742011 980,069 67,054 299,249 1,346,3722012 1,042,637 74,516 304,600 1,421,7532013 981,378 80,576 302,254 1,364,208
DM2009 17,020 4,147 4,178 44,108 5,471 74,9242010 15,473 5,644 4,496 43,776 7,129 76,5182011 16,574 3,928 4,387 43,307 7,350 75,5462012 18,723 4,464 4,576 44,757 6,895 79,4152013 17,416 5,275 3,874 43,578 8,134 78,277
JM2009 1,205,224 539,917 1,831,0972010 1,286,366 549,707 1,921,6782011 1,322,996 542,962 1,951,7522012 1,352,510 545,634 1,986,0852013 1,398,909 523,824 2,008,4092014 1,435,372 546,607 2,080,181
MS2009 723 633 852 4,021 82 6,3112010 614 603 1,140 3,619 5 5,9812011 561 577 1,023 3,229 5 5,3952012 602 492 1,132 4,947 137 7,3102013 639 541 1,503 4,506 12 7,2012014 680 1,390 1,453 5,082 199 8,804
LC2009 179,796 12,022 35,173 38,528 12,972 278,4912010 205,181 13,735 36,303 38,934 11,754 305,9072011 205,674 10,104 26,744 36,252 33,630 312,4042012 238,935 8,038 4,417 46,561 8,850 306,8012013 246,529 8,333 4,443 49,142 10,179 318,626
VC2009 25,258 2,461 1,034 39,878 6,815 75,4462010 23,372 2,326 1,008 39,258 6,514 72,4782011 26,630 1,799 822 38,160 6,455 73,8662012 26,466 1,888 787 39,052 6,171 74,364
Table 2.4 (a) Number of Tourist Arrivals by Type of Accommodation: 2009-2013
TotalCountry Year HotelsApartments
/VillasGuest
HousesOther
Cottages/ Yacht/ Private Home
85,95685,60585,79487,94185,67698,202

50
CHAPTER 2 - TOURISM
Concept and Definition Tourist accommodation refers to any facility that regularly or occasionally provides overnight accommodation for tourists. There are two basic categories of tourist accommodations: Collective accommodation establishments: e.g. Hotels and similar establishments; and, Private tourist accommodations: e.g. owned dwellings, rented rooms in family homes, accommodation provided by
friends and relatives. (Please refer to the Caribbean Tourism Organisation Statistical Report)
SR2009 49,520 16,205 75,195 9,708 150,6282010 72,674 20,589 95,053 16,203 204,5192011 87,847 16,740 91,717 24,171 220,4752012 96,902 18,960 93,880 30,299 240,0412013 103,545 45,578 80,795 19,184 249,102
ASSOCIATE MEMBERS
BM2009 159,739 1,894 74,233 235,8662010 162,011 2,067 68,184 232,2622011 168,502 1,996 65,540 236,0382012 166,425 1,548 64,090 232,0632013 167,538 1,683 67,122 236,343
KY2009 135,456 65,824 44,880 25,840 272,0002010 143,848 68,609 45,547 30,269 288,2722011 156,405 76,657 48,838 27,201 309,1002012 159,242 88,789 48,255 25,414 321,7002013 160,266 98,094 46,284 40,757 345,400
Table 2.4 (a) cont'd Number of Tourist Arrivals by Type of Accommodation: 2009-2013
TotalCountry Year HotelsApartments
/VillasGuest
HousesOther
Cottages/ Yacht/ Private Home
51
CHAPTER 2 - TOURISM
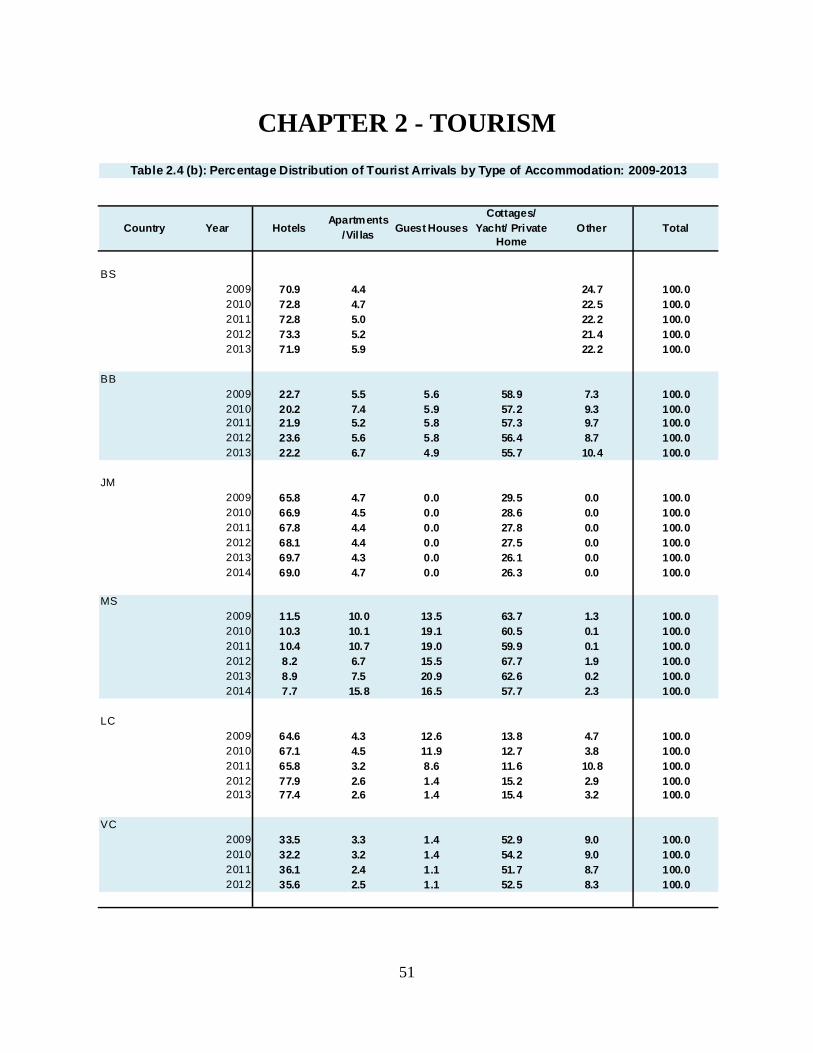
BS2009 70.9 4.4 24.7 100.02010 72.8 4.7 22.5 100.02011 72.8 5.0 22.2 100.02012 73.3 5.2 21.4 100.02013 71.9 5.9 22.2 100.0
BB2009 22.7 5.5 5.6 58.9 7.3 100.02010 20.2 7.4 5.9 57.2 9.3 100.02011 21.9 5.2 5.8 57.3 9.7 100.02012 23.6 5.6 5.8 56.4 8.7 100.02013 22.2 6.7 4.9 55.7 10.4 100.0
JM2009 65.8 4.7 0.0 29.5 0.0 100.02010 66.9 4.5 0.0 28.6 0.0 100.02011 67.8 4.4 0.0 27.8 0.0 100.02012 68.1 4.4 0.0 27.5 0.0 100.02013 69.7 4.3 0.0 26.1 0.0 100.02014 69.0 4.7 0.0 26.3 0.0 100.0
MS2009 11.5 10.0 13.5 63.7 1.3 100.02010 10.3 10.1 19.1 60.5 0.1 100.02011 10.4 10.7 19.0 59.9 0.1 100.02012 8.2 6.7 15.5 67.7 1.9 100.02013 8.9 7.5 20.9 62.6 0.2 100.02014 7.7 15.8 16.5 57.7 2.3 100.0
LC2009 64.6 4.3 12.6 13.8 4.7 100.02010 67.1 4.5 11.9 12.7 3.8 100.02011 65.8 3.2 8.6 11.6 10.8 100.02012 77.9 2.6 1.4 15.2 2.9 100.02013 77.4 2.6 1.4 15.4 3.2 100.0
VC2009 33.5 3.3 1.4 52.9 9.0 100.02010 32.2 3.2 1.4 54.2 9.0 100.02011 36.1 2.4 1.1 51.7 8.7 100.02012 35.6 2.5 1.1 52.5 8.3 100.0
Table 2.4 (b): Percentage Distribution of Tourist Arrivals by Type of Accommodation: 2009-2013
Country Year HotelsApartments
/Vil lasGuest Houses
Cottages/ Yacht/ Private
HomeOther Total
52
CHAPTER 2 - TOURISM
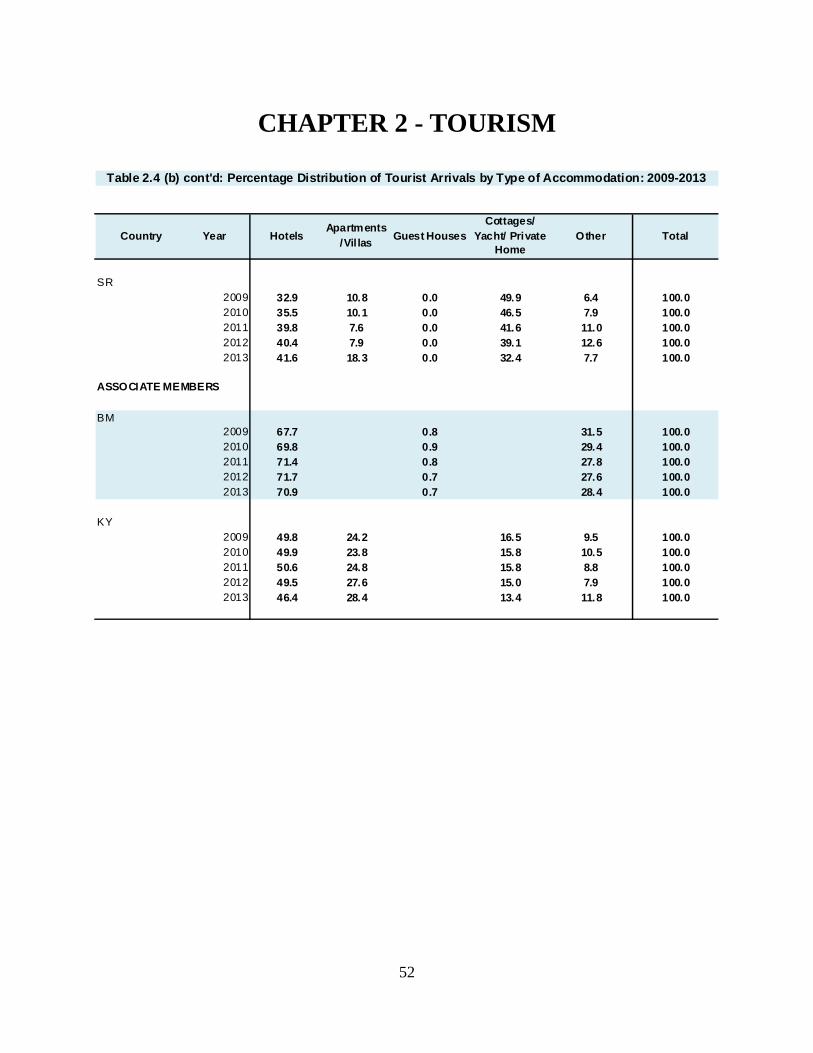
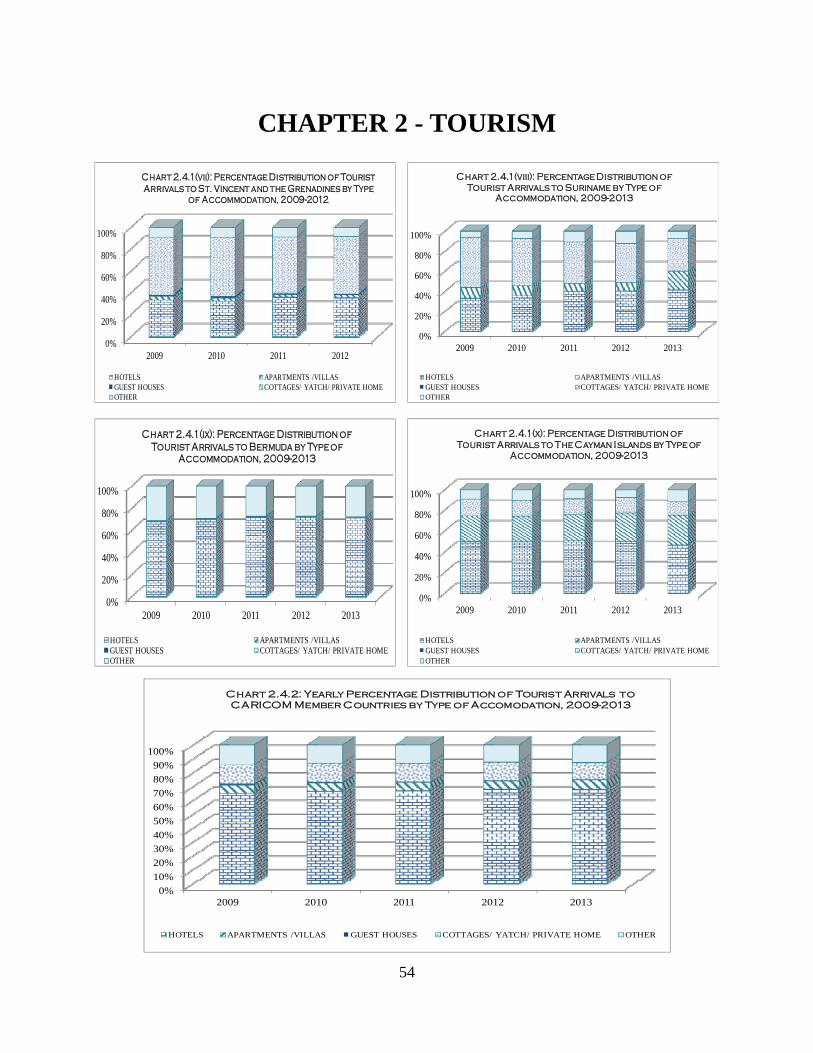
SR2009 32.9 10.8 0.0 49.9 6.4 100.02010 35.5 10.1 0.0 46.5 7.9 100.02011 39.8 7.6 0.0 41.6 11.0 100.02012 40.4 7.9 0.0 39.1 12.6 100.02013 41.6 18.3 0.0 32.4 7.7 100.0
ASSOCIATE MEMBERS
BM2009 67.7 0.8 31.5 100.02010 69.8 0.9 29.4 100.02011 71.4 0.8 27.8 100.02012 71.7 0.7 27.6 100.02013 70.9 0.7 28.4 100.0
KY2009 49.8 24.2 16.5 9.5 100.02010 49.9 23.8 15.8 10.5 100.02011 50.6 24.8 15.8 8.8 100.02012 49.5 27.6 15.0 7.9 100.02013 46.4 28.4 13.4 11.8 100.0
Table 2.4 (b) cont'd: Percentage Distribution of Tourist Arrivals by Type of Accommodation: 2009-2013
Country Year HotelsApartments
/Vil lasGuest Houses
Cottages/ Yacht/ Private
HomeOther Total

53
CHAPTER 2 - TOURISM
0%
20%
40%
60%
80%
100%
2009 2010 2011 2012 2013
Chart 2.4.1(i): Percentage Distribution of Tourist Arrivals to The Bahamas by Type of
Accommodation, 2009-2013
HOTELS APARTMENTS /VILLASGUEST HOUSES COTTAGES/ YATCH/ PRIVATE HOMEOTHER
0%
20%
40%
60%
80%
100%
2009 2010 2011 2012 2013
Chart 2.4.1(ii): Percentage Distribution of Tourist Arrivals to Barbados by Type of
Accommodation, 2009-2013
HOTELS APARTMENTS /VILLASGUEST HOUSES COTTAGES/ YATCH/ PRIVATE HOMEOTHER
0%
20%
40%
60%
80%
100%
2009 2010 2011 2012 2013
Chart 2.4.1(iii): Percentage Distribution of Tourist Arrivals to Dominica by Type of
Accommodation, 2009-2013
HOTELS APARTMENTS /VILLASGUEST HOUSES COTTAGES/ YATCH/ PRIVATE HOMEOTHER
0%
20%
40%
60%
80%
100%
2009 2010 2011 2012 2013
Chart 2.4.1(iv): Percentage Distribution of Tourist Arrivals to Jamaica by Type of
Accommodation, 2009-2013
HOTELS APARTMENTS /VILLASGUEST HOUSES COTTAGES/ YATCH/ PRIVATE HOMEOTHER
0%
20%
40%
60%
80%
100%
2009 2010 2011 2012 2013
Chart 2.4.1(v): Percentage Distribution of Tourist Arrivals to Montserrat by Type of
Accommodation, 2009-2013
HOTELS APARTMENTS /VILLASGUEST HOUSES COTTAGES/ YATCH/ PRIVATE HOMEOTHER
0%
20%
40%
60%
80%
100%
2009 2010 2011 2012 2013
Chart 2.4.1(vi): Percentage Distribution of Tourist Arrivals to Saint Lucia by Type of
Accommodation, 2009-2013
HOTELS APARTMENTS /VILLASGUEST HOUSES COTTAGES/ YATCH/ PRIVATE HOMEOTHER
54
CHAPTER 2 - TOURISM
0%
20%
40%
60%
80%
100%
2009 2010 2011 2012
Chart 2.4.1(vii): Percentage Distribution of Tourist Arrivals to St. Vincent and the Grenadines by Type
of Accommodation, 2009-2012
HOTELS APARTMENTS /VILLASGUEST HOUSES COTTAGES/ YATCH/ PRIVATE HOMEOTHER
0%
20%
40%
60%
80%
100%
2009 2010 2011 2012 2013
Chart 2.4.1(viii): Percentage Distribution of Tourist Arrivals to Suriname by Type of
Accommodation, 2009-2013
HOTELS APARTMENTS /VILLASGUEST HOUSES COTTAGES/ YATCH/ PRIVATE HOMEOTHER
0%
20%
40%
60%
80%
100%
2009 2010 2011 2012 2013
Chart 2.4.1(ix): Percentage Distribution of Tourist Arrivals to Bermuda by Type of
Accommodation, 2009-2013
HOTELS APARTMENTS /VILLASGUEST HOUSES COTTAGES/ YATCH/ PRIVATE HOMEOTHER
0%
20%
40%
60%
80%
100%
2009 2010 2011 2012 2013
Chart 2.4.1(x): Percentage Distribution of Tourist Arrivals to The Cayman Islands by Type of
Accommodation, 2009-2013
HOTELS APARTMENTS /VILLASGUEST HOUSES COTTAGES/ YATCH/ PRIVATE HOMEOTHER
0%
10%
20%
30%
40%
50%
60%
70%
80%
90%
100%
2009 2010 2011 2012 2013
Chart 2.4.2: Yearly Percentage Distribution of Tourist Arrivals to CARICOM Member Countries by Type of Accomodation, 2009-2013
HOTELS APARTMENTS /VILLAS GUEST HOUSES COTTAGES/ YATCH/ PRIVATE HOME OTHER

55
CHAPTER 2 - TOURISM
AG2009 82,068 12,947 93,442 41,546 4,407 234,4102010 81,598 17,818 88,945 37,505 4,077 229,9432011 84,832 22,403 92,097 37,887 4,112 241,3312012 93,214 24,185 89,909 35,249 4,369 246,9262013 88,818 30,442 88,468 31,801 4,403 243,932
BS2009 1,068,726 107,041 78,817 18,856 53,567 1,327,0072010 1,097,184 119,321 78,083 18,518 57,068 1,370,1742011 1,058,682 124,166 78,201 17,979 67,344 1,346,3722012 1,121,597 131,064 78,641 17,228 73,223 1,421,7532013 1,066,072 123,720 80,568 18,603 75,245 1,364,208
BB2009 122,306 63,751 220,704 101,676 10,127 518,5642010 134,969 72,351 212,276 98,586 13,998 532,1802011 142,414 71,953 225,009 112,538 15,810 567,7242012 130,762 72,020 210,638 106,041 16,842 536,3032013 120,583 67,293 209,796 87,294 23,548 508,514
BZ
2009 139,561 17,211 29,603 2,388 43,486 232,2492010 145,872 18,246 30,025 2,505 45,271 241,9192011 156,293 20,093 30,142 2,050 41,685 250,2632012 176,642 24,223 29,362 2,288 44,620 277,1352013 183,513 26,713 32,191 2,179 49,580 294,176
DM2009 18,193 2,618 11,590 40,525 1,998 74,9242010 19,266 2,858 10,725 41,899 1,769 76,5172011 17,820 2,986 11,538 41,210 1,992 75,5462012 19,002 3,063 12,816 41,958 2,126 78,9652013 18,044 3,018 13,552 41,540 2,123 78,277
GD
2009 25,984 7,194 36,090 26,483 18,163 113,9142010 26,067 7,322 35,386 24,201 17,495 110,4712011 28,714 7,490 36,235 27,284 18,572 118,2952012 32,068 8,123 33,103 25,707 18,244 117,2452013 36,321 9,920 27,729 25,253 18,497 117,720
Total
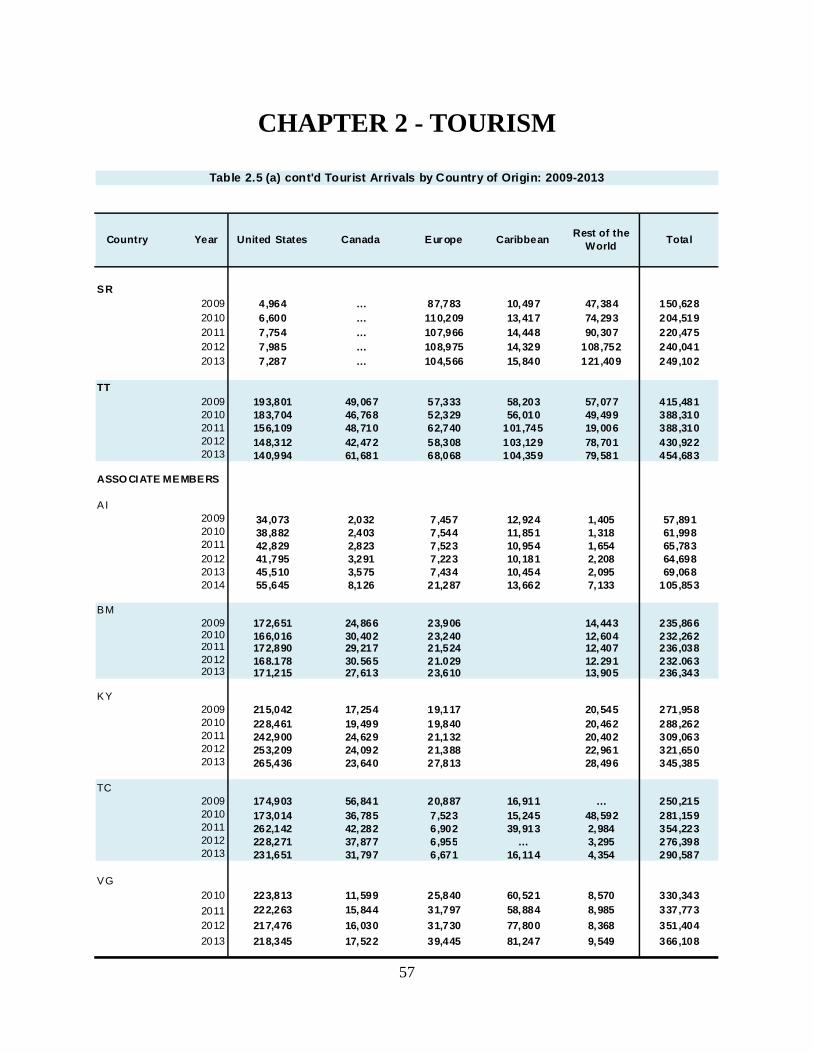
Table 2.5 (a) Tourist Arrivals by Country of Origin: 2009-2013
Country Year United States Canada EuropeRest of the
WorldCaribbean

56
CHAPTER 2 - TOURISM
GY
2009 76,955 23,812 8,277 28,026 4,211 141,281
2010 82,966 25,381 8,357 29,487 5,735 151,926
2011 83,298 23,968 8,287 36,649 4,708 156,910
2012 98,625 25,977 8,877 36,621 6,542 176,642
2013 83,973 26,033 10,054 51,942 28,058 200,060
JM
2009 1,172,844 290,307 276,799 65,333 25,814 1,831,097
2010 1,242,943 325,191 271,315 58,299 23,930 1,921,678
2011 1,225,565 378,938 253,045 66,216 27,988 1,951,752
2012 1,257,669 403,200 222,428 64,984 37,804 1,986,085
2013 1,271,262 399,331 235,811 58,249 43,756 2,008,409
MS
2009 1,606 367 2,031 2,267 40 6,311
2010 1,665 404 1,573 2,259 80 5,981
2011 1,526 320 1,535 1,881 133 5,395
2012 1,950 505 2,342 2,390 123 7,310
2013 1,775 516 2,220 2,591 99 7,201
2014 2,041 678 2,433 3,528 124 8,804
KN2009 56,373 6,931 8,303 22,769 1,701 96,077
2010 58,710 5,720 9,201 19,923 4,775 98,329
2011 59,997 5,624 8,853 17,401 2,968 94,843
2012 63,074 6,756 9,081 16,195 2,751 97,857
2013 65,557 6,722 9,767 16,027 2,924 100,997
LC
2009 98,685 28,563 86,819 60,132 4,241 278,440
2010 129,085 32,154 85,695 53,998 5,005 305,937
2011 122,356 35,393 91,759 58,876 4,020 312,404
2012 115,065 37,709 93,400 56,067 4,560 306,801
2013 128,331 35,985 88,492 60,521 5,297 318,626
VC2009 20,159 6,820 19,097 26,835 2,535 75,446
2010 21,551 7,208 17,665 23,968 2,086 72,478
2011 21,164 6,719 20,549 23,272 2,162 73,866
2012 21,454 7,424 20,410 22,768 2,308 74,364
2013 20,106 7,146 20,401 21,745 2,327 71,725
Total
Table 2.5 (a) cont'd Tourist Arrivals by Country of Origin: 2009-2013
Country Year United States Canada EuropeRest of the
WorldCaribbean
57
CHAPTER 2 - TOURISM
SR2009 4,964 … 87,783 10,497 47,384 150,6282010 6,600 … 110,209 13,417 74,293 204,5192011 7,754 … 107,966 14,448 90,307 220,4752012 7,985 … 108,975 14,329 108,752 240,0412013 7,287 … 104,566 15,840 121,409 249,102
TT2009 193,801 49,067 57,333 58,203 57,077 415,4812010 183,704 46,768 52,329 56,010 49,499 388,3102011 156,109 48,710 62,740 101,745 19,006 388,3102012 148,312 42,472 58,308 103,129 78,701 430,9222013 140,994 61,681 68,068 104,359 79,581 454,683
ASSO CIATE MEMBERS
AI2009 34,073 2,032 7,457 12,924 1,405 57,8912010 38,882 2,403 7,544 11,851 1,318 61,9982011 42,829 2,823 7,523 10,954 1,654 65,7832012 41,795 3,291 7,223 10,181 2,208 64,6982013 45,510 3,575 7,434 10,454 2,095 69,0682014 55,645 8,126 21,287 13,662 7,133 105,853
BM2009 172,651 24,866 23,906 14,443 235,8662010 166,016 30,402 23,240 12,604 232,2622011 172,890 29,217 21,524 12,407 236,0382012 168,178 30,565 21,029 12,291 232,0632013 171,215 27,613 23,610 13,905 236,343
KY2009 215,042 17,254 19,117 20,545 271,9582010 228,461 19,499 19,840 20,462 288,2622011 242,900 24,629 21,132 20,402 309,0632012 253,209 24,092 21,388 22,961 321,6502013 265,436 23,640 27,813 28,496 345,385
TC2009 174,903 56,841 20,887 16,911 … 250,2152010 173,014 36,785 7,523 15,245 48,592 281,1592011 262,142 42,282 6,902 39,913 2,984 354,2232012 228,271 37,877 6,955 … 3,295 276,3982013 231,651 31,797 6,671 16,114 4,354 290,587
VG2010 223,813 11,599 25,840 60,521 8,570 330,343
2011 222,263 15,844 31,797 58,884 8,985 337,773
2012 217,476 16,030 31,730 77,800 8,368 351,404
2013 218,345 17,522 39,445 81,247 9,549 366,108
Total
Table 2.5 (a) cont'd Tourist Arrivals by Country of Origin: 2009-2013
Country Year United States Canada EuropeRest of the
WorldCaribbean

58
CHAPTER 2 - TOURISM
AG
2009 35.0 5.5 39.9 17.7 1.9 100.0
2010 35.5 7.7 38.7 16.3 1.8 100.0
2011 35.2 9.3 38.2 15.7 1.7 100.0
2012 37.7 9.8 36.4 14.3 1.8 100.0
2013 36.4 12.5 36.3 13.0 1.8 100.0
BS2009 80.5 8.1 5.9 1.4 4.0 100.0
2010 80.1 8.7 5.7 1.4 4.2 100.0
2011 78.6 9.2 5.8 1.3 5.0 100.0
2012 78.9 9.2 5.5 1.2 5.2 100.0
2013 78.1 9.1 5.9 1.4 5.5 100.0
BB
2009 23.6 12.3 42.6 19.6 2.0 100.0
2010 25.4 13.6 39.9 18.5 2.6 100.0
2011 25.1 12.7 39.6 19.8 2.8 100.0
2012 24.4 13.4 39.3 19.8 3.1 100.0
2013 23.7 13.2 41.3 17.2 4.6 100.0
BZ
2009 60.1 7.4 12.7 1.0 18.7 100.0
2010 60.3 7.5 12.4 1.0 18.7 100.0
2011 62.5 8.0 12.0 0.8 16.7 100.0
2012 63.7 8.7 10.6 0.8 16.1 100.0
2013 62.4 9.1 10.9 0.7 16.9 100.0
DM
2009 24.3 3.5 15.5 54.1 2.7 100.0
2010 25.2 3.7 14.0 54.8 2.3 100.0
2011 23.6 4.0 15.3 54.5 2.6 100.0
2012 24.1 3.9 16.2 53.1 2.7 100.0
2013 23.1 3.9 17.3 53.1 2.7 100.0
GD
2009 22.8 6.3 31.7 23.2 15.9 100.0
2010 23.6 6.6 32.0 21.9 15.8 100.0
2011 24.3 6.3 30.6 23.1 15.7 100.0
2012 27.4 6.9 28.2 21.9 15.6 100.0
2013 30.9 8.4 23.6 21.5 15.7 100.0
Table 2.5 (b) Percentage Distribution of Tourist Arrivals by Country of Origin: 2009-2013
Country Year United States Canada Europe CaribbeanRest of the
WorldTotal
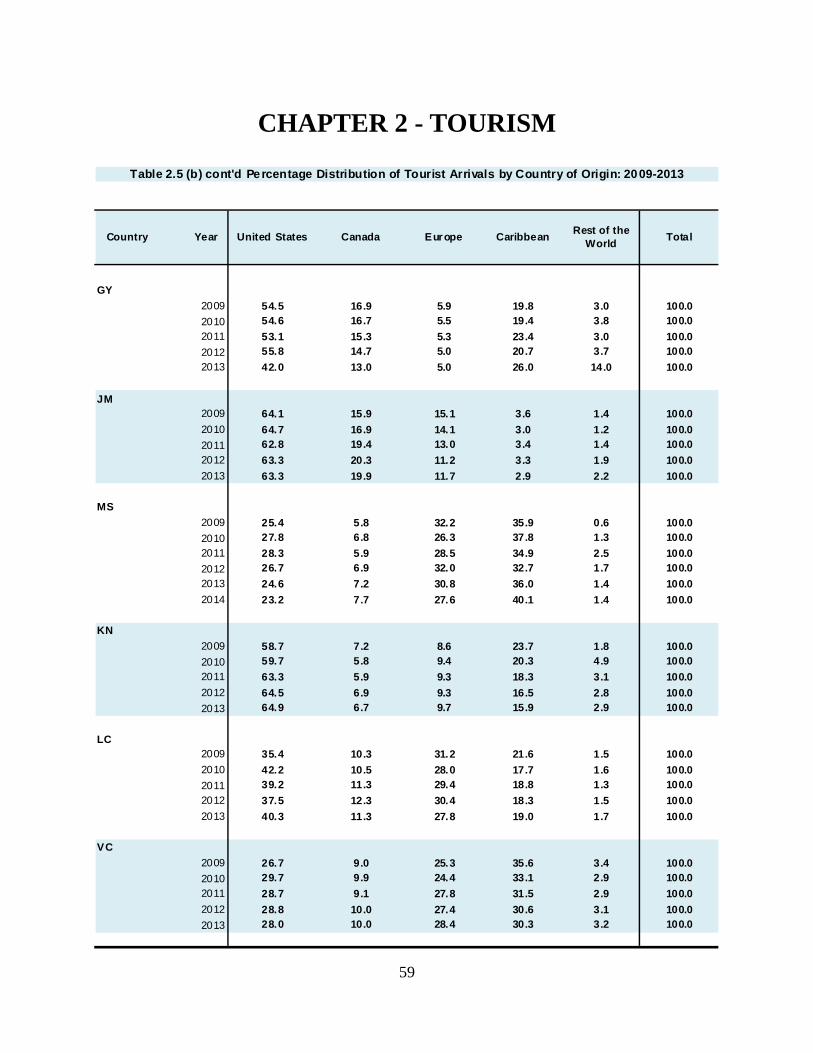
59
CHAPTER 2 - TOURISM
GY
2009 54.5 16.9 5.9 19.8 3.0 100.0
2010 54.6 16.7 5.5 19.4 3.8 100.0
2011 53.1 15.3 5.3 23.4 3.0 100.0
2012 55.8 14.7 5.0 20.7 3.7 100.0
2013 42.0 13.0 5.0 26.0 14.0 100.0
JM2009 64.1 15.9 15.1 3.6 1.4 100.0
2010 64.7 16.9 14.1 3.0 1.2 100.0
2011 62.8 19.4 13.0 3.4 1.4 100.0
2012 63.3 20.3 11.2 3.3 1.9 100.0
2013 63.3 19.9 11.7 2.9 2.2 100.0
MS
2009 25.4 5.8 32.2 35.9 0.6 100.0
2010 27.8 6.8 26.3 37.8 1.3 100.0
2011 28.3 5.9 28.5 34.9 2.5 100.0
2012 26.7 6.9 32.0 32.7 1.7 100.0
2013 24.6 7.2 30.8 36.0 1.4 100.0
2014 23.2 7.7 27.6 40.1 1.4 100.0
KN
2009 58.7 7.2 8.6 23.7 1.8 100.0
2010 59.7 5.8 9.4 20.3 4.9 100.0
2011 63.3 5.9 9.3 18.3 3.1 100.0
2012 64.5 6.9 9.3 16.5 2.8 100.0
2013 64.9 6.7 9.7 15.9 2.9 100.0
LC2009 35.4 10.3 31.2 21.6 1.5 100.0
2010 42.2 10.5 28.0 17.7 1.6 100.0
2011 39.2 11.3 29.4 18.8 1.3 100.0
2012 37.5 12.3 30.4 18.3 1.5 100.0
2013 40.3 11.3 27.8 19.0 1.7 100.0
VC
2009 26.7 9.0 25.3 35.6 3.4 100.0
2010 29.7 9.9 24.4 33.1 2.9 100.0
2011 28.7 9.1 27.8 31.5 2.9 100.0
2012 28.8 10.0 27.4 30.6 3.1 100.0
2013 28.0 10.0 28.4 30.3 3.2 100.0
Table 2.5 (b) cont'd Percentage Distribution of Tourist Arrivals by Country of Origin: 2009-2013
Country Year United States Canada Europe CaribbeanRest of the
WorldTotal
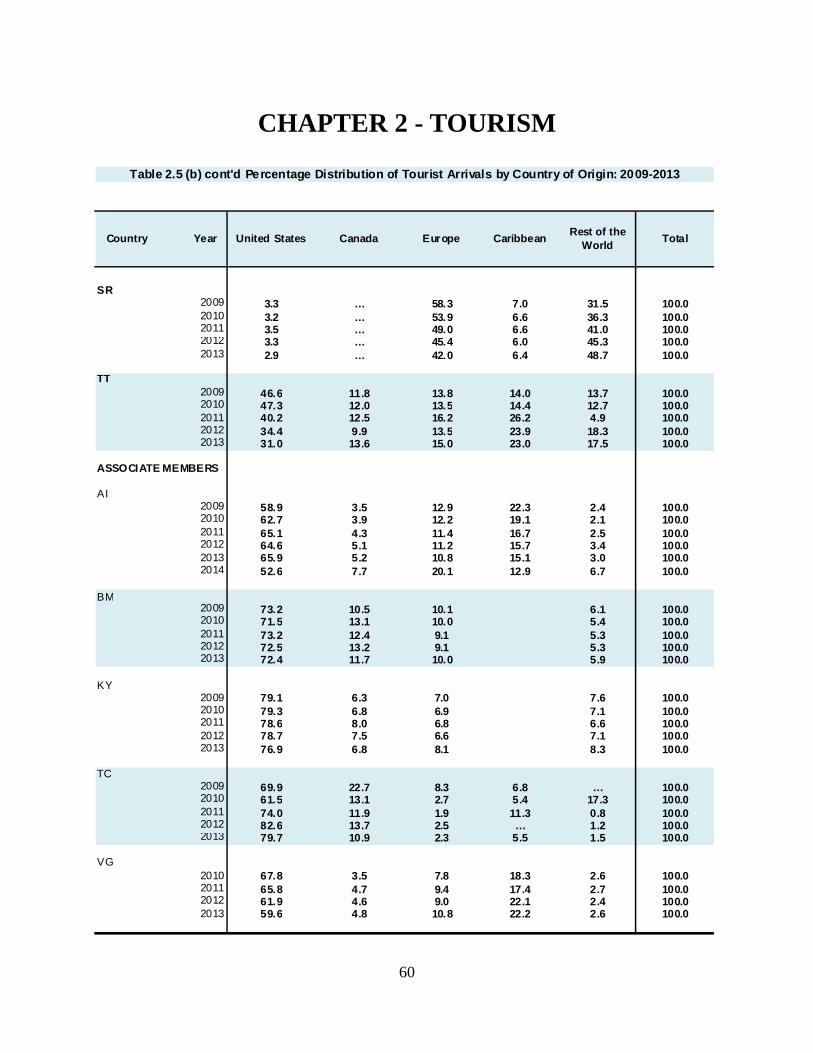
60
CHAPTER 2 - TOURISM
SR2009 3.3 … 58.3 7.0 31.5 100.02010 3.2 … 53.9 6.6 36.3 100.02011 3.5 … 49.0 6.6 41.0 100.02012 3.3 … 45.4 6.0 45.3 100.02013 2.9 … 42.0 6.4 48.7 100.0
TT2009 46.6 11.8 13.8 14.0 13.7 100.02010 47.3 12.0 13.5 14.4 12.7 100.02011 40.2 12.5 16.2 26.2 4.9 100.02012 34.4 9.9 13.5 23.9 18.3 100.02013 31.0 13.6 15.0 23.0 17.5 100.0
ASSOCIATE MEMBERS
AI2009 58.9 3.5 12.9 22.3 2.4 100.02010 62.7 3.9 12.2 19.1 2.1 100.02011 65.1 4.3 11.4 16.7 2.5 100.02012 64.6 5.1 11.2 15.7 3.4 100.02013 65.9 5.2 10.8 15.1 3.0 100.02014 52.6 7.7 20.1 12.9 6.7 100.0
BM2009 73.2 10.5 10.1 6.1 100.02010 71.5 13.1 10.0 5.4 100.02011 73.2 12.4 9.1 5.3 100.02012 72.5 13.2 9.1 5.3 100.02013 72.4 11.7 10.0 5.9 100.0
KY2009 79.1 6.3 7.0 7.6 100.02010 79.3 6.8 6.9 7.1 100.02011 78.6 8.0 6.8 6.6 100.02012 78.7 7.5 6.6 7.1 100.02013 76.9 6.8 8.1 8.3 100.0
TC2009 69.9 22.7 8.3 6.8 … 100.02010 61.5 13.1 2.7 5.4 17.3 100.02011 74.0 11.9 1.9 11.3 0.8 100.02012 82.6 13.7 2.5 … 1.2 100.02013 79.7 10.9 2.3 5.5 1.5 100.0
VG2010 67.8 3.5 7.8 18.3 2.6 100.02011 65.8 4.7 9.4 17.4 2.7 100.02012 61.9 4.6 9.0 22.1 2.4 100.02013 59.6 4.8 10.8 22.2 2.6 100.0
Table 2.5 (b) cont'd Percentage Distribution of Tourist Arrivals by Country of Origin: 2009-2013
Country Year United States Canada Europe CaribbeanRest of the
WorldTotal
61
CHAPTER 2 - TOURISM
United States78%
Canada9% Europe
6%Caribbean
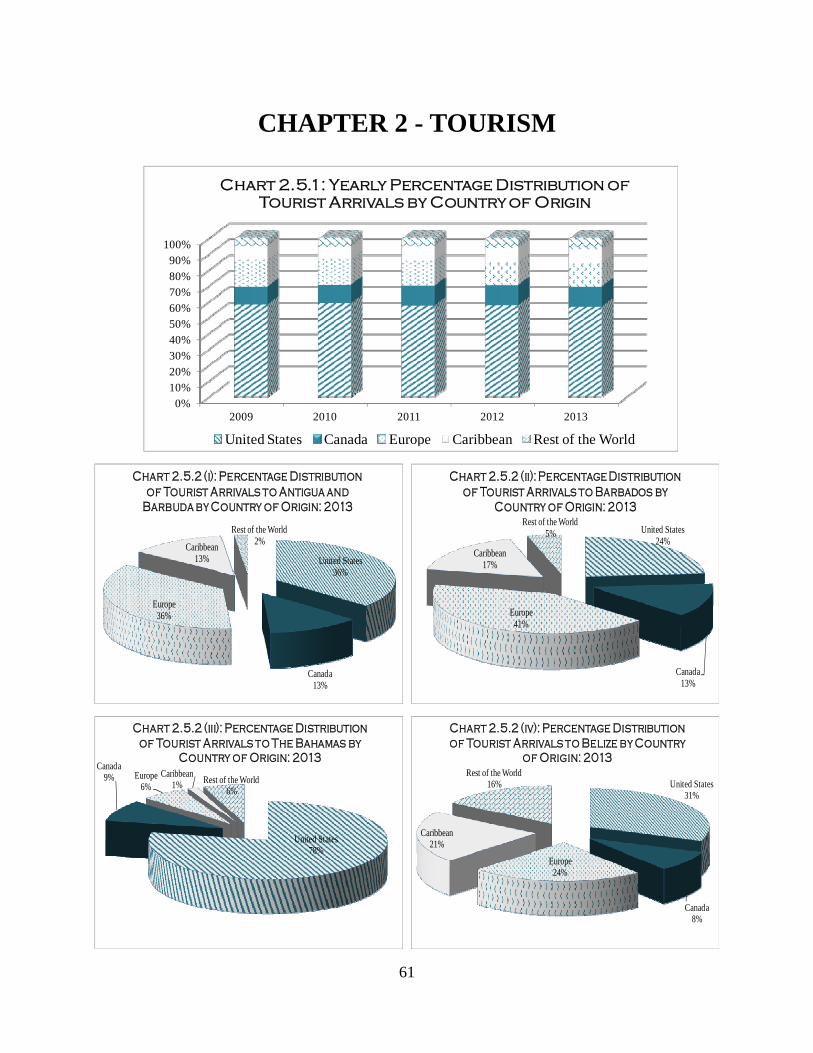
1% Rest of the World6%
Chart 2.5.2 (iii): Percentage Distribution of Tourist Arrivals to The Bahamas by
Country of Origin: 2013
United States31%
Canada8%
Europe24%
Caribbean21%
Rest of the World16%
Chart 2.5.2 (iv): Percentage Distribution of Tourist Arrivals to Belize by Country
of Origin: 2013
United States24%
Canada13%
Europe41%
Caribbean17%
Rest of the World5%
Chart 2.5.2 (ii): Percentage Distribution of Tourist Arrivals to Barbados by
Country of Origin: 2013
United States36%
Canada13%
Europe36%
Caribbean13%
Rest of the World2%
Chart 2.5.2 (i): Percentage Distribution of Tourist Arrivals to Antigua and
Barbuda by Country of Origin: 2013
0%
10%
20%
30%
40%
50%
60%
70%
80%
90%
100%
2009 2010 2011 2012 2013
Chart 2.5.1: Yearly Percentage Distribution of Tourist Arrivals by Country of Origin
United States Canada Europe Caribbean Rest of the World

62
CHAPTER 2 - TOURISM
United States42%
Canada13%
Europe5%
Caribbean26%
Rest of the World14%
Chart 2.5.2 (vii): Percentage Distribution of Tourist Arrivals to The Guyana by
Country of Origin: 2013
United States63%
Canada20%
Europe12%
Caribbean3% Rest of the World
2%
Chart 2.5.2 (viii): Percentage Distribution of Tourist Arrivals to Jamaica by
Country of Origin: 2013
United States25%
Canada7%
Europe31%
Caribbean36%
Rest of the World1%
Chart 2.5.2 (ix): Percentage Distribution of Tourist Arrivals to The Montserrat by
Country of Origin: 2013
United States65%
Canada6%
Europe10%
Caribbean16%
Rest of the World3%
Chart 2.5.2 (x): Percentage Distribution of Tourist Arrivals to St. Kitts and Nevis
by Country of Origin: 2013
United States23%
Canada4%
Europe17%
Caribbean53%
Rest of the World3%
Chart 2.5.2 (v): Percentage Distribution of Tourist Arrivals to The Dominica by
Country of Origin: 2013
United States31%
Canada8%
Europe24%
Caribbean21%
Rest of the World16%
Chart 2.5.2 (vi): Percentage Distribution of Tourist Arrivals to Grenada by
Country of Origin: 2013
63
CHAPTER 2 - TOURISM
United States40%
Canada11%
Europe28%
Caribbean19%
Rest of the World2%
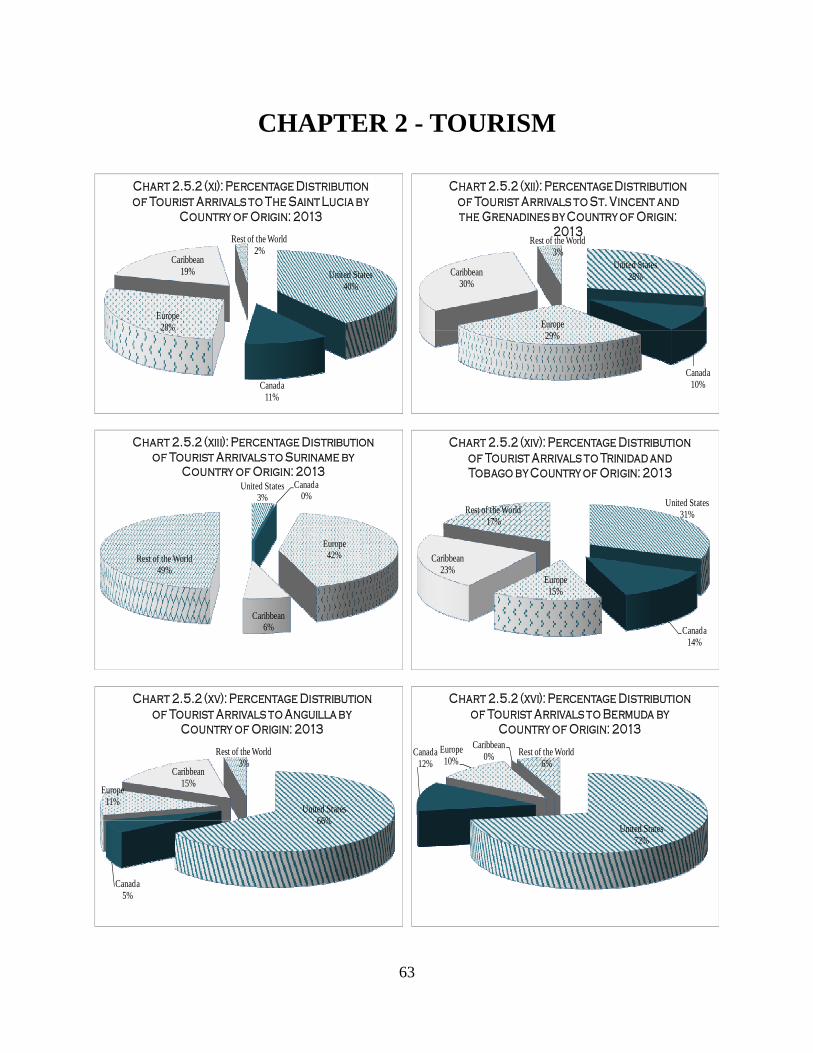
Chart 2.5.2 (xi): Percentage Distribution of Tourist Arrivals to The Saint Lucia by
Country of Origin: 2013
United States28%
Canada10%
Europe29%
Caribbean30%
Rest of the World3%
Chart 2.5.2 (xii): Percentage Distribution of Tourist Arrivals to St. Vincent and the Grenadines by Country of Origin:
2013
United States3%
Canada0%
Europe42%
Caribbean6%
Rest of the World49%
Chart 2.5.2 (xiii): Percentage Distribution of Tourist Arrivals to Suriname by
Country of Origin: 2013
United States31%
Canada14%
Europe15%
Caribbean23%
Rest of the World17%
Chart 2.5.2 (xiv): Percentage Distribution of Tourist Arrivals to Trinidad and Tobago by Country of Origin: 2013
United States66%
Canada5%
Europe11%
Caribbean15%
Rest of the World3%
Chart 2.5.2 (xv): Percentage Distribution of Tourist Arrivals to Anguilla by
Country of Origin: 2013
United States72%
Canada12%
Europe10%
Caribbean0% Rest of the World
6%
Chart 2.5.2 (xvi): Percentage Distribution of Tourist Arrivals to Bermuda by
Country of Origin: 2013

64
CHAPTER 2 - TOURISM
Concepts and Definitions
Tourist Arrivals include all stay-over (or overnight) visitors. It does not, however, include same-day visitors such as cruise passengers and yacht arrivals.
Country of Origin: This is the place/country from which the trip originates. It is usually the same as the place and country of residence.
The trip may also start from the place of work or education. This is not relevant for tourism since the place of residence may still be considered as the origin. When people live in another place than their usual residence during the survey period (e.g. short-term migrants and seasonal workers), this place should be taken as the origin. For day trips the place of origin may be the second regular residence of the person although it is useful to distinguish them from trips originating from the first residence.
Country of Residence: A person is considered to be a resident in a country (place) if the person (i) has lived for most of the past year or 12 months in that country (place), or (ii) has lived in that country (place) for a shorter period and intends to return within 12 months to live in that country (place).
Please refer to Eurostat (1996). Applying the Eurostat Methodological Guidelines In Basic Tourism and Travel Statistics. http://epp.eurostat.ec.europa.eu/
United States77%
Canada7%
Europe8%
Caribbean0% Rest of the World
8%
Chart 2.5.2 (xviii): Percentage Distribution of Tourist Arrivals to The Cayman Islands by
Country of Origin: 2013
United States60%
Canada5%
Europe11%
Caribbean22%
Rest of the World2%
Chart 2.5.2 (xvii): Percentage Distribution of Tourist Arrivals to The British Virgin Islands
by Country of Origin: 2013
United States80%
Canada11%
Europe2%
Caribbean6% Rest of the World
1%
Chart 2.5.2 (xix): Percentage Distribution of Tourist Arrivals to The Turks and
CaicosIslands by Country of Origin: 2013

65
CHAPTER 2 - TOURISM
DATA GAPS Table 2.1 (a) Tourists, Cruise Ships Arrivals and Average tourist nights spent by year Twelve (12) countries submitted data from 2009 -2013 for this table with the remaining gaps filled with data from the Caribbean Tourism Organisation (CTO). Data on the indicator the average tourist nights spent were submitted by six (6) countries and CTO data were used to fill this particular data gap. Table 2.1 (b) Tourism Intensity Rate, Tourism Density Ratio and Tourist Penetration Ratio Five (5) countries supplied the requested data on the Tourism Intensity Rate and Tourist Penetration Ratio while remaining countries with missing data were filled with data from the CTO. Table 2.2 - Number of Hotels classified by Size, Beds and Rooms by Year Table 2.2 presents data on four indicators for the period 2009-2013. Eight (8) countries reported on this table of which six (6) countries reported for the entire period 2009-2013, one country up to 2012 and one country for 2013 only. Three (3) countries providing details for the Hotels by Number of Rooms and two (2) countries providing totals only. Two (2) countries provided data for the Number of beds as well as the Room occupancy rate and one country provided data for the Number of beds, Room occupancy rate and the Total number of rooms occupied. There are no data for twelve (12) countries for this table. Table 2.3 Visitor expenditure and Number Employed in Tourism Seven (7) countries submitted data on the Total Visitor Expenditure with three (3) countries also submitting data on expenditure by category. Data for ten (10) countries were sourced from the CTO. Total number of persons directly employed in tourism was submitted by two (2) countries with one country also submitting data disaggregated by sex. Large data gaps exists for Visitor expenditure by category and the Total number of persons directly employed in tourism by sex. Table 2.4 Number of Tourist Arrivals by Type of Accommodation Data were received from eight (8) countries for the entire period 2009-2014. Twelve countries (12) have therefore not submitted data for this table. Table 2.5 Tourist Arrivals by Country of Origin Data were submitted by twelve (12) countries, however, the table has been updated with data for a total of eighteen (18) countries; six (6) through the use of the CTO database. Missing data exists for two (2) countries. In summary, the tables that require data on tourism accommodation contained the most data gaps. Most countries also did not submit data on the indicators which measure the impact of tourism.
66
CHAPTER 2 - TOURISM
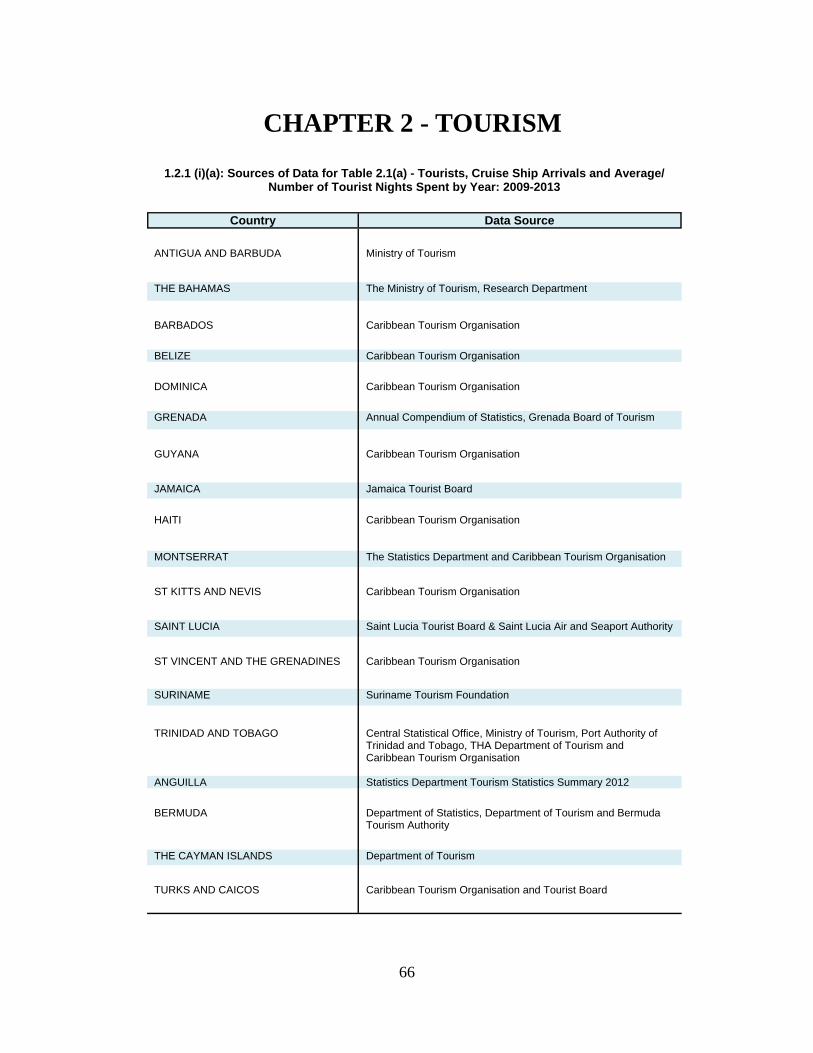
1.2.1 (i)(a): Sources of Data for Table 2.1(a) - Tourists, Cruise Ship Arrivals and Average/Number of Tourist Nights Spent by Year: 2009-2013
Country Data Source
ANTIGUA AND BARBUDA Ministry of Tourism
THE BAHAMAS The Ministry of Tourism, Research Department
BARBADOS Caribbean Tourism Organisation BELIZE Caribbean Tourism Organisation DOMINICA Caribbean Tourism Organisation
GRENADA Annual Compendium of Statistics, Grenada Board of Tourism
GUYANA Caribbean Tourism Organisation
JAMAICA Jamaica Tourist Board
HAITI Caribbean Tourism Organisation
ST KITTS AND NEVIS Caribbean Tourism Organisation
SAINT LUCIA Saint Lucia Tourist Board & Saint Lucia Air and Seaport Authority
ST VINCENT AND THE GRENADINES Caribbean Tourism Organisation
SURINAME Suriname Tourism Foundation TRINIDAD AND TOBAGO Central Statistical Office, Ministry of Tourism, Port Authority of
Trinidad and Tobago, THA Department of Tourism and Caribbean Tourism Organisation
ANGUILLA Statistics Department Tourism Statistics Summary 2012 BERMUDA Department of Statistics, Department of Tourism and Bermuda
Tourism Authority
THE CAYMAN ISLANDS Department of Tourism
TURKS AND CAICOS Caribbean Tourism Organisation and Tourist Board
MONTSERRAT The Statistics Department and Caribbean Tourism Organisation

67
CHAPTER 2 - TOURISM
1.2.1(i)(b): Notes for Table 2.1 (a) Tourists, Cruise Ship Arrivals and Average/Number of Tourist Nights Spent by Year: 2009-2013
Country Notes
JAMAICA Cruise passengers include armed forces on naval vessels.
1.2.1(ii) (a): Sources of Data for Table 2.1 (b): Tourism Intensity Rate, Tourism Density Ratio and Tourist Penetration Ratio: 2009-2013
Country Data Source
ANTIGUA AND BARBUDA Caribbean Tourism Organisation
THE BAHAMAS The Ministry of Tourism
BARBADOS Caribbean Tourism Organisation BELIZE Caribbean Tourism Organisation DOMINICA Environment Statistics 2014 report and the Caribbean Tourism Organisation
GRENADA Caribbean Tourism Organisation
GUYANA Caribbean Tourism Organisation
JAMAICA Caribbean Tourism Organisation
HAITI Caribbean Tourism Organisation
MONTSERRAT Caribbean Tourism Organisation
ST KITTS AND NEVIS Caribbean Tourism Organisation

68
CHAPTER 2 - TOURISM
1.2.2 (a): Sources of Data for Table 2.2: Number of Hotels Classified by Number of Rooms, Beds and Rooms occupied by Year
Country Data Source
THE BAHAMAS The Ministry of Tourism
DOMINICA Environment Statistics 2014 report MONTSERRAT The Statistics Department
JAMAICA Jamaica Tourist Board
BERMUDA Department of Statistics, Department of Tourism and Bermuda Tourism Authority
THE CAYMAN ISLANDS Cayman Islands Department of Tourism
TRINIDAD AND TOBAGO Central Statistical Office
SURINAME Suriname Tourism Board
1.2.1(ii) (a): Sources of Data for Table 2.1 (b): Tourism Intensity Rate, Tourism Density Ratio and Tourist Penetration Ratio: 2009-2013
Country Data Source
SAINT LUCIA Central Statistics Office and Caribbean Tourism Organisation ST VINCENT AND THE GRENADINES Caribbean Tourism Organisation
SURINAME Caribbean Tourism Organisation
TRINIDAD AND TOBAGO Caribbean Tourism Organisation ANGUILLA Caribbean Tourism Organisation BERMUDA Department of Statistics, Department of Tourism and Bermuda Tourism Au-
thority and Caribbean Tourism Organisation
THE BRITISH VIRGIN ISLANDS Caribbean Tourism Organisation
THE CAYMAN ISLANDS Caribbean Tourism Organisation
TURKS AND CAICOS Caribbean Tourism Organisation
Tourist Board

69
CHAPTER 2 - TOURISM
1.2.3(a): Sources of Data for Table 2.3: Visitor Expenditure and Number Employed in Tourism
Country Data Source
ANTIGUA AND BARBUDA Caribbean Tourism Organisation
THE BAHAMAS Department of Statistics, Expenditure Surveys
BARBADOS Barbados Statistical Service BELIZE Statistical Institute of Belize DOMINICA Caribbean Tourism Organisation
GRENADA Annual Compendium of Statistics, Grenada Board of Tourism
JAMAICA Jamaica Tourist Board
HAITI Caribbean Tourism Organisation
ST KITTS AND NEVIS Caribbean Tourism Organisation
SAINT LUCIA Saint Lucia Tourist Board ST VINCENT AND THE GRENADINES Caribbean Tourism Organisation
SURINAME Caribbean Tourism Organisation
TRINIDAD AND TOBAGO Central Statistics Office ANGUILLA Caribbean Tourism Organisation BERMUDA Department of Statistics, Department of Tourism and Bermuda
Tourism Authority
THE BRITISH VIRGIN ISLANDS Caribbean Tourism Organisation
THE CAYMAN ISLANDS Cayman Islands Department of Tourism, Visitor Exit Survey
TURKS AND CAICOS Tourist Board
MONTSERRAT The Statistics Department of Montserrat

70
CHAPTER 2 - TOURISM
1.2.4 (a): Sources of Data for Table 2.4: Tourist Arrivals by Type of Accommodation
Country Data Source THE BAHAMAS The Ministry of Tourism
DOMINICA Environment Statistics 2014 report
MONTSERRAT Statistics Department
SAINT LUCIA Saint Lucia Tourist Board
SURINAME Traffic and Transport statistics and the Environment publication 2014
BERMUDA Department of Statistics, Department of Tourism and Bermuda Tourism Authority
THE CAYMAN ISLANDS Cayman Islands Immigration Department and Cayman Islands Depart-ment of Tourism
JAMAICA Jamaica Tourist Board
ST VINCENT AND THE GRENADINES 2012 Compendium of Environmental Statistics
1.2.4(b): Notes for Table 2.4: Tourist Arrivals by Type of Accommodation
Country Notes
THE CAYMAN ISLANDS Hotels include guest houses Other includes timeshare
SURINAME Apartment include guest houses
JAMAICA Data includes visitors and non-resident Jamaicans. Apartments/Villas include guest houses Data for Apartments/Villas and Guest Houses are for "Non-hotels".

71
CHAPTER 2 - TOURISM
1.2.5(a): Sources of Data for Table 2.5: Tourist Arrivals by Country of Origin: 2009-2013
Country Data Source
ANTIGUA AND BARBUDA Ministry of Tourism
THE BAHAMAS Department of Immigration and Bahamas Ministry of Tourism
Research and Statistics Department . BARBADOS Caribbean Tourism Organisation BELIZE Caribbean Tourism Organisation DOMINICA Caribbean Tourism Organisation
GRENADA Annual Compendium of Statistics, Grenada Board of Tourism
GUYANA Caribbean Tourism Organisation
JAMAICA Caribbean Tourism Organisation
MONTSERRAT Statistics Department
ST KITTS AND NEVIS Caribbean Tourism Organisation SAINT LUCIA Saint Lucia Tourist Board and Central Statistics Office ST VINCENT AND THE GRENADINES Caribbean Tourism Organisation
SURINAME Traffic and Transport statistics and the Environment publication
2014 TRINIDAD AND TOBAGO Central Statistical Office / Caribbean Tourism Organisation ANGUILLA Caribbean Tourism Organisation BERMUDA Department of Statistics, Department of Tourism and Bermuda
Tourism Authority
THE CAYMAN ISLANDS Department of Tourism, Cayman Islands Government
TURKS AND CAICOS Tourist Board
THE BRITISH VIRGIN ISLANDS Caribbean Tourism Organisation


