Page 1
Review of Literature
26
Chapter 2
Review of Literature
The foundations for any research study are to be consolidated with ideas,
thoughts, concepts and methodologies formulated and adopted by various
associated research studies. The constructs and variables are defined as per
the explanations and evidences found in the existing literature and
contemporary studies undertaken.
The present study makes an attempt to understand performance
heterogeneity in the Indian Automotive Companies on the basis of their
resources and competitive advantage. Further the study is undertaking the
Resource Based View of Strategy as platform to develop a model for
performance heterogeneity. Hence the concepts of resource based view,
competitive advantage, performance and the Indian Automotive Companies
are reviewed to build up the base for the present study.
2.1 The Indian Automotive Industry
The Automotive Sector has been a center of attraction for various researches
in the fields of productivity, operational performances, marketing strategies,
consumer behavior, financial performances, segment wise studies, economic
analysis, industry analysis and the strategies adopted. Number studies have
been done depicting the phenomenal growth of Indian Automotive sector in
the post liberalization era. The Indian Automotive Sector has emerged as one
of the most fertile Industry with tremendous potential for Indigenous as well
as Foreign Players. The raising standard of living of the Indian people and
their increased purchasing powers has given a boost to the Automobile
Companies as well the Auto Component sector has also progressed.
Page 2
Review of Literature
27
Researchers at industry level have shown about 40% increase in average
productivity in the automobile sector during the decade after the
liberalization took place (Iyer et al 2006, Saranga and Banker 2006).
2.1.1 Automotive Sector in India: Development of Indian Automotive
Industry
2.1.1.1 Overview of Industry
The Indian automobile industry started functioning in 1950s, and has grown
since under a highly regulated and protected economic environment. The
firms were subjected to strict product specific capacity licensing, foreign
collaboration, asset size and scope of industrial operations. As a result very
few firms dominated all the products. With the new industrial policy of 1991
the Indian Government deregulated the entry into automotive sector,
dispensed with the use of licenses to control output levels and significantly
reduced import tariffs on auto components. The changes in the Indian
economic scenario have led to an influx of globally competitive auto
assemblers to the Indian market. Competition among assemblers has become
intense and as a result firms are increasingly being innovative in order to
reduce costs, enhance quality, and improve their performance and
responsiveness to customers’ demand (Iyer, Koudal, Saranga and Seshadri
2006).
The decades of 70s and 80s witnessed high degree of regulations and
protection, and so the reforms in early 1990s led to a boom in the automobile
industry till 1996. The response of industry in terms of capacity expansion
was massive and entry of multinationals led to an acute over capacity. The
competition became intense leading to price wars and aggressive cost cutting
measures (Narayanan and Vashisht 2008). The reforms forced the vehicle
industry into a high degree of unsustainable competition (Piplai 2001).
Page 3
Review of Literature
28
2.1.1.2 Evolution of Indian Automotive Industry
Many Researchers in their studies have described the development of Indian
Automotive Industry into three phases.
From 1947 to 1983: India was a closed market economy, and the industry
growth was only limited to domestic supplies. As there were very few
innovations, the technology adopted was inefficient in terms of fuel
consumption and modal development and by that time only 5 firms where
operating (Mani S. 2011)
From 1983 to 1993: The decade witnessed a liberal approach in the Indian
economy as far as the automotive sector is considered. Government of India
entered joint venture with Suzuki motors of Japan and Maruti Udyog in
collaboration with Suzuki started manufacturing. This event was preceded
with Hindustan motors entering a joint venture with Mitsubishi in 1980’s. Till
then the number of firms were six (Mani 2011, Nandy 2011). But till 1990 the
Industry was under “License Raj”.
After 1993: Major changes in the Indian economic scenario. Liberalization of
the economy led to dramatic transformation in the Indian Automotive Sector.
The industry was de licensed. Major Multinational OEMs (Original
equipment manufacturers) started assembling. Valued added tax (VAT)
implemented. Imports were allowed from 2001, and the number players were
greater than 35 (Mani 2011).
2.1.1.3 The Contemporary Scenario
KPMG survey report (2010) has reflected the environmental scenario in which
the Indian Automotive Companies are functioning and the tenets of this
sector which has shown tremendous response to globalization.
Demographically and economically, India’s automotive industry is well-
positioned for predicted increase in India’s working-age population is likely
to help stimulate the burgeoning market for private vehicles. Rising
Page 4
Review of Literature
29
prosperity, easier access to finance and increasing affordability is expected to
see four-wheelers gaining volumes, although two wheelers will remain the
primary choice for the majority of purchasers, buoyed by greater appetite
from rural areas, the youth market and women. (The Indian Automotive
Industry: Evolving Dynamics 2010).
As per CII’s Auto Survey 2012, The Indian Automotive Industry is:
Largest three wheeler market in the world
Second largest two wheeler market in the world
Seventh largest passenger car market in Asia and 10th Largest in the
world
Fourth largest tractor market in the world
Fifth largest commercial vehicle market in the world
Fifth largest bus and truck market in the world
The survey also highlights that The Indian Automobile Industry embarked on
a new journey since 1991 with de licensing of the sector and subsequent
opening up for 100 per cent FDI through automatic route. Almost all the
global majors have set up their facilities in India taking the next level of
production of vehicles from 2 million in 1991 to 110+ million in 2011.
As per Ray (2012), The Indian Automotive Industry after de-licensing in July,
1991 has grown at a spectacular rate of 17% on an average for last few years.
The industry has now attained a turnover of Rs. 1, 65,000 crores (34 billion
USD) and an investment of Rs. 50,000 crores. Over of Rs. 35,000 crores of
investment is in pipeline. The industry is providing direct and indirect
employment to 1.31 crore people. It is also making a contribution of 17% to
the kitty of indirect taxes. While the export earnings have been 4.08 billion
USD out which the share of auto components is 1.8 billion USD (Ray2012).
Ray (2012) further urges that the automotive industry is a volume driven
industry and a certain critical mass is a pre-requisite for attracting the much
needed investment in Research and Development and New Product Design
Page 5
Review of Literature
30
and Development. RandD investment is needed for innovations which is the
life-line for achieving and retaining the competitiveness in the industry. The
competitiveness depends on the capacity and the speed of innovation and up
gradation. As per Ray (2012) the most important indices for competitiveness
is productivity in both capital and labour.
The Indian Automotive industry can further be understood by the analysis
done by Pandya and Pandya (2013), the authors have dons a fundamental
analysis of the Indian Automobile Industry. The article presents a
segmentation of the Indian Automobile Industry which highlights the two
wheeler segment with 76%, passenger vehicles with 16.25%, commercial
vehicles 4.36% while three wheelers constitute 3.39% of the industry (Pandya
and Pandya 2013).
Also the Indian Automotive Industry is filled with both domestic and
international players making it highly competitive. Almost 8 out of 10 global
companies contribute 25% of the country’s production.
The Automotive Industry in India comprise of the following: (Source:
Indian Automotive Expectation Survey 2011- Mazars)
Table 2.1 Composition of Indian Automotive Industry
Passenger Cars Commercial
Vehicles
Two Wheelers Three Wheelers
Maruti Suzuki
Tata Motors
Hyundai
Mahindra and
Mahindra
Honda
Toyota
Hindustan
Motors
Tata Motors
Ashok Leyland
Swaraj Mazda
Volvo
MAN
AMW
ITEC
Force Motors
Mercedes-Benz
Hero Moto Corp.
TVS
Bajaj Auto
Royal Enfield
Motors
Kinetic Motors
LML India
Suzuki
Yamaha
Bajaj Auto
Piaggio
Mahindra and
Mahindra
TVS Motors
Force Motors
Scooters India
Panchnath Auto
Devendra
Page 6
Review of Literature
31
General Motors
Fiat
Ford
Volkswagen
Audi
BMW
Mercedes-Benz
Nissan
Skoda
Volvo
Sonalika (ICML)
Premier Motor
Hyundai
Mahindra
Navistar
Eicher Motors
Mahindra and
Mahindra
Honda
Motorcycles
Automobiles
Some startling facts
about automotive
industry in India - at
a glance:
Second largest two India.
2.1.2 Performance of the Industry
Performance in automotive production has shown promising trends in last
ten years. The production of passenger vehicles has continuously increased
from 2004-05 to 2010-11. Production of automobile has increased by 147%
from 2004-05 to 2010 -11. In commercial vehicles, production has a raising
trend up to 2007-08. In 2008-09, production has declined by 24%. But from
2009-10 onwards production has continuously increased. In three wheelers
category, up to 2007-08, production was showing an upward trend, but in
2008-09 there was slight decline in production. Again from 2009-10 onwards,
production has continuously increased. In two wheelers category, up to 2006-
07 production has increased but in 2007-08 production has declined by 5%.
After 2008-09 it is continuously rising (Pandya and Pandya 2013).
The study also reveal some key statistics about the Indian Automotive
Industry: The overall Indian automobile sector recorded a growth of 14.25 per
cent (16.9 million units in 2011 from 14.8 million units in 2010). Passenger car
sales increased by 4.24 per cent, from 1.867 million units in 2010 to 1.946
million units in 2011, two wheeler sales of 13 million units in 2011 increased
by 16.22 percent and three-wheeler sales of 525,000 units increased by 4.74 per
Page 7
Review of Literature
32
cent in 2011. The FDI in automotive sector has increased by 800% within last
five years. Also the increase in infrastructure facilities has led to the growth
the sector. Also heterogeneity in performance has been observed by
analyzing the financial parameters (Pandya and Pandya 2013).
Rao and Sharma (1993), in their study have discussed a framework of
performance of Automobile industry based on market, technology and
financial dimensions. As per Rao and Sharma (1993), Performance can be
considered in terms of market (sales and market share), and financial
(profitability) dimensions. Market performance as measured by absolute
sales volumes or turnover and market shares connotes the ability of the
company to exploit the market opportunity and sustain a presence in the face
of competitive pressures. Market performance reflects the acceptance of the
technological and other attributes of the product by customers. Along with
market performance, financial performance is crucial for the firm in the long
run. The strategy and structure of a firm are both enabling and derived
dimensions of a firm's financial performance (Rao and Sharma 1993). In the
study by Rao and Sharma (1993), 36 measures of profitability in relation to
gross turnover, total capital employed, net worth (share-holders' funds), share
capital, and fixed assets are computed. Out of which two measures were
found to be of greater relevance. The first measure expresses profitability of
operations net of depreciation, interest, and tax as a percentage of gross
turnover while the second measure is expresses profitability of operations
before interest and tax but net of depreciation as a percentage of total capital
employed, comprising both loan and equity funds.
Continuing on the discussion on performance and profitability of Indian
Automobile Companies, the research study by Jamali and Asadi (2012),
investigates the relationship between management efficiency and profitability
for a sample of 13 auto manufacturing companies listed in BSE, located at
Pune, taking into account a period of 5 years. Management efficiency is an
important component of corporate financial management because it directly
Page 8
Review of Literature
33
affects the profitability of the firms. Profitability is the ability to make profit
from all the business activities of an organization, company, firm, or an
enterprise. It shows how efficiently the management can make profit by using
all the resources available in the market (Jamali and Asadi 2012). The
profitability ratios show a company’s overall efficiency and performance.
Gross Profit Ratio and Asset Turnover Ratios have been used to determine
profitability and consequently the performance of the firms. Profitability and
management efficiency are usually taken to be positively associated: poor
current profitability may threaten current management efficiency and vice
versa; poor management efficiency may threaten profitability (Eskandari,
2007).
2.1.2.1 Key Players in the Indian Automotive Industry and their
performance.
(Source: www.imaginmor.com/automobileindustryindia.html)
a. Tata Motors
Market Share: Commercial Vehicles 63.94%, Passenger Vehicles 16.45%
Tata Motors Limited is India’s largest automobile company, with
consolidated revenues of USD 14 billion in 2008-09. It is the leader in
commercial vehicles and among the top three in passenger vehicles.
Tata Motors has winning products in the compact, midsize car and utility
vehicle segments. The company is the world's fourth largest truck
manufacturer, and the world's second largest bus manufacturer with over
24,000 employees. Since first rolled out in 1954, Tata Motors as has produced
and sold over 4 million vehicles in India.
Tata Motors is the first company from India's engineering sector to be listed in
the New York Stock Exchange (September 2004), has also emerged as an
international automobile company. Through subsidiaries and associate
companies, Tata Motors has operations in the United Kingdom, South Korea,
Page 9
Review of Literature
34
Thailand and Spain. Among them is Jaguar Land Rover, a business
comprising the two British brands which was acquired in 2008. In 2004, it
acquired the Daewoo Commercial Vehicles Company, South Korea's second
largest truck maker. The rechristened Tata Daewoo Commercial Vehicles
Company has launched several new products in the Korean market, while
also exporting these products to several international markets. Today two-
thirds of heavy commercial vehicle exports out of South Korea are from Tata
Daewoo. In 2005, Tata Motors acquired a 21% stake in Hispano Carrocera, a
reputed Spanish bus and coach manufacturer, and subsequently the
remaining stake in 2009. Hispano's presence is being expanded in other
markets.
In 2006, Tata Motors formed a joint venture with the Brazil-based Marcopolo,
a global leader in body-building for buses and coaches to manufacture fully-
built buses and coaches for India and select international markets. In 2006,
Tata Motors entered into joint venture with Thonburi Automotive Assembly
Plant Company of Thailand to manufacture and market the company's pickup
vehicles in Thailand. The new plant of Tata Motors (Thailand) has begun
production of the Xenon pickup truck, with the Xenon having been launched
in Thailand in 2008. Tata Motors is also expanding its international footprint
by franchises and joint ventures assembly operations in Kenya, Bangladesh,
Ukraine, Russia, Senegal and South Africa.
With over 3,000 engineers and scientists, the company's Engineering Research
Centre, established in 1966, has enabled pioneering technologies and
products. The company today has RandD centers in Pune, Jamshedpur,
Lucknow, Dharwad in India, and in South Korea, Spain, and the UK. It was
Tata Motors, which developed the first indigenously developed Light
Commercial Vehicle, India's first Sports Utility Vehicle and, in 1998, the Tata
Indica, India's first fully indigenous passenger car. Within two years of
launch, Tata Indica became India's largest selling car in its segment. In 2005,
Page 10
Review of Literature
35
Tata Motors created a new segment by launching the Tata Ace, India's first
indigenously developed mini-truck.
In January 2008, Tata Motors unveiled its People's Car, the Tata Nano, a
development which signifies a first for the global automobile industry. Nano
brings the comfort and safety of a car within the reach of thousands of
families. The standard version has been priced at USD 2,200 or 100,000
(excluding VAT and transportation cost). The Tata Nano has been
subsequently launched as planned, in India by March 2009. Also in 2009 the
company launched a new range of world standard trucks “Prima”.
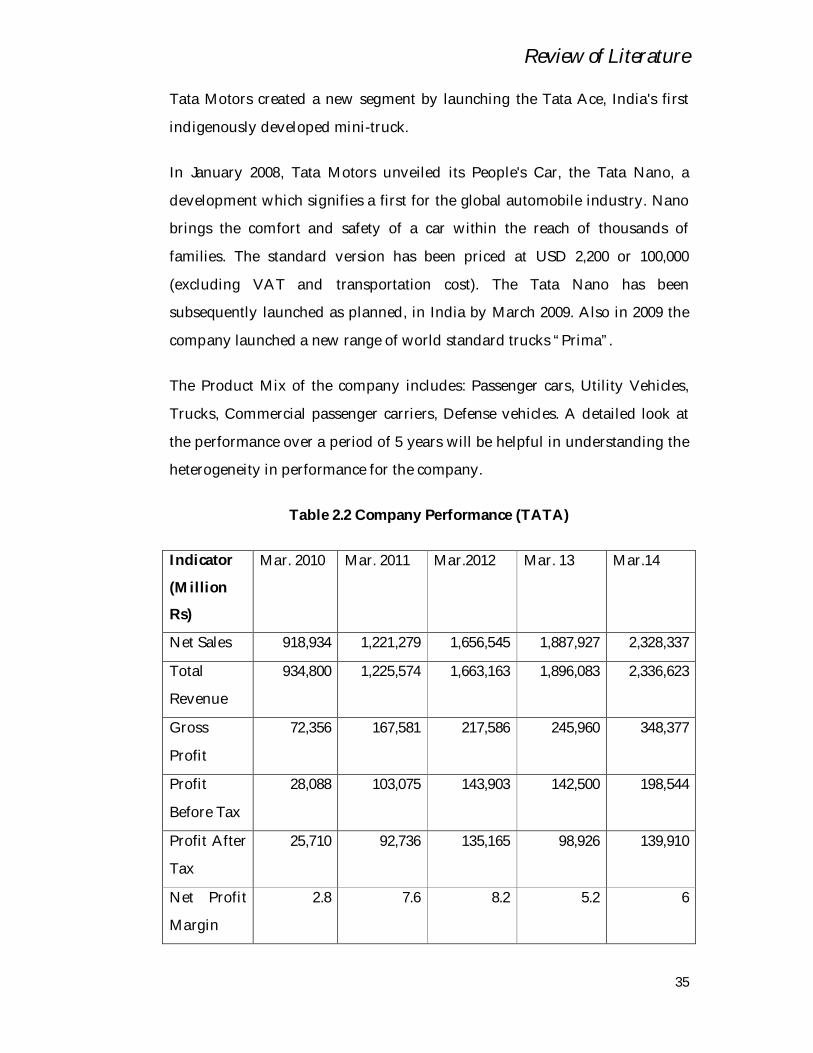
The Product Mix of the company includes: Passenger cars, Utility Vehicles,
Trucks, Commercial passenger carriers, Defense vehicles. A detailed look at
the performance over a period of 5 years will be helpful in understanding the
heterogeneity in performance for the company.
Table 2.2 Company Performance (TATA)
Indicator
(Million
Rs)
Mar. 2010 Mar. 2011 Mar.2012 Mar. 13 Mar.14
Net Sales 918,934 1,221,279 1,656,545 1,887,927 2,328,337
Total
Revenue
934,800 1,225,574 1,663,163 1,896,083 2,336,623
Gross
Profit
72,356 167,581 217,586 245,960 348,377
Profit
Before Tax
28,088 103,075 143,903 142,500 198,544
Profit After
Tax
25,710 92,736 135,165 98,926 139,910
Net Profit
Margin
2.8 7.6 8.2 5.2 6
Page 11
Review of Literature
36
Current
Assets
424,456 420,888 644,615 741,536 958,453
Net fixed
assets
385,063 432,211 562,125 698,629 973,754
Sales to
asset ratio
1.1 1.2 1.2 1.1 1.1
Return on
Assets
5.4 11.5 11.3 7.9 8.5
Return on
Equity
31.3 48.4 40.8 26.3 21.3
Return on
Capital
16.1 41.0 26.0 24.7 21.2
(Source: www.equitymaster.com)
Sales have consistently shown increments, although contrasting results are
seen for on other financial performance parameters like profit before tax,
profit after tax, return on assets, return on equity and return on capital, which
have shown fluctuations indicating heterogeneity in the overall performance
of the company year by year. Year 2010 has not been good for the company.
b. Maruti Suzuki India
Market Share: Passenger Vehicles 46.07%
Maruti Suzuki India Limited, a subsidiary of Suzuki Motor Corporation of
Japan, is India's largest passenger car company, accounting for over 45% of
the domestic car market. The company offers a complete range of cars from
entry level Maruti-800 and Alto, to stylish hatchback Ritz, A star, Swift,
Wagon-R, Estillo and sedans DZire, SX4 and Sports Utility vehicle Grand
Vitara.
Page 12
Review of Literature
37
Since inception in 1983, Maruti Suzuki India has produced and sold over 7.5
million vehicles in India and exported over 500,000 units to Europe and other
countries. The company’s revenue for the fiscal 2008-2009 stood over USD 4
billion and Profits after Tax at over USD 243 million.
A detailed look at the performance over a period of 5 years will be helpful in
understanding the heterogeneity in performance for the company.
Table 2.3 Company Performance (Maruti Suzuki)
Indicator
(Rs)
Mar. 2010 Mar. 2011 Mar.2012 Mar.2013 Mar.2014
Net Sales 295,915 371,558 360,899 443,044 444,506
Total
Revenue
306,259 376,703 369,342 451,354 452,811
Gross
Profit
35,910 37,515 25,656 43,275 52,038
Profit
Before Tax
37,466 32,103 21,925 30,701 37,388
Profit After
Tax
26,247 23,824 16,810 24,692 28,529
Net Profit
Margin
8.9 6.4 4.7 9.8 11.6
Current
Assets
39,232 97,464 112,420 111,754 145,536
Net fixed
assets
55,635 65,510 83,577 119,882 136,732
Sales to
asset ratio
1.8 1.9 1.6 1.6 1.4
Return on
Assets
15.8 12.6 7.5 9.7 9.7
Return on 21.5 16.6 10.7 13.0 13.3
Page 13
Review of Literature
38
Equity
Return on
Capital
30.2 22.4 14.2 16.7 17.8
(Source: www.equitymaster.com)
In terms of Profit, and Returns on assets, equity and capital the company has
done very well in the year 2010, but the profit margin has decreased again
heterogeneity in overall performance yet having a consistent sales growth is
clearly visible.
c. Hyundai Motor India
Market Share: Passenger Vehicles 14.15%
Hyundai Motor India Limited is a wholly owned subsidiary of world’s fifth
largest automobile company, Hyundai Motor Company, South Korea, and is
the largest passenger car exporter. Hyundai Motor presently markets 49
variants of passenger cars across segments. These includes the Santro in the B
segment, the i10, the premium hatchback i20 in the B+ segment, the Accent
and the Verna in the C segment, the Sonata Transform in the E segment.
Hyundai Motor, continuing its tradition of being the fastest growing
passenger car manufacturer, registered total sales of 559,880 vehicles in the
year 2009, an increase of 14.4% over 2008. In the domestic market it clocked a
growth of 18.1% as compared to 2008 with 289,863 units, while overseas sales
grew by 10.7%, with export of 270,017 units. Hyundai Motor currently exports
cars to more than 110 countries across European Union, Africa, Middle East,
Latin America and Asia. It has been the number one exporter of passenger car
of the country for the sixth year in a row.
In a little over a decade since Hyundai has been present in India, it has
become the leading exporter of passenger cars with a market share of 66% of
the total exports of passenger cars from India, making it a significant
Page 14
Review of Literature
39
contributor to the Indian automobile industry. In 2009, in spite of a global
slowdown, Hyundai Motor India’s exports grew by 10.7%. In 2010 Hyundai
plans to add 10 new markets with Australia being the latest entrant to the list.
The first shipment to Australia is of 500 units of the i20 and the total i20
exports to Australia are expected to be in the region of 15,000 per annum.
d. Mahindra and Mahindra
Market Share: Commercial Vehicles 10.01%, Passenger Vehicles 6.50%, Three
Wheelers 1.31%
Mahindra and Mahindra is mainly engaged in the Multi Utility Vehicle and
Three Wheeler segments directly. The company competes in the Light
Commercial Vehicle segment through its joint venture subsidiary Mahindra
Navistar Automotives Limited and in the passenger car segment through
another joint venture subsidiary Mahindra Renault. In the year 2009, on the
domestic sales front, the Company along with its subsidiaries sold a total of
220,213 vehicles (including 44,533 three wheelers, 8,603 Light Commercial
Vehicles through Mahindra Navistar Automotives and 13,423 cars through
Mahindra Renault), recording a growth of 0.6% over the previous year.
The company’s domestic Multi Utility Vehicle sales volumes increased by
3.3%, as against a decline of 7.4% for industry Multi Utility Vehicle sales. A
record number of 153,653 Multi Utility Vehicles were sold in the domestic
market in 2009 compared to 148,761 MUVs in the previous year. Hence,
Mahindra and Mahindra further strengthened its domination of the domestic
Multi Utility Vehicle sub-segment during the year, increasing its market share
to 57.2% over the previous year’s market share of 51.3%.
Mahindra and Mahindra is expanding its footprint in the overseas market. In
2009 the Xylo was launched in South Africa. The company formed a new joint
venture Mahindra Automotive Australia Pty. Limited, to focus on the
Australian Market. (Source: Mahindra and Mahindra Annual Report)
Page 15
Review of Literature
40
A detailed look at the performance over a period of 5 years will be helpful in
understanding the heterogeneity in performance for the company.
Table 2.4 Company Performance (Mahindra and Mahindra)
Indicator
(Rs)
Mar. 2010 Mar. 2011 Mar. 2012 Mar.2013 Mar. 2014
Net Sales 315,686 368,638 539,989 687,357 740,009
Total
Revenue
318,288 371,742 597,379 691,246 745,060
Gross
Profit
55,071 62,719 76,398 95,993 101,202
Profit
Before Tax
37,994 44,745 43,775 51,279 55,018
Profit After
Tax
24,785 30,797 31,266 40,992 46,669
Net Profit
Margin
7.9 8.4 5.3 6.0 6.3
Current
Assets
203,162 211,854 289,409 340,201 395,944
Net fixed
assets
105,203 161,161 166,005 179,412 192,280
Sales to
asset ratio
0.9 0.7 0.9 0.9 0.8
Return on
Assets
10 8.4 7.8 8.4 8.6
Return on
Equity
24.3 21.6 18.7 20.5 20
Return on
Capital
21.1 21.0 19.3 20.9 18.7
(Source: www.equitymaster.com)
Page 16
Review of Literature
41
Sales for the company have increased over last 5 years but again the trend of
overall performance is highlighting different shades. This company has done
very well in terms of profit but the returns on assets, equity and capital have
shown fluctuations which gives rise to the heterogeneity in performance.
e. Ashok Leyland
Market Share: Commercial Vehicles 16.47%
Against the backdrop of the sharp slump in demand for commercial vehicles,
during 2008-09, Ashok Leyland registered sales of 47,118 medium and heavy
commercial vehicles (MandHCV), 37.5% less than in the previous year. This
includes 16,049 MandHCV buses and 31,069 MandHCV trucks respectively,
8.7% and 46.3% less than in the previous year.
The company lost 1.8% market share in the Indian medium and heavy
commercial vehicle market during the financial year 2008-09, mainly due to
loss of sales in the truck segment. This was because the Eastern Region, where
the Company’s presence had been historically weak, was relatively stable,
whilst the market declined sharply in other regions.
While total industry volume of the medium and heavy duty buses declined
by about 8.7%, the Company’s market share grew marginally and Ashok
Leyland retained its number one position in this segment.
The Company sold 6,812 vehicles in the overseas markets during 2008-09.
This represents a decrease of approximately 6.5% over the previous year.
Total industry volume related to overseas markets to which the Company
exports (such as Sri Lanka, the Middle East) witnessed a reduction of about
25% over the previous year.
To combat the impact of decline in CV sales, the Company focused on non-
cyclical businesses in the portfolio.
Page 17
Review of Literature
42
The Company produced in all 54,049 vehicles during the year. To contain
costs and conserve cash, the Company worked only about 50% of the working
days in all its manufacturing units during the second half of the year.
(Source: Ashok Leyland Annual Report)
A detailed look at the performance over a period of 5 years will be helpful in
understanding the heterogeneity in performance for the company.
Table 2.5 Company Performance (Ashok Leyland)
Indicator
(Million
Rs)
Mar. 2010 Mar. 2011 Mar. 2012 Mar.2013 Mar.2014
Net Sales 72,447 111,771 129,043 124,812 114,867
Total
Revenue
72,864 112,216 129,447 125,436 115,792
Gross
Profit
7,420 12,317 12,561 8,765 4,220
Profit
Before Tax
4,985 8,018 6,884 1,812 -8,210
Profit After
Tax
4,236 6,313 5,660 4,337 -1,641
Net Profit
Margin
5.8 5.6 4.4 3.5 -1.4
Current
Assets
41,397 39,838 43,039 42,965 59,892
Net fixed
assets
48,110 49,918 54,617 59,708 70,875
Sales to
asset ratio
0.8 1.1 1.1 1.0 0.7
Return on 5.4 7.7 6.9 6.2 3.7
Page 18
Review of Literature
43
Assets
Return on
Equity
11.6 15.9 13.4 9.7 -4.1
Return on
Capital
10.9 15.7 14.5 11.8 6.0
(Source: www.equitymaster.com)
Net sales for the company have increased over this period but profits have
shown a downward trend, so as the returns on asset, equity and capital. This
is indicating heterogeneity in performance on an annual basis.
f. Hero Moto Corp ( Hero Honda Motors )
Market Share: Two Wheelers 41.35%
Hero Honda or Hero Moto Corp has been the largest two wheeler company in
the world for eight consecutive years. The company crossed the 15 million
unit milestone over a 25 year span. Hero Honda sold more two wheelers than
the second, third and fourth placed two-wheeler companies put together.
As one of the world's technology leaders in the automotive sector, Honda has
been able to consistently provide technical know-how, design specifications
and RandD innovations. This has led to the development of world class, value
- for- money motorcycles and scooters for the Indian market. On its part, the
Hero Group has took the responsibility of creating world-class manufacturing
facilities with robust processes, building the supply chain, setting up an
extensive distribution networks and providing insights into the mind of the
Indian customer. Since both partners continue to focus on their respective
strengths, they have been able to complement each other. In the process, Hero
Honda is recognized today as one of the most successful joint ventures in the
world. It is therefore no surprise that there are more Hero Honda bikes on this
country's roads than the total population of some European countries. But
Page 19
Review of Literature
44
now for last few years both partners have called off their joint venture and
operate independently as two distinct companies.
Hero Honda's bikes are sold and serviced through a network of over 3500
customer touch points, comprising a mix of dealers, service centres and
stockists located across rural and urban India. Hero Honda has built two
world-class manufacturing facilities at Dharuhera and Gurgaon in Haryana,
and Hero Honda was the torchbearer for the two-wheeler industry during
2008-2009. It sold more two-wheelers during the year than the combined
volumes of the second, third and fourth placed competitor. Overall, the
company sold 3.72 million two-wheelers, growth of 12% over previous year.
Motorcycle sales in the domestic market, which account for more than 95 per
cent of Hero Honda's sales, were up by 11%. The company posted sales of
USD 2.4 billion and profits after tax of USD 256.40 million during the year
2008-2009. During the year under review, your Company exported 81,194
two-wheelers, a decline of 10%. Its third and most sophisticated
manufacturing plant at Haridwar has just completed a full year of operations.
During the year, the company also turned in a rollicking performance with its
scooter portfolio, with a 49% growth in domestic sales to 156,210 units. This
performance allowed Hero Honda to increase its share in the domestic scooter
market by more than three percentage points. Hero Honda's performance in
the two-wheeler industry was the only standout performance during the year
amongst the large players. Without Hero Honda's numbers, the two wheeler
industry growth would have been marginal.
(Source: Hero Honda Motors Annual Report 2008-2009)
A detailed look at the performance over a period of 5 years will be helpful in
understanding the heterogeneity in performance for the company.
Page 20
Review of Literature
45
Table 2.6 Company Performance (Hero Moto Corp aka Hero Honda)
Indicator
(Rs)
Mar. 2010 Mar. 2011 Mar.2012 Mar.2013 Mar. 2014
Net Sales 157,582 193,979 235,790 237,681 252,755
Total
Revenue
161,215 196,875 239,436 241,665 257,197
Gross
Profit
26,709 26,126 36,187 32,845 35,391
Profit
Before Tax
28,406 24,846 28,647 25,292 28,641
Profit After
Tax
22,319 19,279 23,781 21,182 21,027
Net Profit
Margin
14.2 9.9 10.1 8.9 8.3
Current
Assets
28,826 14,508 20,743 50,776 55,583
Net fixed
assets
17,069 41,302 38,244 31,331 31,020
Sales to
asset ratio
1.9 1.8 2.4 2.5 2.5
Return on
Assets
26.2 18.1 24.3 22.1 20.9
Return on
Equity
64.4 65.2 55.4 42.3 37.4
Return on
Capital
81.0 81.9 67.3 50.8 51.1
(Source: www.equitymaster.com)
The company has shown excellent performance as far as sales and revenues
are concerned, but as evident from the financial data contrasting results are
Page 21
Review of Literature
46
seen in profits and various returns (assets, equity and capital). Thus again
heterogeneity in overall performance is visible.
g. Bajaj Auto
Market Share: Two Wheelers 26.70%, Three Wheelers 58.60%
Bajaj Auto is ranked as the world's fourth largest two and three wheeler
manufacturer and the Bajaj brand is well-known across several countries in
Latin America, Africa, Middle East, South and South East Asia. Despite falling
demand in the motorcycle segment, the company has succeeded in
maintaining an operating EBITDA (earnings before interest, taxes,
depreciation and amortisation) margin of 13.6% of net sales and other
operating income. From 1.66 million motorcycles in 2007-2008, the company’s
domestic sales fell by 23% to 1.28 million units in 2008-2009.
Bajaj Auto is the country’s largest exporter of two- and three-wheelers.
During 2008-2009, Bajaj Auto’s international sales achieved an all-time high of
772,519 units of two and three wheelers, representing a growth of 25% over
the previous year. The growth was driven by the export of two-wheelers,
which increased by 31% over 2007-2008 to achieve sales of 633,463 units in
2008-2009. The company expanded its footprint in Africa and Middle East,
where the region’s share rose from 30% of the export business in 2007-2008 to
43% in 2008-2009. The total value of exports was USD 528 million,
representing a growth of 29%.
The company’s domestic sales of three wheelers in 2008-209 were 12% lower
compared to the previous year, and stood at 135,473 units. Exports of three
wheelers grew at 2% to 139,056 units. (Source: Bajaj Auto Annual Report)
(Source: www.imaginmor.com/automobileindustryindia.html)
A detailed look at the performance over a period of 5 years will be helpful in
understanding the heterogeneity in performance for the company.
Page 22
Review of Literature
47
Table 2.7 Company Performance (Bajaj Auto)
Indicator
(Rs)
Mar. 2010 Mar. 2011 Mar. 2012 Mar.2013 Mar.2014
Net Sales 115,431 164,291 195,947 200,420 201,583
Total
Revenue
120,941 170.081 202,031 208,391 208,401
Gross
Profit
20,535 31,816 37,651 37,301 41,552
Profit
Before Tax
24,603 36,343 42,021 43,610 46,549
Profit After
Tax
15,946 34,549 30,454 31,327 33,803
Net Profit
Margin
13.8 21.0 15.5 15.6 16.8
Current
Assets
16,113 30,632 51,854 61,816 56,244
Net fixed
assets
15,249 15,565 15,271 21,007 21,505
Sales to
asset ratio
1.7 1.8 1.8 1.6 1.3
Return on
Assets
23.2 37.8 27.6 24.8 22.1
Return on
Equity
58.7 71.9 50.1 38.8 33.2
Return on
Capital
79.9 90.3 66.2 53.5 46.7
(Source: www.equitymaster.com)
Page 23
Review of Literature
48
The company has performed well in sales and revenue but again overall
performance in terms of profits and returns has varied over a period of time
which indicates heterogeneity in performance.
2.1.2.2 Performance Heterogeneity
These detailed reviews on the performance of various players in the Indian
automobile players are clearly indicating that over the last decade as the
Automotive companies on one hand have been successful in increasing their
sales and revenues which indicate a very good market growth but if we look
at individual performances of different players on various financial
parameters then differences are clearly observed.
Companies in Automotive sector have expanded in their business, in
manufacturing and sales as well as the assets have also grown. But
profitability and various returns computed on assets, equity and capital have
fluctuated during last five years. These fluctuations highlight that
performance is not only about getting incremental sales and revenue but also
how profitability and various returns are being achieved. Analyses of these
parameters suggest heterogeneity in performance. It also visible that in
similar types of segments say, commercial vehicles, passenger’ vehicles or two
wheelers, the various parameters like net profit margins, profit before and
after tax, returns on assets, returns on equity and on capital have also suggest
that only having larger market shares alone cannot make the companies to
perform consistently well over a period of time. There have been instances
when a company having a lesser share in market was actually doing well in
terms of profits and other returns.
The body of literature reviewed has shown the dimensions of performance,
and other determinants of competitiveness of the companies in this sector but
not much has been discussed about the reasons of such heterogeneity. Most of
the reviews in Automobile sector have discussed about the success factors
and growing economics of the country but any substantial answer on the
Page 24
Review of Literature
49
question of contrasting or heterogeneous performance are not given.
Performance heterogeneity for Indian Automotive Companies is needed to be
explained on the basis strategy adopted by the companies over a period of
time.
The next section talks about performance heterogeneity in the present
scenario with a focus more on non financial parameters.
2.1.2.3 Performance heterogeneity: The Contemporary Competitive
Scenario
While reviewing the performance of Indian automotive companies and to
further elaborate on the key construct of difference in performance or
performance heterogeneity analysis of contemporary scenario becomes highly
significant. The last one year period till February 2015 the Indian automotive
sector again has shown promising trends as suggested by their sales figures.
Other than Mahindra and Mahindra, Maruti Suzuki, Hyundai Motor India,
Honda Cars India and Tata Motors all posted decent to good growth year on
year (India Sales Analysis AutoCar Pro 2015). Till January 2015 a sales growth
was observed in Indian passenger car segment of about 3.14 %.In comparison,
two-wheeler manufacturers are feeling the pressure of slowing motorcycle
sales, particularly in the rural market, and leading players have reported YoY
declines in their bike numbers. Scooter sales though continue to perform with
aplomb, giving a helping hand to overall numbers. Importantly, commercial
vehicle sales numbers for February continued to be in positive territory. The
medium and heavy commercial vehicle (MandHCV) segment that has seen an
uptick continues with double-digit growth and the LCV sector, which has
been subdued, seems to be gaining momentum as well (India Sales Analysis
AutoCar Pro 2015).
The current performance status of the following companies especially in
terms of their sales and market performance are helpful in understanding the
heterogeneity concept more comprehensively:
Page 25
Review of Literature
50
Maruti Suzuki India, the country’s largest carmaker, has recorded an 8.2
percent growth in its February 2015 sales to 107,892 units (February2014:
99,758). The Alto and Wagon R sold 39,988 units, up 7.1 percent from 37,342
units in the year-earlier period. The Swift, Dzire, Ritz and Celerio together
sold 42,778 units, up from 45,721 units, a dip of 6.4 percent. The Ciaz
premium saloon sold 5,410 units in the month, taking its aggregate sales since
its launch to just over 28,000 units.
Of Maruti’s UVs, combined sales of the Gypsy and Ertiga comprised 5,863
units, up 12 percent over year-earlier month figures. The Omni and Eeco vans
sold 11,301 units, 13.8 percent over 9,932 units in February 2014. (INDIA
SALES ANALYSIS: FEBRUARY 2015)
On the export front, Maruti Suzuki India sold a total of 10,659 units, up 14
percent year on year (February 2014: 9,346). The carmaker’s total sales for
February comprising domestic and exports totaled 118,551 units, up 8.7
percent (February 2014: 109,104).
Meanwhile, Maruti is planning to set up a new network of dealerships in
India to sell its premium models. The company plans to rope in both existing
and new dealerships for this. Over a year, it plans to open 30 to 55 new
dealerships.
Hyundai Motor India has reported domestic sales of 37,305 units in February
2015, an impressive 9.7 percent growth over sales a year ago. The new Elite
i20, once again, topped Hyundai's sales chart at 10,264 units. The Elite i20’s
sales have crossed 64,000 units in the eight months since its launch. The
company plans to launch another i20 variant, the i20 Active later on. Domestic
and export sales combined, Hyundai Motor India sold 47,612 last month
compared to 46,505 units in February 2014. Exports however took a beating,
falling 17.5 percent to 10,307 units.
Mahindra and Mahindra announced its total auto sales numbers which
stood at 38,033 units during February 2015 as against 42,166 units in February
2014, a fall of nine percent. The passenger vehicles segment (which includes
Page 26
Review of Literature
51
UVs and the Verito) sold 18,103 units in February 2015 as against 19,308 units
in February 2014, down 6.24 percent.
Tata Motors has reported strong growth in its passenger car sales. The
company’s passenger vehicle division recorded sales of 13,767 units, up 22
percent compared to 11,325 units sold in February 2014. According to a
company statement, the trend of growth in passenger vehicles continues with
strong sales of the Zest sedan and a good market response to the Bolt
hatchback. While sales of passenger cars in February 2015 were, at 11,805
units, higher by 31 percent over February 2014, UV sales declined by 15
percent at 1,962 units in February 2015. Cumulative passenger vehicle sales
for Tata over the 11-month period for the ongoing fiscal are 119,041 units,
down by 5 percent over sales in 2013-14.
Honda Cars India has recorded a 16 percent increase in sales with a February
2015 tally of 16,902 units as against 14,543 units sold in February 2014. The
popular Amaze sedan was the top-seller with 7,163 units followed by the City
which sold 6,505 units. The Mobilio MPV sold 1,697 units, the Brio 1,397 units
and the CR-V 140 units; it’s highest in a year. Since its launch in March 2013,
the Amaze has totted up sales of 138,533 units. The Brio though is seeing a
downturn. For the current fiscal (April 2014-February 2015), the small
hatchback has sold 13,344 units, down 26 percent from a year earlier when
sales were 18,044 units. For Honda, 2014-2015 is turning out to be a good year.
The carmaker has registered an overall growth of 44 percent during April
2014-February 2015 with 166,366 units sold as against 115,913 units during the
corresponding period in FY 2013 -14.
These figures are given a clear indication that how the performances have
varied with regard to their sales and market shares and the operational efforts
they put in. (INDIA SALES ANALYSIS: FEBRUARY 2015)
Evidences from the two wheeler segment further contribute in understanding
the concept of performance and its heterogeneity in the contemporary scene.
In a corporate announcement made on Bombay Stock Exchange’s (BSE)
website, India’s largest motorcycle manufacturer, Hero MotoCorp has
Page 27
Review of Literature
52
communicated that its monthly sales for February 2015 stands at 484,769 units
as against 504,181 units sold in February 2014. The company has registered a
fall of 3.85 percent YoY for this month.
However, it is known that in the near future, Hero MotoCorp is gearing up to
launch its new scooters, starting from its 110cc Honda Activa competitor,
Hero Dash, which was earlier unveiled at the Auto Expo in Greater Noida last
year. To prepare itself on the front of the production capacity of scooters, the
listed company is in the process of ramping up its capacity from 75,000-80,000
units per month to 100,000-150,000 units per month. According to sources,
this process is estimated to end by mid-2015. Hero, which has lined up a
couple of new two-wheeler launches for 2015, has been boosting its RandD
strengths over time. The company is known to have filed over 15 patents and
also has registered 77 designs in FY2013-14. These developments included the
idle start-stop switch (on the Splendor iSmart model), side-stand indicator,
integrated braking system (brake actuator primarily for scooters), fuel lid, gas
liquid separation apparatus, vehicle operation status monitoring system and
several other features. Furthermore, the company is also known to have
carried operations in the areas of new model technology absorption,
indigenization of the CKD parts, multi-source approval, meeting legislative
norms, and gearing up for future automobile regulations in India during that
financial year. (INDIA SALES ANALYSIS: FEBRUARY 2015)
This year till date has witnessed the highest domestic market share of 29
percent for Honda Motorcycle and Scooter India (HMSI). The company sold
a total of 361,493 units during the month, marking a growth of 10.05 percent
(including exports as well). HMSI’s February 2014 sales stood at 328,468 units.
However, on the motorcycle sales front, even HMSI witnessed a marginal dip
of 2.25 percent during the said month, when it sold 139,334 units (February
2014 bike sales: 142,549 units). Meanwhile, covering up for that was the
scooter vertical for the largest scooter maker in India. HMSI sold a total of
208,811 scooters during Feb 2015, marking a rise in its sales by 22.13 percent
(February 2014 scooter sales: 170,971 units).
Page 28
Review of Literature
53
Bajaj Auto sold 216,077 units (including exports) during February 2015. The
company, which marked a decline in its monthly motorcycle sales of 20.94
percent, had sold 273,323 units in February 14. In order to make up for the
declining sales, Bajaj Auto is gearing up with several new launches for the
remaining part of the calendar year, which will also include a number of
refreshes and technology upgrades in the Pulsar line-up.
TVS Motor Company, on the other hand, continues to climb with respect to
its YoY monthly sales numbers. The company has recorded a growth of 11.47
percent by selling 164,508 units in the domestic market (February 2014:
147,580 units). The company continues to see a rise in its scooter sales, which
are driving overall growth. TVS’ scooter sales grew by 35.15 percent in
February 2015, when it sold 56,750 units (February 2014: 41,990 units). The
motorcycle sales for February 2015 stood at 74,292 units, up by 18.37 percent
(February 2014: 62,762 units).
Meanwhile, Mahindra Two Wheelers has sold a total of 8,591 units during
February 2015, down a considerable 53 percent (February 2014:17,848). Of
this, the company’s domestic sales stood at 8,289 units during the month,
while exports stood at 302 units. (INDIA SALES ANALYSIS: FEBRUARY
2015) Very interestingly these reports on the performance of two wheeler
companies clearly indicate how the competitive scenario has changed in last
one year. Some major players have been outperformed. The product wise
description revel further heterogeneity and compelled the need to find
reasons for such happenings.
The discussion on contemporary performance will be incomplete without the
heavy and medium commercial vehicle segment.
The medium and heavy commercial vehicle (MandHCV) segment that has
seen an uptick continues with double-digit growth and the LCV sector, which
has been subdued, seems to be gaining momentum as well.
Tata Motors’ overall domestic CV sales increased 11 percent. The company
sold 26,547 units (February 2014:23,990). The MandHCV segment continued
to perform well for the company with a 34 percent growth, selling 12,190
Page 29
Review of Literature
54
units in February 2015 (February 2014: 9,109). Its LCVs continue to decline
albeit the fall is narrowing down to single digits at just 4 percent. In terms of
numbers, Tata Motors sold 14,357 LCVs last month (February 2014: 14,881).
Ashok Leyland’s overall sales grew 36 percent with the company selling 10,
762 units. (February- 2014-7,915 units) The MandHCV segment registered a 48
percent growth selling 8,230 units (February 2014:5,576 units). The LCVs
increased by 8 percent with 2,532 units (February 2014:2,339 units)
VE Commercial Vehicles registered nine percent growth in the month. In the
local market in the 5-tonne and above category, it sold 2,774 units (February
2014: 2, 531 units). Mahindra Trucks and Buses recorded a 21 percent increase
with sales of company sold 731 units. (February 2014:605 units).
(Source: India Sales Analysis Auto Car Pro 2015).
These product and company wise reviews throw light on the market
performance aspects. The figures and reports have highlighted on the inter -
firm performance differences. The major players in the Indian automotive
sector are exhibiting performance heterogeneity both product wise as well as
in terms on their market and financial performance. Thus In order to
understand performance and its heterogeneity the concept of competitive
advantage and its relation to performance is needed to be understood. There
are various factors which generate competitive advantage and ultimately
yield performance, thus these factors can explain how and why heterogeneity
arises in performance.
One such a stream in study of Competitive advantage and performance is the
Resource Based View of Firms which talks about the relationships between
various resources and capabilities of a company generating competitive
advantage and resulting in performance.
So there is a need to understand the concepts of competitive advantage,
resources, capabilities and the Resource Based View of Strategy.
Page 30
Review of Literature
55
Competitive Advantage and performance of firms are fundamental concepts
laying the foundations of any research in strategic management. The next
section reviews this concept to build up the base for the present study.
2.2 The Resource Based of View (RBV)
The field of Strategy Research has been for long focusing on the concept of
Competitive Advantage as intent for Strategy. Eminent researchers and
authors in the strategy domain have placed numerous discussions and
arguments in attempt to understand and build up theories explaining
competitive advantage and its sustainability. Many approaches have taken
shape in these ventures and a number of theories have been proposed and
researched. These approaches have been developed and talked about in a
number seminal literary works by authors in the field of Strategy,
Management and Economics. One such approach has been the Resources
Based View (RBV). As a theory RBV articulates the relationships between
resources, capabilities and competitive advantage of a firm. RBV attempts to
explain competitive advantage and its sustainability on the basis of
competences and capabilities developed by the firms with the availability and
deployment of resources they possess. Hence the evolution and development
of the RBV as a strategic tool is needed to be addressed so as to understand
the role played by key resources and capabilities for attaining sustained
competitive advantage, a prime avenue for research in strategy (Saxena and
Joshi 2011).
2.2.1 RBV: Evolution of Theory
The Resource based theories have evolved from the core of economics. The
theorists in this regard have urged that all profits are known as economic
rents can be attributed to the ownership of scarce resources. These resources
have been scarcity based called as Ricardian Rents or entrepreneurial known
as Schumpeterian rents. Ricardian Rents are long lived while Schumpeterian
is not. Müller-Lietzkow (2002) has argued in his paper that the resource-based
Page 31
Review of Literature
56
view theory is based on the assumption that a competitive advantage is the
result of optimal resource allocation and combination in imperfect markets.
Resources comprise of tangible and intangible assets, skills, and
organizational capabilities. But as a theory RBV origins go far back and in this
regard Barney and Arikan (2001) have suggested four sources where RBV
cultivated. These sources are referring as The Traditional study of Distinctive
competencies, Ricardian Economics, Penrosian economics and the study of
Anti- Trust implications of economics.
Talking of Distinctive Competences , authors like Herbinik and Snow (1982)
and Hit and Ireland (1985, 1986) preceded by Leonard et.al (1969) have
defined Distinctive Competences as those attributes that enable a firm to
pursue a strategy more effectively and efficiently than other firms. These
competences can become exclusive attributes for the firm possessing them,
and these competencies are understood by the resources they need.
The origins of RBV further find roots in Ricardian economics. Ricardo (1817)
has emphasized on the gifts of nature which are original, un-augmentable,
and indestructible. The concept of Economic Rent thus takes shape; an
economic rent is defined as a payment to owner of a factor of production in
excess of the minimum required to induce that factor into employment as
(Hirshleifer 1980). These factors of production are considered to be perfectly
inelastic as their quantity of supply is fixed and they do not respond to price
changes. Thus it is possible for a firm to own higher quality factors of
production and yield economic rents.
Further going ahead in our discussion for the origins of RBV, one more
economic approach has reinforced the development of RBV as a theory; this is
the Penrose contribution to the field of economics and management. Edith
Penrose (1959) had an objective to understand the process of a firm’s growth
and the limits of growth. Penrose had an assumption that firms can be
appropriately modeled as if they were relatively simple production functions.
According to Penrose a manager has a task to exploit the bundle of
Page 32
Review of Literature
57
productive resources controlled by the firm through the use of administrative
framework created in the firm, so as to generate advantage.
And finally as a field of study, the social policy implications of economic
theories has been an interest area for many researchers. Social Policy is
guided in the area of Anti Trust Regulations. The approach to social welfare
and anti- trust has developed into “structure- conduct- performance” (SCP)
paradigm (Bain, 1956). The SCP paradigm suggest that the structure of a
firm’s industry defines the range of activities that a firm can engage in – so
called “conduct”- and in turn, the performance of the firm. Thus these sources
for the origin of RBV have been attempting to elaborate discussions on
competitive advantage yielding performance.
Taking a deeper look into the development of RBV as a theory, Briger
Wernerfelt (1984) had a seminal work done in exploring the usefulness of
analyzing firm from the resource side rather than the product side. Wernerfelt
has developed some simple economic tools for analyzing a firm’s resource
position and to look at some strategic options suggested in this analysis. He
further defines firm’s resources as those tangible and intangible assets which
are tied semi permanently to the firms. Talking on same lines Robert M Grant
(1991) have similar views. According to Grant the resources and capabilities
of a firm are central considerations in strategy formulation; resources are also
termed as primary sources for profitability of firms. Grant has view that the
resource based approach to strategy formulation is based on the
comprehension of the relationships between resources, capabilities,
competitive advantage and profitability and to understand how the
competitive advantage can be sustained over time. Grant further argues to
identify the resource gaps and develop a resource base for the firm. Grant also
focuses on filling of resource gaps by exploiting resources to extend positions
of competitive advantage and broaden the firm’s strategic opportunities.
Sustaining the advantageous situations requires constant development of
resource bases.
Page 33
Review of Literature
58
2.2.2 RBV (The VRIN concept) and types of resources
Talking of strategy; as field of research, there has been always a quest for
understanding competitive advantage and its sustainability. In order to
understand the sources of competitive advantage, Jay Barney (1991) examines
the linkage between firm resources and sustained competitive advantage.
Barney assumes that strategic resources are heterogeneously distributed
across firms and these differences are stable over a period of time. This paper
has produced discussions on four empirical indicators of the potential of firm
resources to generate sustained competitive advantage. These indicators are
value, rareness, imitability and substitutability. Barney (1991) defines firm
resources as all assets, capabilities, organizational processes, firm attribute,
knowledge, information and so on, controlled by a firm enabling it to
conceive and implement strategies that can improve efficiency and
effectiveness. Firm resources are classified as Physical Capital Resources,
Human Capital Resources and Organizational Capital Resources. But not all
the three capital resources are strategically relevant. There are certain
attributes of resources that enable firms to conceive and implement strategies
that improve effectiveness and efficiency. Barney further defines competitive
advantage and sustained competitive advantage in terms of the inability of
current and potential competitors to duplicate strategy implemented by the
firm. Barney (1991) has attempted to build up a theoretical model to
understand sustained competitive advantage with an assumption that firm
resources may be heterogeneous and immobile. To have a potential of
sustained competitive advantage a resource should be Valuable to exploit
opportunities or neutralize threats in an environment, it should be Rare in the
current and potential competition, the resource should be imperfectly imitable
and there should not be any strategically equivalent substitutes for these
resources. The firm resource model of sustained competitive advantage has
been examined for its implications in other business applications also. Also it
is essential to understand the economics of resource based view of
competitive advantage and its sustainability.
Page 34
Review of Literature
59
The economics of resource based view has been explained by Margret A
Peteraf (1993). Her work is an attempt to develop a model of resources and
firm performance. The model takes into consideration four conditions which
should be satisfied so as to sustain competitive advantage. These conditions
are defined as: Resource Heterogeneity which will generate monopoly rents
or Ricardian rents; Ex Post Limits to Competition which are essential for
sustaining these rents; Imperfect resource Mobility for ensuring that theses
rents are bounded with the firm and shared by it; Ex Ante Limits to
Competition preventing cost from offsetting the rents. Peteraf further argues
that firms having heterogeneity in resources and capabilities compete in the
market and at least break even. Firms with marginal resources only breakeven
but firms with superior resources earn rents. The firms earning such rents will
be efficient and they will sustain their competitive advantage if such superior
resources are not expanding freely or imitated by other firms. For the
sustenance of competitive advantage it is necessary to preserve the
heterogeneity. This can be done by ex post limits to competition. The
Resource based theories have emphasized on two critical factors to limit ex
post competition; imperfect inimitability and imperfect substitutability of
resources. Further Peteraf talks about Imperfect mobility of resources. If
resources are perfectly immobile they are not tradable. But imperfect mobility
of resources means the resources are tradable but are more valuable for the
firm which is currently holding them. Such resources are more firm specific in
nature. And finally Peteraf addresses ex ante limits to competition which
means that before a firm establishes a superior resource position, there must
be limited competition for that position. These four conditions have been
termed as cornerstones of competitive advantage by Peteraf (1993). And the
framework developed by Peteraf reinforces the four attributes of resources as
a source of sustained competitive advantage defined by Barney (1991).
Barney (1986a) has introduced the concept of strategic factor market in one of
his works. A strategic factor market is a market where firms acquire or
Page 35
Review of Literature
60
develop the resources needed for implementing product market strategies. He
argues that if the strategic factor markets are perfectly competitive, the
acquisition of resources in those markets will anticipate the performance of
those resources while implementing product market strategies. Further he
emphasizes that if strategic factor markets are perfectly competitive and if
firms are successful in implementing strategies creating imperfect competitive
product markets, such strategies are not a source of economic rents. Barney
(1986a) suggests that the sources of economic rents will be those resources
which are in control of the firm rather than those which will be acquired from
external sources. These due to the fact that resources already under the
control of firms were acquired in previous strategic factor market where the
price was a function of the expected value of these resources in that market.
But if the firm finds new ways for utilizing the resources for implementing
product market strategies, then such new resource would not have been
anticipated in the original factor market and can become a source of economic
rent.
These reviews have been addressing the development of resource based
concepts and views for firms and their strategy. It is evident that concepts of
economics, management and strategy go hand in hand when talking about
the Resource Based Theories.
Further talking of fundamentals of RBV, David N. Ford (1998) has proposed
the Operationalization of RBV, which talks about formalizing the theoretical
concepts into applicable models to facilitate strategy formulation and decision
making process. Again the quest is to understand the sources of sustained
competitive advantage. The operationalization of RBV leads to resource based
strategy implementation. Ford (1998) has operationalized RBV in five steps
with three levels of analysis; the firm’s environment, the firm and the
resources. The five step methodology for operationalization comprise of:
Listing the Valuable Resources; sketching the resource charts; draw key
Page 36
Review of Literature
61
resource maps; identify resource strategic plans and managerial policies; and
develop system models. But this operationalization faces challenges in
quantifying intangible resources. Operationalization helps in explaining how
RBV theory can be developed and implemented rather than what RBV theory
should consists of. According to Ford (1998) system dynamics plays an
important role in operationailzation process.
Adriana Mohd. Rizal (2011) has proposed the construction of resource base.
Most of the existing literature has focused the kinds of resources needed for
competitive advantage. Rizal has discussed about most of the literature on
RBV. She further talks about the construction of resource base. The
construction of resource base is defined as a series of resource development
activities whereby initial resources are strategically constructed and unique
capabilities are developed to gain competitive advantage and long term
profitability. Rizal concludes that theories that address construction of
resource base are needed to determine the origins of firm heterogeneity, in an
attempt to understand how initial resources are constructed and managed
into unique and valuable resources gaining competitive advantage.
These discussions and arguments are being placed as an opening note for
understanding the resource based theories in pursuit of explaining
competitive advantage. Further reviews in this regard attempt to explain
competitive advantage being sourced from resource based theories.
2.2.3 RBV: Explanation for Performance and Competitive Advantage
As a theory RBV has made explanations in establishing relationships between
resources, capabilities and competitive advantage. RBV has taken a firm as a
strategic business unit (SBU) to explain a firm’s competitiveness and
advantages it gains. These thoughts can be elaborated in order to understand
performance heterogeneity which is the soul of the present study.
The dominant paradigm in strategic management until the 1990’s was that
business management was determined by the appeal of the sectors in which
Page 37
Review of Literature
62
company was competing and by competitive position of the company in those
sectors (Rumelt, 1991; McGahan and Porter, 1999, 2002; Wiggins and Ruefli,
2002). But in recent years the analysis of firm’s competitive advantage from an
intra organizational perspective according to its own capabilities has made
the targeting of business strategies easier (Priem and Butler, 2001; Ray et al,
2004). From an RBV perspective the firm is regarded as a unit; a single,
organized group of heterogeneous assets created, developed, renewed,
evolved, and improved with passage of time. The performance variations
between firms can be explained by the heterogeneity in assets (Lopez, 2005).
RBV gives special attention to study the factors that cause these differences to
persists (Grant 1991; Mahoney and Pandiyan, 1992; Amit and Schoemaker,
1993; Barney, 2001). But it does not analyze their causes or the process which
determines these factors; increasingly an essential aspect of analysis in
dynamic environment. The diverse nature of resources is an essential element
in the development of economic activity and also plays a key role in the
evolution of technology and organizational structures. The logical response to
this question pertains in a new kind of organizational capability; the capacity
for self renewal of resources, routines, capabilities and core competencies
(Collis, 1994). This has paved the way for a new asset or highest order,
naturally dynamic process; the capacity to learn within the organizations
(individual learning) and about the organizations themselves (organizational
learning) (Teece et al. 1997; Zollo and Winter, 2002).
In this way, dynamic capabilities are formed as a subgroup of the firm’s
capabilities, allowing creation of new products and processes, permitting the
company to respond to changing external conditions which can be
advantageous, yielding high performance. Performance heterogeneity thus
becomes the key issue to be addressed. Resources based models have been
utilized by strategy thinkers in these regards. Views and thoughts have been
established to address performance and its heterogeneity.
Page 38
Review of Literature
63
RBV has emerged as a model of business unit performance, tracing back to
the economic theory of firm growth (Penrose, 1959) arguing that firms who
possess competencies and capabilities to best exploit those competencies
would be rewarded with highest levels of growth and profitability. Day (1990,
1994) has argued that a strategic business unit (SBU) can gain competitive
advantages by developing the capabilities by which it can exploit its
competencies. However this acceptance has been controversial (Priem and
Butler, 2001). But the RBV has been described as a dominant model to explain
differences among firms (Hoopes et al, 2003). An SBU’s capabilities are
deeply rooted in routines and practices so are generally hard for competitors
to imitate and, as a result, the SBU developing appropriate capabilities can
establish sustainable competitive advantage and maximizes its growth and
performance (Dierckx and Cool, 1989; Hoopes et al, 2003). The relationship
between resources and capabilities is the basis of RBV (DeSarbo, Benedetto
and Song, 2007).
According to Helfat and Peteraf (2003), heterogeneity of capabilities and
resources in a population of firms is one of the cornerstones of RBV (Peteraf
1993; Hoopes et al, 2003). RBV has explained competitive heterogeneity as an
enduring and systematic performance difference among close rivals (Hoopes
et al 2003; Peteraf and Bergen, 2003). Even the closest of rivals possess unique
bundle of resources and capabilities (Barney, 1986; Wernerfelt, 1984; Peteraf,
1993). But sustained competitive advantage is gained by some of the resources
and capabilities, having differential effects on actual performance.
To be a source of advantage, a resource or a capability must be valuable (it
can enable the SBU to improve its relative market position), rare (in short
supply, or rare in terms of resource functionality), and isolated from imitation
or substitution (immobile or costly to replicate) (Peteraf, 1993; Peteraf and
Bergen, 2003; Hoopes et al, 2003). Since, SBU will differ in terms of their
possession of resources and capabilities that lead to sustainable advantage, as
well as their differential utilization and effectiveness, their long term
Page 39
Review of Literature
64
performance will differ as well. These interrelationships between firm
capabilities, environmental factors, and strategic types have been investigated
(DeSabro et al, 2006; Song et al, 2007).
According to RBV to gain full advantage of resources, an SBU must possess
capabilities, defined as bundles of skills and knowledge, so that the SBU can
deploy its competences and coordinate its activities in such a way as to create
sustainable competitive advantage (Lippman and Rumelt, 1982, 1984; Barney,
1986; Day, 1990). According to Makadok (2001), a resource is an observable
asset that can be valued and traded. A capability is not observable, cannot be
valued, and changes hands as only part of entire unit. Capabilities may be
valuable in and of themselves, while others may be valuable mostly due to
their ability to increase the value of other SBU resources (Tripsas 1997,
Hoopes et al, 2003).
As these capabilities are difficult for competitors to imitate, they lead to long –
term competitive advantage and performance (Dierckx and Cool, 1989;
Hoopes et al, 2003; Peteraf and Bergen, 2003; Lippman and Rumelt, 2003).
SBUs with similar competencies then may not perform equally due to
differences in their capabilities (Hitt and Ireland, 1986; Day and Wenslay,
1988; Peteraf, 1993; Amit and Schoemakar, 1993; Peteraf and Bergen, 2003;
Hansen et al, 2004). Since capabilities are difficult to imitate or substitute, it
also follows that the SBU that most successfully cultivates these capabilities
outperforms its competitors in the long run (Hitt and Ireland, 1986; Hunt and
Morgan, 1995; Peteraf and Bergan, 2003; Hansen et al, 2004).
Thus the RBV literature focuses on competitive advantage rooted in
developing key resources and capabilities that are different.
2.2.4 RBV: VRIO Framework
The organizational existence has been explained on the basis of internal assets
that are valuable, rare, and inimitable having an organizational focus (VRIO)
(Barney, 1991, 1998, 2002; Ray, Barney, Muhanna, 2004; Duncan, Ginter and
Page 40
Review of Literature
65
Swayne 1998; Charkraborty, 1997). Organizational focus refers to integrated
and aligned managerial practices, routines and processes. It also refers to the
managerial leadership and decisions that support key assets in terms of their
development and sustenance. An organizations formal processes and
production functions are the backbones which support the strategic assets;
organizations protect their assets through business practices (Jugdev, 2005).
The focus of present study is on understanding the relationship between
resources, capabilities, competitive advantage and performance. The RBV
literature is enriched with a number contributions which have thrown light
the empirical relationships between resources, capabilities, competitive
advantage and performance, their review can generate insights for building a
conceptual framework for our study. The analyses done in these literary
works have led to various outcomes depicting the relationships between firm
resources, competitive advantage and performance.
2.2.5 Relationship between Resources, Competitive Advantage and
Performance
The relationship under debate is studied by DeSarbo, Beneditto and Song
(2007). Their paper seeks to explore the relationships between
resources/capabilities and performance by explicitly modeling the
heterogeneity of such relations across firms in various different industries in
exploring the interrelationships between capabilities and performance. The
authors have taken a sample of 216 US firms and they have developed a latent
structure regression model to provide a discrete representation of
heterogeneity in terms of different cluster or groups of firms. In order to
understand the relationships the firms are considered as Strategic Business
Units (SBU). The analysis finds that the derived four group latent structure
regression solution statistically dominates the one aggregate sample
regression function. The authors talk about five capabilities which were
explicitly measured on an 11 point scale and validated in previous studies.
These are: Market Linking Capabilities, Technological Capabilities, Marketing
Page 41
Review of Literature
66
Capabilities, Information Technology Capabilities and Management
Capabilities. Model proposed is able to discern the sources of managerial
heterogeneity among the firms in the sample. And three different possible
sources of managerial heterogeneity have been identified. The authors have
found that the four derived groups differed in terms of their profitability
performance; consequently capabilities were closely related to performance.
Yet significant differences across the firms in terms of their actual capabilities
were not found (DeSabro, Beneditto and Song 2007).
DeSarbo et al (2006) in another study have also devised a constrained finite-
mixture structural-equation methodology and empirically derived a four
group, “mixed-type” strategic typology. This methodology allowed them to
capture the nature of heterogeneity among the firm capability and
performance variables due to the estimation of a series of nested models.
DeSarbo et al (2005) identified association between capabilities, strategies,
performance and strategy types. The study of 2006 extends the prior findings
by suggesting that strategic decision making by SBUs is context dependent:
different capabilities lead to improved profit performance for different
strategic types. This is in line with the expectations of the RBV. Thus, for
different strategic types, different capabilities will be tied to performance.
Empirical researches have been done on RBV in order to investigate the
relationships between resource/capabilities and competitive advantage.
Arguments have been placed for determining the resources which can lead to
competitive advantage.
One such study has been put by Jeremy Galbreath and Peter Galvin (2004).
They have proposed a fine grained test of RBV, to determine the resources
which matter to the firm. Conceptually Authors talk about two fundamental
categories of resources: Tangible and Intangible. Tangible resources are those
which have recorded accounting values in the Balance sheet, such as physical
or financial assets, while intangible are those which are non physical or non
Page 42
Review of Literature
67
financial in nature, these are capabilities. Authors argue that as a rare
exception only intangible resources are examined in RBV research as
intangibles are viewed as only sources of competitive advantage by some
authors. According to Galbreath many scholars claim that intangible
resources can explain performance heterogeneity among firms. But this
argument only holds true if the effects of intangible resources are analyzed
after simultaneously accounting the effects of tangible resources. It has been
attempted empirically. A sample of 1000 manufacturing firms and 1000
service firms were taken from Australia. Resources and Performance were
measured as constructs while the age of the firm was chosen as control
variable along with Porter’s five force industry structure. A Psychometric
evaluation of the constructs was done and various relationships between
resources and firm performance were done using multiple hierarchical
regression analysis. The Galbreath and Galvin (2004) study concluded that
some intangible resources do account for significant effects on performance
after accounting for the tangible resources and hence these intangibles are
valuable, rare, inimitable and no substitutable (VRIN), but not in all expected
prediction. Galbreath and Galvin(2004) argues that strength of some
resources are dependent on interactions or combination with other resources
so no single resource can became important for firm performance.
On similar thoughts Gautam Ray, Jay Barney and Waleed Muhanna (2004)
have presented a seminal work for choosing the Dependent variable in the
Empirical Test of RBV. Authors talk about Capabilities, Business Processes
and Competitive Advantage. The authors argue that in some situations
adopting the effectiveness of business processes as a dependent variable may
be more appropriate than adopting overall firm performance. For testing this
idea the determinants of effectiveness of customer service business process in
a sample of North American Insurance Companies were examined. The
Authors define Business Processes as actions that firms engage in
accomplishing some business purpose or objective. The authors then explain
the effect of multiple business processes on the firm performance; adopting
Page 43
Review of Literature
68
the effectiveness of business processes as dependent variable is due to the fact
that a firm may excel in some business processes, can be average in others and
below average in still others. A firm’s overall performance depends on the net
effect of these business processes on a fir’s position in the market. Various
business processes can have varying effects on overall firm performance.
Aggregating the outcomes of numerous processes makes it very difficult to
examine whether a particular set of resources and capabilities can generate
competitive advantage. Another reason explained by the authors for adopting
effectiveness of business processes as dependent variable in resource based
research is that it is possible for stakeholders of the firm’s to appropriate the
economic profits that can be generated by business processes, before they are
reflected in overall profitability. This would be helpful for researchers to
examine how wealth of the stakeholders get affected by competitive
advantage. This information can be used to determine the size of economic
profit generated by firms. However it is difficult to measure (Coff 1999). The
authors further explain the reason for considering effectiveness of business
processes as dependent variable because business processes are the ways by
which a firm’s resources and capabilities are realized as competitive potential.
Resources can only be the source of competitive advantage if they are
exploited through business processes.
Taking in to consideration all these perspectives Ray, Barney and Muhanna
(2004) empirically analyzed the performance of the customer service process
in the life and insurance segments of insurance industry in North America.
Combined samples of 800 companies were taken and data were obtained
from 104 firms. Four resources and capabilities were suggested from previous
researches which influence the performance of customer service performance;
they are Service Climate, Managerial Information Technology Knowledge,
Technology Resources and Investments. The hypotheses based on these
attributes were tested using Structured Equation Modeling; models were
estimated for five measures of competitive service performance
independently. Another model was estimated that examines the
Page 44
Review of Literature
69
relationships between four independent variable and firm performance
measured in terms of returns on assets (Ray, Barney and Muhanna 2004).
Reviews till now have indicated that the existing literature on RBV has more
focused on conceptual issues trying to build up theories for creation and
sustainability of competitive advantage with the utilization of resources and
generation of capabilities. The relationships studied are also more
theoretically supported rather than empirical investigations of the constructs
like resources, capabilities, competencies, competitive advantage and firm
performance.
2.2.6Applications of Resource Based Theory
The RBV as a theory has been operationally defined and tested by applying
the theory to the major US film studios from 1936 to 1965. This work has been
done by Danny Miller and Jamal Shamsie (1996). They have proposed
Resource based view of the firm in Two Environments. The two environments
are time based as one is an era from 1936 to 1950 which was a stable,
predictable environment and the financial performance of these studios was
stable as there were property based resources in the form of long term
contracts with the stars and theaters. While the era from 1951 to 1965 had a
changing and unpredictable environment where the financial performance
was boosted due to Knowledge based resources in the form of production and
coordinative talents and budgets. The nature of resources has been discussed
and the conceptual framework defines Property based and Knowledge based
resources. The study of Miller and Shamsi (1996) shows that both property
based and knowledge based resources that are hard to buy or imitate
contribute to performance, return on sales, operating profits and market
share. But the environmental context is most important in conditioning these
relationships. The authors conclude that whether or not an asset can he
considered a resource will depend as much on the context enveloping an
organization as on the properties of the asset itself.
Page 45
Review of Literature
70
In the pursuit of reviewing the applications of RBV, John Mills, Ken Platts and
Michael Bourne (2003) have presented a work on applying resource based
theory to determine Methods, outcomes and utility for managers. The paper
has described research on resources that underlie a manufacturing company’s
service competence in its most established product group. The authors have
referred to the extensive literature on RBV critically and have developed and
tested improvement in the identification and assessment of resources based
on existing theory. Resource identification can be done using Top Down or
Bottom-Up approaches. But the bottom-up approach leads to more reliable
data for the managers. The authors talk about various resource identification
methods used by various researchers. Similarly resource evaluation is done
with the help of VRIN characteristics; also sustainability and versatility have
been used as facet for resource evaluation. A historical representation of the
firm’s activities in its service provision over more than 10 years have been
used to assess the value and sustainability of the resources identified. The
methods for resource analysis have been discussed from three perspectives,
appropriateness, resource data generated and apparent utility for managers.
Continuing our review journey on application of RBV, Gerhard Kristandl and
Nick Bontis (2007) have used the resource based view of firm to construct
definition for Intangibles derived from RBV. Intangibles are defined as a
subset of corporate resources. The paper has tested various definitions of
intangibles against the RBV framework. The authors claim that RBV and
Intangibles can be positioned in natural hierarchy since the Intangibles
connect to company’s strategy and both contribute to sustained corporate
performance and competitive advantage. This done with interactions of
assets and capabilities, and the capabilities transform the assets into outputs
of increased value. According to RBV the resources having VRIN
characteristics are intangibles. The paper finds that most of the definitions of
intangibles in the existing literatures synchronize with RBV and thus a
common definition for intangibles can be proposed.
Page 46
Review of Literature
71
As an application of the Resource based view of strategy, Stuart Orr (2007)
proposes the RBV application to the Agricultural Industry. The study is done
on Australian Floral Industry. Research was conducted to produce
generalisable data and constructs for RBV. Orr (2007) has view that despite
the RBV's successful application to research in a number of discipline areas
and the formalization of its relationship with Competitive Advantage (CA),
the empirical support for the benefit of the RBV and development of research
constructs has been inadequate. The industry under study is well bounded
with several strongly differentiating resources and operates in a global market
environment, which is necessary for research objectives. The research
determined that organizations in the Australian floral industry possessed
important resources which were categorized as geography, skills, technology,
RandD, supply chains and production cost controls. These resulted in four
production outputs that created competitive advantage - product quality,
production capacity, production reliability and customer convenience. The
research also identified interrelatedness between production outputs, but not
resources. It was also identified that one resource could contribute to a
number of competitive advantage creating production outputs.
The Resource based perspectives have also been instrumental in resourcing
Corporate Environmental Strategies. Frances Bowen and Sanjay Sharma
(2005) have presented this idea in the work. The authors refereeing to
literature have argued that corporate environmental strategies involve
mobilization of unique bundles of resources and capabilities (Hart 1995;
Sharma and Vrendenburg 1998), such as employees, environmental
championing skills, corporate strategic planning process, stakeholder
management, continuous innovation and search for talent and technology.
The authors also talk about behavioral perspectives facilitating corporate
environmental strategies by a search using generic, slack resources dependent
on managerial discretions and interpretations of environmental issues
(Sharma, 2000; Sharma, Pablo, and Vrendenburg, 1999). The paper draws out
Page 47
Review of Literature
72
from both the perspectives that the type of resource most useful for
developing and implementing a corporate environmental strategy is likely to
be dependent upon the characteristics of that strategy. A categorization of
resources is done on the basis of their degree of complexity, tacitness and
specificity. The RBV is expanded by explicitly recognizing the potential utility
of available slack, downplayed in the view’s focus on specific, competitively
valuable resources. The behavioral aspect is explained by the commitment of
strategic resources, capability bundles, dynamic capabilities or some non -
competitively valuable resource, rather than their availability. The authors
conclude that a firm’s feasible corporate environmental strategy choices are at
least partly determined by their resource endowments.
The Resource based view also finds significant applications in Operations
Strategy research. Stephane Gagnon (1999) in a work has argued that the
operations strategy research should integrate theories from resource based
view. The author in this paper has done some extensive literature review and
has identified some key issues that may become the basis of a New Resource –
Based Operations Strategy. The RBV will help the operations to reach up to
the leadership of strategy, ensuring that firm’s resources, capabilities and
competencies are effectively used as competitive weapon. The author has a
view that the RBV offers a number of lessons in the management of
capabilities under hyper competitive conditions, providing rules to develop,
protect and leverage resources in a dynamic manner. And the resource based
view may help the operations strategy to better integrate the sources of
strategic advantage within a coherent portfolio of optional capabilities, this
will be helpful in overcoming the failures in the implementation of world
class practices. Gagnon (1999) concludes that as a new paradigm operation
strategy emerges tracing back to operational roots of management
fundamentals, a new integrated research agenda could emerge between areas
of operation strategy and resource based strategy. The resource-based view
may help refocus operations strategy making as a truly creative and future
Page 48
Review of Literature
73
oriented activity, geared toward integrating and building new strategic
advantages through learning and operational regeneration (Tranfield and
Smith, 1998).
The RBV as theory has contributed to a number of applications and consistent
a subject of research. The theory is well grounded in industrial economics and
has been developed by multiple contributions by management authors. But
this body of knowledge has also found a lot of confusions, ambiguity,
conceptual and empirical difficulties. In this regard John Fahy (2000) in his
work talks a capability driven perspective of RBV and addresses some
stumbling blocks on the road to understand sustainable competitive
advantage.
The paper provides an integrated view of the RBV in an effort to eliminate
ambiguities caused by weak taxonomies and the inconsistent and conflicting
use of terminology. The paper is an attempt to provide insights into RBV and
its contribution to the nature of competitive advantage (Fahy, 2000). The
author argues that the desired outcome of managerial efforts within the firm
is sustainable competitive advantage (SCA). The achievement of SCA leads a
firm to gain above average returns or economic rents. According to RBV key
resources having characteristics of value, barriers to duplication and
appropriability should be possessed by the firm. Fahy (2000) argues that
essential elements of RBV comprise of: sustainable competitive advantage and
superior performance; the characteristics and types of advantage generating
resources; and strategic choices made by management. Fahy (2000) further
explains that the persistence of resource heterogeneity is central for attaining
sustained superior returns; the process is not automatic and requires the
moderating interventions of managerial choices in the identification,
development, protection and subsequent deployment of resources in product
markets. From the resource based perspective, firms exist because of the
opportunities to benefit from efficiencies created by asset interdependencies
Page 49
Review of Literature
74
within the firm. Fahy (2000) concludes by discussing a number research
avenues opening up in RBV by referring to the literature.
These reviews have presented RBV as an effective tool for comprehending the
prime constructs in strategy research; the competitive advantage. These
literary works have taken evidences and illustrations from different
organizations who been striving hard for high degree of performance and
sustaining the advantages they are gaining. Yet the literature is focused on
explaining the various relationships qualitatively and resulting into theory
developments. The expressions of the relationships between resources,
capabilities, competitive advantage and performance have got a
comparatively lesser quantitative treatments. Measurements of performance
along with the measures of competitive advantage and its persistence with a
view of resources and capabilities require more work to be done. Thus a
number of research avenues are opened and the literary works discussed
have threads and strings open to weave further researches.
In this regard Dovev Lavie (2006) has presented an extension of resource
based view to study the competitive advantage of interconnected firms.
Model distinguishes shared resources from non shared resources; identifies
new types of rent; and illustrates how firm-, relation-, and partner-specific
factors determine the contribution of network resources to the rents extracted
from alliance networks. After reassessing the heterogeneity, imperfect
mobility, imitability, and substitutability conditions, Lavie (2006) urges that
the nature of relationships may matter more than the nature of resources in
networked environments. The model proposed by Lavie (2006) overcomes the
limitation of traditional RBV, focusing on resources that are owned or
controlled by single firm. The model incorporates network resources that play
a role in evolution of alliance networks and shaping the competitive
advantage of interconnected firms.
Page 50
Review of Literature
75
As per Black and Boal (1994) the resource-based view (RBV) of the firm holds
that certain assets with certain characteristics will lead to sustainable
competitive advantage. All the traits are required to be present to result in
sustainable competitive advantage. Such a trait approach overlooks the
dynamics of the creation of firm resources especially the strategically
important factors as identified by the resource based view theory. According
to Black and Boal (1994) resources are made up of factor networks which have
specific inter factor and inter-resource relationships that result in the
characteristic traits being evidenced. These strategic resource factor
relationships include network type, available substitutes and cogency
relationships (compensatory, enhancing and suppressing). Specific
configurations that lead to high or very high support of sustainable
competitive advantage are proposed. Twenty-two specific paths to
sustainable competitive advantage for a factor, contingent on resource factor
traits and relationship configurations, are proposed.
These reviews exhibiting the extensive application of RBV concept in strategy
research is instrumental in placing the RBV theory to understand the
performance heterogeneity issues in Indian automotive companies and the
concept of competitive advantage. Thus RBV is a suitable approach for the
present study done in Indian conditions and business scenario, as the various
applications discussed have exhibited the role of RBV in explaining
performance in changing environments from a stable and predictable to
unstable one(Jamal and Shamsi 1996); RBV playing role in determining the
methods, outcomes and utility for managers along with approaches to
identify resources as per VRIN characteristics(Mills, Platts and Bourn 2003);
the significance of intangibles in connection with company strategy, corporate
performance and competitive advantage (Kristandl and Bontis 2007); the
formalization of RBV with competitive advantage in an industry operating
global market environments possessing important resources (Orr 2007); or the
resource based view being instrumental in resourcing corporate
environmental strategies involving mobilization of unique bundles of
Page 51
Review of Literature
76
resources and capabilities and behavioral perspectives (Bowen and Sharma
2005); or the significant applications of RBV in formulating operations
strategy, resources and capabilities effectively being used as competitive
weapon, the resource based perspective being helpful in making the
operations strategy more creative and future oriented, building new
advantages (Gagnon 1998, Tranfield and Smith 1999).
Such variety of applicability and explanations for competitive advantage, its
sustenance and performance of firms addressed by RBV distinguish it from
other strategy research approaches and hence resource based view is treated
as central consideration and approach, and is adopted for the present study.
2.2.7 RBV: Critical Appraisals
In this comprehensive review we come across an interesting critical appraisal
of RBV done by Lockett, Thompson and Morgenstern 2009, they examine the
RBV in terms of theory, method, empirical evidence and practical insights. As
per Lockett et al 2009, The RBV has developed as a series of related
propositions that seek to explain the relationship between a firm’s resource
endowment and its performance and growth. However, it has not generated
clear unambiguous hypotheses in the manner of more narrowly conceived
theories of firm behaviour or even transaction cost economics (TCE), an
approach with which the RBV is frequently compared. The paper discusses
the practical difficulties arising in the RBV methodologies. The first issue is of
tautology (Prime and Butler 2001). According to Prime and Butler 2001, only
valuable and rare resources are the source of competitive advantage, where
rarity and value in turn depend upon the use to which such resources may be
put. More generally, they argue that the problem of tautology lies in the
relationship between the general and the specific in the RBV. Competitive
advantage is considered to be rooted in firm-specific circumstances that are
themselves, at least in part, imperfectly observable.
Secondly, for any empirical assessment of RBV, its predictions require the
identification and measurement of relevant resources. But this is not easy as
Page 52
Review of Literature
77
the resources of central concern are often those associated with organizational
learning etc. and are commonly unobservable (Ambrosini and Bowman 2001;
Godfrey and Hill 1995; Rouse and Daellenbach 1999).
Third, firm heterogeneity creates problems for researchers who are interested
in generating a homogeneous sample of firms for testing specific RBV
hypotheses.
Fourth, identifying and explaining causal relationships in large firms is
problematic. The sheer complexity of large organizations makes it very
difficult to isolate the performance effects of specific resources.
Fifth, not merely is agreement on a working definition of ‘competitive
advantage’ itself controversial (Foss and Knudsen 2003; Powell 2001), but
such a concept is directly unobservable so that empirical tests normally
involve seeking to explain inter-firm differences in performance (Peteraf and
Barney 2003) with respect to observable differences in the firms’ identifiable
resource endowments.
Sixth, the logic of the RBV does not predict a universal relationship between
firm performance and any particular resource. On the contrary, the value of a
resource to the firm will depend upon the specifics of its use, including the
deployment of co specialized assets. Therefore, even at the industry level,
there may be no discernible relationship between firm performance and the
possession of resource X (Lockett, Thompson and Morgenstern 2009). Lockett
et al 2009 have further urged that much of the empirical work this field still
tends to use single equation, cross sectional design, raising problem of
causality.
This review strongly reinforces the need to for the present study and the
analysis carried out as the model developed and tested will be able to put
reasonable explanations on these issues.
Continuing with discussion on Empirical Research in RBV Stuart Orr 2011 has
also made a critical appraisal on RBV theory. Orr (2011) has taken a
substantial literature support and has emphasized the problems faced while
Page 53
Review of Literature
78
working with RBV. As per Orr 2011, Selection of the correct empirical
research methodology to enable the identification of specific resources
meeting Barney's criteria and separation of the contributions of these
resources to CA, has proven to be one of the difficulties associated with
empirical research into the RBV (Lockett et al 2009). Orr 2009 further
elaborates from the literature that the theory does not adequately consider
how organizations establish the resources to create CA (Mathews 2002). Such
resources must also be very difficult to attain in the first place (Miller 2003)
and may be explained by linkage, resource leverage and learning (Mathews
2002).
The literature also suggest that Industries need to be very homogenous to
enable fair comparisons to be made across organizations, and resources can
be difficult to identify as many are intangible (Fahy 2000, Lopez 2001, Riahi-
Belkaoui 2003, Arend 2006). The very best resources will be hardest to identify
(Fahy 2000). The literature suggests that such resources need to be identified
using qualitative methods (Rouse – Dallenbach 1999).
Further critics to RBV is also found in literature as the VRIN and VIRO
framework by Barney (1991 and1996) do not provide a strong measure of the
potential for performance, as even resources which are relatively weak still
correlate with sustained superior performance (Arend and Lavesque 2010).
This may be partially due to limited attention being given to date to the
selection of the correct output variables. Further development of the
constructs representing the impact of CA is required for investigation of the
RBV (Orr 2011).
Thus in a way the review also provide insights to the problems encountered
by researchers while dealing with RBV theory. This opens up the avenues to
test the theories on empirical grounds thus making the concept very potent
for significant research contributions.
Page 54
Review of Literature
79
2.2.8 Summarizing RBV Literature
The literature on RBV has emphasized on developing key resources and
capabilities that are different. The VRIO framework is defined in reference to
organizational processes and production functions. But having a
comprehensive look to the studies carried on from last three decades, it is
observed that the arguments posed are in reference to developed economies.
The concepts of RBV have been dealing with organizations in general pertain
to any sort of industry. These studies have a base of business firms of diverse
nature. The research locations have been the countries which are industrially
developed and highly automated. These concepts are still to be applied on
developing economies like India. The literature provides comprehensive
theory building of fundamental concepts of competitive advantage, core
competences, distinctive capabilities, resources of heterogeneous natures,
economic rents, sustained competitive advantages and so on. These
fundamental concepts have been worked upon by various researchers in a
generalized sense and any evidences or illustrations which been talked are
not from developing economies especially India. The literature has talked of
various characteristic applications of RBV in understanding the creation and
sustenance of competitive advantage ultimately leading to firm performance.
The performance heterogeneity has been addressed in these literary analyses,
yet a substantial work can be done regarding the relationship between
resources, capabilities, competitive advantage and performance to explain the
heterogeneity. The heterogeneity in resources have led to competitive
advantage, characteristics of resources and development of capabilities have
resulted in the persistence of this advantage and thus all the papers talking in
this regard have contributed in building up the theories. These theories are
now to be utilized to develop and establish relationship between resources,
competitive advantage and performance in a context specific and industry
specific scenario. The body of literature till now will be the ingredient in
shaping up the design for the present research study. Also the literature will
Page 55
Review of Literature
80
guide the difficulties faced and gaps emerged in research studies of such
nature.
While reviewing the RBV literature Competitive Advantage as a concept has
been comprehensively used in the discussion to understand performance
heterogeneity, hence as a construct Competitive Advantage is to be
understood in detail.
2.3 Competitive Advantage
The concept of Competitive Advantage has been extensively treated in
Strategic Management literature. Fundamentally Competitive Advantage is
elusive, and researchers are still involved in deriving a clear definition. Many
researchers have a consensus that a firm has competitive advantage over
other firms in the same business as it offers something valuable to the
customers which cannot be given by the competitor firms (Fahy and Smithee
1999). Jay Barney (1991) has urged that competitive advantage can be gained
if the firm’s current strategy creates value and is not being implemented by
any competitor at present or in future. Day and Wensley (1988) have focused
on two categorical sources involved in creating competitive advantage:
superior skills and superior resources (Hoffmann 2000).
2.3.1 Generation of Competitive Advantage
Porter (1980, 1985) developed the concepts of cost leadership and
differentiation relative to competitors as two important sources of competitive
advantage. A firm can use aggressive pricing and high sales volumes in a low
cost position, whereas differentiated product creates brand loyalty and
positive reputation, facilitating premium pricing, thus can generate
competitive advantage.
Competitive advantage can also be secured by making an early entry and on a
large scale rather than an incremental scale (Ghemawat 1986, Lieberman and
Montgomery 1988). Any firm making an early move or large scale move can
preempt competitors by setting new standards or gaining access to critical
Page 56
Review of Literature
81
raw materials, locations, production capacity, or customers. Preemptive
commitments enable firms to gain a strong focus and dominate a particular
niche, either through lower costs, differentiated products or both (Ghemawat
1986; Porter 1980).
Hemal and Prahalad (1989, 1994) emphasized on profitability in the present
and growth in medium terms and also on future position and source of
competitive advantage. Thus a lot of thoughts have been proposed in order to
conceptualize competitive advantage.
Competitive Advantage leads to performance provided a firm sustains its
competitive advantage. A firm can attain sustained competitive advantage
when it implements a strategy which creates value and also no other
competitor is implementing such strategy, neither the benefits of such a
strategy are duplicated, Barney (1991). He suggests that not all firm resources
hold the potential of sustainable competitive advantage; instead there are four
attributes to it: rareness, value, inability to imitate and inability to be
substituted.
Hunt and Morgan (1995) have a proposition of categorizing potential
resources as financial, physical, legal, human, organizational, informational
and relational. In this regard Prahalad and Hamel (1990) suggest that firms
combine their resources and skills into core competencies, loosely defined as
that which a firm does distinctively well in relations to competitors. Therefore
firms may succeed to establish a sustained competitive advantage by
combining skills and resources in unique and enduring ways.
Strategic Management researchers have also understood that competitive
advantage and its sustainability depends on the match between distinctive
internal capabilities and changing external conditions or the organizational
capabilities and environment (Andrews 1971; Chandlar 1962; Hofer and
Schandel 1978; Penrose 1959).
Page 57
Review of Literature
82
2.3.2 Sources of Sustained Competitive Advantage
Hao Ma (1999) has urged that competitive advantage arises from the
differential among firms along any dimension of firm attributes and
characteristics that allow one firm to better create customer value than do
others. Generic sources of competitive advantage include ownership of assets
or position, access to distribution and supply, proficiency – knowledge and
competence and capability in business operations. To achieve and sustain
competitive advantage a firm needs to exploit these sources creatively and
proactively; with preemption of rival’s efforts and to pursue any combination
of proactive and preemptive efforts (Hao Ma 1999).
The fundamental basis of long-run success of a firm is the achievement and
maintenance of a sustainable competitive advantage. A competitive
advantage can result either from implementing a value-creating strategy not
simultaneously being employed by current or prospective competitors or
through superior execution of the same strategy as competitors (Bharadwaj,
Varadarajan, and Fahy 1993).
Strategic Management literature has been enriched with a number of
contributions by eminent authors addressing competitive advantage and its
sustainability.
Alderson (1965) has talked about three bases for differential advantage:
technological, legal and geographical. There are four strategies for achieving
advantage: segmentation, selective appeals, transvection, and differentiation.
Coyne (1986) proposed that in order to possess a sustainable competitive
advantage, consumers must perceive some difference between a firm’s
product offerings and the competitors’ offerings. This difference must be due
to some resource capability that the firm possesses and competitors do not
possess. Also, this difference must be some product/delivery attribute that is
a positive key buying criterion for the market (Coyne 1986). The key is being
able to predict the actions of others in the industry over time; by matching the
Page 58
Review of Literature
83
firm’s resources to the gaps and voids that exist in the industry, a CA can be
created. This advantage is sustained if competitors either cannot or will not
take action to close the gap (Coyne 1986).
As per Hamel and Prahalad (1990) a sustainable competitive advantage
results from core competencies; firms should consolidate resources and skills
into competencies that allow them to adapt quickly to changing
opportunities.
Day and Nedungadi (1994) have a view that a firm’s use of strategy and
reaction to the environment depends on its orientation towards customers or
competitors; competitive advantage is based on this orientation.
In order to understand achievement of sustained competitive advantage
Shrivastava, Shervani and Fahey (1998) have classified market based assets
into two primary types: relational and intellectual. Intangible assets may be
leveraged to achieve sustainable competitive advantage if they can add
unique value for customers (Shrivastava, Shervani and Fahey 1998).
Relational market-based assets are those that reflect bonds between a firm and
its customers and/or channel members. While an intellectual market-based
asset would be the detailed knowledge that firm employees possess
concerning their customers’ needs, tastes, and preferences. Both types are
intangible and employ an outward focus on firm customers and channel
members (Shrivastava, Shervani and Fahey 1998).
Firms may succeed in establishing Sustainable Competitive Advantage by
combining skills and resources in unique and enduring ways. By combining
resources in this manner, firms can focus on collectively learning how to
coordinate all employees’ efforts in order to facilitate growth of specific core
competencies (Hoffmann 2000).
Hoffmann (2000) also defines Sustainable Competitive Advantage as the
prolonged benefit of implementing some unique value-creating strategy not
Page 59
Review of Literature
84
simultaneously being implemented by any current or potential competitors
along with the inability to duplicate the benefits of this strategy.
This definition has been coined while comprehending the various literary
contributions in work.
The literature also talks about inter organizational competitive advantage.
Dyer and Singh (1998) have urged that an increasingly important unit of
analysis for understanding competitive advantage is the relationship between
firms and identify four potential sources of inter organizational competitive
advantage: (1) relation-specific assets, (2) knowledge-sharing routines, (3)
complementary resources/capabilities, and (4) effective governance. Dyer
and Singh (1998) have emphasized that a pair or network of firms can develop
relationships that result in sustained competitive advantage. Competition
between single firms, while per-haps still the rule, is becoming less universal,
as pairs and networks of allied firms have be-gun to compete against each
other.
It is evident from the above discussions that understanding the sources for
sustained competitive advantage for firm has been a major area in strategic
management (Porter 1985, Rumalt 1984). J. Barney (1991) summarizes on the
framework developed in the decades of 60’s and 70’s and suggests that firms
obtain sustained competitive advantage by implementing strategies which
exploit their internal strengths, by responding to the external opportunities,
while neutralizing external threats and avoiding internal weaknesses. Most of
the researches on sources of sustained competitive advantage have focused on
isolating a firm’s opportunities and threats (Porter 1980, 1985), describing its
strength and weaknesses (Hofer and Schendel 1978; Penrose 1958;
Stinchcombe 1965), or analyzing how these are matched to choose strategies
(Barney 1991).
Barney (1991) further throws light on the research carried by Porter and his
colleagues as an attempt to describe the environmental conditions that favor
Page 60
Review of Literature
85
high levels of firm performance. Porte’s (1980) five force model describes the
attributes of industry attractiveness and suggests that opportunities will be
greater and threats are less in such industries.
As discussed earlier Barney (1991) has defined competitive advantage and
sustained competitive advantage. As per Barney (1991) a firm will have
competitive advantage when it is implementing a value creating strategy not
simultaneously being implemented by any current or potential competitors;
further a firm will have sustained competitive advantage when it implements
a value creating strategy not simultaneously being implemented by current or
potential competitor and the other firms are unable to duplicate the benefits
of this strategy. Barney (1991) further has an argument that these definitions
do not focus on a firm’s competitive position. Also a firm’s competition is
assumed to include not only current competitors but also potential
competitors that may enter on any future date. Barney (1991) urges that the
definition of sustained competitive advantage does not depend on the period
of calendar time during which a firm enjoys a competitive advantage. Some
authors like (Jacobsen 1988, Porter 1985) have suggested that a competitive
advantage that lasts for a longer duration of calendar time can be termed as
sustained competitive advantage.
Adding to the ongoing discussion on competitive advantage and its
sustainability Roy Lubit (2001) explores how companies can best grow their
knowledge resources to create not simply competitive advantage but
sustained competitive advantage. According to Lubit (2001) there are two
paths by which companies can use knowledge to create sustained competitive
advantage. First, the companies can act to internally spread knowledge that
other companies will find almost impossible to copy, it is tacit knowledge.
Secondly companies can create superior knowledge management capabilities
and foster ongoing innovation (Lubit 2001).
It is evident from the above discussions that Competitive Advantage and its
sustainability has been prime research avenue in Strategic management
Page 61
Review of Literature
86
research. Authors have dealt with a number of approaches to address
competitive advantage and in this pursuit a variety of sources for sustained
competitive advantage have been suggested. There have been differences in
opinions and thoughts as evident from the works of Porter, Barney and other
eminent authors who have consistently provided inputs for the development
of new constructs which can explain competitive advantage and its
sustainability either in regard to the external environment of the firm or its
internal strength and weaknesses. Competitive Advantage as a construct has
been explained on the basis of value creating strategies, core competencies,
dynamic capabilities, knowledge based capabilities and resources, firm
resources, cost leadership, differentiated products and so on.
As per the need of the present study the relationship of competitive
advantage with resources is to be established in order to understand
performance of the firm. Thus in depths review of the literature for strategy,
resources and relationships with competitive advantage and its sustainability
is essential. These reviews will generate the insights to the building blocks
and foundations of relationships to be talked in this study.
To sum up the discussions till now on the reviewed literature, understanding
is built up on the concept of competitive advantage by various strategic
thinkers who have defined the same on the basis of strategies generating
values, superior skills and superior resources which are valuable, rareness,
inimitability and inability to be substituted. The resources and skills combine
into core competences and thus sustained competitive advantage can be
attained. Cost leadership and differentiation have been developed as sources
of competitive advantage. It has been understood that competitive advantage
depends on the match of internal capabilities and external circumstances. The
theory of RBV has been developed in order to understand competitive
advantage ultimately leading to firm performance. Many discussions have
been raised to answer the fundamental question of strategy research:
outperformance of other firms by some in the same business. And thus many
Page 62
Review of Literature
87
arguments have been raised in this regard. The performance variations have
explained in terms of resource heterogeneity. Utilization of RBV concept has
been done to understand relationships between resource, capabilities and
performance. Also resources and capabilities have been explained in terms of
SBUs and the difference in performance of these SBUs.
2.4 Conclusion and Research Gaps
The Indian literature on Automotive Industry has dealt comprehensively in
studying the nature of the sector, the growth aspects in pre and post
liberalization era, competitiveness in terms of native and foreign enterprises,
technological advancements, the utilization of various productivity measures,
economic reforms and so on; but any conceptual work regarding the
competitive advantage gained by firms in India with view of resources and
capabilities are not visible. The common approaches to strategy and its types
are evident in these works. Most of the studies on Indian scenario are based
on general observations, surveys and trends prevalent in the pre and post
liberalization era. But again nothing substantial is available with regards to
the study of competitive advantage yielding performance. The present study
focuses on the question of outperformance of firms by others in the same
business in terms of resource and capability utilizations. But most of the
literature available is not describing this basic theme of this study. There is
need to conceptually design a theory which explains the dynamics of
relationships between resources, capabilities and competitive advantage so
that heterogeneity in performance for the Indian Automotive companies can
be explained. There is need for analyzing the relationship between
competitive advantage and performance illustrated in a segment which has
seen drastic changes, which can be cultivated into a model depicting the
relations between resources, capabilities, competitive advantage ultimately
yielding performance with a resource based view of strategy, which is the
central theme of the present research study.
Page 63
Review of Literature
88
The Review up till now has giving a plateform on which the design of the
present research is taking shape. The constructs which are being used and
elaborated to develop desired relationship between resources, capabilities,
competitive advantage and performance have been defined and debated.
Evidence and illustrations from the literature are useful in setting up the need
and pattern of the present study. Empirical investigation is need of the hour
for the desired relationship in the context of Indian Automotive Companies.
A model to represent these relationships is will be taking shape with the
progress of empirical analyses of the data collected in regards of identifying
the resources, capabilities, and competitive advantage for the Indian
Automotive sector.
The body knowledge which is taking shape with the progress of the present
study is an attempt to generate insights to strategy research with a deeper
view to the resource based approach developing up in a theory on Indian
context, which portrays an industrial landscape which is consistently and
rapidly advancing and the study is based on a sector which is booming
consistently.
The study aims to make Resource based approach a more comprehensive in
the Indian strategy research and for practitioners a more useful tool to
identify, analyze and utilize resources and build up capabilities creating a
difference to have competitive advantage that can be reflected in final
performance. And hence Resource based theories due to their focus and
orientations become an appropriate approach for this study.