72
Chapter 3 Consumer Behavior
Chapter 3
Consumer Behavior
Consumer Behavior
Chapter 3: Consumer Behavior Slide 2
Consumer Behavior
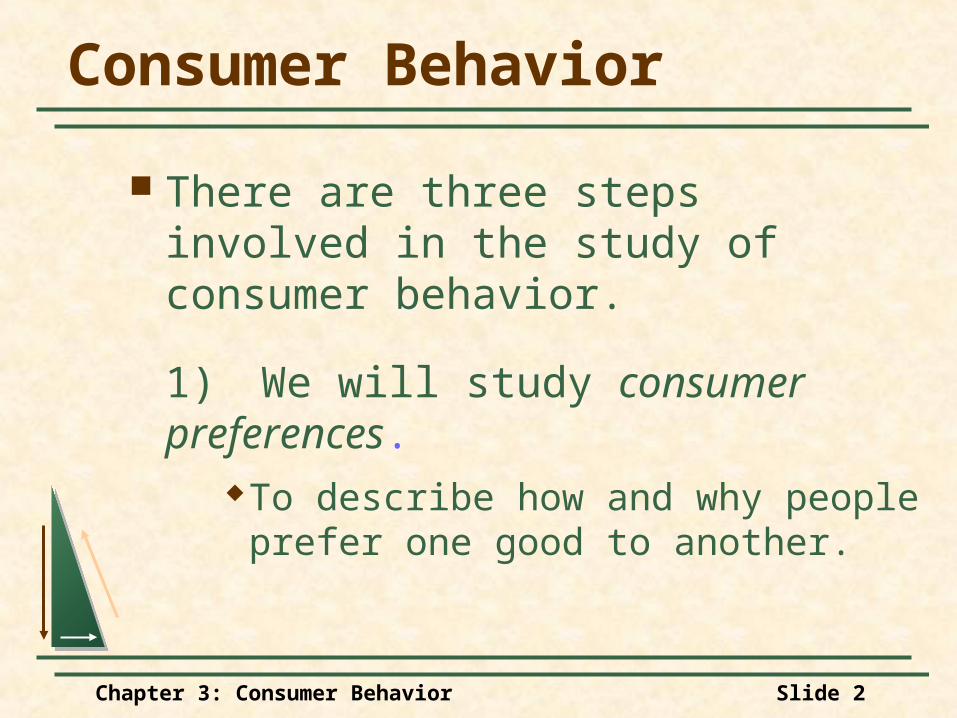
There are three steps involved in the study of consumer behavior.
1) We will study consumer preferences.
To describe how and why people prefer one good to another.
Chapter 3: Consumer Behavior Slide 3
Consumer Behavior
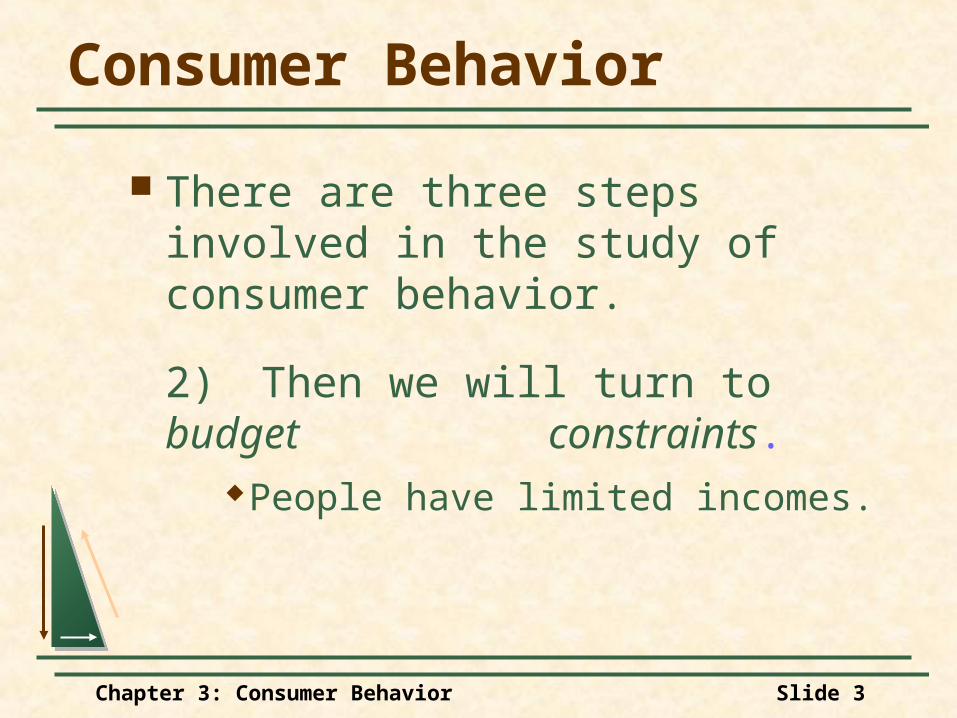
There are three steps involved in the study of consumer behavior.
2) Then we will turn to budget constraints.
People have limited incomes.
Chapter 3: Consumer Behavior Slide 4
Consumer Behavior
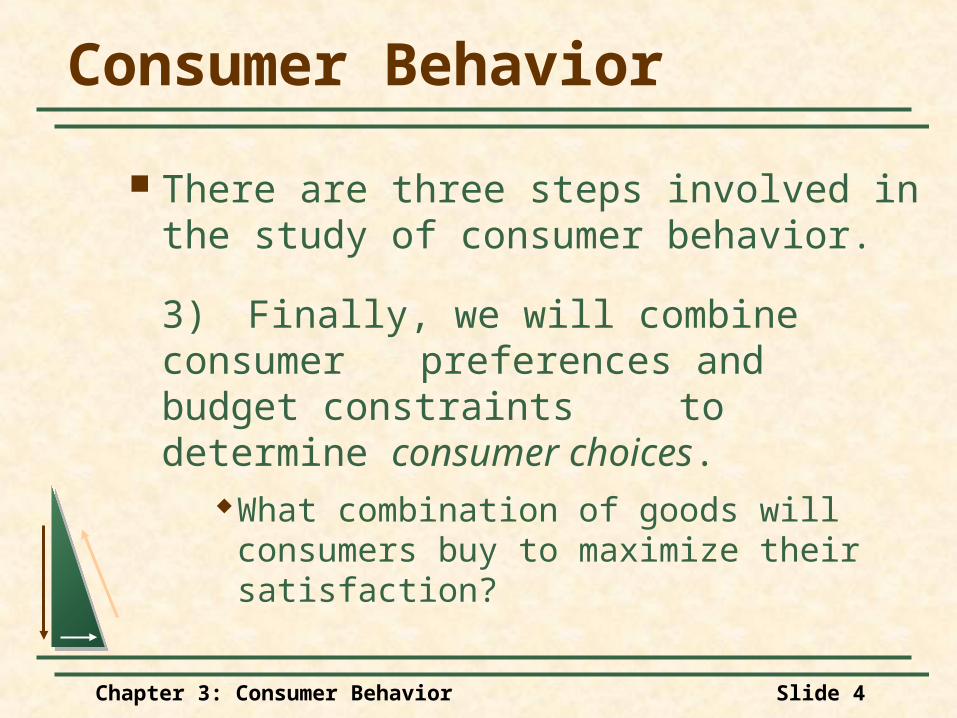
There are three steps involved in the study of consumer behavior.
3) Finally, we will combine consumer preferences and budget constraints to determine consumer choices.
What combination of goods will consumers buy to maximize their satisfaction?
Chapter 3: Consumer Behavior Slide 5
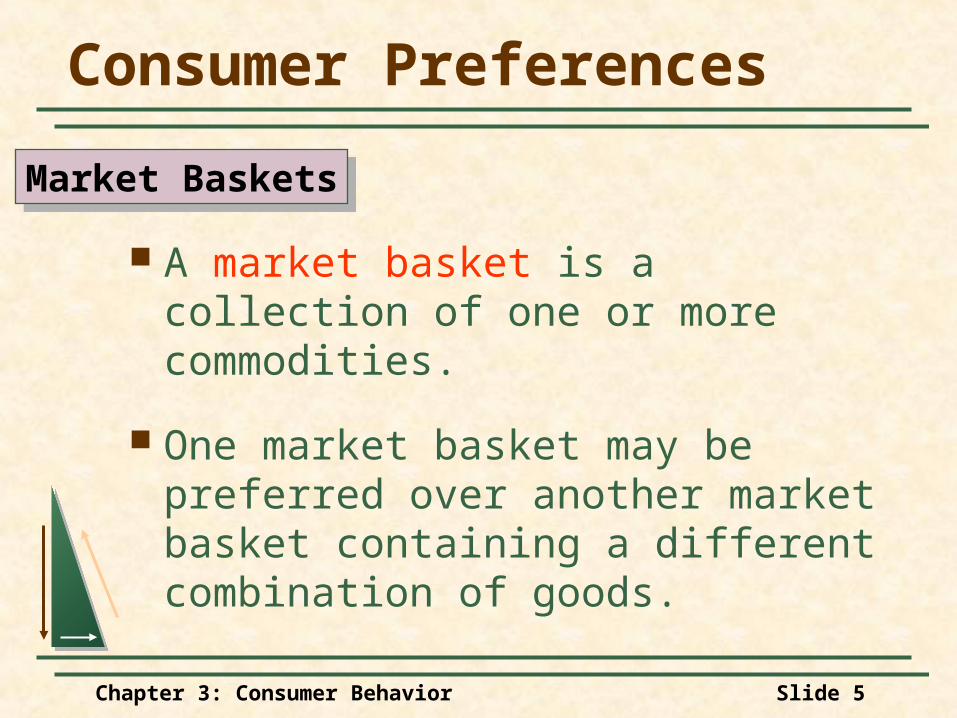
Consumer Preferences
A market basket is a collection of one or more commodities.
One market basket may be preferred over another market basket containing a different combination of goods.
Market BasketsMarket Baskets
Chapter 3: Consumer Behavior Slide 6
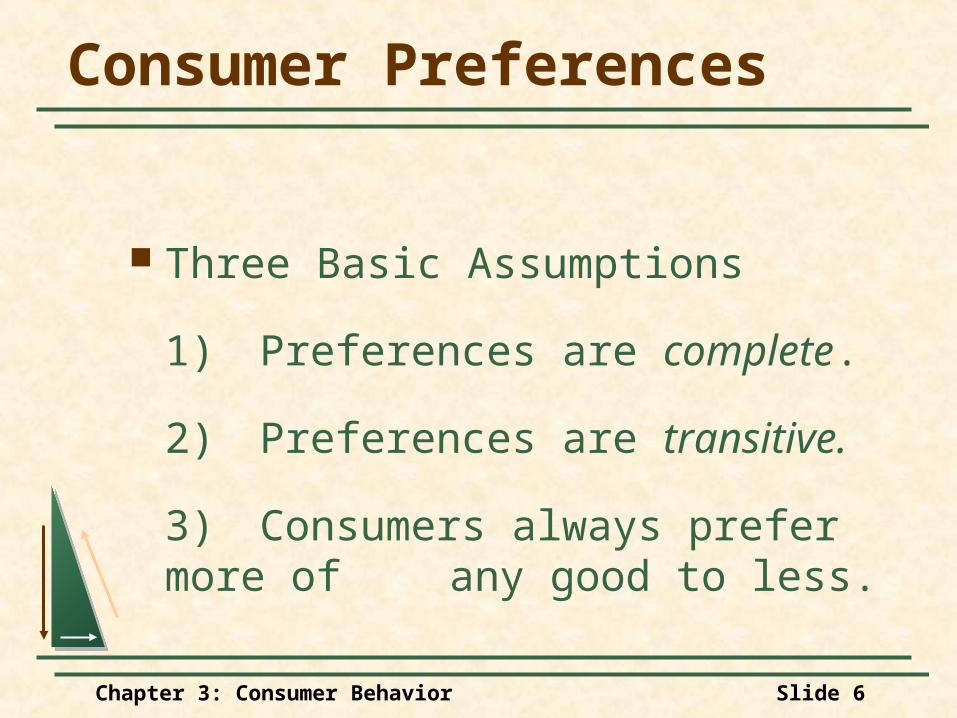
Consumer Preferences
Three Basic Assumptions
1) Preferences are complete.
2) Preferences are transitive.
3) Consumers always prefer more of any good to less.
Chapter 3: Consumer Behavior Slide 7
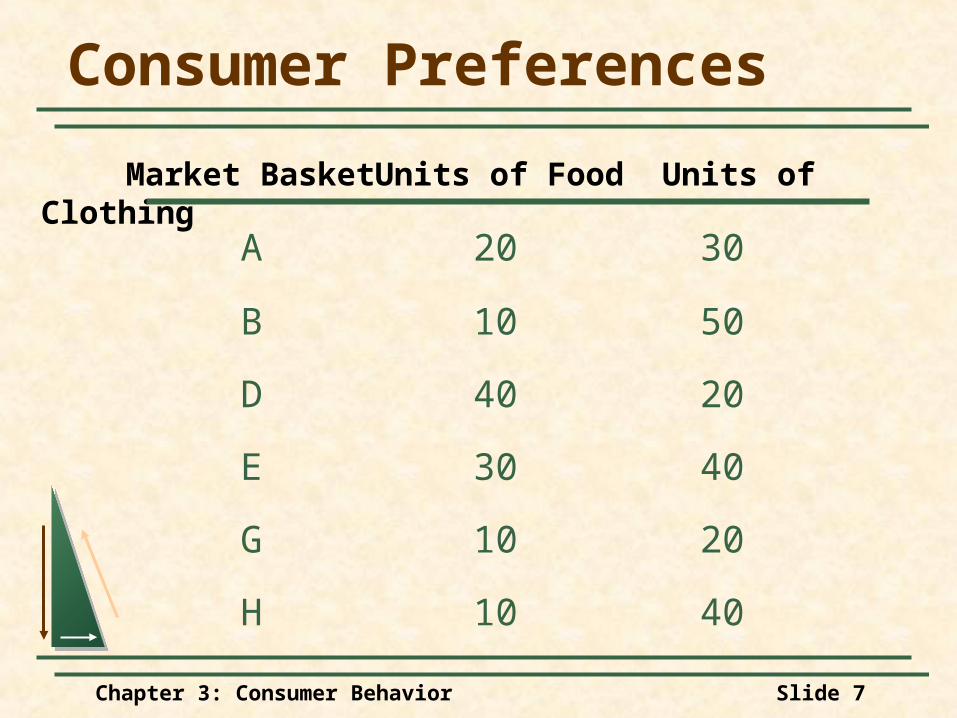
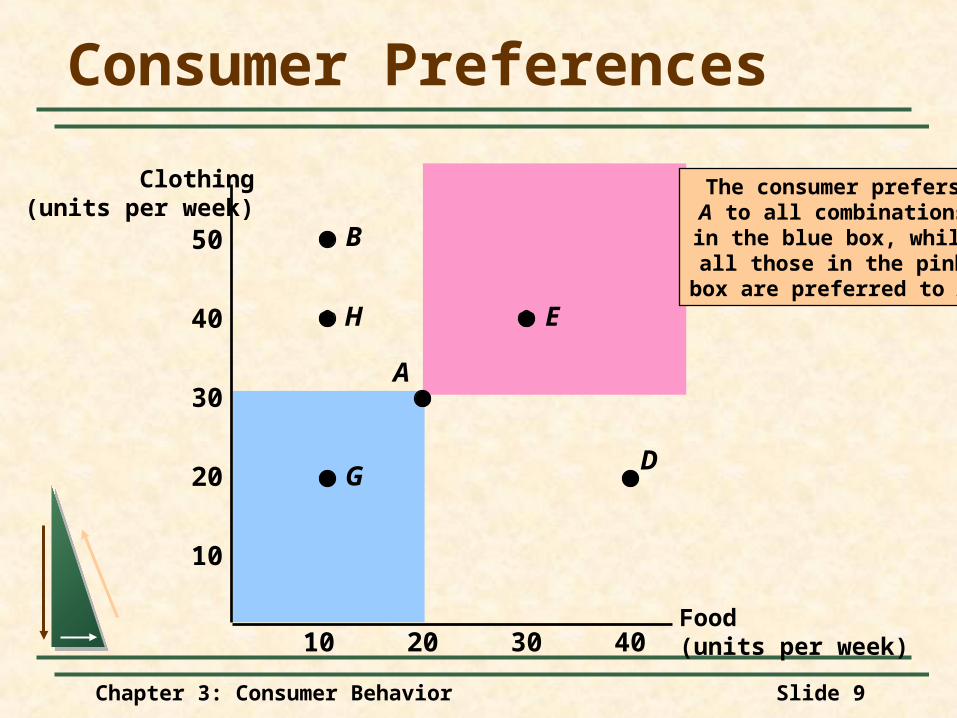
Consumer Preferences
A 20 30
B 10 50
D 40 20
E 30 40
G 10 20
H 10 40
Market Basket Units of Food Units of Clothing
Chapter 3: Consumer Behavior Slide 8
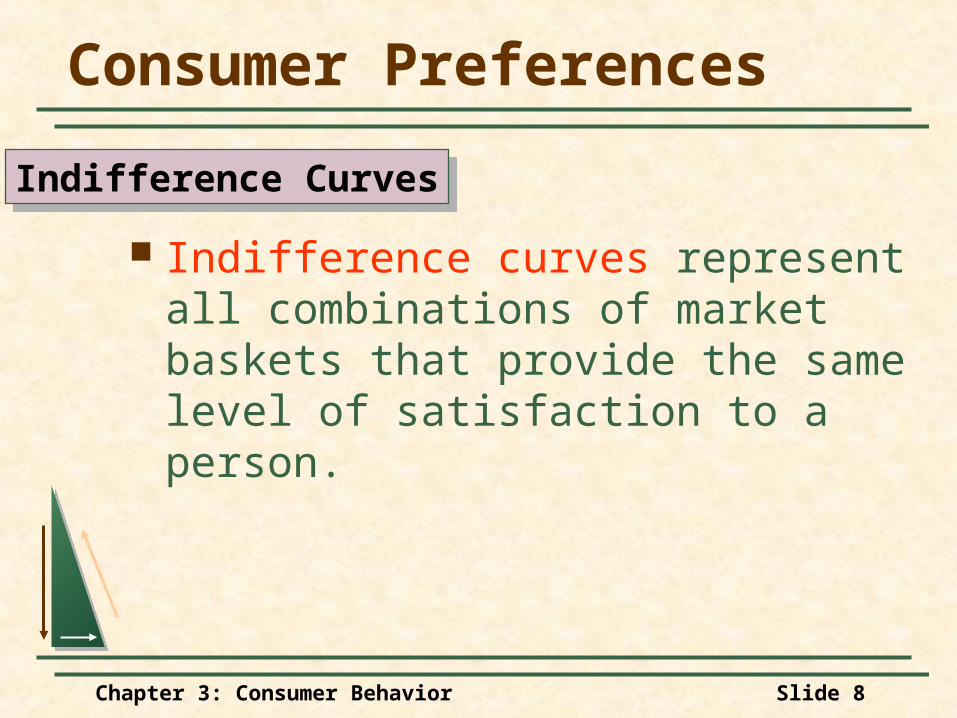
Consumer Preferences
Indifference curves represent all combinations of market baskets that provide the same level of satisfaction to a person.
Indifference CurvesIndifference Curves
Chapter 3: Consumer Behavior Slide 9
The consumer prefersA to all combinationsin the blue box, whileall those in the pink
box are preferred to A.
Consumer Preferences
Food(units per week)
10
20
30
40
10 20 30 40
Clothing(units per week)
50
G
A
EH
B
D
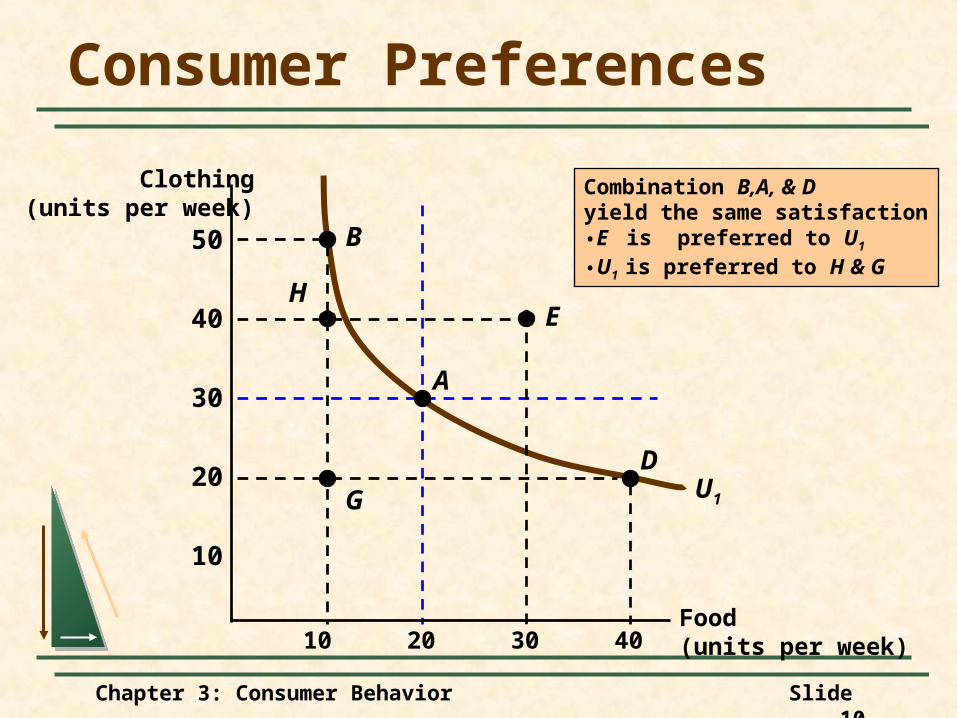
Chapter 3: Consumer Behavior Slide 10
U1
Combination B,A, & Dyield the same satisfaction•E is preferred to U1
•U1 is preferred to H & G
Consumer Preferences
Food(units per week)
10
20
30
40
10 20 30 40
Clothing(units per week)
50
G
D
A
EH
B
Chapter 3: Consumer Behavior Slide 11
U2
U3
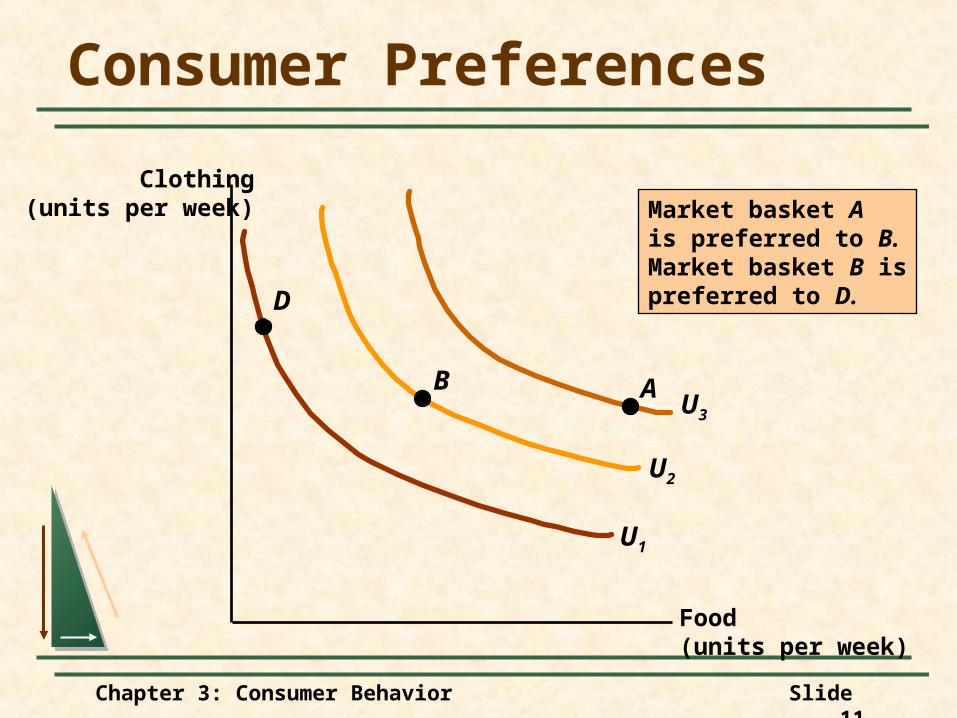
Consumer Preferences
Food(units per week)
Clothing(units per week)
U1
AB
D
Market basket Ais preferred to B.Market basket B ispreferred to D.
Chapter 3: Consumer Behavior Slide 12
U1U2
Consumer Preferences
Food(units per week)
Clothing(units per week)
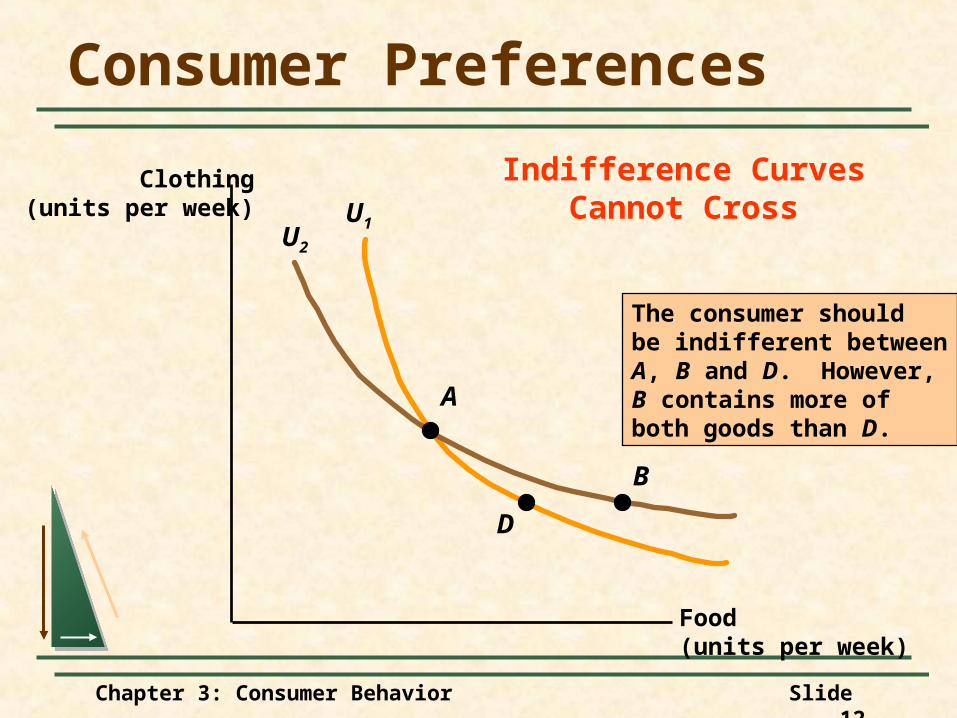
A
D
B
The consumer shouldbe indifferent betweenA, B and D. However,B contains more ofboth goods than D.
Indifference CurvesCannot Cross
Chapter 3: Consumer Behavior Slide 13
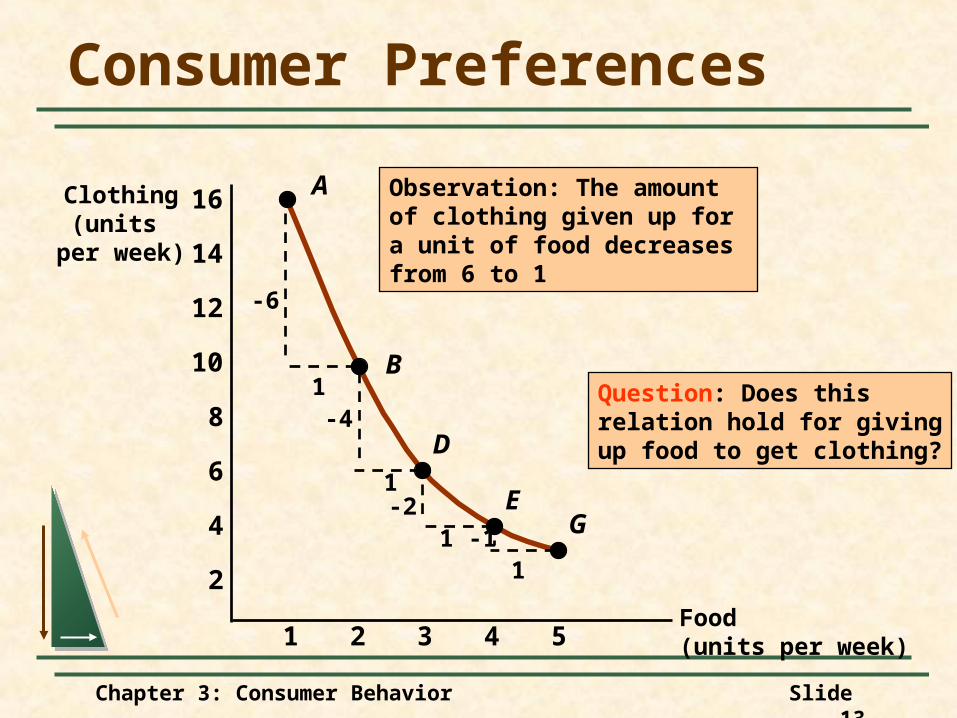
A
B
D
EG-1
-6
1
1
-4
-21
1
Observation: The amountof clothing given up for a unit of food decreasesfrom 6 to 1
Consumer Preferences
Food(units per week)
Clothing(units
per week)
2 3 4 51
2
4
6
8
10
12
14
16
Question: Does thisrelation hold for givingup food to get clothing?
Chapter 3: Consumer Behavior Slide 14
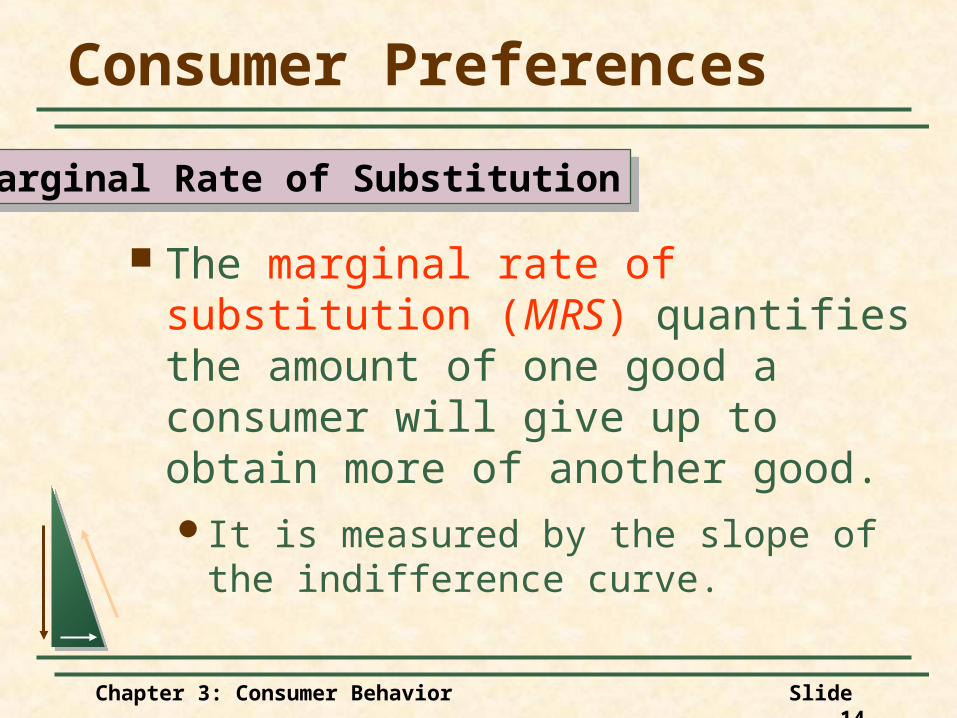
Consumer Preferences
The marginal rate of substitution (MRS) quantifies the amount of one good a consumer will give up to obtain more of another good.It is measured by the slope of the
indifference curve.
Marginal Rate of SubstitutionMarginal Rate of Substitution
Chapter 3: Consumer Behavior Slide 15
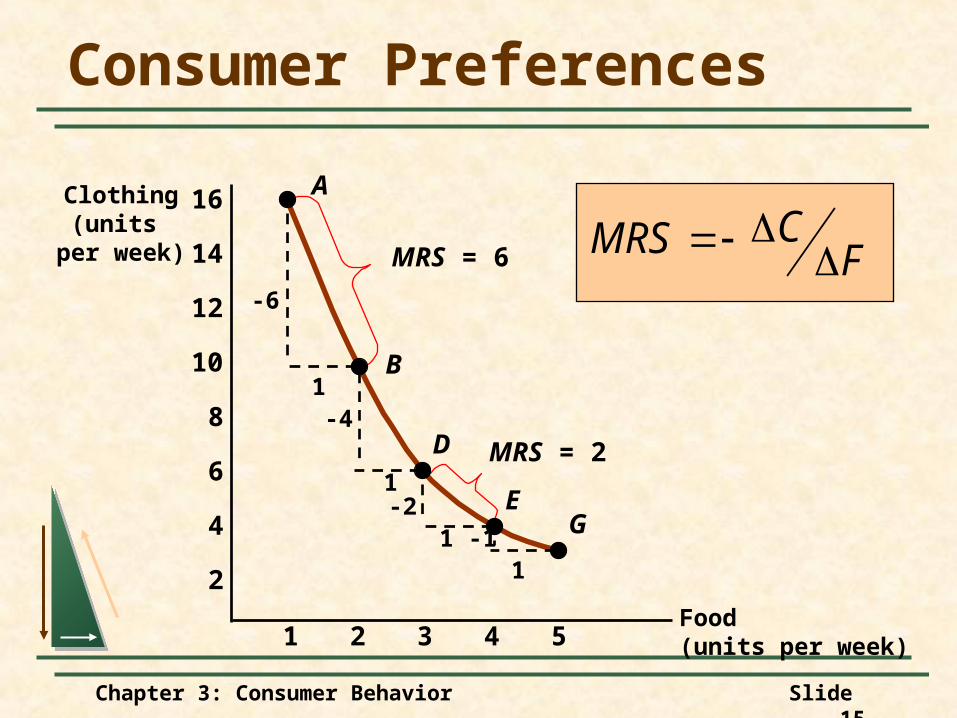
Consumer Preferences
Food(units per week)
Clothing(units
per week)
2 3 4 51
2
4
6
8
10
12
14
16 A
B
D
EG
-6
1
1
11
-4
-2-1
MRS = 6
MRS = 2
FCMRS
Chapter 3: Consumer Behavior Slide 16
Consumer Preferences
Indifference curves are convex because as more of one good is consumed, a consumer would prefer to give up fewer units of a second good to get additional units of the first one.
Consumers prefer a balanced market basket
Marginal Rate of SubstitutionMarginal Rate of Substitution
Chapter 3: Consumer Behavior Slide 17
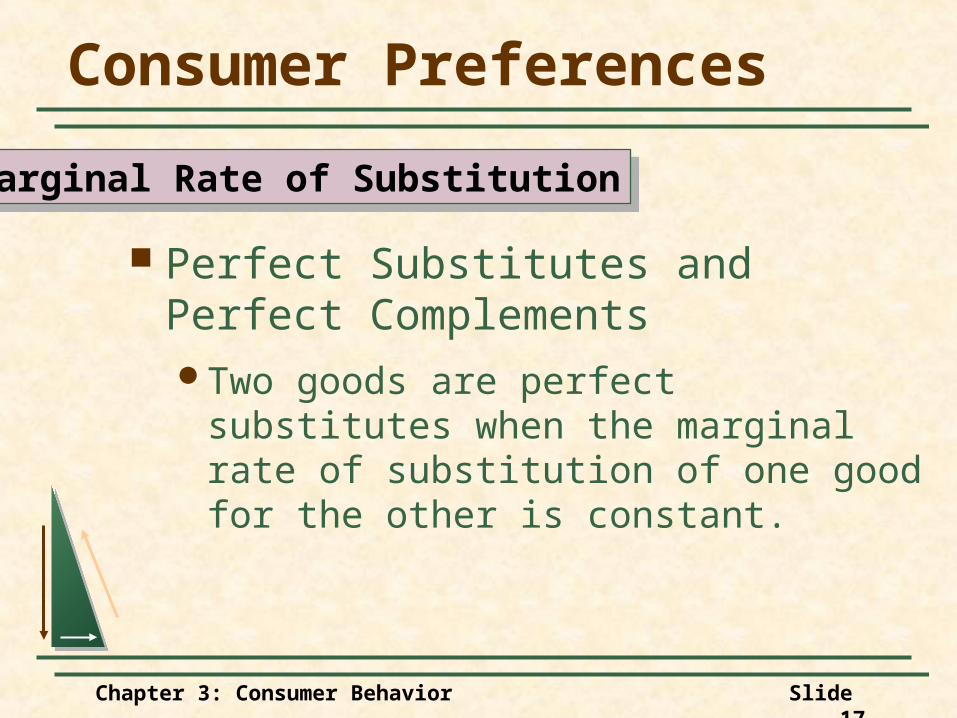
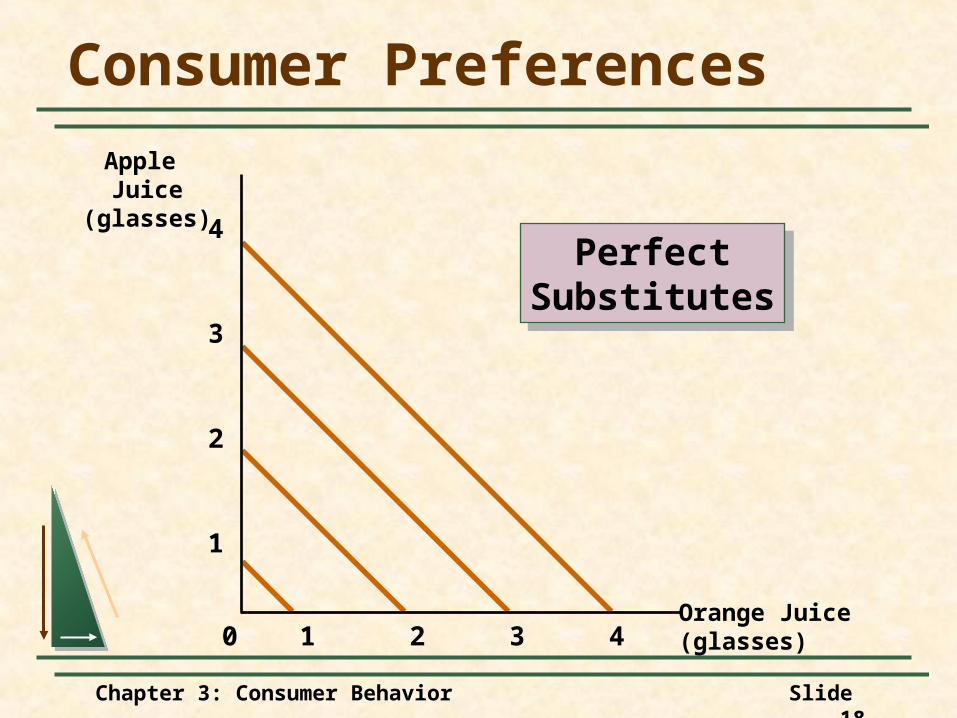
Consumer Preferences
Perfect Substitutes and Perfect ComplementsTwo goods are perfect substitutes when
the marginal rate of substitution of one good for the other is constant.
Marginal Rate of SubstitutionMarginal Rate of Substitution
Chapter 3: Consumer Behavior Slide 18
Consumer Preferences
Orange Juice(glasses)
Apple Juice
(glasses)
2 3 41
1
2
3
4
0
PerfectSubstitutes
PerfectSubstitutes
Chapter 3: Consumer Behavior Slide 19
Consumer Preferences
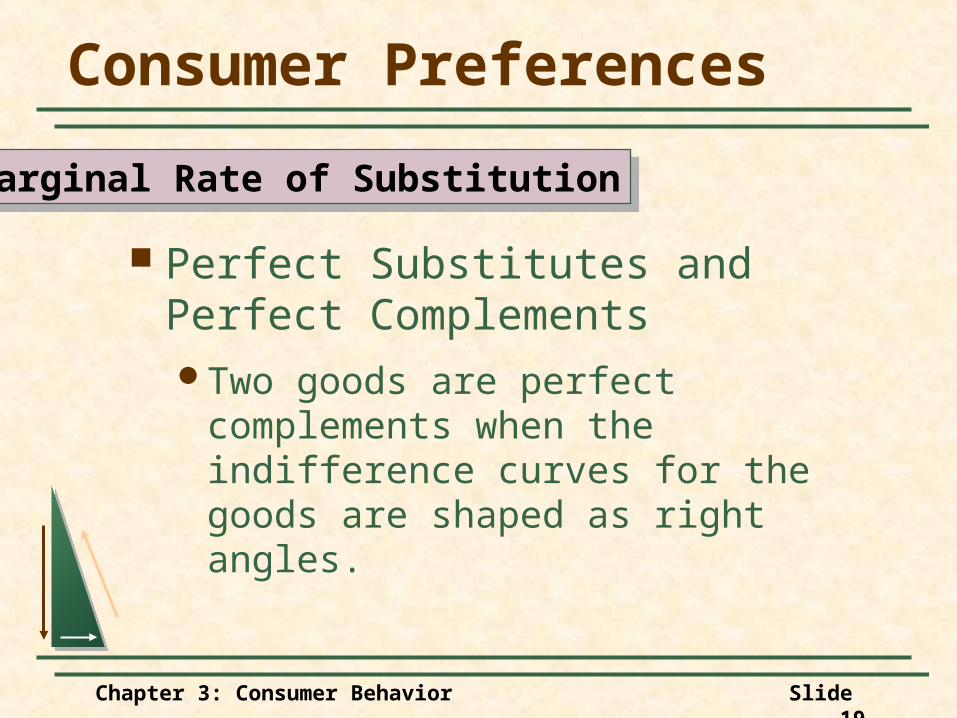
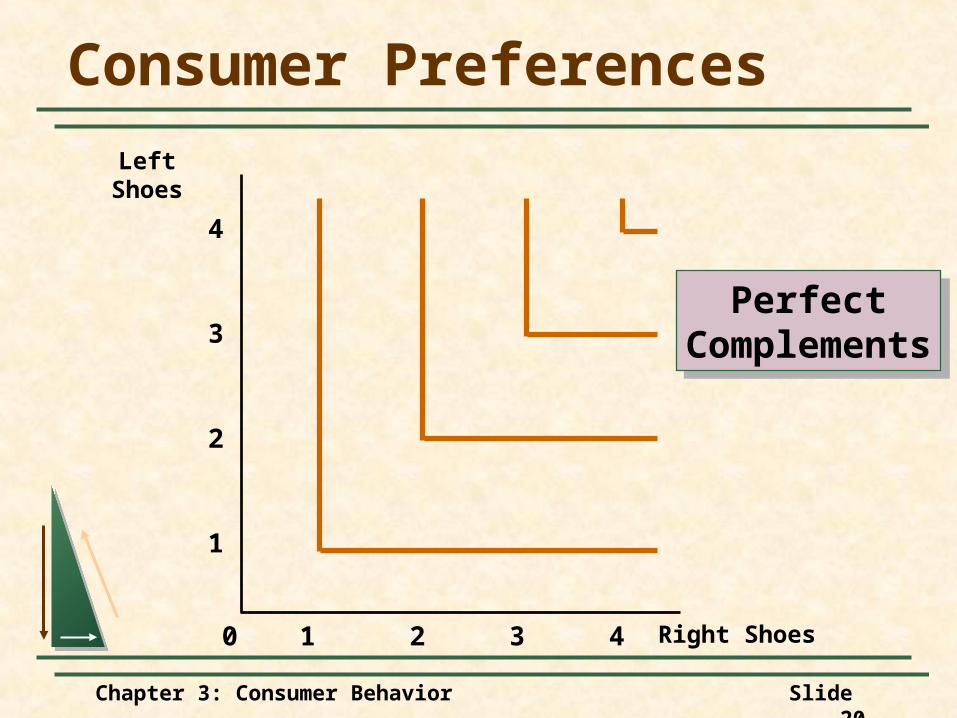
Perfect Substitutes and Perfect ComplementsTwo goods are perfect complements when
the indifference curves for the goods are shaped as right angles.
Marginal Rate of SubstitutionMarginal Rate of Substitution
Chapter 3: Consumer Behavior Slide 20
Consumer Preferences
Right Shoes
LeftShoes
2 3 41
1
2
3
4
0
PerfectComplements
PerfectComplements
Chapter 3: Consumer Behavior Slide 21
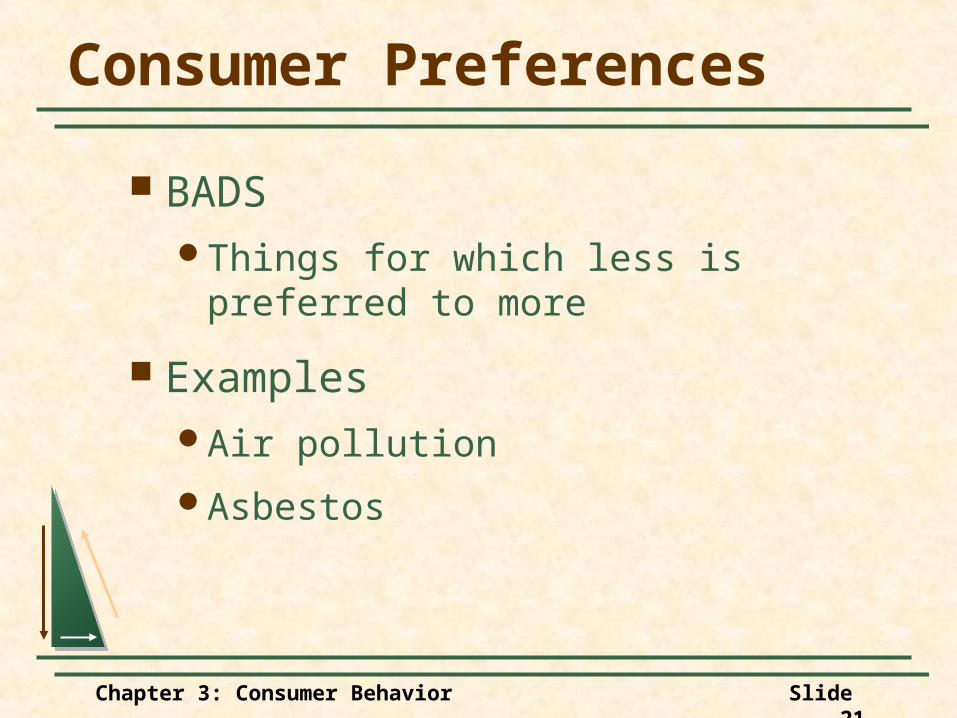
Consumer Preferences
BADSThings for which less is preferred to more
ExamplesAir pollution
Asbestos
Chapter 3: Consumer Behavior Slide 22
Consumer Preferences
What Do You Think?How can we account for Bads in the
analysis of consumer preferences?
Chapter 3: Consumer Behavior Slide 23
Consumer Preferences
Automobile executives must regularly decide when to introduce new models and how much money to invest in restyling.
Designing New Automobiles (I)Designing New Automobiles (I)
Chapter 3: Consumer Behavior Slide 24
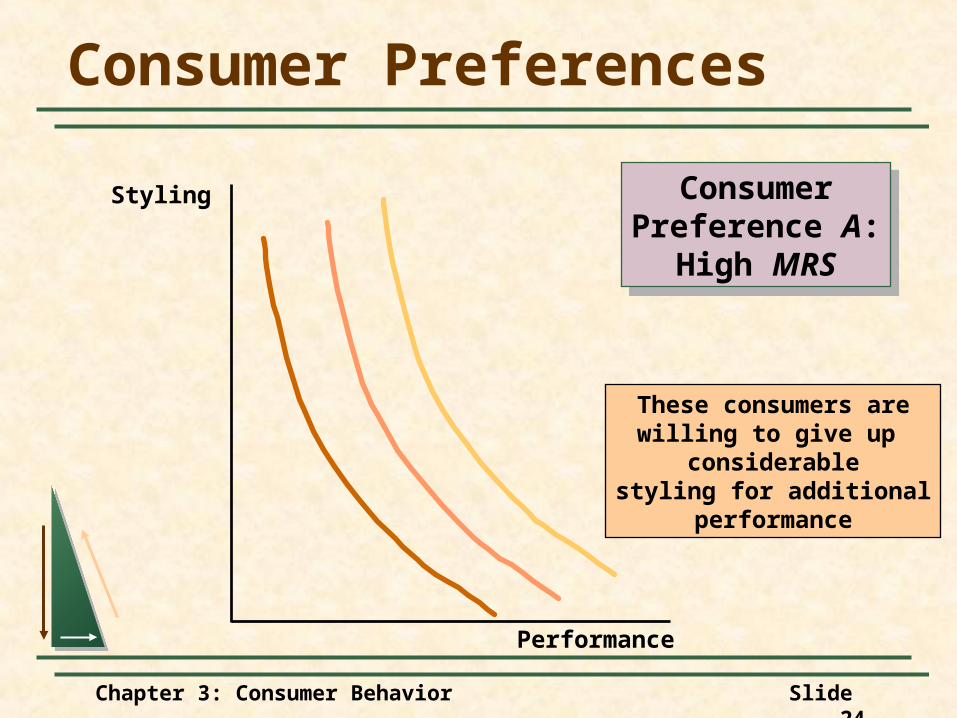
Consumer Preferences
These consumers arewilling to give up
considerablestyling for additional
performance
Styling
Performance
ConsumerPreference A:
High MRS
ConsumerPreference A:
High MRS
Chapter 3: Consumer Behavior Slide 25
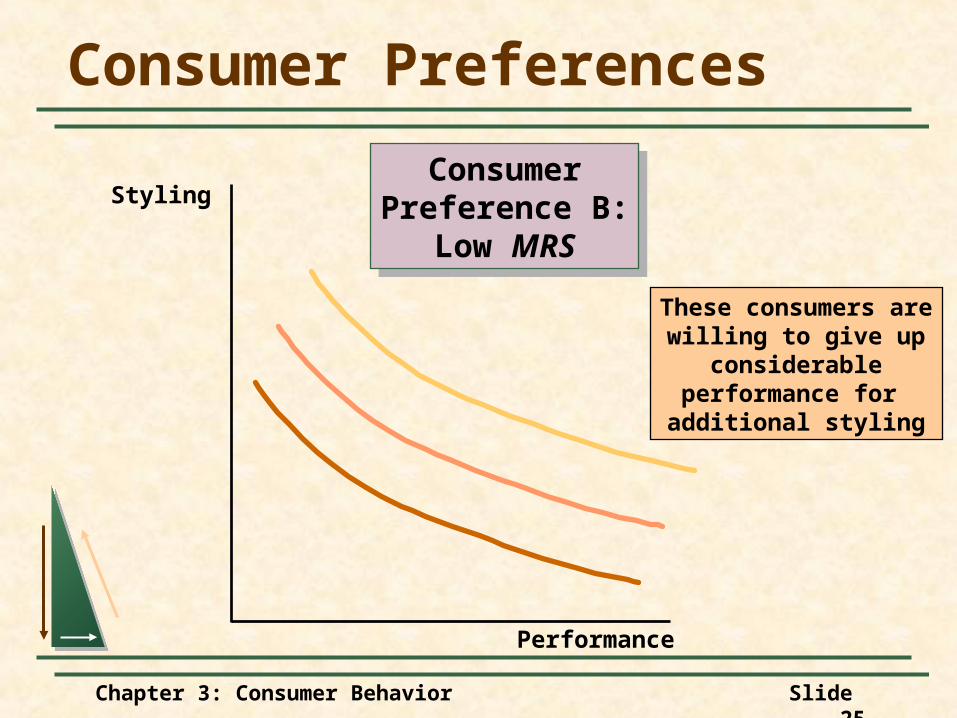
Consumer Preferences
These consumers arewilling to give up
considerableperformance for additional styling
Styling
Performance
ConsumerPreference B:
Low MRS
ConsumerPreference B:
Low MRS
Chapter 3: Consumer Behavior Slide 26
Consumer Preferences
What Do You Think?
How can we determine the consumers preference?
Designing New Automobiles (I)Designing New Automobiles (I)
Chapter 3: Consumer Behavior Slide 27
Consumer Preferences
A recent study of automobile demand in the United States shows that over the past two decades most consumers have preferred styling over performance.
Designing New Automobiles (I)Designing New Automobiles (I)
Chapter 3: Consumer Behavior Slide 28
Consumer Preferences
UtilityUtility: Numerical score representing the
satisfaction that a consumer gets from a given market basket.
Chapter 3: Consumer Behavior Slide 29
Consumer Preferences
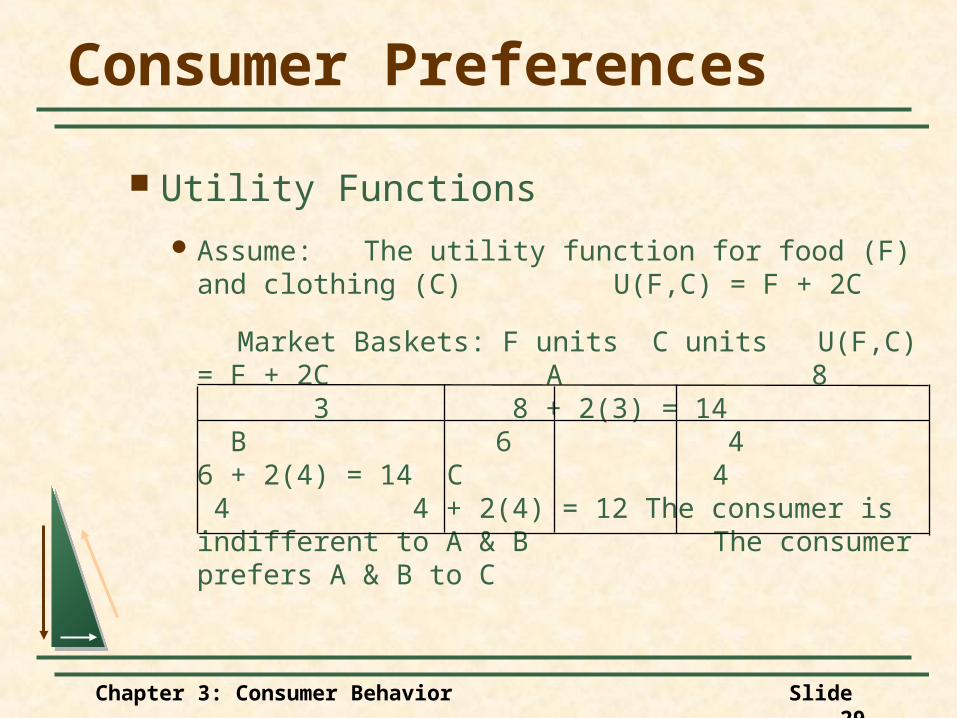
Utility Functions
Assume:The utility function for food (F) and clothing (C)
U(F,C) = F + 2C
Market Baskets: F units C units U(F,C) = F + 2C A 8 3 8 + 2(3)
= 14 B 6 4 6 + 2(4) = 14 C 4 4 4 + 2(4) = 12 The consumer is indifferent to A & B
The consumer prefers A & B to C
Chapter 3: Consumer Behavior Slide 30
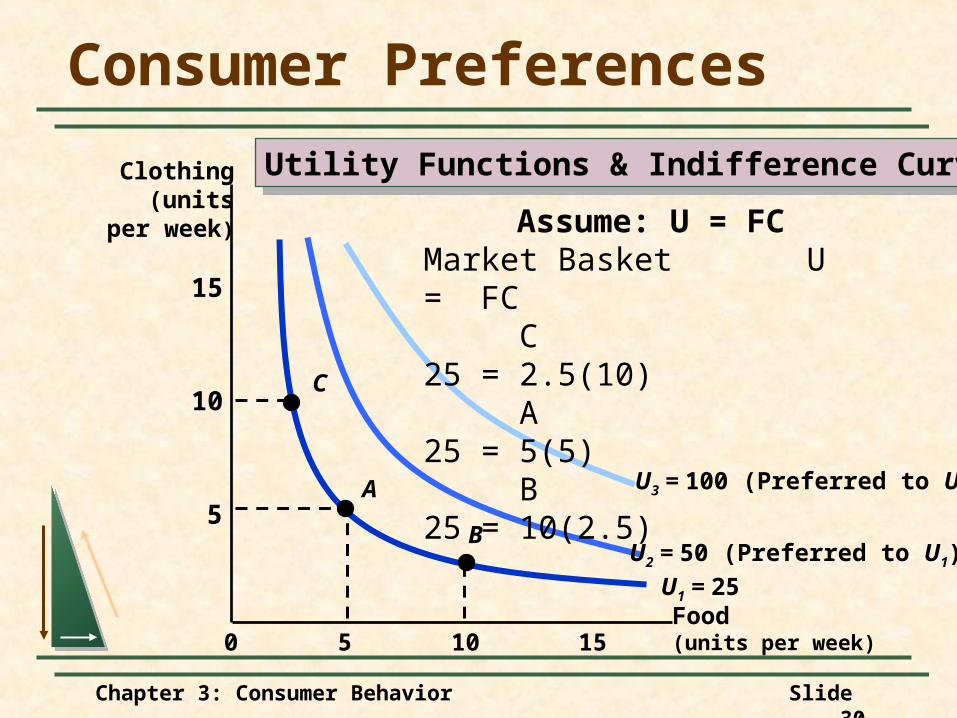
Consumer Preferences
Food(units per week)10 155
5
10
15
0
Clothing(units
per week)
U1 = 25
U2 = 50 (Preferred to U1)
U3 = 100 (Preferred to U2)A
B
C
Assume: U = FCMarket Basket U = FC
C 25 = 2.5(10)A 25 = 5(5)B 25 = 10(2.5)
Utility Functions & Indifference CurvesUtility Functions & Indifference Curves
Chapter 3: Consumer Behavior Slide 31
Consumer Preferences
Ordinal Versus Cardinal UtilityOrdinal Utility Function: places market
baskets in the order of most preferred to least preferred, but it does not indicate how much one market basket is preferred to another.
Cardinal Utility Function: utility function describing the extent to which one market basket is preferred to another.
Chapter 3: Consumer Behavior Slide 32
Consumer Preferences
Ordinal Versus Cardinal RankingsThe actual unit of measurement for utility is
not important.
Therefore, an ordinal ranking is sufficient to explain how most individual decisions are made.
Chapter 3: Consumer Behavior Slide 33
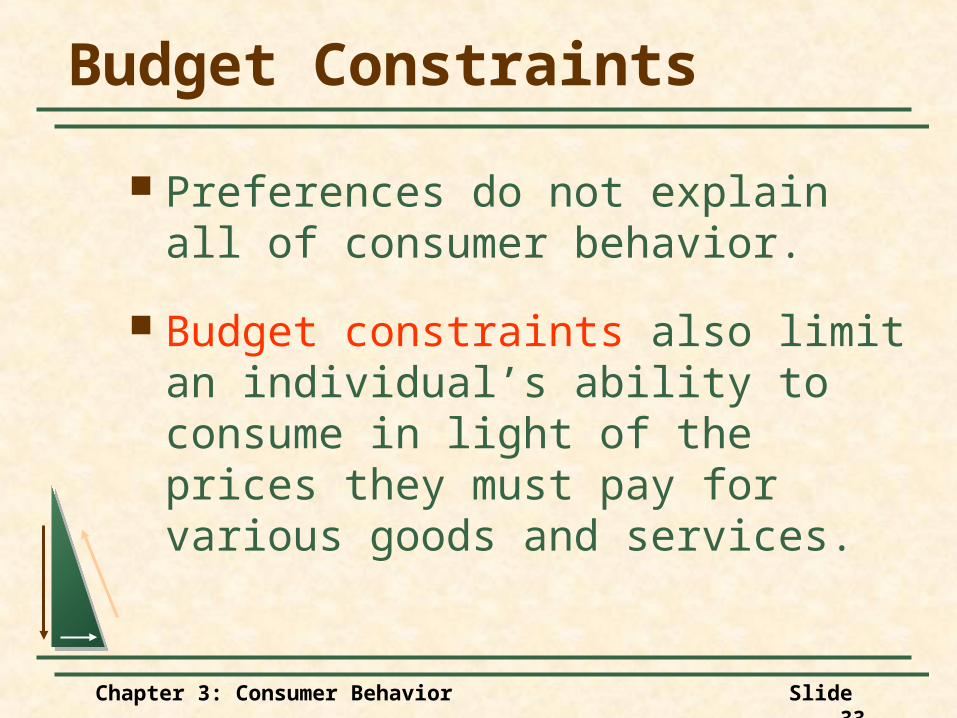
Budget Constraints
Preferences do not explain all of consumer behavior.
Budget constraints also limit an individual’s ability to consume in light of the prices they must pay for various goods and services.
Chapter 3: Consumer Behavior Slide 34
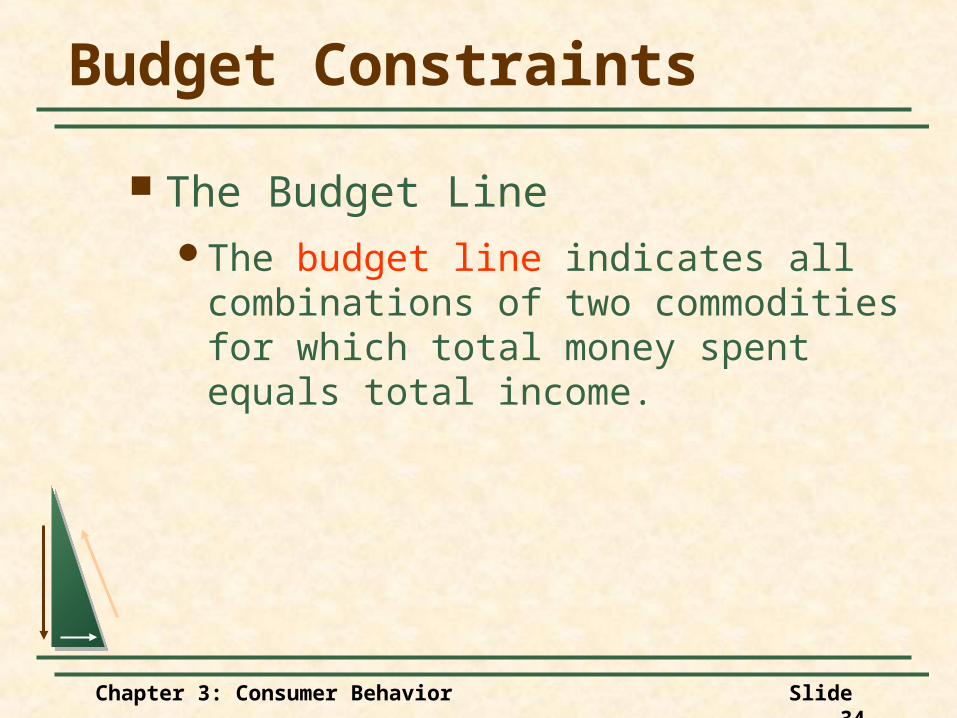
Budget Constraints
The Budget LineThe budget line indicates all combinations
of two commodities for which total money spent equals total income.
Chapter 3: Consumer Behavior Slide 35
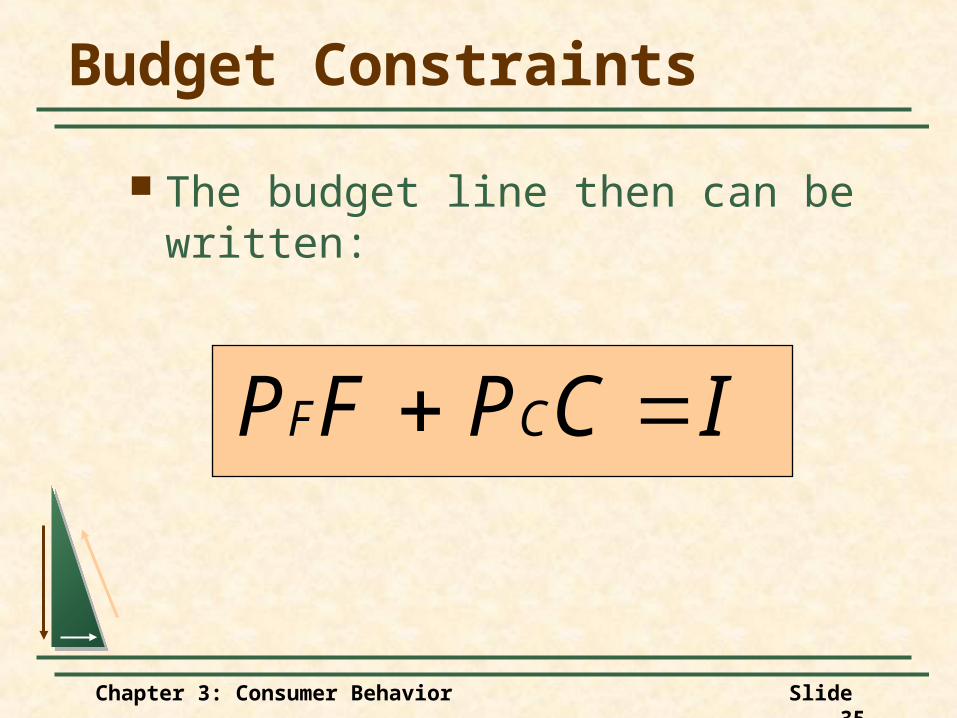
Budget Constraints
The budget line then can be written:
ICPFP CF
Chapter 3: Consumer Behavior Slide 36
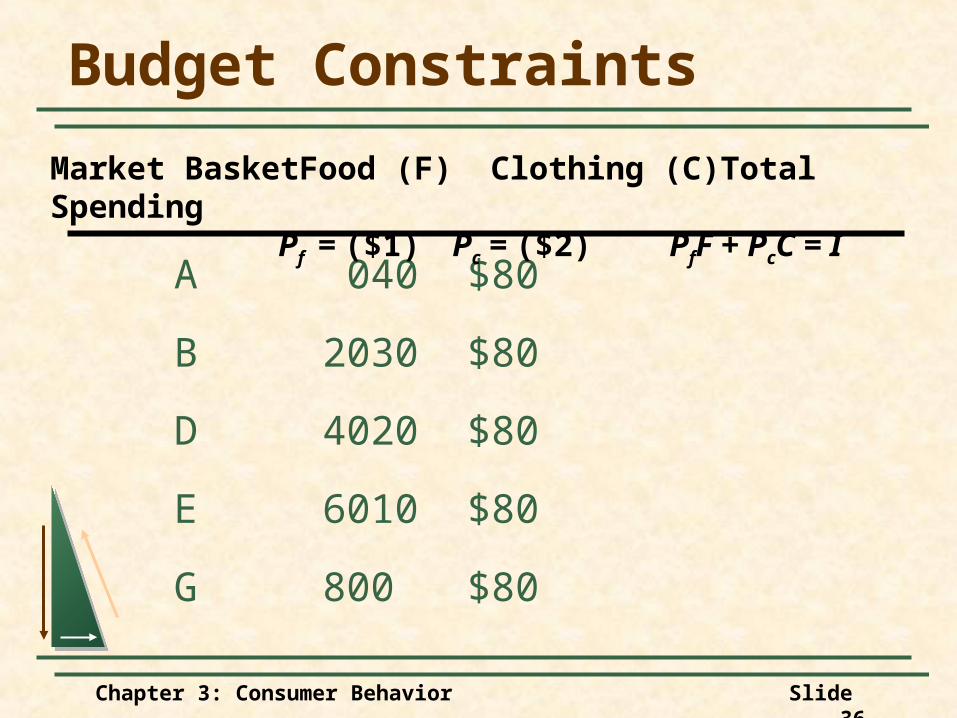
Budget Constraints
A 0 40 $80
B 20 30 $80
D 40 20 $80
E 60 10 $80
G 80 0 $80
Market Basket Food (F) Clothing (C) Total SpendingPf = ($1) Pc = ($2) PfF + PcC = I
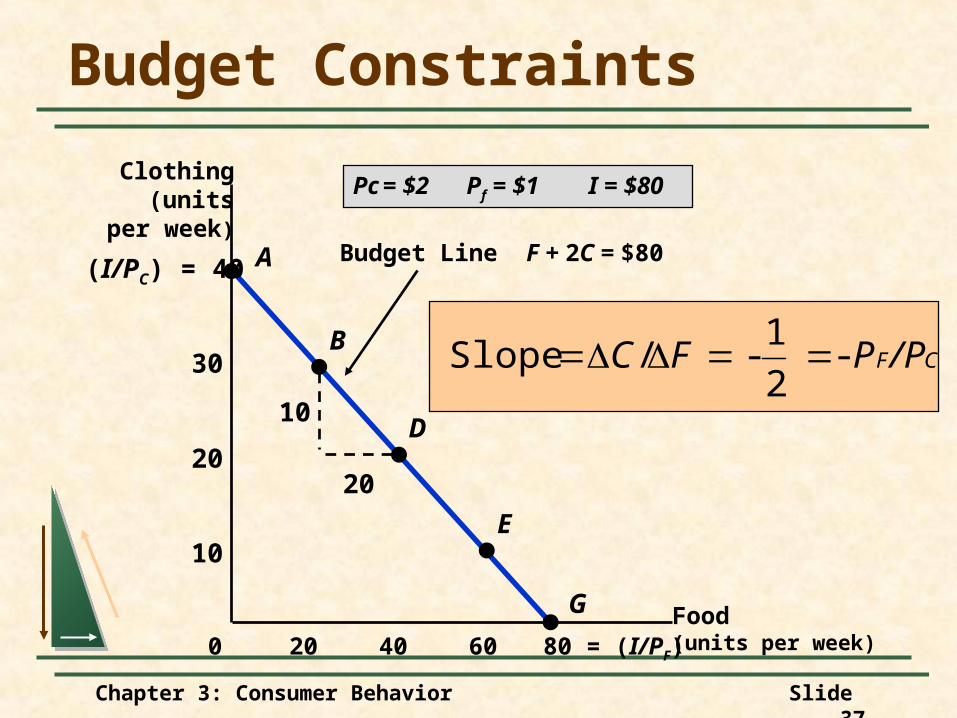
Chapter 3: Consumer Behavior Slide 37
Budget Line F + 2C = $80
CF/PPFC - 2
1- / Slope
10
20
(I/PC) = 40
Budget Constraints
Food(units per week)40 60 80 = (I/PF)20
10
20
30
0
A
B
D
E
G
Clothing(units
per week)
Pc = $2 Pf = $1 I = $80
Chapter 3: Consumer Behavior Slide 38
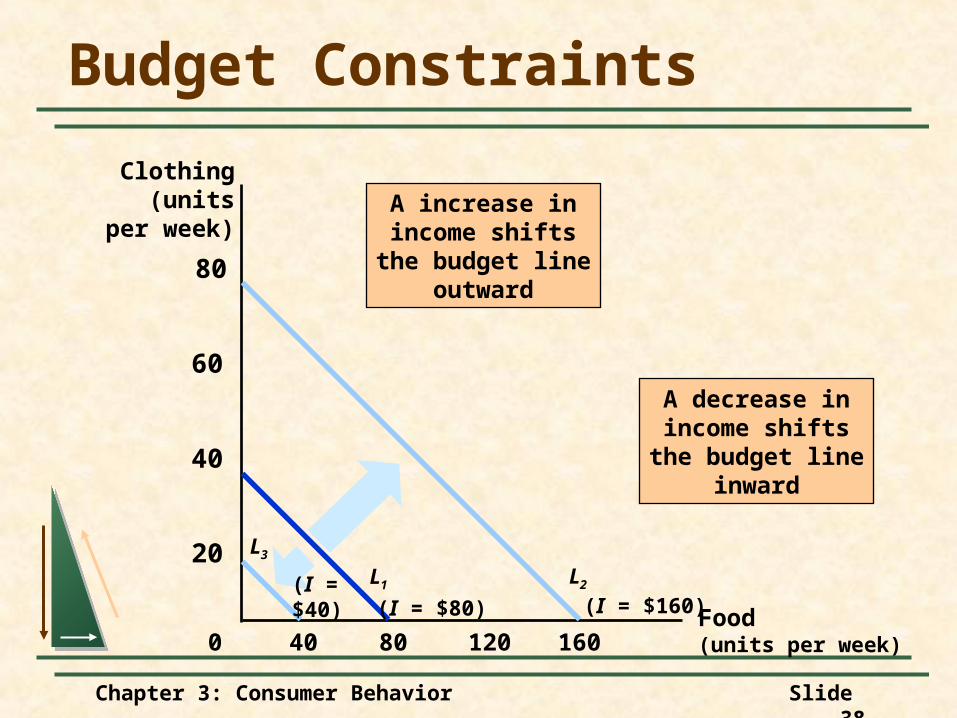
Budget Constraints
Food(units per week)
Clothing(units
per week)
80 120 16040
20
40
60
80
0
A increase inincome shifts
the budget lineoutward
(I = $160)L2
(I = $80)
L1
L3
(I =$40)
A decrease inincome shifts
the budget lineinward
Chapter 3: Consumer Behavior Slide 39
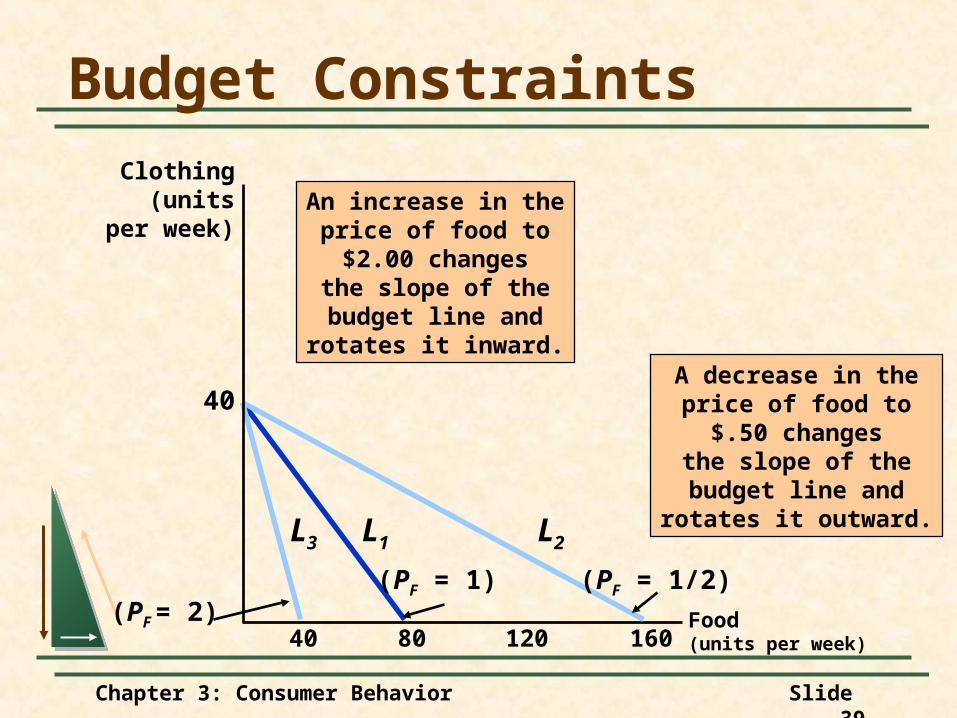
Budget Constraints
Food(units per week)
Clothing(units
per week)
80 120 16040
40
(PF = 1)
L1
An increase in theprice of food to$2.00 changes
the slope of thebudget line and
rotates it inward.
L3
(PF = 2)(PF = 1/2)
L2
A decrease in theprice of food to$.50 changes
the slope of thebudget line and
rotates it outward.
Chapter 3: Consumer Behavior Slide 40
Budget Constraints
The Effects of Changes in Income and PricesPrice Changes
If the two goods increase in price, but the ratio of the two prices is unchanged, the slope will not change.
Chapter 3: Consumer Behavior Slide 41
Budget Constraints
The Effects of Changes in Income and PricesPrice Changes
However, the budget line will shift inward to a point parallel to the original budget line.

Chapter 3: Consumer Behavior Slide 42
Budget Constraints
The Effects of Changes in Income and PricesPrice Changes
If the two goods decrease in price, but the ratio of the two prices is unchanged, the slope will not change.
Chapter 3: Consumer Behavior Slide 43
Budget Constraints
The Effects of Changes in Income and PricesPrice Changes
However, the budget line will shift outward to a point parallel to the original budget line.
Chapter 3: Consumer Behavior Slide 44
Consumer Choice
Consumers choose a combination of goods that will maximize the satisfaction they can achieve, given the limited budget available to them.
Chapter 3: Consumer Behavior Slide 45
Consumer Choice
The maximizing market basket must satisfy two conditions:
1) It must be located on the budget line.
2) Must give the consumer the most preferred combination of
goods and services.
Chapter 3: Consumer Behavior Slide 46
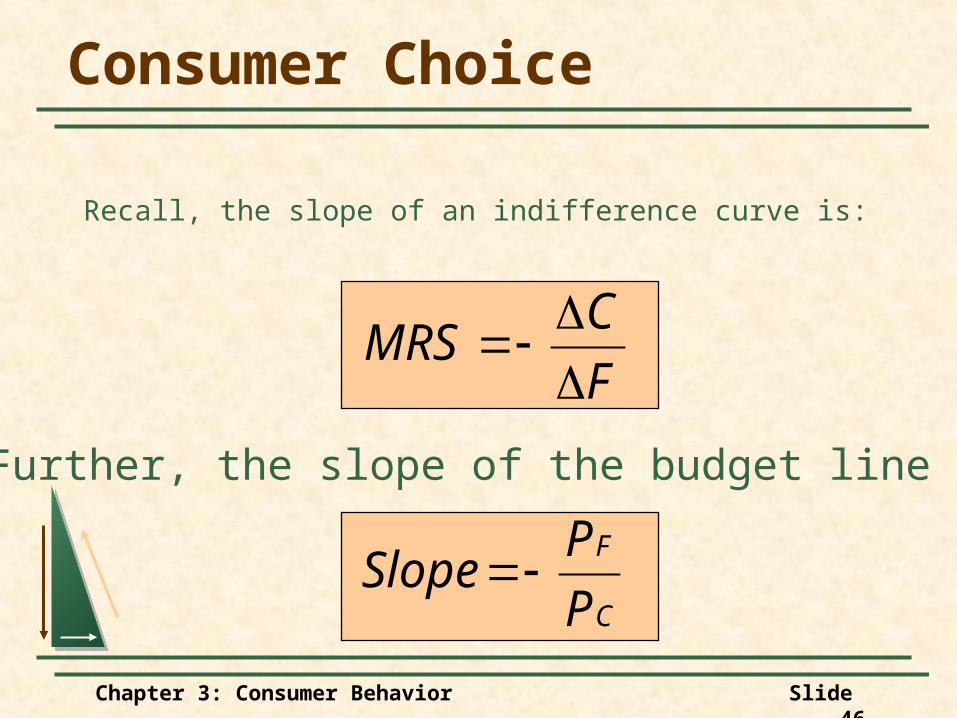
Recall, the slope of an indifference curve is:
Consumer Choice
F
CMRS
C
F
P
PSlope
Further, the slope of the budget line is:
Chapter 3: Consumer Behavior Slide 47
Consumer Choice
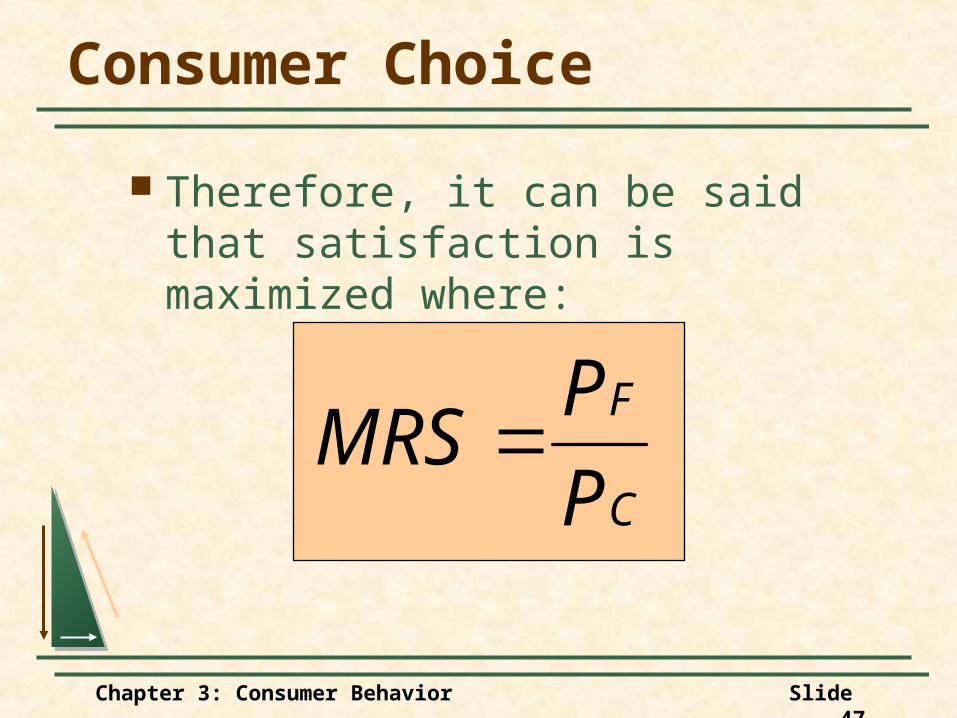
Therefore, it can be said that satisfaction is maximized where:
C
F
P
PMRS
Chapter 3: Consumer Behavior Slide 48
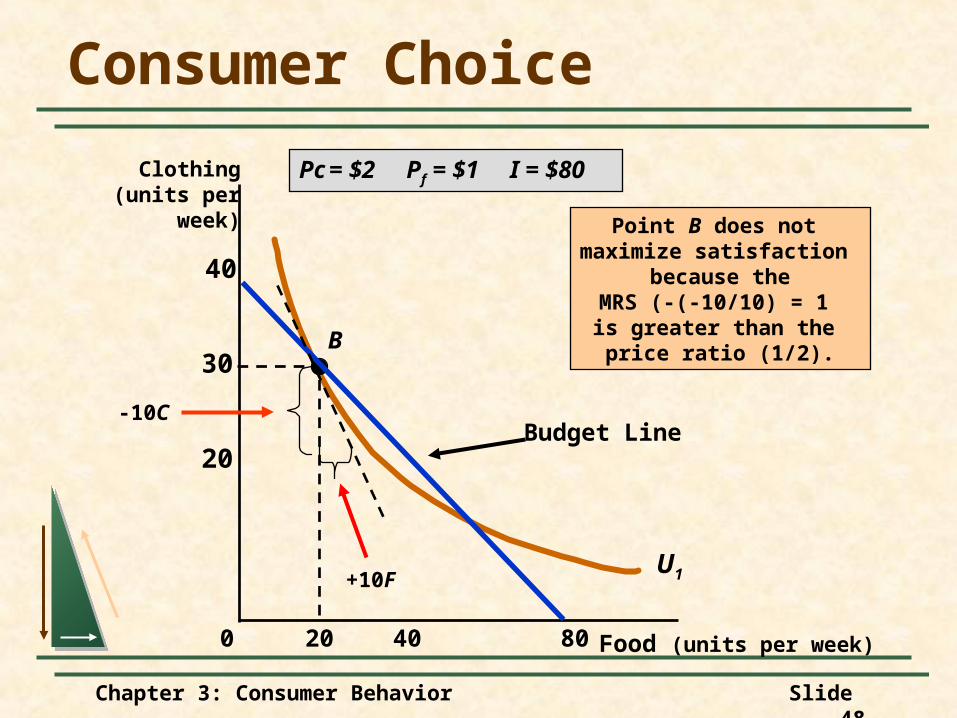
Consumer Choice
Food (units per week)
Clothing(units per
week)
40 8020
20
30
40
0
U1
B
Budget Line
Pc = $2 Pf = $1 I = $80
Point B does not maximize satisfaction
because theMRS (-(-10/10) = 1 is greater than the
price ratio (1/2).
-10C
+10F
Chapter 3: Consumer Behavior Slide 49
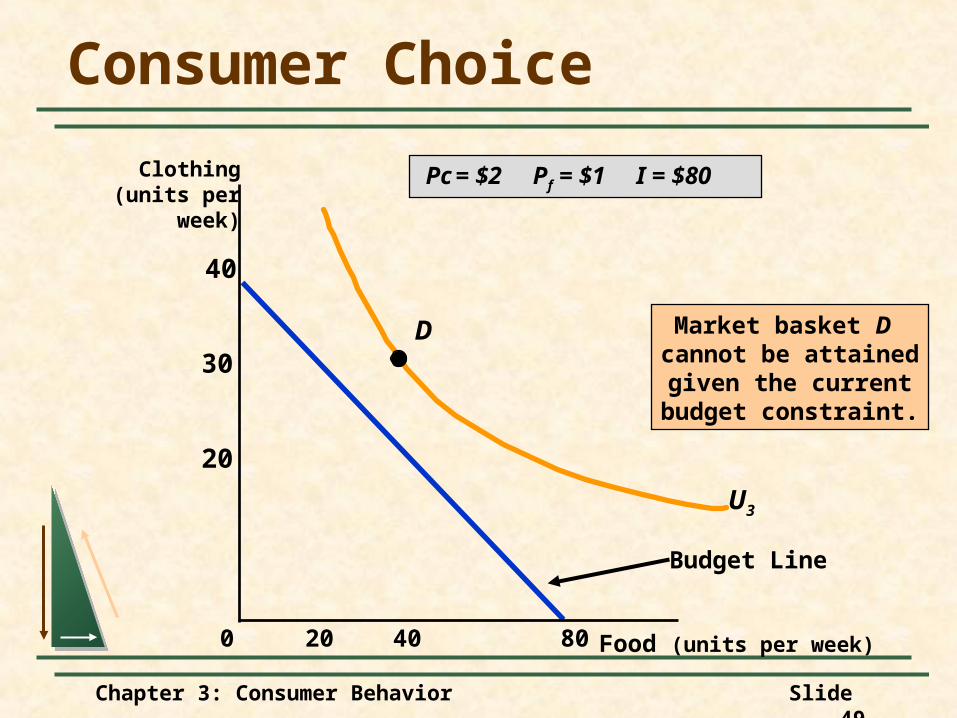
Consumer Choice
Budget Line
U3
D Market basket D cannot be attainedgiven the current
budget constraint.
Pc = $2 Pf = $1 I = $80
Food (units per week)
Clothing(units per
week)
40 8020
20
30
40
0
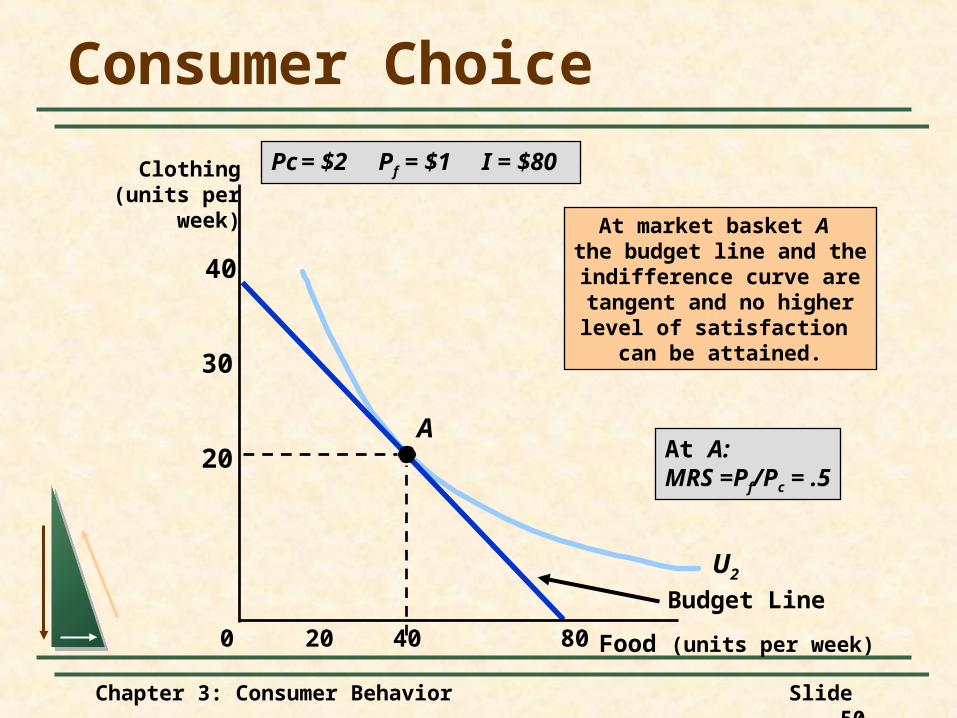
Chapter 3: Consumer Behavior Slide 50
U2
Consumer Choice
Pc = $2 Pf = $1 I = $80
Budget Line
A
At market basket A the budget line and theindifference curve aretangent and no higherlevel of satisfaction
can be attained.
At A:MRS =Pf/Pc = .5
Food (units per week)
Clothing(units per
week)
40 8020
20
30
40
0
Chapter 3: Consumer Behavior Slide 51
Consumer Choice
Choosing between a non-matching and matching grant to fund police expenditures
Decision Making & Public PolicyDecision Making & Public Policy
Chapter 3: Consumer Behavior Slide 52
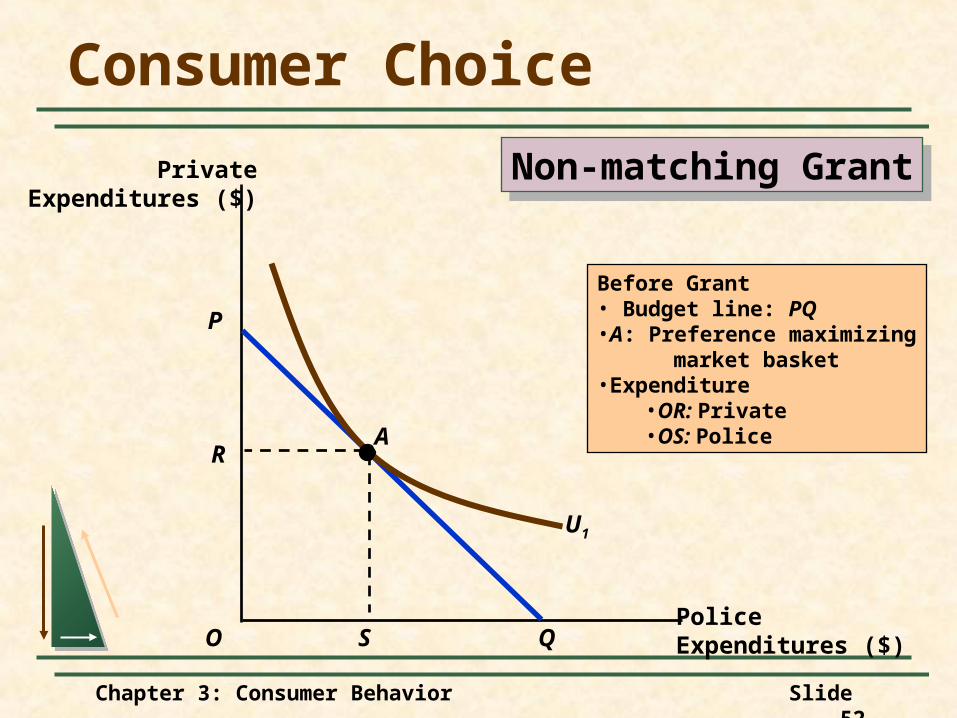
Consumer Choice
Non-matching GrantNon-matching Grant
PoliceExpenditures ($)
PrivateExpenditures ($)
O
P
Q
U1
A
Before Grant• Budget line: PQ•A: Preference maximizing market basket •Expenditure
•OR: Private•OS: Police
R
S
Chapter 3: Consumer Behavior Slide 53
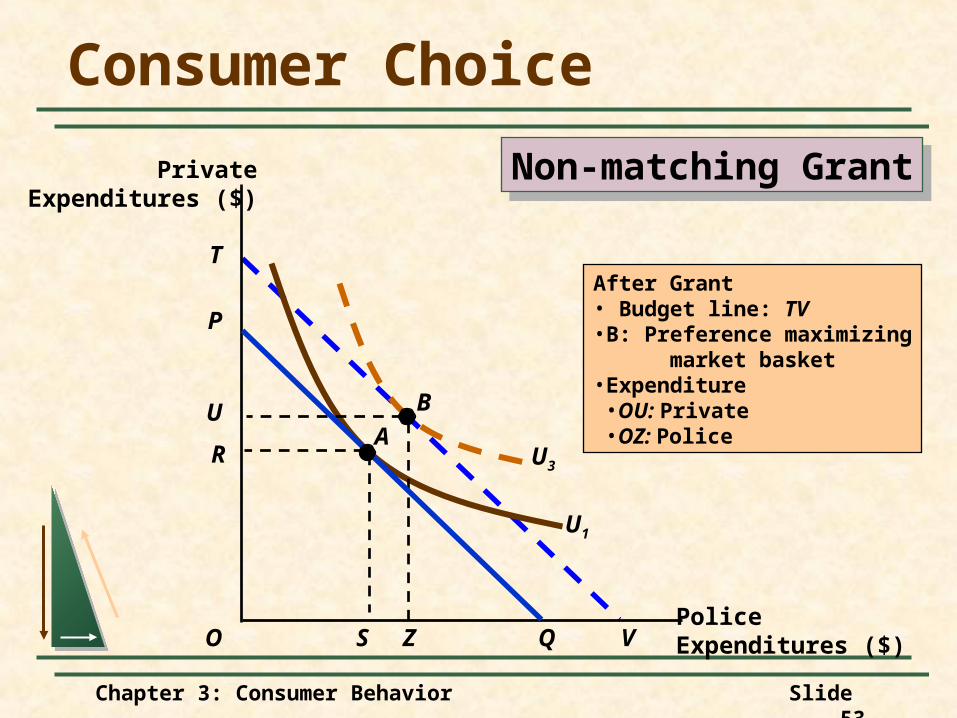
V
T
U3
U1
After Grant• Budget line: TV•B: Preference maximizing market basket •Expenditure
•OU: Private•OZ: Police
BU
Z
R
Consumer Choice
Non-matching GrantNon-matching Grant
P
PoliceExpenditures ($)
PrivateExpenditures ($)
O S Q
A
Chapter 3: Consumer Behavior Slide 54
P
R
U2
T
U1
Consumer Choice
Matching GrantMatching Grant
Police ($)
PrivateExpenditures ($)
O QS
R
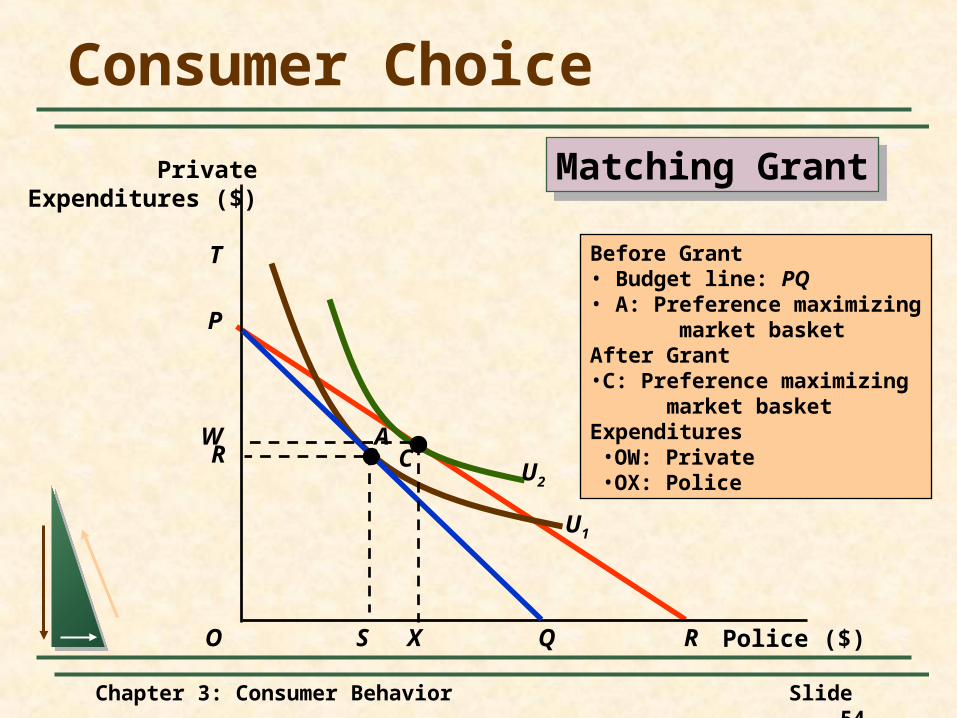
Before Grant• Budget line: PQ• A: Preference maximizing market basket After Grant•C: Preference maximizing market basketExpenditures
•OW: Private•OX: Police
C
X
W A
Chapter 3: Consumer Behavior Slide 55
T
U3
U1
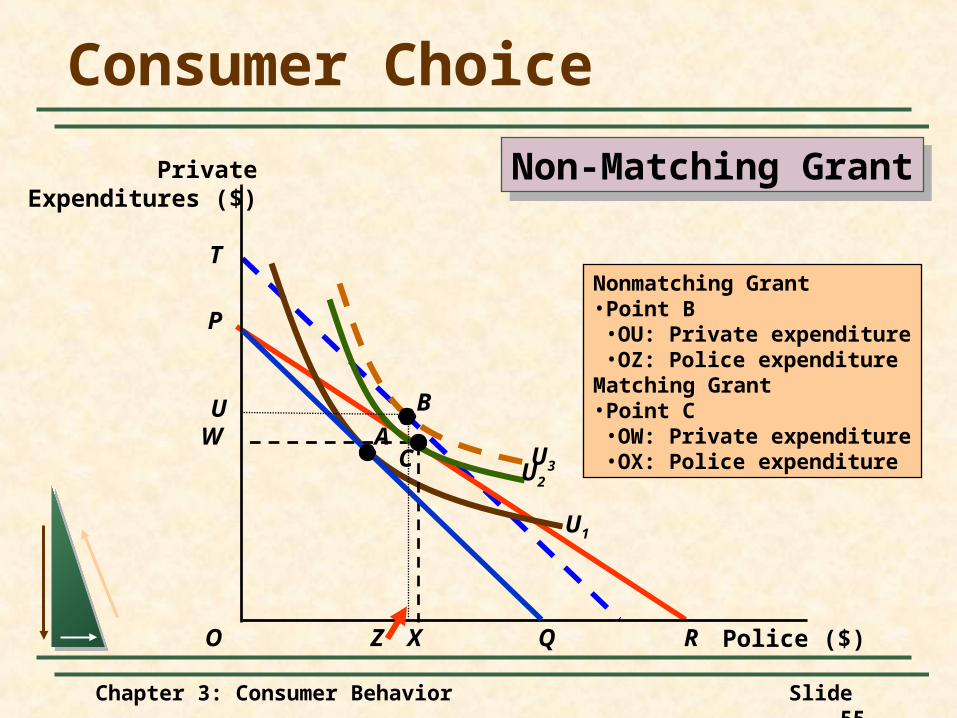
Nonmatching Grant•Point B
•OU: Private expenditure•OZ: Police expenditure
Matching Grant•Point C
•OW: Private expenditure•OX: Police expenditure
W
X
Consumer Choice
Non-Matching GrantNon-Matching Grant
P
Police ($)
PrivateExpenditures ($)
O Q
A
U2
C
R
BU
Z
Chapter 3: Consumer Behavior Slide 56
Consumer Choice
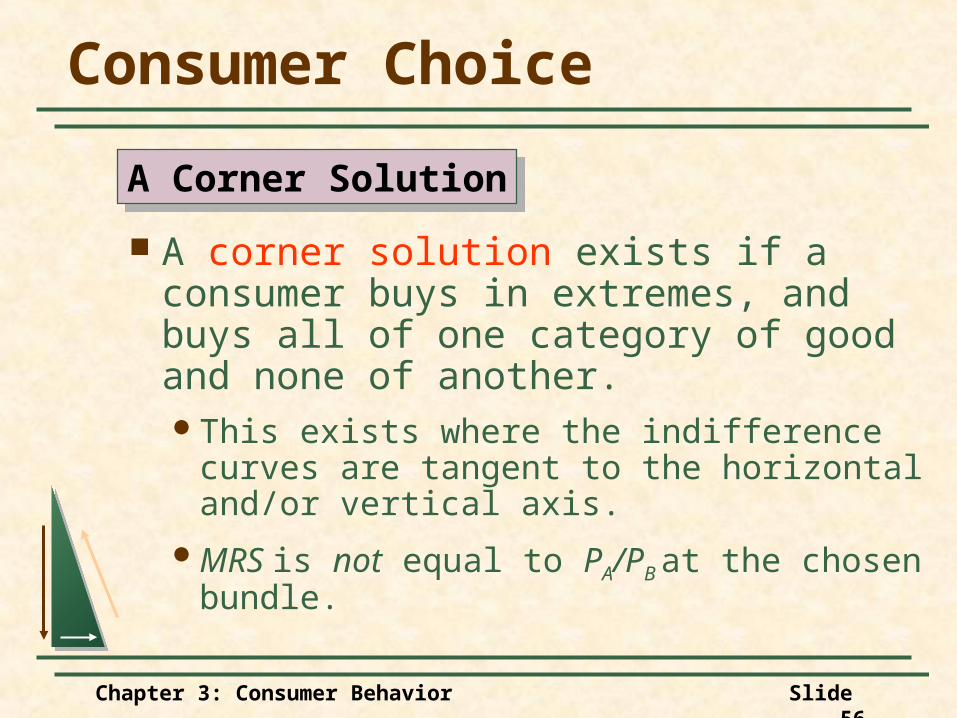
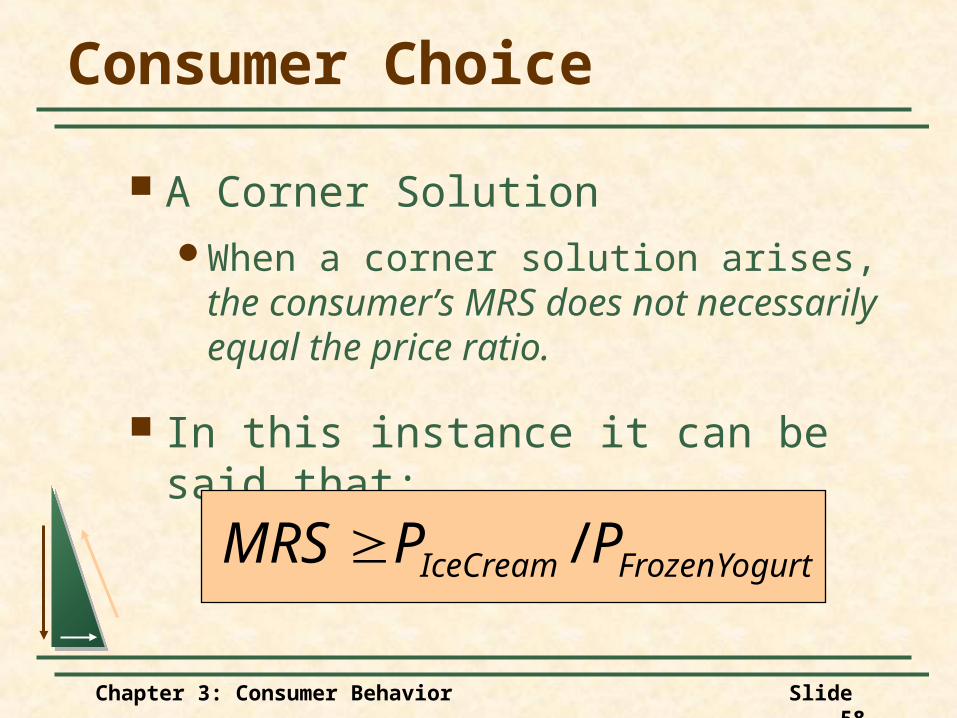
A corner solution exists if a consumer buys in extremes, and buys all of one category of good and none of another. This exists where the indifference curves
are tangent to the horizontal and/or vertical axis.
MRS is not equal to PA/PB at the chosen bundle.
A Corner SolutionA Corner Solution
Chapter 3: Consumer Behavior Slide 57
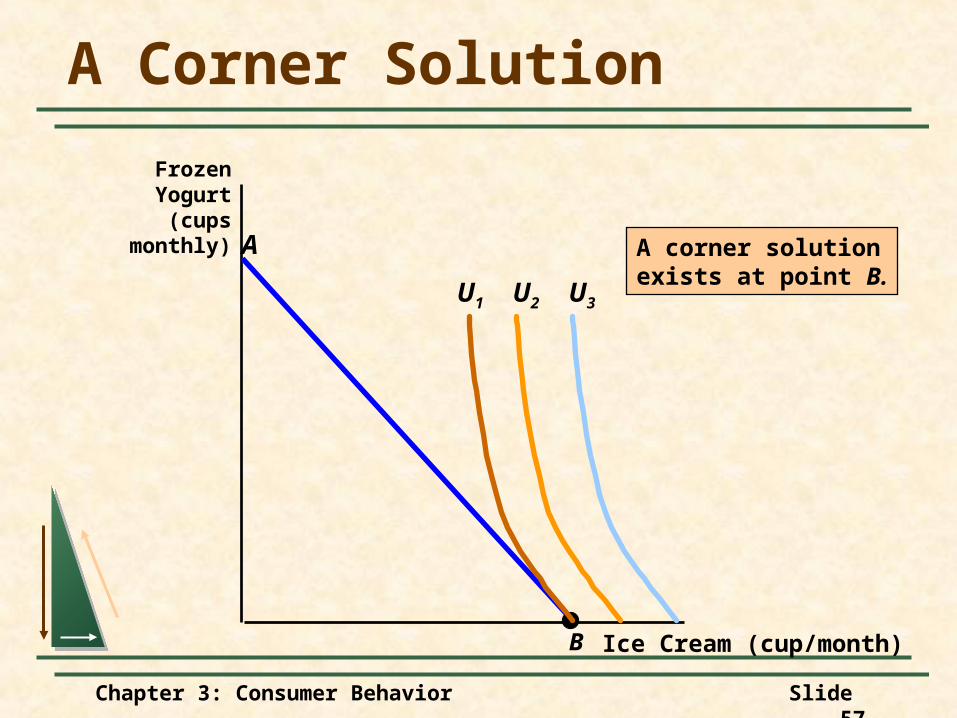
A Corner Solution
Ice Cream (cup/month)
FrozenYogurt
(cupsmonthly)
B
A
U2 U3U1
A corner solutionexists at point B.
Chapter 3: Consumer Behavior Slide 58
Consumer Choice
A Corner SolutionWhen a corner solution arises, the
consumer’s MRS does not necessarily equal the price ratio.
In this instance it can be said that:
YogurtFrozenIceCream PPMRS /
Chapter 3: Consumer Behavior Slide 59
Consumer Choice
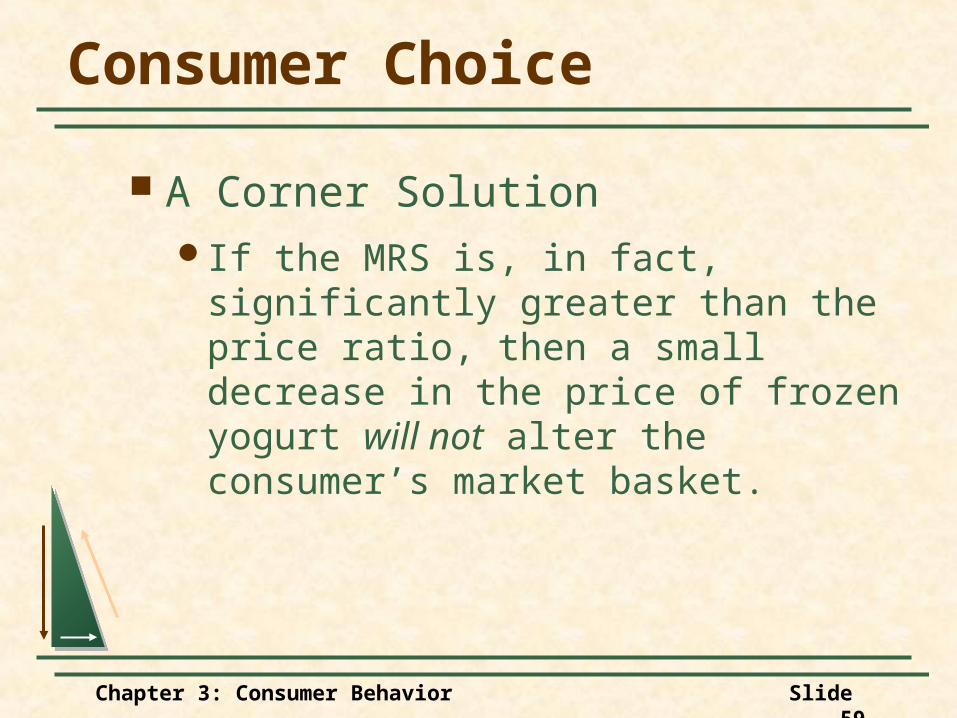
A Corner SolutionIf the MRS is, in fact, significantly greater
than the price ratio, then a small decrease in the price of frozen yogurt will not alter the consumer’s market basket.
Chapter 3: Consumer Behavior Slide 60
Revealed Preferences
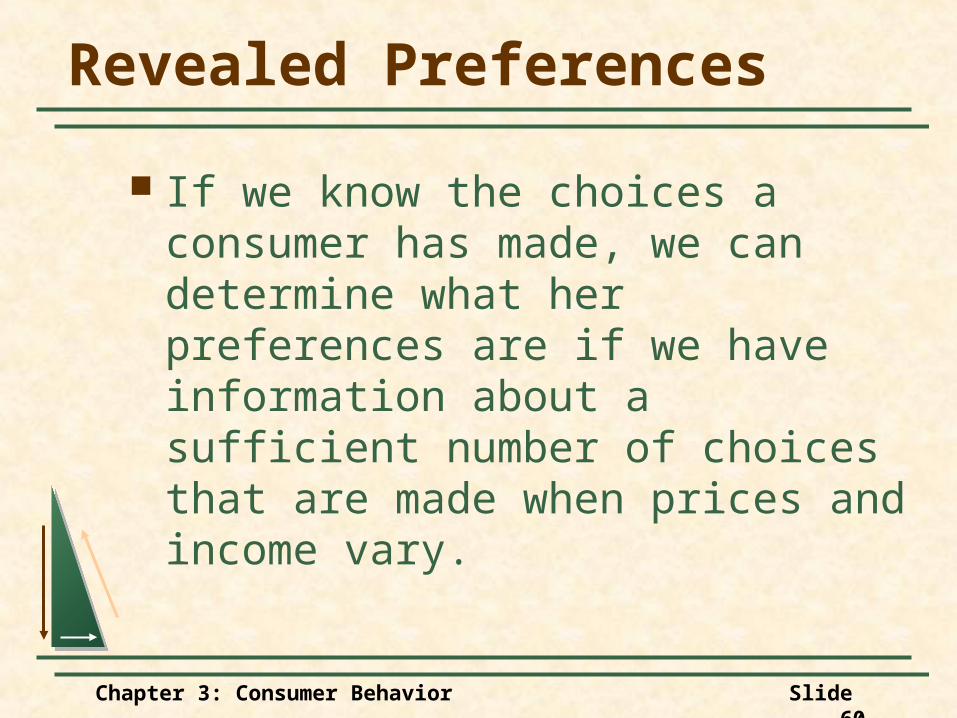
If we know the choices a consumer has made, we can determine what her preferences are if we have information about a sufficient number of choices that are made when prices and income vary.
Chapter 3: Consumer Behavior Slide 61
D
Revealed Preferences--Two Budget Lines
l1
l2
B
A
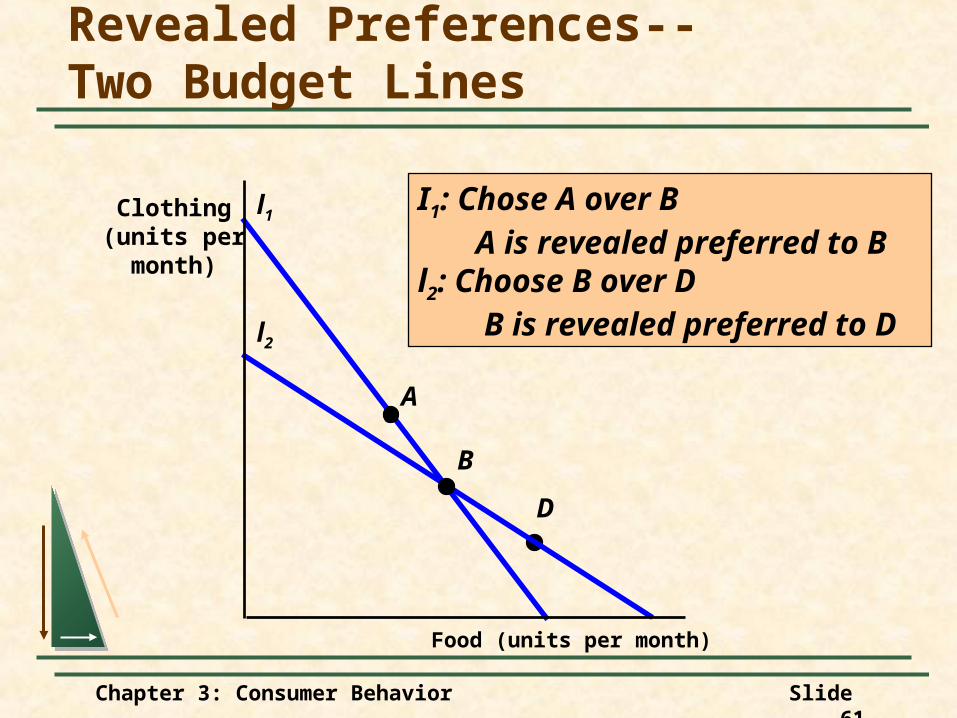
I1: Chose A over B A is revealed preferred to Bl2: Choose B over D B is revealed preferred to D
Food (units per month)
Clothing(units per
month)
Chapter 3: Consumer Behavior Slide 62
Revealed Preferences--Two Budget Lines
l2
B
l1
D
A
All market basketsin the pink
shaded area are preferred to A.
Food (units per month)
Clothing(units per
month)
B is preferred toall market baskets in the green area
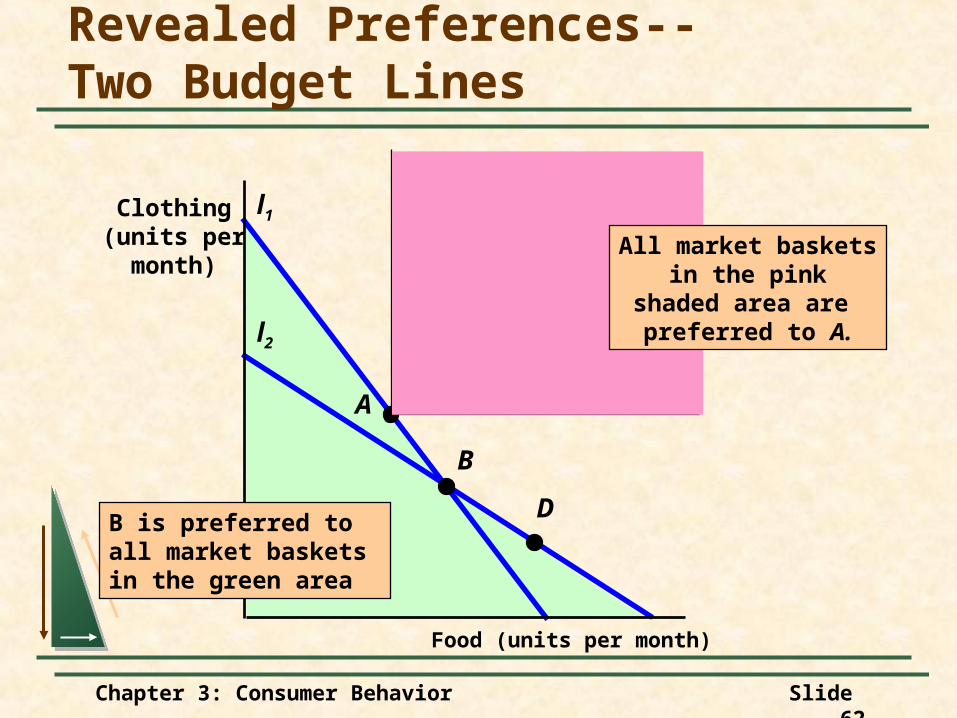
Chapter 3: Consumer Behavior Slide 63
All market baskets in the pink area preferred to A
Food (units per month)
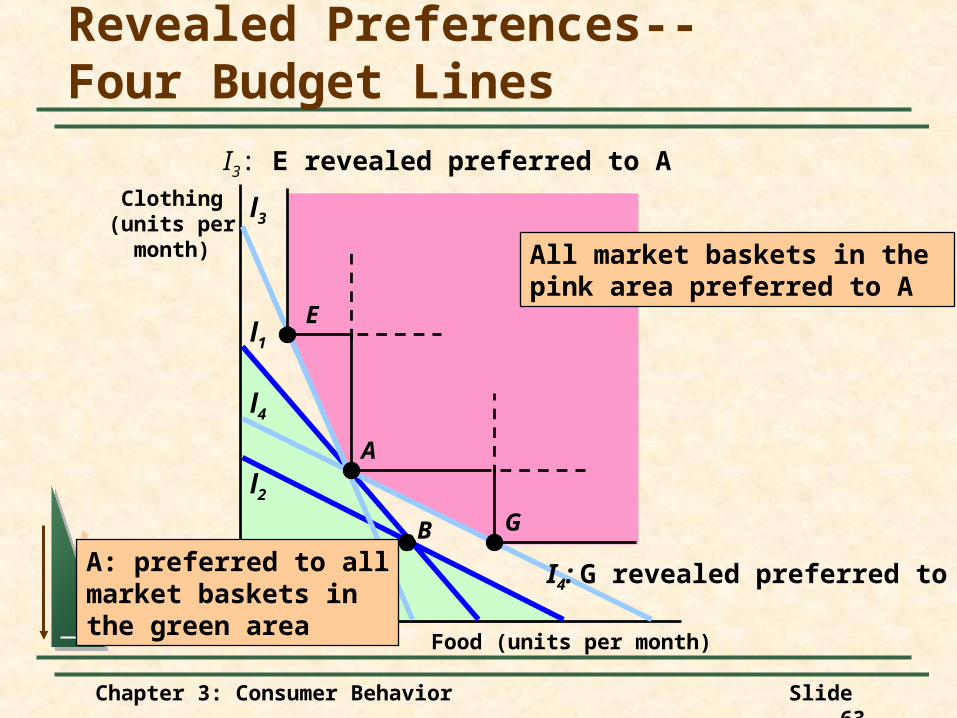
Revealed Preferences--Four Budget Lines
Clothing(units per
month)
l1
l2
l3
l4
A: preferred to allmarket baskets in the green area
E
B
A
G
I3: E revealed preferred to A
I4: G revealed preferred to A
Chapter 3: Consumer Behavior Slide 64
Marginal utility measures the additional satisfaction obtained from consuming one additional unit of a good.
Marginal Utility andConsumer Choice
Marginal UtilityMarginal Utility
Chapter 3: Consumer Behavior Slide 65
The principle of diminishing marginal utility states that as more and more of a good is consumed, consuming additional amounts will yield smaller and smaller additions to utility.
Diminishing Marginal UtilityDiminishing Marginal Utility
Marginal Utility andConsumer Choice
Chapter 3: Consumer Behavior Slide 66
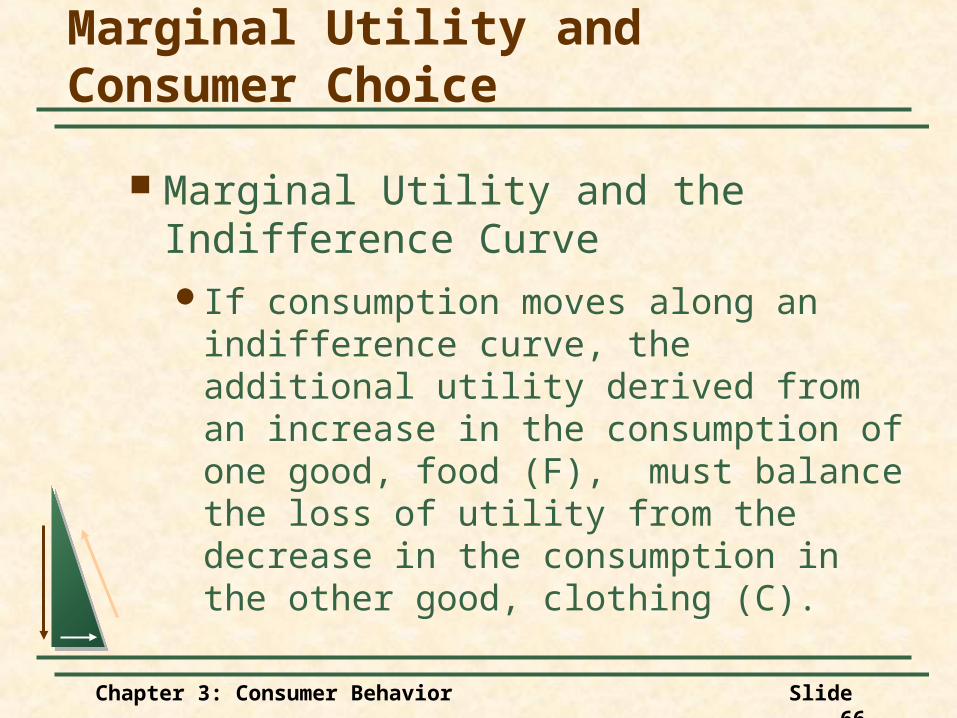
Marginal Utility and the Indifference CurveIf consumption moves along an
indifference curve, the additional utility derived from an increase in the consumption of one good, food (F), must balance the loss of utility from the decrease in the consumption in the other good, clothing (C).
Marginal Utility andConsumer Choice
Chapter 3: Consumer Behavior Slide 67
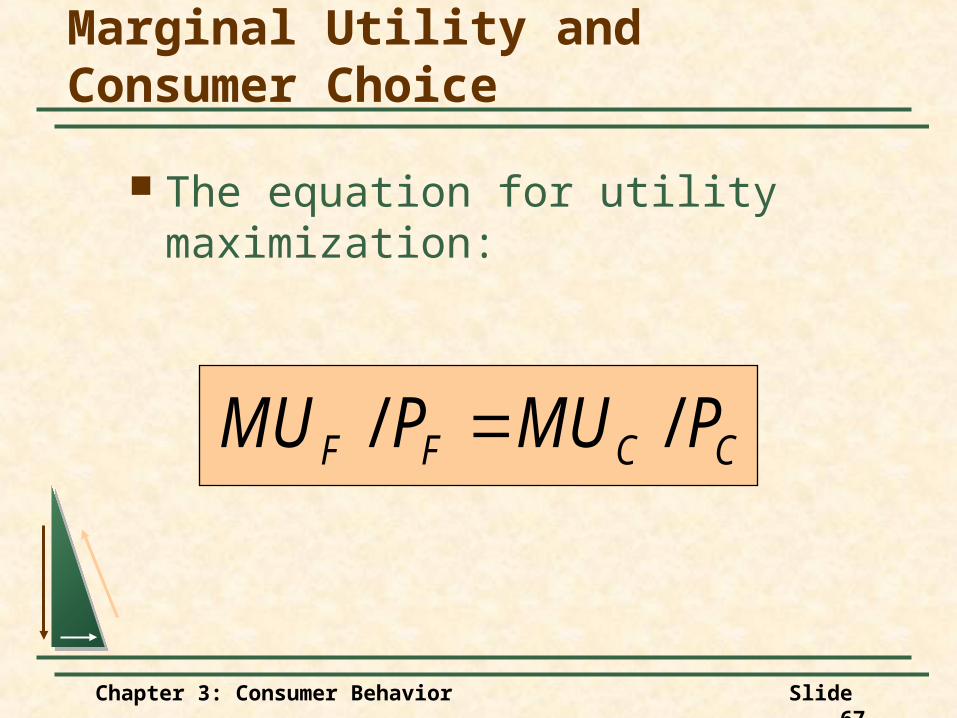
The equation for utility maximization:
CCFF PMUPMU //
Marginal Utility andConsumer Choice
Chapter 3: Consumer Behavior Slide 68
In 1974 and again in 1979, the government imposed price controls on gasoline.
This resulted in shortages and gasoline was rationed.
Gasoline RationingGasoline Rationing
Marginal Utility andConsumer Choice
Chapter 3: Consumer Behavior Slide 69
Nonprice rationing is an alternative to market rationing.
Under one form everyone has an equal chance to purchase a rationed good.
Gasoline is rationed by long lines at the gas pumps.
Gasoline RationingGasoline Rationing
Marginal Utility andConsumer Choice
Chapter 3: Consumer Behavior Slide 70
Rationing hurts some by limiting the amount of gasoline they can buy.
This can be seen in the following model.
It applies to a woman with an annual income of $20,000.
Marginal Utility andConsumer Choice
Chapter 3: Consumer Behavior Slide 71
The horizontal axis shows her annual consumption of gasoline at $1/gallon.
The vertical axis shows her remaining income after purchasing gasoline.
Marginal Utility andConsumer Choice
Chapter 3: Consumer Behavior Slide 72
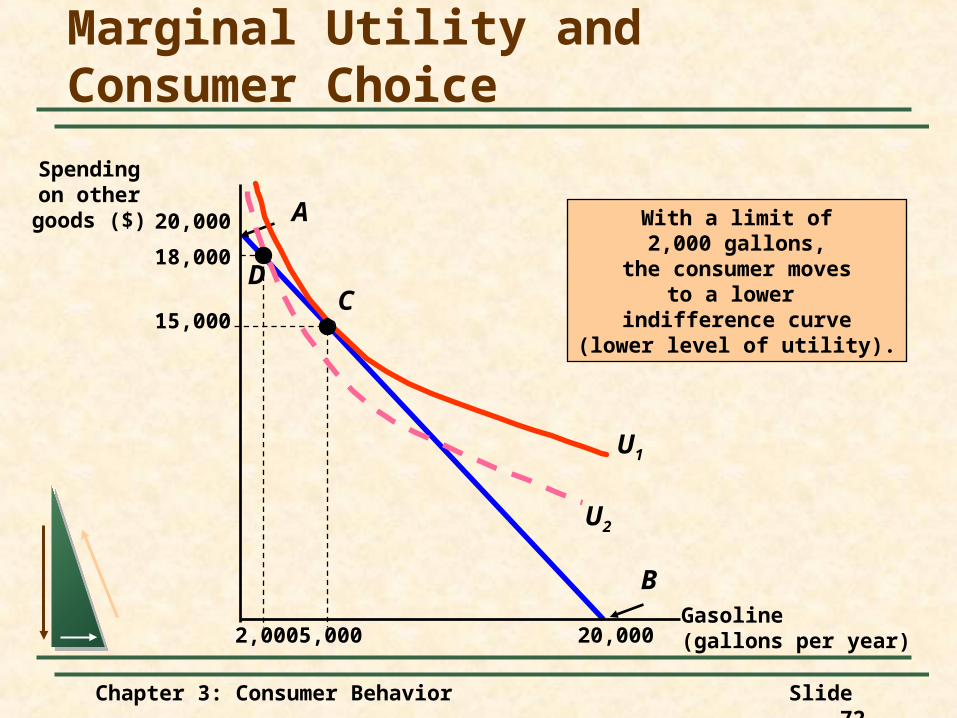
B
20,000
A
Gasoline(gallons per year)
Spendingon othergoods ($) 20,000
5,000
U1
C15,000
2,000
D
With a limit of2,000 gallons,
the consumer movesto a lower
indifference curve(lower level of utility).
18,000
U2
Marginal Utility andConsumer Choice


![[PPT]Consumer Behavior and Marketing Strategy - Lars … to CB.ppt · Web viewIntro to Consumer Behavior Consumer behavior--what is it? Applications Consumer Behavior and Strategy](https://static.documents.pub/doc/80x56/5af357b67f8b9a74448b60fb/pptconsumer-behavior-and-marketing-strategy-lars-to-cbpptweb-viewintro.jpg)


