Thomson Learning™ 4 I n the previous chapter, we reviewed the four basic financial statements that are contained in the annual report. This chapter deals with financial ratio analysis, which uses information contained in financial statements. Financial ratios are statistical yardsticks that relate two numbers generally taken from a firm’s income statement, balance sheet, or both. They enable interested parties to make relative comparisons of firm performance over time as well as compare performance across different firms. Evaluation of Firm Performance 4 chapter Chapter 4 • Evaluation of Firm Performance 91
Transcript
Thom
son
Learn
ing™4
In the previous chapter, we reviewed the four basic financial statements that arecontained in the annual report. This chapter deals with financial ratio analysis,which uses information contained in financial statements. Financial ratios are
statistical yardsticks that relate two numbers generally taken from a firm’s incomestatement, balance sheet, or both. They enable interested parties to make relativecomparisons of firm performance over time as well as compare performanceacross different firms.
Evaluation of FirmPerformance4
chapter
Chapter 4 • Evaluation of Firm Performance 91
92 Part 1 • Introduction
Thom
son
Learn
ing™
http:An excellent source for financial ratio analysis assistance, including a freeratio analysis spreadsheet, isprovided by the Small Busi-ness Administration at http://www.onlinewbc.gov/docs/finance/index.html
PURPOSE OF FINANCIAL RATIOSFinancial ratios are used by management for analysis, monitoring, and planningpurposes.
➢ As an analytical tool, financial ratios can assist management in identifyingstrengths and weaknesses in a firm. They can indicate whether a firm hasenough cash to meet obligations; a reasonable accounts receivable collectionperiod; an efficient inventory management policy; sufficient property, plant,and equipment; and an adequate capital structure—all of which are necessaryif a firm is to achieve the goal of maximizing shareholder wealth. Financialanalysis also can be used to assess a firm’s viability as an ongoing enterpriseand to determine whether a satisfactory return is being earned for the riskstaken.
➢ Financial ratios are also a useful monitoring device. On the basis of financial ra-tio analysis, management may uncover a problem in a certain area of thefirm’s operations and institute remedial action. Through a regular review ofrelevant financial ratios, management can monitor whether or not the reme-dial actions are working.
➢ Financial ratios provide a very effective role in planning. In Chapter 1 we saidthat the objective of every firm’s managers should be to maximize shareholderwealth. For this appropriate objective to be successful, it needs to be opera-tionalized. Financial ratios allow management to translate goals into opera-tional objectives. In other words, simply urging all employees to maximizeshareholder wealth will probably not be very effective. On the other hand, set-ting targets in terms of specific ratios, such as the average collection period orinventory turnover, will likely yield better results, because financial ratios arespecific, measurable, and easy to relate to.Financial ratio analyses are used also by persons other than financial man-
agers. For example, credit managers may examine some basic financial ratios con-cerning a prospective customer when deciding whether to extend credit. Securityanalysts and investors use financial analysis to help assess the investment worth ofdifferent securities. Bankers use the tools of financial analysis when decidingwhether to grant loans. Financial ratios have been used successfully to forecast suchfinancial events as impending bankruptcy. Unions, such as the United Auto Work-ers (UAW), refer to financial ratios when negotiating collective bargaining agree-ments with employers. Finally, students and other job hunters may perform finan-cial analyses of potential employers to determine career opportunities.
INTERPRETING FINANCIAL RATIOSA financial ratio is a relationship that indicates something about a firm’s activities,such as the ratio between the firm’s current assets and current liabilities or between
Chapter ObjectivesAfter reading this chapter, you should have an understanding of the following:
1. The usefulness of financial ratio analysis
2. How to calculate and interpret commonly used financial ratios
3. The limitations of financial ratio analysis
Thom
son
Learn
ing™
Chapter 4 • Evaluation of Firm Performance 93its accounts receivable and its annual sales. Financial ratios enable an analyst tomake a comparison of a firm’s financial condition over time or in relation to otherfirms. Ratios essentially standardize various elements of financial data for differ-ences in the size of a series of financial data when making comparisons over timeor between firms. For example, the total profits of IBM normally are many timesthose of Apple Computer, because IBM is much larger than Apple. By computingratios, such as net profits divided by total assets, the relative performance of the twocompanies can be assessed more accurately.
Successful financial ratio analysis requires that an analyst keep in mind the fol-lowing points:
➢ Any discussion of financial ratios is likely to include only a representative sam-ple of possible ratios. Many other ratios can be developed to provide addi-tional insights. In some industries (such as banking), an analyst will use specialratios unique to the activities of firms in those industries.
➢ Financial ratios serve only as “flags” indicating potential areas of strength orweakness. A thorough analysis requires the examination of other data as well.
➢ Frequently a financial ratio must be dissected to discover its true meaning. Forexample, a low ratio may be caused by either a low numerator or a high de-nominator. A good financial analyst will examine both the numerator and thedenominator before drawing any conclusions.
➢ A financial ratio is meaningful only when it is compared with some standard,such as an industry ratio trend, a ratio trend for the specific firm being ana-lyzed, or a stated management objective.
➢ When financial ratios are used to compare one firm with another, it is impor-tant to remember that differences in accounting techniques may result in sub-stantial differences in financial ratios. Failure to keep this in mind can lead toincorrect conclusions.
1. What are financial ratios?2. How does management use financial ratios for analysis, planning, and
monitoring?3. Why is it important to compare ratios to industry standards or over time?
BASIC CATEGORIES OF FINANCIAL RATIOSMuch as the human body is made up of different systems that are interconnected, suchas the circulatory system, the nervous system, the immune system, and so on, a firmalso is made up of different systems. To evaluate the efficient functioning of differentsystems within the body, a physician may order specific tests. For example, your doctormay order a stress test to see how well your heart is functioning, or she may ask for ablood test to check your immune system. Similarly, there are different groups of ratiosto evaluate different aspects of a firm’s operations. These ratio groupings include:
1. Liquidity ratios: indicate a firm’s ability to meet short-term financial obligations2. Asset management ratios: indicate how efficiently a firm is using its assets to gen-
erate sales3. Financial leverage management ratios: indicate a firm’s capacity to meet
short- and long-term debt obligations, and how risky is the firm’s financialstructure
Comprehension Check Questions
Thom
son
Learn
ing™
4. Profitability ratios: measure how effectively a firm’s management generatesprofits on sales, assets, and stockholders’ investments
5. Market-based ratios: measure the financial market’s evaluation of a company’sperformanceIt is important to keep in mind that it is not necessary to use all of these ratios
in performing a ratio analysis. Selection of the ratios to be examined will dependon the particular individual’s perspective and objectives. For example, suppliersand short-term creditors are likely to be most concerned with a firm’s current li-quidity and near-term cash-generating capacity. Bondholders and holders of pre-ferred stock, who have long-term claims on a firm’s earnings and assets, focus onthe firm’s cash-generating ability over the long run and on the claims other in-vestors have on the firm’s cash flows. Common stockholders and potential investorsare especially interested in measures of profitability and risk, because commonstock prices are dependent on the amount and stability of a firm’s future earnings,possible appreciation in value, and dividends. Management is concerned with allaspects of financial analysis, both short term and long term, because it is responsi-ble for conducting the firm’s day-to-day operations and earning a competitive rateof return for risks taken.
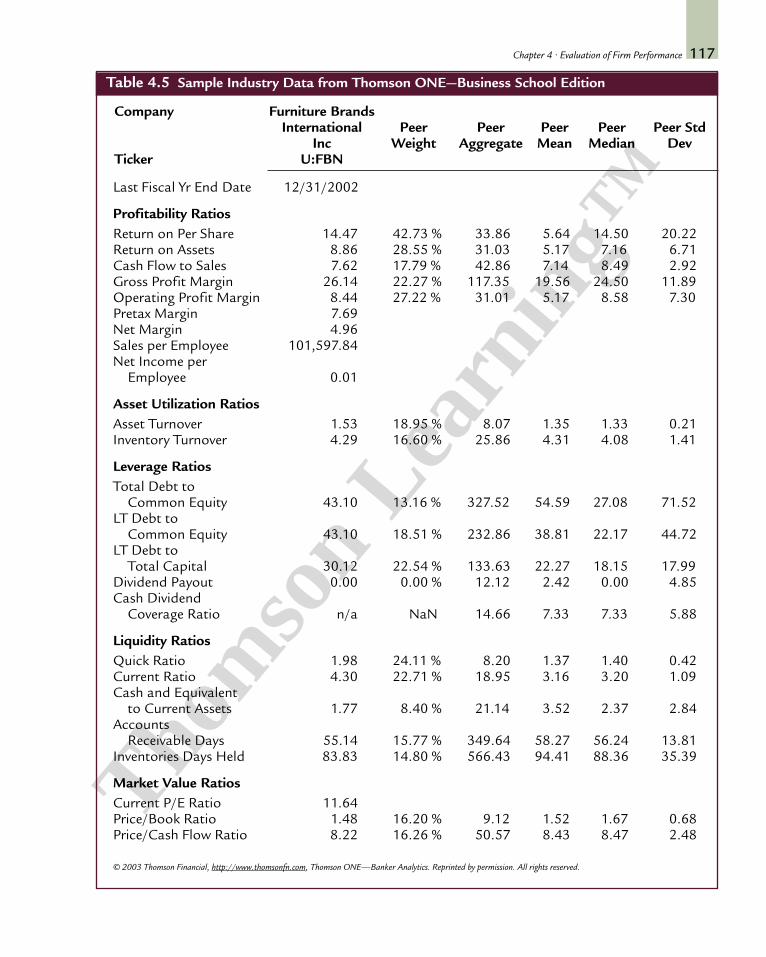
The calculation and interpretation of financial ratios is illustrated in this chap-ter by using the financial statements for Furniture Brands International Corpora-tion covered in Chapter 3. In interpreting the ratios for Furniture Brands we com-pare the ratios to an industry average. This is known as comparative analysis. We willalso conduct a trend analysis, where ratio trends over time are analyzed.
There are two ways to obtain an industry average. The first, and easier ap-proach, is to use an industry average calculated by a third-party source such as Stan-dard and Poor’s, Value Line, or Moody’s. The second is to construct your own in-dustry average. While useful, third-party sources of industry averages have certainlimitations associated with them:
1. How the industry is defined may be different from what is preferred by the ana-lyst. For example, Value Line defines the furniture industry to include manu-facturers of residential and commercial furniture and also includes certain sup-pliers (e.g., producers of upholstery fabric, coils and springs, etc.). As an analystyou may want to compare Furniture Brands to companies that are engaged pri-marily in the manufacture of residential furniture rather than commercial fur-niture as the two markets are characterized by fundamental differences. Pro-ducing and marketing chairs and desks for commercial offices is very differentfrom producing and marketing sofas and dining sets for the residential market.The profit margins, production methods, marketing plans, and distributionmechanisms differ considerably between the two markets. Consequently the fi-nancial ratios may be different for firms engaged in these two segments of thefurniture industry.
2. In the use of externally generated industry average ratios, the definition and cal-culation of ratios may vary. While the variations for the most part are slight, insome cases they could be significant. For example, some sources define debt ra-tio as including current liabilities and long-term liabilities; other sources definedebt ratio as including only long-term debt. The analyst must make sure that thedefinition he or she is employing for the firm being evaluated matches that usedin the computation of the industry average. For example, if the analyst calculatesthe debt ratio to include current liabilities and long-term debt, then the result-ing debt ratio may appear to be significantly higher than the industry average ifthe latter was based on long-term debt alone.
94 Part 1 • Introduction
Thom
son
Learn
ing™
Chapter 4 • Evaluation of Firm Performance 95
(4.1)
In view of the above limitations, we chose to construct our own furniture industryaverage ratios to serve as a benchmark for comparing Furniture Brands’ financialratios. The industry financial ratios are calculated by averaging the ratios for EthanAllen Interiors, La-Z-Boy, Bassett, Chromcraft, and Flexsteel—all firms that primar-ily manufacture residential furniture.
1. Are all ratios important for all users of ratios?2. What are the limitations of third-party industry average ratios?3. What is the difference between comparative and trend ratio analysis?
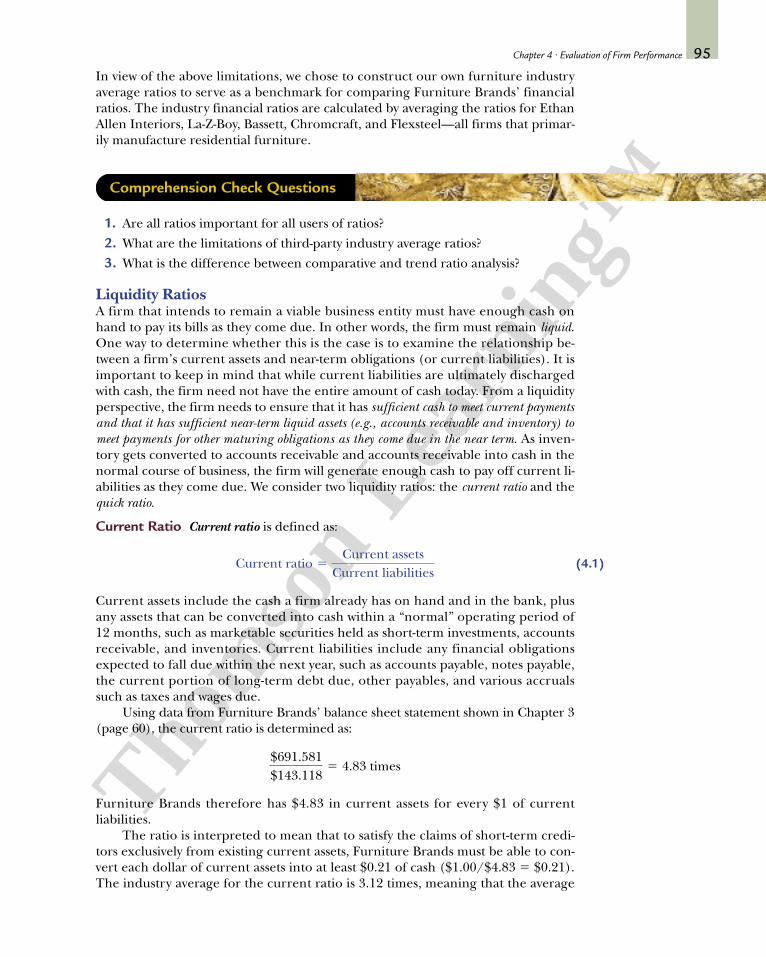
Liquidity RatiosA firm that intends to remain a viable business entity must have enough cash onhand to pay its bills as they come due. In other words, the firm must remain liquid.One way to determine whether this is the case is to examine the relationship be-tween a firm’s current assets and near-term obligations (or current liabilities). It isimportant to keep in mind that while current liabilities are ultimately dischargedwith cash, the firm need not have the entire amount of cash today. From a liquidityperspective, the firm needs to ensure that it has sufficient cash to meet current paymentsand that it has sufficient near-term liquid assets (e.g., accounts receivable and inventory) tomeet payments for other maturing obligations as they come due in the near term. As inven-tory gets converted to accounts receivable and accounts receivable into cash in thenormal course of business, the firm will generate enough cash to pay off current li-abilities as they come due. We consider two liquidity ratios: the current ratio and thequick ratio.
Current Ratio Current ratio is defined as:
Current assets include the cash a firm already has on hand and in the bank, plusany assets that can be converted into cash within a “normal” operating period of 12 months, such as marketable securities held as short-term investments, accountsreceivable, and inventories. Current liabilities include any financial obligationsexpected to fall due within the next year, such as accounts payable, notes payable,the current portion of long-term debt due, other payables, and various accrualssuch as taxes and wages due.
Using data from Furniture Brands’ balance sheet statement shown in Chapter 3(page 60), the current ratio is determined as:
Furniture Brands therefore has $4.83 in current assets for every $1 of currentliabilities.
The ratio is interpreted to mean that to satisfy the claims of short-term credi-tors exclusively from existing current assets, Furniture Brands must be able to con-vert each dollar of current assets into at least $0.21 of cash ($1.00/$4.83 5 $0.21).The industry average for the current ratio is 3.12 times, meaning that the average
$691.581$143.118
5 4.83 times
Current ratio 5Current assets
Current liabilities
Comprehension Check Questions
Thom
son
Learn
ing™
firm in the industry must convert $0.32 ($1.00/$3.12 5 $0.32) of each dollar ofcurrent assets into cash to meet short-term obligations. Thus, Furniture Brands’current ratio appears to be well above the industry average and hence less risky.
However, one must be careful in making any strong judgments without under-taking a more thorough analysis. A higher current ratio is not necessarily indicativeof better liquidity. For example, a higher current ratio may be due to greater inven-tory levels compared to the industry, which, in turn, could be indicative of the firmhaving trouble moving things “off the shelf.” The financial analyst must dissect, or“go behind,” the ratio to discover why it differs from the industry average and de-termine whether a serious problem exists.
Quick Ratio The quick ratio is defined as follows:
This ratio, sometimes called the “acid test,” is a more stringent measure of liquiditythan the current ratio. Sometimes the numerator of the quick ratio is defined sim-ply as the current ratio minus inventory. The quick ratio takes into account onlythe most liquid of current assets (defined as cash, marketable securities, andaccounts receivable) and eliminates all others (including inventory and prepaidexpenses) from consideration. By subtracting inventories from current assets, thisratio recognizes that a firm’s inventories are often one of its least liquid currentassets. This is, of course, more applicable to some industries than to others. For ex-ample, if you are an apparel manufacturer, the ability to liquidate your inventory atfair value is highly doubtful. On the other hand, if you manufacture a commodityproduct such as newsprint, you may have greater confidence in the value of the in-ventory, especially if the prices are stable. Referring to the figures on FurnitureBrands’ balance sheet, the firm’s quick ratio at year-end 2000 is calculated as:
The industry average is 1.75 times. Consistent with the current ratio, FurnitureBrands’ quick ratio is above the industry average and appears to be less risky.
Asset Management RatiosOne objective of financial management is to determine how a firm’s resources canbe best distributed among the various asset accounts. If a proper mix of cash, re-ceivables, inventories, property, plant, and equipment can be achieved, the firm’sasset structure will be more effective in generating sales revenue.
Asset management ratios indicate how much a firm has invested in a particulartype of asset (or group of assets) relative to the revenue the asset is producing. Bycomparing asset management ratios for the various asset accounts of a firm with establishedindustry norms, an analyst can determine how efficiently a firm is allocating its resources.
This section discusses several types of asset management ratios, including theaverage collection period, the inventory turnover ratio, the fixed-asset turnover ratio, andthe total asset turnover ratio.
Average Collection Period The average collection period is the average number ofdays an account receivable remains outstanding. It usually is determined by divid-ing a firm’s year-end receivables balance by the average daily credit sales (based ona 365-day year):
$14.606 1 $351.804$143.118
5$366.41$143.118
5 2.56 times
Quick ratio 5Cash 1 Marketable securities 1 Accounts receivable
Current liabilities
96 Part 1 • Introduction
(4.2)
Thom
son
Learn
ing™
Assuming all sales for Furniture Brands are for credit, the average collection pe-riod ratio at year-end 2000 can be calculated as $351.804/($2,116.239/365 days) 5$351.804/$5.798 per day 5 60.7 days. The industry average for this ratio is 49.4days. Furniture Brands’ ratio is well above the industry average. This may not nec-essarily be alarming. There may be legitimate reasons why the average collectionperiod for Furniture Brands is higher than the industry average. Some reasonswould be:
➢ The difference in ratios between Furniture Brands and the industry averagecould be due to differences in the credit terms offered by Furniture Brandsand the industry in general. Furniture Brands, for instance, may give their cus-tomers a longer time period—say, 60 days—to pay for the merchandise pur-chased, while the industry norm may call for a shorter credit term—say, 45 days. We don’t know this for sure, since this information is not always avail-able from the annual reports, but it is a possible explanation.
➢ The difference may be due to differences in the customer composition. Firmsin a given industry may operate in several different segments, each with theirown collection policies. For example, Ethan Allen, one of the larger compe-titors of Furniture Brands, sells a significant portion of its output throughcompany-owned outlets. Thus, Ethan Allen is both a manufacturer and a re-tailer, unlike Furniture Brands, which has no retail presence. Indeed, EthanAllen’s average collection period is only 14.6 days, which may explain why theindustry average we calculated is comparatively lower. Flexsteel, another firmin the industry, manufactures residential furniture but is also a major supplierof upholstered sofas and other furniture to the recreational vehicle market.The collection terms in that industry may be shorter than in the residentialfurniture market, again yielding a lower industry average.
Consequently, there are may be perfectly valid reasons why a firm may have ahigher-than-average collection period. This is where additional investigation isneeded. If Furniture Brands’ higher collection period does not have a sound basis,this could indicate problems with the firm’s credit terms and their collection effort.Assuming that there is a problem with the collections effort, an analyst could con-clude that by bringing the average collection period for Furniture Brands down tothe industry average of 49.4 days, the firm can release funds that are tied up inaccounts receivable. The released funds would amount to (60.7 days 2 49.4 days)3 $5.798 million average credit sales per day 5 $65.52 million. The firm can moreprofitably employ these funds elsewhere, for example, retiring long-term debtand/or adding to plant and equipment.
Inventory Turnover Ratio The inventory turnover ratio is defined as follows:
Whereas the cost of sales is usually listed on a firm’s income statement, the averageinventory has to be calculated. This can be done in a number of ways. For exam-ple, if a firm has been experiencing a significant and continuing rate of growth insales, the average inventory may be computed by adding the figures for the begin-ning and ending inventories for the year and dividing by 2. If sales are seasonal or
Inventory turnover 5Cost of sales
Average inventory
Average collection period 5Accounts receivable
Annual credit sales>365
Chapter 4 • Evaluation of Firm Performance 97
(4.4)
(4.3)
Thom
son
Learn
ing™
otherwise subject to wide fluctuations, however, it would be better to add themonth-end inventory balances for the entire year and divide by 12. However, ob-taining month-end inventory balances is a problem, as firms do not report these inthe annual reports. An alternative is to use quarterly balances from the quarterly fi-nancial statements, which most firms do provide.
Some analysts calculate inventory turnover as simply the ratio of annual salesto ending inventory. Although the sales-to-inventory ratio is technically inferior andgives results different from those of more commonly used ratios, it may be satis-factory if used consistently when making comparisons between one firm and theindustry as a whole. However, the problem with this ratio is that it tends to differfrom one firm to another, depending on policies regarding markups on the costof sales.
Since the furniture industry is not highly seasonal, we will use the beginningand end-of-the-year inventory balances to calculate average inventory. Note thatthe beginning inventory value is the same as the ending inventory balance for thepreceding year. For Furniture Brands, the average inventory balance is: ($294.454 1$285.395)/2 5 $289.925. Dividing the cost of sales by this figure, $1,529.874/$289.925, gives an inventory turnover ratio of 5.28 times. This compares with anaverage of 5.49 for the industry. The difference is probably not significant.
A very high or a very low inventory turnover ratio relative to the industry aver-age may have negative implications. A low inventory turnover ratio could be indica-tive of excessive inventory balances, or that some of the inventory is slow movingor even obsolete.
If a firm’s inventory turnover ratio is too high, it may mean the firm is fre-quently running out of certain items in stock and may be losing sales to competitors.In the 1980s Pratt and Whitney, a well-known manufacturer of jet engines, decidedto cut down on inventory of finished engines, resulting in disastrous market shareconsequences and profitability. Because downtime is costly for airline operators,they require ready availability of engines, if one has to be replaced. Airlines usingPratt and Whitney engines started experiencing longer downtimes because of ashortage of inventory with the jet engine maker. Consequently many of these air-lines took their business to other manufacturers, notably General Electric, whogained market share at the expense of Pratt and Whitney.
Fixed Asset Turnover Ratio The fixed asset turnover ratio is defined as follows:
It indicates the extent to which a firm is utilizing existing property, plant, andequipment to generate sales. It is important to note that this ratio is especially vul-nerable to a number of factors that may influence the value of net fixed assets inthe denominator. The balance sheet figures that indicate how much a firm has in-vested in property, plant, and equipment are affected by the following:
➢ The cost of the assets when acquired. If the firm came into existence manyyears ago, its cost basis would be lower than that of another firm that startedoperations more recently.
➢ The depreciation policies adopted by the firm. An accelerated depreciationpolicy compared to a straight-line depreciation policy will cause net fixed as-sets to decrease more rapidly with time.
➢ The extent to which fixed assets are leased rather than owned.
Fixed asset turnover 5Sales
Net fixed assets
98 Part 1 • Introduction
(4.5)
Thom
son
Learn
ing™
➢ The choice of technology. Two firms in the same industry, producing similarproducts, may adopt different technologies; one firm may rely on a consider-able level of automation, while another firm may adopt a more labor-intensivemanufacturing process. Also some firms may rely more heavily on subcontrac-tors to do part of the manufacturing, consequently reducing the amount of in-vestment needed in property, plant, and equipment.Because of these factors, it is possible for firms manufacturing virtually identi-
cal products to have significantly different fixed asset turnover ratios. Thus, the ra-tio should be used primarily for year-to-year comparisons within the same company,rather than for intercompany comparisons.
Furniture Brands fixed asset turnover ratio is $2,116.239/$303.235 5 6.98times, slightly above the industry average of 6.3 times.
Total Asset Turnover Ratio The total asset turnover ratio is defined as follows:
It indicates how effectively a firm uses its total resources to generate sales and is asummary measure influenced by each of the asset management ratios previouslydiscussed.
Furniture Brands’ total asset turnover ratio is $2,116.239/$1,304.838 5 1.62times, almost identical to the industry average of 1.63.
1. What is the rationale for computing the quick ratio?2. Is a lower average collection period more desirable than a higher one? Explain.3. What are some problems with the fixed asset turnover ratio?
Financial Leverage Management RatiosWhenever a firm finances a portion of its assets with any type of fixed-charge fi-nancing—such as debt, preferred stock, or leases—the firm is said to be usingfinancial leverage. Financial leverage management ratios measure the degree to which afirm is employing financial leverage and, as such, are of interest to creditors and ownersalike.
Both long- and short-term creditors are concerned with the amount of lever-age a firm employs, because it indicates the firm’s risk exposure in meeting debtservice charges (that is, interest and principal repayment). A firm that is heavily fi-nanced by debt offers creditors less protection in the event of bankruptcy. For ex-ample, if a firm’s assets are financed with 85 percent debt, the value of the assetscan decline by only 15 percent before creditors’ funds are endangered. In contrast,if only 15 percent of a firm’s assets are debt-financed, asset values can drop by 85percent before jeopardizing the creditors.
Owners are interested in financial leverage because it influences the rate of re-turn they can expect to realize on their investment and the degree of risk involved.For example, if a firm is able to borrow funds at 9 percent and employ them at 12percent, the owners earn the 3 percent difference and may view financial leveragefavorably. On the other hand, if the firm can earn only 3 percent on the borrowed
Total asset turnover 5Sales
Total assets
Chapter 4 • Evaluation of Firm Performance 99
(4.6)
Comprehension Check Questions
Thom
son
Learn
ing™
funds, the 26 percent difference (3% 2 9%) will result in a lower rate of return tothe owners.
Either balance sheet or income statement data can be used to measure a firm’suse of financial leverage. The balance sheet approach gives a static measure of finan-cial leverage at a specific point in time and emphasizes total amounts of debt,whereas the income statement approach provides a more dynamic measure and re-lates required interest payments on debt to the firm’s ability to pay. Both approachesare employed widely in practice.
There are several types of financial leverage management ratios, including thedebt ratio, the debt-to-equity ratio, the times interest earned ratio, and the fixed-charge coverage ratio.
Debt Ratio The debt ratio is defined as follows:
It measures the proportion of a firm’s total assets that is financed with credi-tors’ funds. As used here, the term debt encompasses all short-term liabilities andlong-term liabilities. Some individuals prefer to use a narrower definition of debtand consider only interest-charging liabilities such as long-term debt or bonds,notes payable, and lines of credit.
Bondholders and other long-term creditors are among those likely to be inter-ested in a firm’s debt ratio. They tend to prefer a low debt ratio, because it providesmore protection in the event of liquidation or some other major financial problem.As the debt ratio increases, so do a firm’s fixed-interest charges. If the debt ratiobecomes too high, the cash flows a firm generates during economic recessions maynot be sufficient to meet interest payments. Thus, a firm’s ability to market newdebt obligations when it needs to raise new funds is crucially affected by the size ofthe debt ratio and by investors’ perceptions about the risk implied by the level ofthe ratio.
Debt ratios are stated in terms of percentages. Furniture Brands’ debt ratio asof year-end 2000 is ($143.118 1 $462.000 1 $115.815)/$1,304.838 5 $720.933/$1,304.838 5 0.55251, or about 55 percent. The numerator is the sum of all cur-rent liabilities, long-term debt, and other long-term liabilities. The ratio is inter-preted to mean that Furniture Brands’ creditors are financing 55 percent of thefirm’s total assets. Furniture Brands’ debt ratio is considerably greater than the 32 percent industry average. Evidently Furniture Brands’ management has reliedon debt to a much greater extent than does the industry on average in financing as-sets. The high leverage ratio also means that shareholders of Furniture Brands maybe subject to significantly greater bankruptcy risk than other firms in the industry.
Debt-to-Equity Ratio The debt-to-equity ratio is defined as follows:
It is similar to the debt ratio and relates the amount of a firm’s debt financing tothe amount of equity financing. Actually, the debt-to-equity ratio is not really a newratio; it is simply the debt ratio in a different format. The debt-to-equity ratio also isstated as a percentage. Furniture Brands’ debt-to-equity ratio at year-end 2000 is$720.933/$583.905 5 1.235, or 123.5 percent. The industry average is 48 percent.In other words, the average firm in the industry raised approximately $0.48 in lia-
Debt-to-equity 5Total debt
Total equity
Debt ratio 5Total debtTotal assets
100 Part 1 • Introduction
(4.7)
(4.8)
Thom
son
Learn
ing™
bilities for each dollar of equity in the firm. In contrast, Furniture Brands uses$1.24 of liabilities for every dollar of equity financing. This shows that FurnitureBrands has been following a very aggressive financing policy and probably has littleflexibility in terms of future borrowing capacity. From the perspective of creditors,it means that Furniture Brands is probably not a good credit risk relative to theaverage firm in the industry, and creditors either would not be eager to lend to Fur-niture Brands or would do so only by charging higher interest rates than for theaverage firm in the industry.
Because most interest costs are incurred on long-term borrowed funds(greater than 1 year to maturity) and because long-term borrowing places multi-year, fixed financial obligations on a firm, some analysts also consider the ratio oflong-term debt-to-total assets, or long-term-debt-to-equity. For Furniture Brands the long-term-debt-to-total-assets ratio is 35.4 percent. The comparable industry average is9.2 percent. The long-term-debt-to-equity ratio for Furniture Brands is 79.1 per-cent. The corresponding industry average is 14.6 percent. These figures once againconfirm the aggressive financing policy of Furniture Brands. Some analysts con-sider all noncurrent liabilities as long-term debt, in our calculations we only con-sider liabilities identified as long-term debt.
Times Interest Earned Ratio The times interest earned (TIE) ratio is defined as follows:
Often referred to as simply interest coverage, this ratio employs income statementdata to measure a firm’s use of financial leverage. It tells the analyst the extent towhich the firm’s current earnings are able to meet current interest payments. TheEBIT figures are used because the firm makes interest payments out of operatingincome, or EBIT. When the times interest earned ratio falls below 1.0, the contin-ued viability of the enterprise is threatened because the failure to make interestpayments when due can lead to bankruptcy.
From Furniture Brands’ income statement we note that the company incurredinterest expense of $36.389 million in 2000. The firm’s operating earning or EBITwas $192.614 million. In other words, Furniture Brands covers annual interestpayments 5.29 times; this figure is significantly below the industry average of 31.8 times. It is clear from the debt, debt-to-equity, and times interest earned ratiosthat Furniture Brands has followed an aggressive financing policy.
Fixed-Charge Coverage Ratio The fixed-charge coverage ratio is defined as follows:
It measures the number of times a firm is able to cover total fixed charges, which in-clude (in addition to interest payments) preferred dividends and payments re-quired under long-term lease contracts. Many corporations also are required tomake sinking fund payments on bond issues; these are annual payments aimed ateither retiring a portion of the bond obligation each year or providing for the ulti-mate redemption of bonds at maturity. Under most sinking fund provisions, thefirm either may make these payments to the bondholders’ representative (thetrustee), who determines through a lottery process which of the outstanding bondswill be retired, or deliver to the trustee the required number of bonds purchased
Fixed-charge coverage 5(EBIT) 1 lease payments
Interest 1 lease payments 1 preferreddividends before tax 1 before tax sinking fund
Times interest earned 5Earnings before interest and taxes (EBIT)
Interest charges
Chapter 4 • Evaluation of Firm Performance 101
(4.9)
(4.10)
Thom
son
Learn
ing™
by the firm in the open market. Either way, the firm’s outstanding indebtedness isreduced.
In calculating the fixed-charge coverage ratio, an analyst must consider eachof the firm’s obligations on a before-tax basis. However, because sinking fund pay-ments and preferred stock dividends are not tax deductible and therefore must bepaid out of after-tax earnings, a mathematical adjustment has to be made. After-taxpayments must be divided by (1 2 T), where T is the marginal tax rate. This effec-tively converts such payments to a before-tax basis, or one that is comparable to theEBIT. And, since lease payments are deducted in arriving at the EBIT, they must beadded back into the numerator of the ratio, because the fixed charges (in the de-nominator) also include lease payments.
The fixed-charge coverage ratio is a more severe measure of a firm’s ability tomeet fixed financial obligations. It is not always easy to calculate the fixed-chargecoverage ratio because information, especially on lease payments and sinking fundpayments, is not always readily available from the financial statements. For Furni-ture Brands, the notes to the financial statements reveal that the firm incurredlease payments of $18.514 million in 2000 and that there were no sinking fund pay-ments. From the balance sheet we know that the firm did not have any preferredshares outstanding, therefore no preferred dividends were paid out. Using thesenumbers, Furniture Brands’ fixed-charge coverage ratio is: ($192.614 1 $18.514)/($36.389 1 $18.514) 5 $211.128/$54.903 5 3.8 times. We do not have a compara-ble industry average, as the necessary information was not available in the financialstatements for all five firms used in constructing the industry average.
Profitability RatiosMore than any other accounting measure, a firm’s profits demonstrate how wellthe firm is making investment and financing decisions. If a firm is unable to pro-vide adequate returns in the form of dividends and share price appreciation to in-vestors, it may be unable to maintain, let alone increase, its asset base. Profitabilityratios measure how effectively a firm’s management is generating profits on sales, total assets,and, most importantly, stockholders’ investment. Therefore, anyone whose economic in-terests are tied to the long-run survival of a firm will be interested in profitabilityratios.
There are several types of profitability ratios, including the gross profit marginratio, the net profit margin ratio, the return on investment ratio, and the return on stock-holders’ equity ratio.
Gross Profit Margin Ratio The gross profit margin ratio is defined as follows:
It measures the relative profitability of a firm’s sales after the cost of sales has beendeducted, thus revealing how effectively the firm’s management is making deci-sions regarding pricing and the control of production costs. Furniture Brands’gross profit margin ratio is ($2,116.239 2 $1,529.874)/$2,116.239 5 27.7%, whichis in line with the industry average of 27.2 percent. This percentage indicates thatFurniture Brands’ cost of production is consistent with the industry’s experience.
Net Profit Margin Ratio The net profit margin ratio is defined as follows:
Net profit margin 5Earnings after tax (EAT)
Sales
Gross profit margin 5Sales 2 Cost of sales
Sales
102 Part 1 • Introduction
(4.11)
(4.12)
Thom
son
Learn
ing™
It measures how profitable a firm’s sales are after all expenses, including taxes and interest, have been deducted. Furniture Brands’ net profit margin ratio is$105.901/$2,116.239 5 5.0%, which is below the industry average of 5.70 percent.Since the gross profit margin was nearly identical to the industry, the below-averagenet profit margin is indicative of above-average operating expenses and/or interestexpenses. We noted previously that Furniture Brands relies heavily on debt financ-ing, which entails significant interest expense. The significant interest expense as-sociated with the high debt ratio appears to have depressed Furniture Brands’ netprofit margin relative to the industry average.
Some analysts also compute an operating profit margin ratio, defined as earningsbefore interest and taxes (EBIT) or operating earnings/sales. It measures the prof-itability of a firm’s operations before considering the effects of financing decisions.Because the operating profit margin is computed before considering interestcharges, this ratio often is more suitable for comparing the profit performance ofdifferent firms that may utilize varying amounts of debt financing.
Return on Investment (Total Assets) Ratio The return on investment ratio (ROI)is defined as follows:
It measures a firm’s net income in relation to the total asset investment. FurnitureBrands’ return on investment ratio, $105.901/$1,304.838, is 8.1 percent, which issomewhat below the industry average of 9.4 percent and consistent with the below-average net profit margin for the firm.
Some analysts also like to compute the ratio of EBIT to total assets (EBIT/TotalAssets). This measures the operating profit rate of return for a firm. An after-taxversion of this ratio is earnings before interest and after tax (EBIAT) divided bytotal assets. These ratios are computed before interest charges and may be moresuitable when comparing the operating performance of two or more firms that arefinanced differently. Another variant of the operating performance ratio is theratio of earnings before interest, depreciation, and amortization (EBITDA)/totalassets. Many analysts prefer the EBITDA/total assets, since noncash expenses (de-preciation and amortization expense) are ignored, giving a measure of operatingprofits that is based more on cash flows.
Return on Stockholders’ Equity Ratio The return on stockholders’ equity ratio(ROE) is defined as follows:
It measures the rate of return that the firm earns on stockholders’ equity. Becauseonly the stockholders’ equity appears in the denominator, the ratio is influenced di-rectly by the amount of debt a firm is using to finance assets. Furniture Brands’ returnon stockholders’ equity ratio is $105.901/$583.905 5 18.1%. The comparable indus-try average is 13.7 percent. Furniture Brands’ above-average performance on returnon stockholders’ equity but not on return on investments is attributable to the heavydebt load taken on by the firm. With relatively higher debt financing, the firm is ableto spread its net income over a smaller base of stockholders’ equity, thereby increas-ing the return on stockholders’ equity. (In a later section we will explain the relationbetween return on investment and return on stockholder’s equity more completely.)
Return on stockholders’ equity 5Earnings after tax (EAT)
Stockholders’ equity
Return on investment 5Earnings after tax (EAT)
Total assets
Chapter 4 • Evaluation of Firm Performance 103
(4.14)
(4.13)
Thom
son
Learn
ing™
Market-based RatiosThe financial ratios discussed in the previous four groups all are derived from ac-counting income statement and balance sheet information provided by the firm.Market-based ratios provide an assessment of performance as perceived by the financial mar-ket. The market-based ratios for a firm should parallel the accounting ratios of thatfirm. For example, if the accounting ratios suggest that the firm has more risk thanthe average firm in the industry and has lower profit prospects, this informationshould be reflected in a lower market price of that firm’s stock.
Price-to-Earnings (P/E) Ratio The price-to-earnings ratio (P/E) is defined as follows:
(Some security analysts use next year’s projected earnings per share in the denomi-nator; this is called a forward P/E. There is nothing wrong with this alternative def-inition as long as comparisons between firms are done on the same basis.)
In general, the lower a firm’s risk, the higher its P/E ratio should be. In addition, thebetter the growth prospects of its earnings, the greater is the P/E multiple. For example,Merck & Co., a major drug company facing a number of patent expirations and,therefore, questionable growth prospects, had a P/E multiple of approximately 18in mid-2003. In contrast, Abbott Laboratories, another major player in the drug in-dustry that did not face the same risk of lower growth prospects as Merck, enjoyeda P/E multiple of approximately 27 in mid-2003.
Furniture Brands’ current (2000) earnings per share is $2.03 (net earnings of$105.901 million divided by the 52.277 million shares outstanding reported in thestockholders’ equity portion of the balance sheet). Note that this is different fromthe basic earnings per share of $2.10 and diluted earnings per share of $2.14 re-ported at the bottom of Furniture Brands’ income statement. Both the basic anddiluted earnings per share measures are based on accounting conventions that takeinto account shares outstanding over the course of the year, adjustments for stockrepurchases, and adjustments for the dilutive effects of convertible securities andstock options (Furniture Brands does not have any convertible securities but doeshave stock options outstanding). The measure of earnings per share we calculatesimply divides the net income to common shareholders by the actual number ofshares issued as reported in the balance sheet; this is common practice among fi-nancial analysts. Furniture Brands’ year-end closing price was $21.0625 per share.The price is for December 29, 2000, the last day of trading in the year 2000. Divid-ing the market price per share by the earnings per share yields Furniture Brands’P/E ratio of 10.4 times ($21.06/$2.03). Furniture Brands’ P/E ratio is about thesame as the industry average of 10.0 times. This suggests that the market’s assess-ment of Furniture Brands’ stock is about the same as the industry average.
As a supplement to the price-to-earnings ratio, financial analysts sometimesalso examine a firm’s stock-price-to-free-cash-flow ratio. Free cash flow represents theportion of a firm’s total cash flow available to pay common stock dividends, to in-vest in other projects (e.g., capital expenditures and/or acquisition of other com-panies), and to service additional debt. Free cash flow often is viewed as a bettermeasure than earnings of the financial soundness of a firm. Earnings data some-times can be misleading because accounting rules give companies discretion insuch areas as the recognition of revenues that have not been received and the allo-cation of costs over different time periods. For example, Integrated Resources andTodd Shipyards had good earnings, but had negative cash flow and were forced tofile for bankruptcy.
P>E 5Market price per share
Current earnings per share
104 Part 1 • Introduction
(4.15)
Thom
son
Learn
ing™
Market-to-Book Value or Price-to-Book Value (P/BV) Ratio The market-to-bookor price-to-book ratio is defined as follows:
Generally, the higher the rate of return a firm is earning on its common equity rel-ative to the return required by investors (the cost of common equity), the higherwill be the P/BV ratio.
The book value per share of common stock is determined by dividing the totalcommon stockholders’ equity for a firm by the number of shares outstanding. Inthe case of Furniture Brands at year-end 2000, the book value per share is equal to$11.17 (common stockholders’ equity of $583.905 million divided by 52.277 mil-lion shares outstanding). With a market price per share of $21.0625, the market-to-book ratio for Furniture Brands is 1.89 ($21.06/$11.17). Furniture Brands’ P/BVratio is considerably better than the industry average of 1.33. It should be notedthat, because the market-to-book ratio contains the book value of the commonstockholders’ equity in the denominator (remember that, for firms with no pre-ferred stock, common stockholders’ equity is equal to total assets minus total liabil-ities), it is affected by the accounting treatments used by a firm in such crucial ar-eas as inventory valuation and depreciation. For this reason, comparisons betweenfirms often can be misleading.
In general the P/E and P/BV ratios for Furniture Brands compare favorably tothe industry average. The better-than-average market-based ratios may be surpris-ing in view of the higher-than-average debt ratios. Evidently the market thinks thatthe risk associated with the higher-than-average debt ratios may be offset by otherpositive factors. For example, growth prospects for Furniture Brands may be betterthan for other competitors.
1. How are the debt and debt-to-equity ratios different from times interestearned and fixed-charge coverage ratios?
2. Can the net profit margin of a firm decline over time, while the gross marginincreases or stays the same? Explain.
3. What do the market-based ratios measure that is not captured in the otherfour categories of ratios?
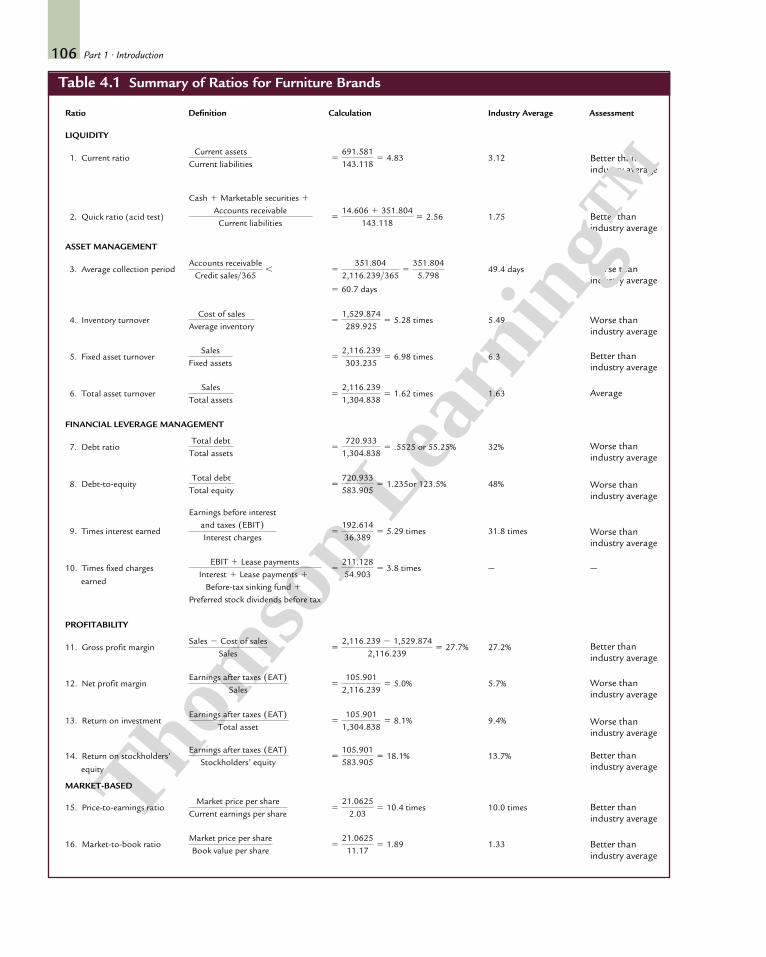
Summary of Financial Ratio AnalysisTable 4.1 lists all the financial ratios calculated for Furniture Brands along with thecorresponding industry average (see the assessment column on the right of thetable). For example, the firm’s liquidity ratios are ranked above average relative toindustry measures. With respect to asset management ratios, the average collectionperiod appears to be significantly worse than the industry average and the inven-tory turnover ratio is also below average. However, the fixed asset turnover ratio isbetter than the industry average, while the total asset turnover ratio is about thesame as the industry average.
The financial leverage position of the firm is of concern, given that they appearto be significantly greater than the industry average. This is apparent from themuch-higher-than-average debt and debt-to-equity ratios and the much-lower-than-average times interest earned ratio. The firm has been following a rather aggressive
P>BV 5Market price per shareBook value per share
Chapter 4 • Evaluation of Firm Performance 105
(4.16)
Comprehension Check Questions
Table 4.1 Summary of Ratios for Furniture Brands
Better than industry average
Better than industry average
Worse than industry average
Worse than industry average
Better than industry average
Average
Worse than industry average
Worse than industry average
Worse than industry average
—
Better than industry average
Worse than industry average
Worse than industry average
Better than industry average
Better than industry average
Better thanindustry average
earned
equity
Thom
son
Learn
ing™
106 Part 1 • Introduction
Ratio Definition Calculation Industry Average Assessment
LIQUIDITY
1. Current ratio 3.12
2. Quick ratio (acid test) 1.75
ASSET MANAGEMENT
3. Average collection period 49.4 days
4. Inventory turnover 5.49
5. Fixed asset turnover 6.3
6. Total asset turnover 1.63
FINANCIAL LEVERAGE MANAGEMENT
7. Debt ratio 32%
8. Debt-to-equity 48%
9. Times interest earned 31.8 times
10. Times fixed charges —
PROFITABILITY
11. Gross profit margin 27.2%
12. Net profit margin 5.7%
13. Return on investment 9.4%
14. Return on stockholders’ 13.7%
MARKET-BASED
15. Price-to-earnings ratio 10.0 times
16. Market-to-book ratio 1.33521.0625
11.175 1.89
Market price per shareBook value per share
521.0625
2.035 10.4 times
Market price per shareCurrent earnings per share
5105.901583.905
5 18.1%Earnings after taxes (EAT)
Stockholders’ equity
5105.901
1,304.8385 8.1%
Earnings after taxes (EAT)Total asset
5105.901
2,116.2395 5.0%
Earnings after taxes (EAT)Sales
52,116.239 2 1,529.874
2,116.2395 27.7%
Sales 2 Cost of salesSales
5211.12854.903
5 3.8 timesEBIT 1 Lease payments
Interest 1 Lease payments 1
Before-tax sinking fund 1
Preferred stock dividends before tax
5192.61436.389
5 5.29 times
Earnings before interestand taxes (EBIT)Interest charges
5720.933583.905
5 1.235or 123.5%Total debt
Total equity
5720.933
1,304.8385 .5525 or 55.25%
Total debtTotal assets
52,116.2391,304.838
5 1.62 timesSales
Total assets
52,116.239303.235
5 6.98 timesSales
Fixed assets
51,529.874289.925
5 5.28 timesCost of sales
Average inventory
5 60.7 days
5351.804
2,116.239>3655
351.8045.798
Accounts receivableCredit sales>365
,
514.606 1 351.804
143.1185 2.56
Cash 1 Marketable securities 1
Accounts receivableCurrent liabilities
5691.581143.118
5 4.83Current assets
Current liabilities
Thom
son
Learn
ing™
Chapter 4 • Evaluation of Firm Performance 107
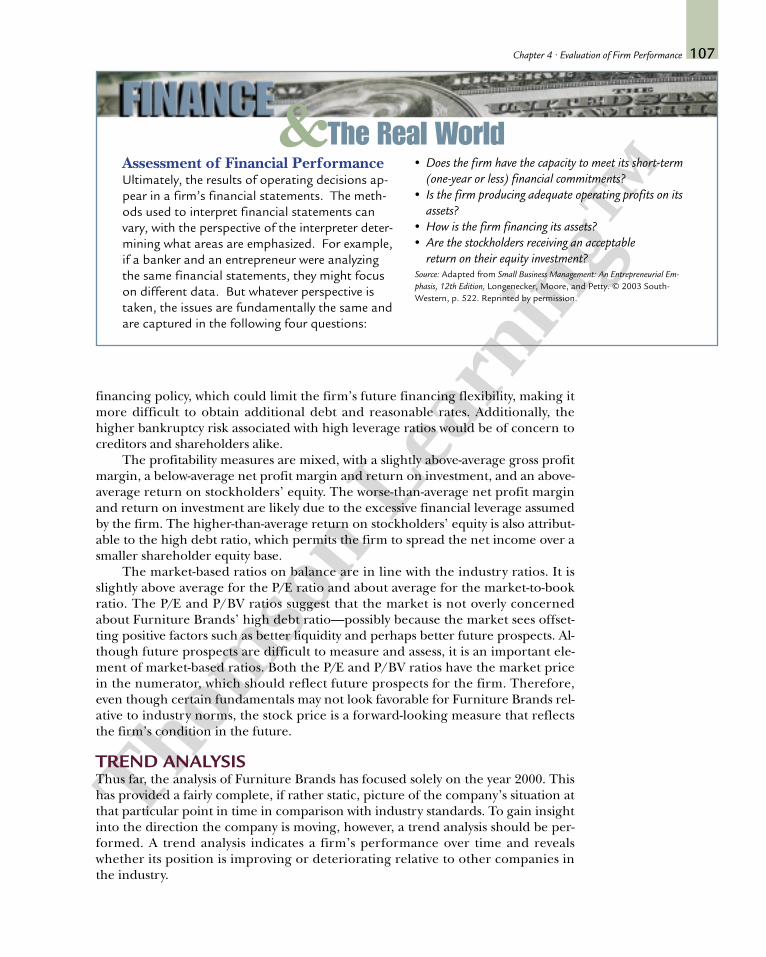
&The Real WorldAssessment of Financial PerformanceUltimately, the results of operating decisions ap-pear in a firm’s financial statements. The meth-ods used to interpret financial statements canvary, with the perspective of the interpreter deter-mining what areas are emphasized. For example,if a banker and an entrepreneur were analyzingthe same financial statements, they might focuson different data. But whatever perspective istaken, the issues are fundamentally the same andare captured in the following four questions:
• Does the firm have the capacity to meet its short-term(one-year or less) financial commitments?
• Is the firm producing adequate operating profits on itsassets?
• How is the firm financing its assets?• Are the stockholders receiving an acceptable
financing policy, which could limit the firm’s future financing flexibility, making itmore difficult to obtain additional debt and reasonable rates. Additionally, thehigher bankruptcy risk associated with high leverage ratios would be of concern tocreditors and shareholders alike.
The profitability measures are mixed, with a slightly above-average gross profitmargin, a below-average net profit margin and return on investment, and an above-average return on stockholders’ equity. The worse-than-average net profit marginand return on investment are likely due to the excessive financial leverage assumedby the firm. The higher-than-average return on stockholders’ equity is also attribut-able to the high debt ratio, which permits the firm to spread the net income over asmaller shareholder equity base.
The market-based ratios on balance are in line with the industry ratios. It isslightly above average for the P/E ratio and about average for the market-to-bookratio. The P/E and P/BV ratios suggest that the market is not overly concernedabout Furniture Brands’ high debt ratio—possibly because the market sees offset-ting positive factors such as better liquidity and perhaps better future prospects. Al-though future prospects are difficult to measure and assess, it is an important ele-ment of market-based ratios. Both the P/E and P/BV ratios have the market pricein the numerator, which should reflect future prospects for the firm. Therefore,even though certain fundamentals may not look favorable for Furniture Brands rel-ative to industry norms, the stock price is a forward-looking measure that reflectsthe firm’s condition in the future.
TREND ANALYSISThus far, the analysis of Furniture Brands has focused solely on the year 2000. Thishas provided a fairly complete, if rather static, picture of the company’s situation atthat particular point in time in comparison with industry standards. To gain insightinto the direction the company is moving, however, a trend analysis should be per-formed. A trend analysis indicates a firm’s performance over time and revealswhether its position is improving or deteriorating relative to other companies inthe industry.
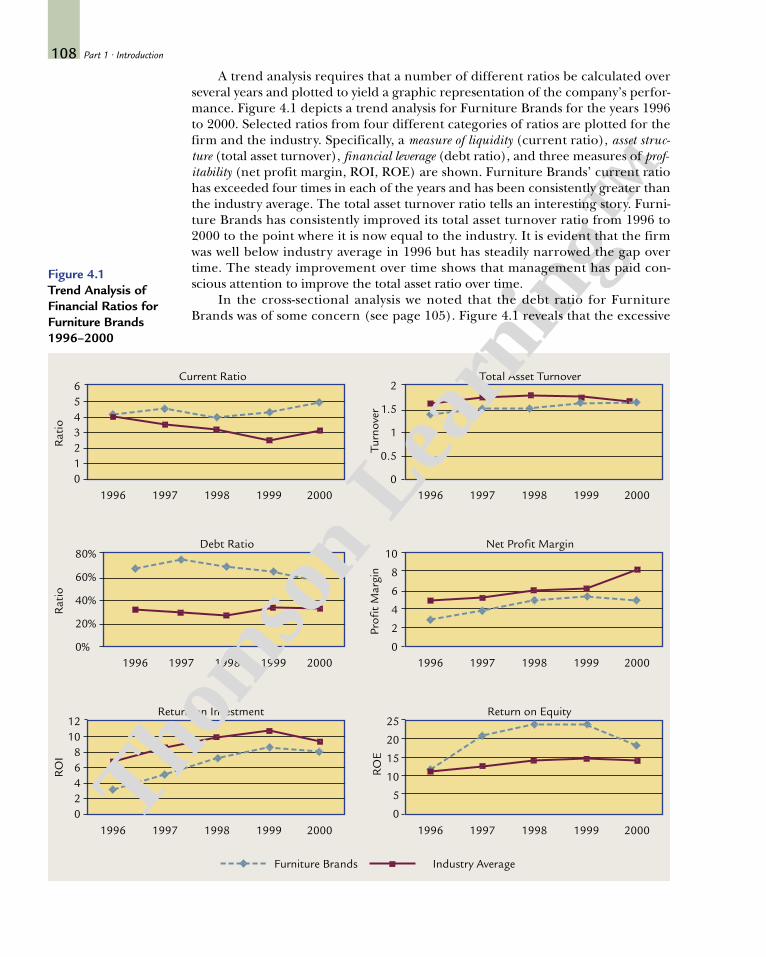
A trend analysis requires that a number of different ratios be calculated overseveral years and plotted to yield a graphic representation of the company’s perfor-mance. Figure 4.1 depicts a trend analysis for Furniture Brands for the years 1996to 2000. Selected ratios from four different categories of ratios are plotted for thefirm and the industry. Specifically, a measure of liquidity (current ratio), asset struc-ture (total asset turnover), financial leverage (debt ratio), and three measures of prof-itability (net profit margin, ROI, ROE) are shown. Furniture Brands’ current ratiohas exceeded four times in each of the years and has been consistently greater thanthe industry average. The total asset turnover ratio tells an interesting story. Furni-ture Brands has consistently improved its total asset turnover ratio from 1996 to2000 to the point where it is now equal to the industry. It is evident that the firmwas well below industry average in 1996 but has steadily narrowed the gap overtime. The steady improvement over time shows that management has paid con-scious attention to improve the total asset ratio over time.
In the cross-sectional analysis we noted that the debt ratio for FurnitureBrands was of some concern (see page 105). Figure 4.1 reveals that the excessive
Thom
son
Learn
ing™
debt ratio appears to have been a problem for some time. While the industry av-erage debt ratio appears to be stable around 30 percent, Furniture Brands’ ratiowas as high as about 75 percent in 1997. However, management has been awareof the high debt ratio as revealed by the firm’s attempt to steadily pare down thedebt ratio from the high of 75 percent to approximately 55 percent in 2000. Thenet profit margin for the firm has improved steadily over time but is still belowthe industry average, which also has improved steadily over time (with the slightexception of the last year). The below-average net profit margin performance ofFurniture Brands is likely due to the higher interest costs experienced by the firmas a result of the high debt ratios. Note that the improvement in net profit mar-gin over time is associated with the decrease in the debt ratio over time. Consis-tent with the trend analysis of the net profit margin ratio, Furniture Brands’ re-turn on investment has been below the industry average but is significantlyimproved over time.
The final ratio we examine is the return on stockholders’ equity. Unlike theother two profitability measures examined, net profit margin and return on invest-ments, Furniture Brands compares very favorably with the industry over time withrespect to return on stockholders’ equity. The firm has consistently exceeded theindustry average in each of the five years although the gap has narrowed in the lastyear.
In summary, the comparative financial ratio analysis combined with the trendanalysis provide the financial analyst with a fairly clear picture of Furniture Brands’performance. The firm’s liquidity is above average as revealed by the current andquick ratios. The asset management ratios are on par with the industry althoughthe average collection period was of some concern. The financial leverage ratiossuggest that the firm has an excessively high debt ratio and low interest coverageratio. However, the trend analysis reveals that the firm has been steadily paringdown the debt ratio and in time may reach the industry average. The profitabilitymeasures are mixed. The gross profit margin is just above the industry average, im-plying that the cost of production for Furniture Brands is competitive with the in-dustry. The net profit margin and return on investment are below the industry av-erages—probably a result of the high debt ratio assumed by the firm. The trendanalysis reveals that both the net profit margin and the return on investments haveimproved over time coinciding with the steady decline in the debt ratios and corre-sponding decrease in interest costs over time. The return on stockholders’ equityhas consistently beaten industry averages. Finally, the market-based ratios revealthat the firm’s stock is viewed favorably relative to the industry average as revealedin the P/E and P/BV ratios.
ANALYSIS OF PROFITABILITY: A COMPREHENSIVE FRAMEWORKThe ROI and ROE profitability ratios discussed above can be broken down intotheir constituent elements. Doing so gives us a better understanding of how differ-ent factors combine to determine the overall profitability of the firm.
Return on InvestmentWe had previously defined the return on investment (ROI) as the ratio of earnings af-ter taxes (EAT) to total assets. The ROI ratio can be examined more closely to pro-vide additional insights into its significance. The ROI also can be viewed as a func-tion of the net profit margin times the total asset turnover, because the net profitmargin ratio 5 EAT/sales and the total asset turnover ratio 5 sales/total assets:
Chapter 4 • Evaluation of Firm Performance 109
Thom
son
Learn
ing™
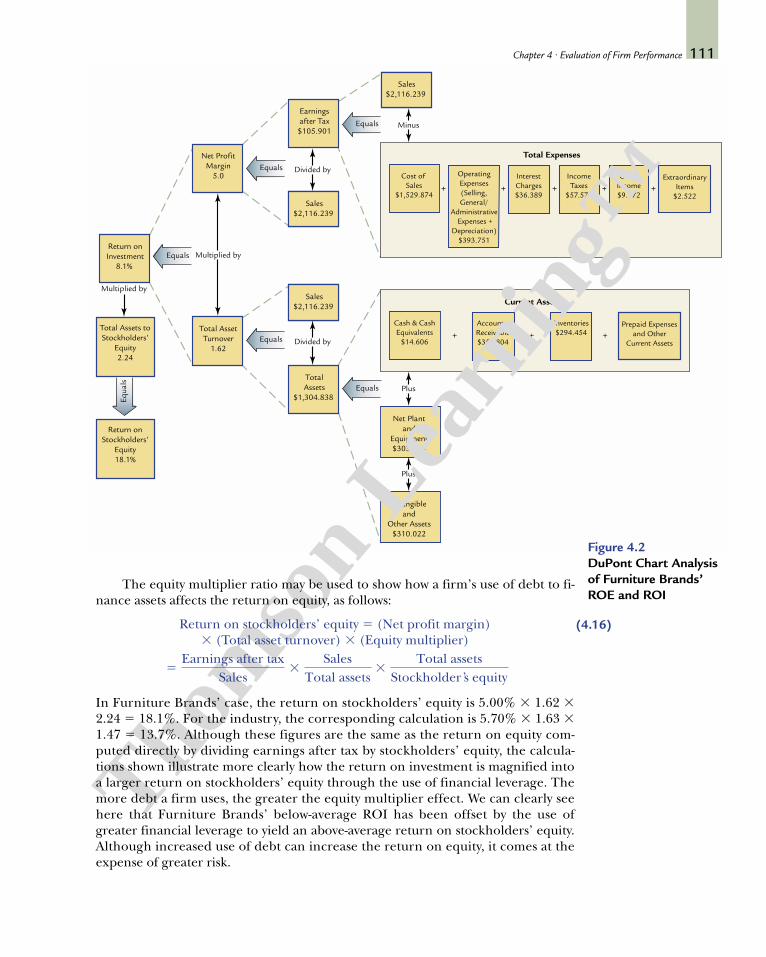
It is important to examine a firm’s ROI in terms of “margin” and “turnover,” be-cause each plays a major role in contributing to profitability. Margin measures theprofit earned per dollar of sales but ignores the amount of assets used to generatesales. The ROI relationship brings these two components together and shows thata deficiency in either one will lower a firm’s return on investment.
Using the figures from the net profit margin ratio and total asset turnover ra-tio calculated previously for Furniture Brands, the firm’s ROI for 2000 can be com-puted as 5.0% 3 1.62 5 8.1%. Figure 4.2, called a modified DuPont chart or analysisbecause it was developed and is used by the DuPont Corporation, illustrates this re-lationship. For purposes of comparison, the industry average ROI 5 5.70% 3 1.63 59.3%. The ROI relationship shows that the lower ROI for Furniture Brands relativeto the industry is due to the lower net profit margin relative to the industry. TheDuPont chart illustrates the relationship between a firm’s ROI and the factors thatdetermine it. By working back through the DuPont chart, an analyst can begin topinpoint potential areas for improvement that will enhance the firm’s ROI.
The relative contributions of the net profit margin and the asset turnover ra-tio in the ROI relationship differ from industry to industry. Specifically, theturnover ratio is dependent largely on a firm’s investment in property, plant, andequipment. Firms with large investments in fixed assets tend to have low turnoverratios; public utilities, railroads, and large industrial firms fall into this category. Ifthese companies are to succeed, their relatively low turnover ratios must be offsetby correspondingly high margins to produce competitive ROIs. For example, elec-tric and gas utilities typically have net profit margins of 10 to 15 percent. In con-trast, other industries require much lower investments in fixed assets, resulting inhigher turnover ratios. A typical example is the retail grocery chain industry, whichhas margins of only 1 or 2 percent. Firms in this industry often achieve turnoversof 10 times or more. If a grocery chain had a lower turnover, its ROI probablywould not be sufficient to attract investors.
Return on Stockholders’ EquityFigure 4.2 also shows Furniture Brands’ return on stockholders’ equity, which iscomputed as 18.1 percent. If the firm were financed solely with common equity(stock), the return on stockholders’ equity would equal the return on investment.Furniture Brands’ stockholders have supplied about 55 percent of the firm’s totalcapital, whereas creditors have supplied the remaining 45 percent. Because the en-tire 8.1 percent return on investment belongs to the stockholders (even thoughthey only supplied 55 percent of the total capital), Furniture Brands’ return oncommon equity is higher than its return on investment.
To clarify how the return on stockholders’ equity is determined, a new ratio,the equity multiplier ratio, is defined as follows:
Furniture Brands’ equity multiplier ratio is computed from figures found in the bal-ance sheet as $1,304.838/$583.905 5 2.24 times. The industry average for the ratiois 1.47 times. Once again, it can be seen that Furniture Brands has financed a signif-icantly greater proportion of assets with debt than the average firm in the industry.
Equity multiplier 5Total assets
Stockholders’ equity
ROI 5Earnings after tax (EAT)
Total assets5
EATSales
3Sales
Total assets
110 Part 1 • Introduction
(4.18)
(4.17)
Cost of Sales
$1,529.874
OperatingExpenses(Selling,General/
Administrative Expenses +
Depreciation)$393.751
OtherIncome$9.772
IncomeTaxes
$57.574
InterestCharges$36.389
Total Expenses
ExtraordinaryItems
$2.522
Net Plantand
Equipment$303.235
TotalAssets
$1,304.838
Return onInvestment
8.1%
Total Assets toStockholders’
Equity2.24
Return onStockholders’
Equity18.1%
Earningsafter Tax$105.901
Net ProfitMargin
5.0
Total AssetTurnover
1.62
Sales$2,116,239
Sales$2,116.239
Sales$2,116,239
Sales$2,116.239
Sales$2,116,239
Sales$2,116.239
Equals
Equals
Equa
ls
Equals
Plus
+++++
Cash & CashEquivalents
$14.606
Inventories$294.454
Accounts Receivable$351.804
Current Assets
Prepaid Expensesand Other
Current Assets+++
Equals Minus
Divided by
Equals Divided by
Multiplied by
Multiplied by
Intangibleand
Other Assets$310.022
Plus
Figure 4.2DuPont Chart Analysisof Furniture Brands’ROE and ROI
Chapter 4 • Evaluation of Firm Performance 111
Thom
son
Learn
ing™
(4.16)
The equity multiplier ratio may be used to show how a firm’s use of debt to fi-nance assets affects the return on equity, as follows:
In Furniture Brands’ case, the return on stockholders’ equity is 5.00% 3 1.62 32.24 5 18.1%. For the industry, the corresponding calculation is 5.70% 3 1.63 31.47 5 13.7%. Although these figures are the same as the return on equity com-puted directly by dividing earnings after tax by stockholders’ equity, the calcula-tions shown illustrate more clearly how the return on investment is magnified intoa larger return on stockholders’ equity through the use of financial leverage. Themore debt a firm uses, the greater the equity multiplier effect. We can clearly seehere that Furniture Brands’ below-average ROI has been offset by the use ofgreater financial leverage to yield an above-average return on stockholders’ equity.Although increased use of debt can increase the return on equity, it comes at theexpense of greater risk.
5Earnings after tax
Sales3
SalesTotal assets
3Total assets
Stockholder ’s equity
112 Part 1 • Introduction
Thom
son
Learn
ing™
(4.20)
http:Stern Stewart & Co. has acomprehensive Web site onEVA issues at http://www.sternstewart.com or at http://www.eva.com
RECENT INNOVATION IN PERFORMANCEMEASUREMENT: ECONOMIC VALUE ADDED (EVA®)—AN ALTERNATIVE MEASURE OF PERFORMANCETraditional financial analysis focuses on a set of financial ratios derived primarilyfrom accounting information. Using an approach such as DuPont analysis, a firm’sfinancial performance can be dissected into its component elements. The ultimatemeasure of firm performance is the return on common equity. Although insightscan be gained from this type of analysis, traditional financial analysis suffers fromweaknesses inherent in reported accounting information, and it does not directlyconsider risk in the measure of performance. The greatest shortcoming of traditional fi-nancial analysis is the lack of a direct tie between performances, as measured using financialratios, and shareholder wealth, as measured by the market price of a firm’s stock.
A recent innovation that addresses this shortcoming is the Economic ValueAdded (EVA®) measure of performance developed by Stern Stewart & Company.Very simply the measure compares the dollar return generated by the firm to thereturn expected by the investors on the capital invested by them in the firm. TheEVA for a given year is calculated as:
EVA 5 (EBIT) (1 2 T ) 2 k 3 invested capital
The first component (EBIT)(1 2 T ) is the after-tax operating earnings of the firm.Note that this is before any interest expense because we are interested in earningsthat will be distributed to all providers of capital—debt and equity holders. The sec-ond component (k 3 invested capital) is the product of the average cost of capital,k, and the amount of invested capital at the beginning of the year. The average costof capital depends on the various sources of capital employed by the firm includ-ing short-term debt, long-term debt, preferred stock, and common equity. Each ofthe various sources of capital has its own associated cost of capital, and k representsthe composite or average of all the different sources of capital. The invested capitalrefers to sum total of all capital contributed by each of the different sources of cap-ital. Thus, (k 3 invested capital) refers to the dollar return expected by all the cap-ital holders taken together. Based on this formula, EVA is positive if the return gen-erated exceeds the return expected by the capital holders.
EVA is a very comprehensive measure of performance. What EVA says is that afirm’s earnings must exceed what it costs to raise the capital employed in the firm.In other words, good management not only generates sufficient earnings to meetthe business expenses of firm (cost of production, operating expenses) but alsoprovides for compensation to the various capital holders. A positive EVA thereforesignifies that management has generated earnings over and above what the capitalholders require. When that happens, share prices will increase.
Calculating the EVA is somewhat involved as we need to know cost of capital,k. (The cost of capital will be discussed in Chapter 11.) In addition to k, we need tomeasure operating earnings and invested capital. Stern Stewart points out that themeasure of operating earnings, or EBIT, is an adjusted measure of the operatingearnings seen in the accounting statements. Stern Stewart adjusts for a number ofaccounting treatments before coming up with the proper measure of operatingearnings. Conceptually though, as can be seen from the formula, it is very straight-forward. For example, let us assume we want to calculate EVA for Music Box Cor-poration for 2001. Let’s assume that Music Box employed several sources of capital,including debt and common equity, and that we are provided with the following information:
Chapter 4 • Evaluation of Firm Performance 113
Thom
son
Learn
ing™
Invested capital at the beginning of year 2001: $2.5 billionAverage cost of capital: 8.5%Corporate tax rate: 40%EBIT generated in 2001: $450 million
Plugging in the corresponding values into the EVA formula:EVA 5 EBIT (1 2 T ) 2 k 3 invested capital
5 $450 million (1 2 .4) 2 .085 3 $2,500 million5 $270 million 2 212.5 million5 $57.5 million
Thus, Music Box’s management generated additional wealth in 2001 of $57.5 mil-lion over and above what the various sources of capital cost the firm.
It is important to note that management should not be penalized if the EVA isnegative in a given year because it may be due to circumstances beyond their con-trol. For example, airlines do poorly when the economy is in a recession regardlessof the efforts of management to increase traffic. Consequently, despite all efforts,the after-tax EBIT for airlines may not exceed their cost of capital, yielding nega-tive EVAs. However, if an airline is yielding consistently negative EVAs year afteryear, then serious questions may be raised regarding the management’s compe-tence. In addition to EVA, Stern Stewart also calculates what it refers to as the mar-ket value added (MVA), which is a cumulative measure of EVA since the inception ofthe firm. Stern Stewart’s Web site (http://www.sternstewart.com) provides a rank-ing of the MVAs of 1,000 firms. A selection of firms with the best and worst MVAsalong with their EVAs for the year 1999 is provided in Table 4.2.
COMMON-SIZE FINANCIAL STATEMENTSIn addition to financial ratios, it is also useful to examine common-size financialstatements. A common-size balance sheet shows the firm’s assets and liabilities as a per-centage of total assets, rather than in dollar amounts. Table 4.3 shows FurnitureBrands’ common-size balance sheet at year-end 2000 and 1999. A common-size in-come statement lists the firm’s income and expense items as a percentage of netsales, rather than in dollar amounts. Table 4.4 contains Furniture Brands’ com-mon-size income statement for the year 2000 and 1999. Common-size financialstatements allow trends in financial performance to be detected and monitoredmore easily than do financial statements showing only dollar amounts. These canalso be compared to common size statements for the industry as a whole.
A comparison of Furniture Brands’ common-size balance sheets for 2000 and1999 reveals that all of the asset accounts maintained fairly stable proportions to to-tal assets during the 2 years. Accounts receivable, as a percent of total assets was sta-ble at around 27 percent while inventories as a percent of total assets was approxi-mately 22 percent. Property, plant, and equipment remained stable at about 23percent. On the liabilities we note a drop in the proportion of total liabilities to to-tal assets from approximately 63 percent in 1999 to about 55 percent in 2000. Thisdecrease is almost entirely attributable to the decrease in the proportion of long-term debt to total assets, which dropped from approximately 42 percent to approx-imately 35 percent of total assets. The decrease in the proportion of total liabilitiesto total assets is consistent with the trend analysis showing that management hasbeen working hard to steadily pare down Furniture Brands’ reliance on debt fi-nancing over the past several years.
Table 4.2 Best and Worst 1999 MVA rankings from Stern Stewart & Co.
114 Part 1 • Introduction
Thom
son
Learn
ing™
Capital Cost EVA (Year-End Return of
(Average) Operating on CapitalMVA Rank MVA Capital) Capital) Capital(R) (WACC)
1999 1998 1994 TIC Company Name 1999 1999 1999 1999 19991 1 10 MSFT Microsoft 629,407 5,796 20,034 51.78 12.622 2 2 GE General Electric 467,510 3,499 75,830 17.20 12.473 8 50 CSCO Cisco Systems 348,442 182 23,653 13.72 12.784 5 3 WMT Wal-Mart Stores 282,655 1,528 54,013 14.31 10.995 3 26 INTC Intel 253,907 4,695 29,825 30.55 12.196 9 LU Lucent Technologies 200,540 21,828 65,594 9.81 13.697 23 425 AOL America Online 187,558 2156 4,482 11.10 15.538 41 38 ORCL Oracle 154,263 605 5,413 24.59 12.429 11 78 IBM IBM 154,219 1,349 66,827 13.33 11.40
Table 4.4 Common-size Income Statements for Furniture Brands
Table 4.3 Common-size Balance Sheets for Furniture Brands
Chapter 4 • Evaluation of Firm Performance 115
Thom
son
Learn
ing™
A comparative analysis of the common-size income statements of FurnitureBrands for 2000 and 1999 shows a slight increase in the cost of production (cost ofoperations) and selling, general, and administrative expenses as a percent of sales.The increase in production costs and selling, general, and administrative expensesresulted in the operating profit declining from 10.1 percent of sales in 1999 to 7.8percent of sales in 2000. Interest expense as a percent of sales declined slightly as a
2000 1999ASSETSCurrent assets
Cash and cash equivalents 1.2% 0.6%Accounts receivable 27.0 26.8Inventories 22.6 22.1Prepaid expenses and other current assets 2.4 2.6_____ _____Total current assets 53.2 52.1
Net Property, plant, and equipment, less accumulated depreciation 23.2 23.1Intangible assets 22.2 23.5Other assets 1.5 1.2_____ _____
Total assets 100.0 100.0
LIABILITIES AND STOCKHOLDERS’ EQUITYCurrent liabilities
Total liabilities 55.3 63.2Stockholders’ equity (total) 44.7 36.8_____ _____Total liabilities and stockholders’ equity 100.0 100.0
2000 1999Sales 100.0% 100.0%Cost of operations 72.3 71.8Selling, general, and administrative expenses 15.9 15.1Depreciation and amortization 2.7 2.7_____ _____Earnings from operations 7.8 10.1Interest expense 1.7 1.8Other income, net 0.5 0.1_____ _____Earnings before income tax expense and extraordinary item 7.8 8.5Income tax expense 2.7 3.1_____ _____Earnings before extraordinary item 5.1 5.4Extraordinary item .1 -_____ _____Net earnings 5.0 5.4
Thom
son
Learn
ing™
result of the decline in the debt ratio. Net profit declined from 5.4 percent to 5.0percent of sales, which is consistent with the decline in the operating profit margin.
1. How is the DuPont framework useful?2. What are common-size statements?3. What is EVA and how is it different from accounting measures of profitability?
SOURCES OF COMPARATIVE FINANCIAL DATAAn analyst may refer to a number of sources of financial data when preparing acomparative financial analysis, including the following:
Dun and Bradstreet. Dun and Bradstreet (D&B) prepares a series of 14 key busi-ness ratios for 800 different lines of business based on the SIC codes (a numeric industry classification system). The ratios are based on the financial statements ofsome 400,000 companies. D&B reports three values for each ratio—-the median, theupper quartile, and the lower quartile. The median is the figure that falls in the mid-dle when individual ratios of sampled firms are arranged by size. The figurehalfway between the median and the ratio with the highest value is the upper quar-tile, and the figure halfway between the median and the ratio with the lowest valueis the lower quartile. By reporting three values for each ratio, D&B enables the ana-lyst to compare a particular firm with the “average” (median) firm, as well as withthe “typical” firms in the top and bottom halves of the sample. The D&B publica-tion containing the data is titled Industry Norms and Key Business Ratios.
Risk Management Association (RMA). This national association of bank loan andcredit officers uses information provided from loan applications to compile 16 ra-tios for over 250 lines of business based on the SIC codes. Like D&B, RMA reportsthe median, upper quartile, and lower quartile for each ratio. Data are presentedfor four categories of firm size. This source is especially useful to the analyst gath-ering information about smaller firms. The RMA publication containing the datais titled Statement Studies.
Quarterly Financial Report for Manufacturing Companies. The Federal Trade Com-mission (FTC) and the Securities and Exchange Commission (SEC) cooperate inpublishing quarterly reports on balance sheet and income statement data of vari-ous manufacturing companies. These include analyses of the firms by industry andasset size, along with presentations of financial statements in ratio form.
Almanac of Business and Industrial Financial Ratios. This annual almanac of busi-ness and industrial financial ratios, based on Internal Revenue Service data, re-ports 22 ratios for many industries. It also includes the number of establishmentsin the sampled industry, the number without net income, and the total dollar re-ceipts for each of the 13 size groups into which firms in each industry are classified.
Financial Studies of Small Business. This annual publication of Financial ResearchAssociates is particularly valuable for the evaluation of small firms.
Moody’s or Standard and Poor’s Industrial, Financial, Transportation, and Over-the-Counter Manuals. These contain a large amount of balance sheet and incomestatement data, as well as other relevant background information about a firm.
116 Part 1 • Introduction
Comprehension Check Questions
http:Dun and Bradstreethttp://www.dnb.comRisk Management Associationhttp://www.rmahq.org
http:The Federal Trade Commissionhttp://www.ftc.govThe Securities and ExchangeCommissionhttp://www.sec.gov
http:Moody’shttp://www.moodys.comStandard and Poor’shttp://www.standardandpoors.com
Table 4.5 Sample Industry Data from Thomson ONE—Business School Edition
Chapter 4 • Evaluation of Firm Performance 117
Thom
son
Learn
ing™
Company Furniture Brands International Peer Peer Peer Peer Peer Std
Inc Weight Aggregate Mean Median DevTicker U:FBN
Last Fiscal Yr End Date 12/31/2002
Profitability RatiosReturn on Per Share 14.47 42.73 % 33.86 5.64 14.50 20.22Return on Assets 8.86 28.55 % 31.03 5.17 7.16 6.71Cash Flow to Sales 7.62 17.79 % 42.86 7.14 8.49 2.92Gross Profit Margin 26.14 22.27 % 117.35 19.56 24.50 11.89Operating Profit Margin 8.44 27.22 % 31.01 5.17 8.58 7.30Pretax Margin 7.69Net Margin 4.96Sales per Employee 101,597.84Net Income per
Annual Reports. Most corporations publish an annual report containing incomestatement and balance sheet data, along with other information of interest.
10K Reports. Every widely held firm is required annually to file a 10K report withthe SEC. These reports contain income statement and balance sheet data, plus awide range of other relevant information dealing with the firm’s past and currentperformance and expected future prospects.
Trade Journals. These are published by trade associations and contain a great dealof financial and other types of information on member firms.
Commercial Banks. Banks frequently compile financial reports on selected industries.
Computerized Data Sources. A number of computerized databases are also availableto assist in financial analysis. The Research Insight database is available from Stan-dard and Poor’s and widely used in academic institutions and the professional in-vesting community. It contains complete balance sheet, income statement, stockprice, and dividend information for several thousand companies, covering a periodof up to 20 years. Value Line provides summary financial data and forecasts of fu-ture performance for over 1,700 firms. The Value Line database is available in bothhard copy and for personal computers. In addition to these Internet sources, stu-dents with access to Thomson ONE–Business School Edition can find informationon financial ratios for individual firms, as well as for industry groups and other usercustomized peer groups. Table 4.5, for example, shows key industry financial ratiosbased on Furniture Brands’ SIC industry code (2511) for 2002.
Most of the above data sources can be accessed via the Internet but some may re-quire subscription. There are far too many Internet sources of corporate financialdata to enumerate here. The interested student could use any of several popular Internet search engines to locate useful data. For example, by entering the search forfinancial ratios, most search engines would list from several dozen to hundreds of possible sites. Some of the more popular search engines are: http://www.yahoo.com, http://www.altavista.com, http://www.google.com, and http://www.lycos.com. Afew specific sites students may find useful are:
http://www.sec.gov: This is the site of SEC’s EDGAR database, which providesaccess to many of the filings required by the SEC of most publicly held corpo-rations. The forms include the 10K annual and 10Q quarterly filings. Most cor-porations file these statements electronically; they are available to the publicwithin minutes of filing.
http://www.yahoo.com: The finance section of this Internet portal has manyresources to search for a wide variety of financial information including finan-cial statement data, ratios, current and historical prices, corporate news, andmuch more.
http://www.hoovers.com: Provides corporate history and financial and busi-ness information for many corporations. Also provides industry informationsuch as major competitors.
http://www.reportgallery.com: Popular Internet site to search for annualreports that are available online. The site also has links to other popular finan-cial Web sites.
118 Part 1 • Introduction
Thom
son
Learn
ing™
A WORD OF CAUTION ABOUT RATIO ANALYSISThroughout the analysis of Furniture Brands International Corporation, we em-phasized that an analyst must exercise caution when evaluating a firm’s financialratios. Although ratios can provide valuable information, they also can be mislead-ing for a number of reasons.
First, ratios are only as reliable as the accounting data on which they are based.As noted in the previous chapter, the financial statements of most U.S. companiesare prepared in accordance with generally accepted accounting principles (GAAP) laidout by the Financial Accounting Standards Board. Even though careful financialanalysis can provide excellent insights into the direction and relative strength ofthe firm, the financial analyst must keep in mind that GAAP gives firms consider-able latitude in reporting their financial positions. Different firms follow differentaccounting procedures for inventory valuation, depreciation, reporting long-termleases, pension fund contributions, and mergers and acquisitions, to name just afew. These, in turn, affect reported earnings, assets, liabilities, and stockholders’equity. Unless the analyst makes adjustments for accounting reporting differences,ratio comparisons between individual companies and with various industry normscannot be viewed as definitive.
Second, with the exception of disclosing upper and lower quartile values, firmsthat compile industry norms often do not report information about the dispersion,or distribution, of the individual values around the mean ratio. If the reportedratios are dispersed widely, the industry average will be of questionable value, be-cause it may not reflect the “typical” firm in the industry. Furthermore, the stan-dard of comparison probably should not be the “typical” firm but rather the better-performing firms in the industry. Without some measure of dispersion, however,ratios for these better-performing firms cannot be determined.
Third, valid comparative analysis depends on the availability of data for appro-priately defined industries. Some industry classifications are either too broad ortoo narrow to be reliable sources of comparative data when an analyst is evaluatinga particular firm. Most firms operate in more than one industry, which makesanalysis more difficult. To some extent forming a peer group, as we did for Furni-ture Brands, may alleviate industry classification problems.
Fourth, it is important to remember that financial ratios provide a historicrecord of the performance and financial condition of a firm. Further analysis is re-quired before this historic record can be used as a basis for future projections.
Finally, comparisons of a firm’s ratios with industry norms may not always bewhat they seem. Ratios comparing unfavorably with industry norms should be con-strued as “red flags” indicating the need for further investigation—not signals ofimpending doom. On the other hand, even if a firm’s ratios compare favorablywith those of the better-performing firms in the industry, it does not necessarilymean the firm is performing adequately. If, for example, the industry itself is ex-periencing a declining demand for its goods and services, favorable ratio compar-isons simply may indicate that a firm is not decaying as rapidly as the typical firmin the industry. Thus, comparisons of selected ratios—particularly those relatingto profitability—must be made with national industry averages in order to deter-mine whether a particular firm in a particular industry is justified in making fur-ther investments.
In summary, ratios should not be viewed as substitutes for sound businessjudgment. Instead, they are simply tools that can help management make betterdecisions.
Chapter 4 • Evaluation of Firm Performance 119
Thom
son
Learn
ing™
120 Part 1 • Introduction
1. How can industry classification pose a problem for ratio analysis?2. Why should we question ratios based on financial statements that use GAAP
standards?3. How does the fact that financial statements are based on historical data pose a
limitation on financial ratio analysis?
Summary➢ Financial ratios are statistical yardsticks that relate two numbers generally
taken from a firm’s income statements and balance sheets.➢ Financial ratios fall into five categories:
• Liquidity ratios, which measure a firm’s ability to meet its maturing obligations
• Asset management ratios, which measure how efficiently a firm is using re-sources to generate sales
• Financial leverage management ratios, which indicate a firm’s capacity tomeet short- and long-term debt obligations
• Profitability ratios, which measure the firm’s ability to generate profits onsales, assets, and stockholders’ investment
• Market-based ratios, which measure the market’s (investors’) perceptionsof a firm’s performance and risk
➢ Trend analysis introduces the element of time into financial ratio analysis. Itgives the analyst a more dynamic view of a company’s situation than does apure comparative financial ratio analysis alone.
➢ The relationship of the return on investment (ROI) to “margin” and“turnover” can be used to determine if one or both of the two is deficient incontributing to the profitability of a firm.
➢ Common-size financial statements, which express financial items in percent-ages, are helpful in detecting and monitoring financial trends.
➢ To gain further insight into the relative financial position of a firm, the ana-lyst must compare the financial ratios with industry averages. The more diver-sified the firm, the more difficult it will be to make such a comparison. Twomajor sources of industry ratios are Dun and Bradstreet and Risk Manage-ment Association.
➢ Financial ratio analysis is only as good as the quality of the financial statementson which it is based.
➢ The Economic Value Added (EVA®) is a measure of performance developedby Stern Stewart & Company. It compares the dollar return generated by thefirm to the return expected by the investors in the various sources of capitalutilized by the firm.
Questions and Topics for Discussion1. What are the primary limitations of ratio analysis as a technique of financial
statement analysis?
Comprehension Check Questions
Chapter 4 • Evaluation of Firm Performance 121
Thom
son
Learn
ing™
2. What is the major limitation of the current ratio as a measure of a firm’s liquid-ity? How may this limitation be overcome?
3. What problems may be indicated by an average collection period that is sub-stantially above or below the industry average?
4. What problems may be indicated by an inventory turnover ratio that is sub-stantially above or below the industry average?
5. What factors limit the use of the fixed asset turnover ratio in comparativeanalyses?
6. Why are there separate asset structure ratios for inventory, fixed assets, and ac-counts receivable?
7. Are higher current, quick, inventory turnover, fixed asset turnover, and totalasset turnover ratios better than lower ones?
8. What are the three most important determinants of a firm’s return on stock-holders’ equity?
9. What specific effects can the use of alternative accounting procedures have onthe validity of comparative financial analyses?
10. What is the relationship between a firm’s P/E multiple and that firm’s risk andgrowth potential?
11. Discuss the general factors that influence the quality of a company’s reportedearnings and its balance sheet.
12. Why would you anticipate a lower P/E ratio for a typical natural gas utility thanfor a computer technology firm, such as Dell Computer?
13. According to the DuPont framework, can a firm show a stable ROE pattern de-spite declining net profit margins and total asset turnovers? Explain.
14. How is Economic Value Added (EVA) different from accounting measures ofprofitability?
Self-Test ProblemsThe following financial data for the Freemont Corporation are to be used in an-swering the first six self-test problems.
Balance Sheet ($000)
Assets Liabilities & Stockholders’ Equity
Cash $ 1,500 Accounts payable $12,500Marketable securities 2,500 Notes payable 12,500Accounts receivable 15,000 Total current liabilities $25,000Inventory 33,000 Long-term debt 22,000Total current assets $52,000 Total liabilities $47,000Fixed assets (net) 35,000 Common stock (par value) 5,000Total assets $87,000 Contributed capital in excess of par 18,000
Sales (all on credit) $130,000Cost of sales 103,000Gross margin 27,000Operating expenses* 16,000Earnings before interest and taxes $ 11,000Interest expense 3,000Earnings before taxes $ 8,000Income tax 3,000Earnings after taxes $ 5,000*includes $200 (000) in lease payments.
Other Information
Stock price $ 9.50Book value per share $ 8.00Number of shares 5,000(000)
ST1. Calculate the following liquidity ratios:a. Current ratiob. Quick ratio
ST2. Calculate the following asset management ratios:a. Average collection periodb. Inventory turnoverc. Fixed asset turnoverd. Total asset turnover
ST3. Calculate the following financial leverage management ratios:a. Debt ratiob. Debt-to-equity ratioc. Times interest earned ratiod. Fixed-charge coverage ratio
ST4. Calculate the following profitability ratios:a. Gross profit marginb. Net profit marginc. Return on investmentd. Return on stockholders’ equity
ST5. Calculate the following market-based ratios:a. Price-to-earnings ratiob. Market price-to-book value ratio
ST6. Express the return on investments as a function of the net profit margin andthe total asset turnover ratio. Next, calculate the return on stockholders’ eq-uity ratio as a function of the net profit margin, total asset turnover, and eq-uity multiplier ratios.
122 Part 1 • Introduction
Chapter 4 • Evaluation of Firm Performance 123
B A S I C
B A S I C
B A S I C
B A S I C
C H A L L E N G E
Thom
son
Learn
ing™
Problems1. Vanity Press, Inc. has annual sales of $1,600,000 (assume all sales are on credit)
and a gross profit margin of 35 percent.a. If the firm wishes to maintain an average collection period of 50 days, what
level of accounts receivable should it carry? (Assume a 365-day year.)b. The inventory turnover for this industry averages six times. What average
level of inventory should the firm maintain to achieve the same inventoryturnover figure as the industry?
2. Pacific Fixtures lists the following accounts as part of its balance sheet.Total assets $10,000,000Accounts payable $ 2,000,000Notes payable (8%) 1,000,000Long-term debt (10%) 3,000,000Common stock at par 1,000,000Contributed capital in excess of par 500,000Retained earnings 2,500,000
Total liabilities and stockholders’ equity $10,000,000
Compute the return on stockholders’ equity if the company has sales of $20million and the following net profit margin:a. 3 percentb. 5 percent
3. Clovis Industries had sales in 20X1 of $40 million, 20 percent of which werecash. If Clovis normally carries 45 days of credit sales in accounts receivable,what are its average accounts receivable balances? (Assume a 365-day year.)
4. Williams Oil Company had a return on stockholders’ equity of 18 percent dur-ing 20X1. Its total asset turnover was 1.0 times, and its equity multiplier was 2.0times. Calculate the company’s net profit margin.
5. Using the data in the following table for a number of firms in the same indus-try, do the following:a. Compute the total asset turnover, the net profit margin, the equity multi-
plier, and the return on equity for each firm.b. Evaluate each firm’s performance by comparing the firms with one an-
other. Which firm or firms appear to be having problems? What correctiveaction would you suggest the poorer performing firms take? Finally, whatadditional data would you want to have on hand when conducting youranalyses?
I N T E R M E D I A T E 6. Tarheel Furniture Company is planning to establish a wholly owned subsidiaryto manufacture upholstery fabrics. Tarheel expects to earn $1 million aftertaxes on the venture during the first year. The president of Tarheel wants toknow what the subsidiary’s balance sheet would look like. The president be-lieves that it would be advisable to begin the new venture with ratios that aresimilar to the industry average.
Tarheel plans to make all sales on credit. All calculations assume a 365-dayyear. In your computations, you should round all numbers to the nearest$1,000. Based upon the industry average financial ratios presented here, com-plete the projected balance sheet for Tarheel’s upholstery subsidiary.
Industry Averages
Current ratio 2:1Quick ratio 1:1Net profit margin ratio 5 percentAverage collection period 20 daysDebt ratio 40 percentTotal asset ratio 2 times
Forecasted Upholstery Subsidiary Balance Sheet
Cash _______ Total current liabilities _______Accounts receivable _______ Long-term debt _______Inventory _______ Total debt _______
Total current assets _______ Stockholders’ equity _______Net fixed assets _______ Total liabilities and
Total assets _______ stockholders’ equity _______
7. The Jamesway Printing Corporation has current assets of $3.0 million. Of thistotal, $1.0 million is inventory, $0.5 million is cash, $1.0 million is accounts re-ceivable, and the balance is marketable securities. Jamesway has $1.5 millionin current liabilities.a. What are the current and the quick ratios for Jamesway?b. If Jamesway takes $0.25 million in cash and pays off $0.25 million of current
liabilities, what happens to its current and quick ratios? What happens toits real liquidity?
c. If Jamesway sells $0.5 million of its accounts receivable to a factor (a type ofspecialized financial institution that buys accounts receivable; for detailssee Chapter 17) and uses the proceeds to pay off short-term debt obliga-tions, what happens to its current and quick ratios?
d. If Jamesway sells $1.0 million in new stock and places the proceeds in mar-ketable securities, what happens to its current and quick ratios?
e. What do these examples illustrate about the current and quick ratios?8. Gulf Controls, Inc., has a net profit margin of 10 percent and earnings after
taxes of $600,000. Its current balance sheet follows:Current assets $1,800,000 Current liabilities $ 600,000Fixed assets 2,200,000 Long-term debt 1,000,000
Total assets $4,000,000 Common stock 500,000Retained earnings 1,900,000Total liabilities and stockholders’ equity $4,000,000
Chapter 4 • Evaluation of Firm Performance 125
Thom
son
Learn
ing™
a. Calculate Gulf’s return on stockholders’ equity.b. The industry average ratios are as follows:
Net profit margin 6 percentTotal asset turnover 2.5 timesEquity multiplier 1.4 times
Compare Gulf Controls with the average firm in the industry. What is thesource of the major differences between the Gulf and the industry averageratios?
9. Using the following data for Jackson Products Company, answer Parts athrough g:
Jackson Products Company’s Balance SheetDecember 31, 20X1
Cash $ 240,000 Accounts payable $ 380,000Accounts receivable 320,000 Notes payable (9%) 420,000Inventory 1,040,000 Other current liabilities 50,000
Total current assets $1,600,000 Total current liabilities $ 850,000Net plant and equipment 800,000 Long-term debt (10%) 800,000
Total assets $2,400,000 Stockholders’ equity 750,000Total liabilities and stockholders’ equity $ 2,400,000
Income Statement for the Year EndedDecember 31, 20X1
Net sales (all on credit) $3,000,000Cost of sales 1,800,000Gross profit $1,200,000Selling, general, and administrative expenses 860,000Earnings before interest and taxes $ 340,000Interest:
Earnings before taxes $ 222,200Federal income tax (40%) 88,880Earnings after taxes $ 133,320
Industry Averages
Current ratio 2.5 timesQuick ratio 1.1 timesAverage collection period (365-day year) 35 daysInventory turnover ratio 2.4 timesTotal asset turnover ratio 1.4 timesTimes interest earned ratio 3.5 timesNet profit margin ratio 4.0 percentReturn on investment ratio 5.6 percentTotal assets/stockholders’ equity (equity multiplier) ratio 3.0 timesReturn on stockholders’ equity ratio 16.8 percentP/E ratio 9.0 times
C H A L L E N G E
126 Part 1 • Introduction
Thom
son
Learn
ing™
C H A L L E N G E
I N T E R M E D I A T E
a. Evaluate the liquidity position of Jackson relative to that of the average firmin the industry. Consider the current ratio, the quick ratio, and the networking capital (current assets minus current liabilities) for Jackson. Whatproblems, if any, are suggested by this analysis?
b. Evaluate Jackson’s performance by looking at key asset management ratios.Are any problems apparent from this analysis?
c. Evaluate the financial risk of Jackson by examining its times interestearned ratio and its equity multiplier ratio relative to the same industry average ratios.
d. Evaluate the profitability of Jackson relative to that of the average firm inits industry.
e. Give an overall evaluation of the performance of Jackson relative to otherfirms in its industry.
f. Perform a DuPont analysis on ROI and ROE for Jackson. What areas ap-pear to have the greatest need for improvement?
g. Jackson’s current P/E ratio is 7 times. What factor(s) are most likely to ac-count for this ratio relative to the higher industry average ratio?
10. Given the following data for Profiteers, Inc., and the corresponding industryaverages, perform a trend analysis of the return on investment and the returnon stockholders’ equity. Plot the data and discuss any trends that are apparent.Also, discuss the underlying causes of these trends.
11. If a company sells additional common stock and uses the proceeds to increaseits inventory level and to increase its cash balances, what is the near-term (im-mediate) impact (increase, decrease, no change) of this transaction on the fol-lowing ratios?a. Current ratiob. Return on stockholders’ equityc. Quick ratiod. Debt to total assetse. Total asset turnover
Chapter 4 • Evaluation of Firm Performance 127
Thom
son
Learn
ing™
I N T E R M E D I A T E
I N T E R M E D I A T E
B A S I C
12. Keystone Resources has a net profit margin of 8 percent and earnings aftertaxes of $2 million. Its current balance sheet is as follows:Current assets $ 6,000,000 Current liabilities $ 3,500,000Fixed assets 10,000,000 Long-term debt 5,500,000
Total assets $16,000,000 Common stock 2,000,000Retained earnings 5,000,000
Total liabilities and stockholders’ equity $16,000,000
a. Calculate Keystone’s return on stockholders’ equity.b. Industry average ratios are
Net profit margin 10%Total asset turnover 2.0 timesEquity multiplier 1.5 times
What does a comparison of Keystone to these averages indicate about thefirm’s strengths and weaknesses?
c. Keystone has inventories of $3.2 million. Compute the firm’s quick ratio.13. The stock of Jenkins Corporation, a major steel producer, currently is selling
for $50 per share. The book value per share is $125. In contrast, the price pershare of Dataquest’s stock is $40, compared to a book value per share of $10.Dataquest, a leading software developer, has a copyright on the best-sellingdatabase management program. Why do these two firms have such dramati-cally different market-to-book ratios?
14. Fill in the balance sheet for the Jamestown Company presented below basedon the following data (assume a 365-day year):
Sales $3,650,000Total asset turnover 4xCurrent ratio 3:1Quick ratio 2:1Current liabilities to stockholders’ equity 30%Average collection period 20 daysTotal debt to total assets 0.4
Balance Sheet
Cash _______ Accounts payable _______Accounts receivable _______ Total current liabilities _______Inventory _______ Long-term debt _______
Total current assets _______ Stockholders’ equity _______Fixed assets _______
Total assets _______ Total liabilities and equity _______
128 Part 1 • Introduction
Thom
son
Learn
ing™
C H A L L E N G E
I N T E R M E D I A T E
B A S I C
15. The Southwick Company has the following balance sheet ($000):Assets Liabilities & Stockholders’ Equity
Total current assets $ 5,750 Total liabilities $ 4,750Plant and equipment (net) 5,000 Common stock ($1 par) 1,000
Total assets $10,750 Contributed capital in excess of par 2,000Retained earnings 3,000Total stockholders’ equity $ 6,000Total liabilities and
stockholders’ equity $10,750
Financial Ratios
Current ratio 1.92Quick ratio 1.08Debt-to-equity ratio 0.79
Evaluate the impact of each of the following (independent) financial decisionson Southwick’s current, quick, and debt-to-equity ratios:a. The firm reduces its inventories by $500,000 through more efficient inventory
management procedures and invests the proceeds in marketable securities.b. The firm decides to purchase 20 new delivery trucks for a total of $500,000
and pays for them by selling marketable securities.c. The firm borrows $500,000 from its bank through a short-term loan (sea-
sonal financing) and invests the proceeds in inventory.d. Southwick borrows $2,000,000 from its bank through a 5-year loan (inter-
est due annually, principal due at maturity) and uses the proceeds to ex-pand its plant.
e. The firm sells $2,000,000 (net) in common stock and uses the proceeds toexpand its plant.
16. Armbrust Corporation is the maker of fine fitness equipment. Armbrust’sbank has been pressuring the firm to improve its liquidity. Which of the follow-ing actions proposed by the CFO do you believe will actually achieve this ob-jective? Why or why not?a. Sell new equity and use the proceeds to purchase a new plant site.b. Use cash and marketable securities to pay off short-term bank borrowings
and accounts payable.c. Borrow long-term and use the proceeds to pay off short-term debt.d. Sell surplus fixed assets and invest the proceeds in marketable securities.
17. From Stern Stewart’s Web site (http://www.sternstewart.com) identify the fivebest performing firms in terms of EVAs and the five worst performing firms.Do the same with MVAs.
Chapter 4 • Evaluation of Firm Performance 129
Thom
son
Learn
ing™
C H A L L E N G E18. Go to finance page of Yahoo!’s Web site (http://www.yahoo.com) and updatethe ratio analysis for Furniture Brands using data for the latest year available.The data to calculate the ratios can be found in the financials section. Makesure you request the annual data (not quarterly). Specifically calculate the fol-lowing ratios for Furniture Brands and compare them to those presented inthe chapter for year 2000:
Current ratioTotal asset turnoverAverage collection periodDebt ratioGross profit marginNet profit marginReturn on investmentReturn on stockholders’ equity
THOMSON ONE—Business School EditionGo to the text Web site at http://moyer.swlearning.com, select your book, andclick on the Thomson ONE button. Enter Thomson ONE—Business SchoolEdition by using the username and password you created when you registeredthe serial number on your access card. Use the “Financials” tab and the“Growth Ratios” menu item (Worldscope Annual Growth Ratios) from theThomson ONE database to determine the following information for AdolphCoors, Inc (RKY):a. What has been the trend in debt usage by the company over the past 5
years?b. What has been the trend in “asset turnover” over the past 5 years?c. What has been the trend in “accounts receivable days” over the past 5 years?d. What has been the trend in “return on total equity” over the past 5 years?e. How would you characterize the performance of Adolph Coors over the