110 CHAPTER 4 STUDIES ON MECHANICAL, THERMAL, WEAR AND MORPHOLOGICAL BEHAVIOURS OF GRAPHITE FILLED NYLON 66/POLYTETRAFLUOROETHYLENE COMPOSITES This chapter deals with the characterization of polytetrafluoroethylene (PTFE) filled nylon 66/graphite (Gr) composites. The nylon 66/PTFE/Gr composites were prepared by melt mixing with different weight fractions of PTFE viz., 0, 5, 10,15 and 20 wt. % and 2% Gr using a co-rotating intermesh twin-screw extruder mixer. The fabricated nylon 66/PTFE/Gr composites were characterized for physico-mechanical behaviours such as density, hardness, tensile behaviours and impact strength. The nylon 66/PTFE/Gr composites are evaluated for thermal characteristics using DSC, DMA and TGA. A slight improvement in thermal stability was noticed for filler loaded specimens. A pin-on-disc wear testing equipment is employed to investigate the tribological properties. Morphological features of worn-out surfaces of nylon 66/PTFE/Gr composites have been analyzed using scanning electron microscopy (SEM). This study also focused on Laser etching technique to ascertain the effect of PTFE content on the surface abrasion behaviour of nylon 66/Gr composites. 4.1 Introduction Nylons, also known as polyamides, are preferred materials for gears, cams, bearing, etc., especially nylon 66 and nylon 6 by virtue of their mechanical strength and tribo-performance, where two different bodies are in contact at severe sliding conditions [1,2]. It was reported that the friction and wear behaviour of nylons was fairly satisfactory under dry sliding conditions and lubrication at higher speeds. However, further improvement is still required to meet more demanding applications. In order to enhance the tribological characteristics of nylons efficiently, solid lubricants may be added into the polymer matrix. A solid lubricant is defined as a material that provides lubrication, under essentially dry conditions, to two surfaces moving relatively to each other. The solid lubricants often lead to decrease of friction coefficient and wear rate through the reduction in adhesion with the counterface or creation a transfer film with a low shear strength at the interface [3,4]. A number of research papers are
Transcript
110
CHAPTER 4
STUDIES ON MECHANICAL, THERMAL, WEAR AND
MORPHOLOGICAL BEHAVIOURS OF GRAPHITE
FILLED NYLON 66/POLYTETRAFLUOROETHYLENE
COMPOSITES
This chapter deals with the characterization of polytetrafluoroethylene (PTFE)
filled nylon 66/graphite (Gr) composites. The nylon 66/PTFE/Gr composites were
prepared by melt mixing with different weight fractions of PTFE viz., 0, 5, 10,15 and
20 wt. % and 2% Gr using a co-rotating intermesh twin-screw extruder mixer. The
fabricated nylon 66/PTFE/Gr composites were characterized for physico-mechanical
behaviours such as density, hardness, tensile behaviours and impact strength. The nylon
66/PTFE/Gr composites are evaluated for thermal characteristics using DSC, DMA and
TGA. A slight improvement in thermal stability was noticed for filler loaded
specimens. A pin-on-disc wear testing equipment is employed to investigate the
tribological properties. Morphological features of worn-out surfaces of nylon
66/PTFE/Gr composites have been analyzed using scanning electron microscopy
(SEM). This study also focused on Laser etching technique to ascertain the effect of
PTFE content on the surface abrasion behaviour of nylon 66/Gr composites.
4.1 Introduction
Nylons, also known as polyamides, are preferred materials for gears, cams,
bearing, etc., especially nylon 66 and nylon 6 by virtue of their mechanical strength and
tribo-performance, where two different bodies are in contact at severe sliding
conditions [1,2]. It was reported that the friction and wear behaviour of nylons was
fairly satisfactory under dry sliding conditions and lubrication at higher speeds.
However, further improvement is still required to meet more demanding applications.
In order to enhance the tribological characteristics of nylons efficiently, solid lubricants
may be added into the polymer matrix. A solid lubricant is defined as a material that
provides lubrication, under essentially dry conditions, to two surfaces moving relatively
to each other. The solid lubricants often lead to decrease of friction coefficient and wear
rate through the reduction in adhesion with the counterface or creation a transfer film
with a low shear strength at the interface [3,4]. A number of research papers are
111
available on the improvement in wear resistance of various nylons such as nylon 66,
nylon 6, nylon 11, nylon 46, etc., with solid lubricants such as polytetrafluoroethylene
(PTFE), graphite (Gr) and molybdenum sulphide (MoS2) [5,6]. These are the pre-
dominant materials used as solid lubricants in thermoplastics.
PTFE is a commonly used solid lubricant material, which has one of the lowest
coefficients of friction against any solid. Its static coefficient of friction is lower than its
dynamic coefficient, which accounts for the slip/stick properties associated with
PTFE/metal sliding action. PTFE is a non-polar and hydrophobic material, which can
act as an efficient solid lubricant when it is added into the nylon matrix so that the
nylon/PTFE composites take the advantages of good mechanical properties and
processability of the nylon, and very low friction coefficient and good wear resistance
of PTFE. It is a well-known anti-adhesive material for tribological applications [7] and
it is a soft fluorocarbon solid, as it is a high-molecular-weight compound consisting
wholly of carbon and fluorine. It has helical macromolecular structure and its molecules
slip along each other easily similar to lamellar structures of graphite and MoS2.
Similar to PTFE, graphite is an effective solid lubricant and it has lamellar
structure. The lamellas orient parallel to the surface in the direction of motion. Even
between highly loaded stationary surfaces, the lamellar structure is able to prevent
contact. In the direction of motion, the lamellas easily shear over each other resulting in
a low friction. Graphite powders are low-friction, high-temperature solids traditionally
used to lubricate moving metal parts where boundary lubrication is required and it can
be extrusion compounded with a variety of thermoplastics to provide coefficients of
friction and wear factors between those of the base resin and the PTFE/silicone-
lubricated versions. An important use for graphite-lubricated thermoplastics is in
components that operate in aqueous environments.
The importance of the tribological properties of polymeric composites and
blends convinced various researchers to study the wear [8,9] behaviours and to improve
the wear resistance of polymers and fiber reinforced polymeric (FRP) composites. The
slide wear of several polymers sliding against a steel counter surface showed that the
wear loss increased with increasing load/speed and wear rate decreased with sliding
distance. The decrease in wear rate is caused by progressive smoothening of the surface
and by the formation of a protective transfer film of polymer on the steel counter
surface [10, 11]. Solid lubricants, such as PTFE and graphite, have been proved very
112
helpful in developing a transfer film between the two counterparts and can drastically
reduce the wear rate of the polymer composites [12,13]. Bijwe et al studied on the wear
performance of various composites of polyamide (nylon 66) reinforced with short
carbon fibres and lubricated with a solid lubricant, PTFE, under adverse sliding
conditions [14,15]. However, efforts to optimize the combination of these solid
lubricants to boost the strength and tribo-performance of nylons in different wear
modes are not reported and hence required especially in the background of such
literatures available for other polymers and composites [16-20].
In this research investigation, with objective to derive the benefits of both
helical structured PTFE and lamellar structured graphite, nylon 66 composites were
fabricated by varying the concentrations of the PTFE from 5 to 20 wt% with 2wt
%graphite content. The fabricated nylon 66/PTFE/Gr composites have been evaluated
for physico-mechanical properties such as tensile behaviours, impact strength, water
absorption, density and void content. The thermal characteristics of the composites have
been studied by using DSC, DMA and TGA. The effect of PTFE contents, loads,
sliding velocities and sliding distances on wear characteristics of the composites was
evaluated using pin-on-disc equipment.
4.2. Compounding and specimen preparation
Graphite powder (2 wt %) was premixed with varying amounts viz.,0, 5, 10, 15
and 20 wt % of PTFE powder and then mixed with nylon 66 granules in tumbling mixer
for 15 min, after pre-drying in hot air oven at 80°C for 48 h duration, and then melt
blended using a co-rotating intermesh twin screw extruder at a screw speed of 175 rpm
with barrel temperature ranging from 260 to 280 ºC. The extruder consists of nine
nozzles and the temperature zones maintained at each of the nozzles are different and
lies in the range 260–280 o
C. The extrudate strand was palletized and stored in sealed
packs containing desiccant. The test specimens for tensile behaviours, impact strength,
and water absorption were prepared using an automatic injection molding machine with
70 ton clamping pressure at 270-280 oC and an injection pressure of 80 bars. After
molding, the test specimens were conditioned at 23 ± 2 oC and 50 ± 5% RH for 40 h
according to ASTM D 618 prior to testing.
113
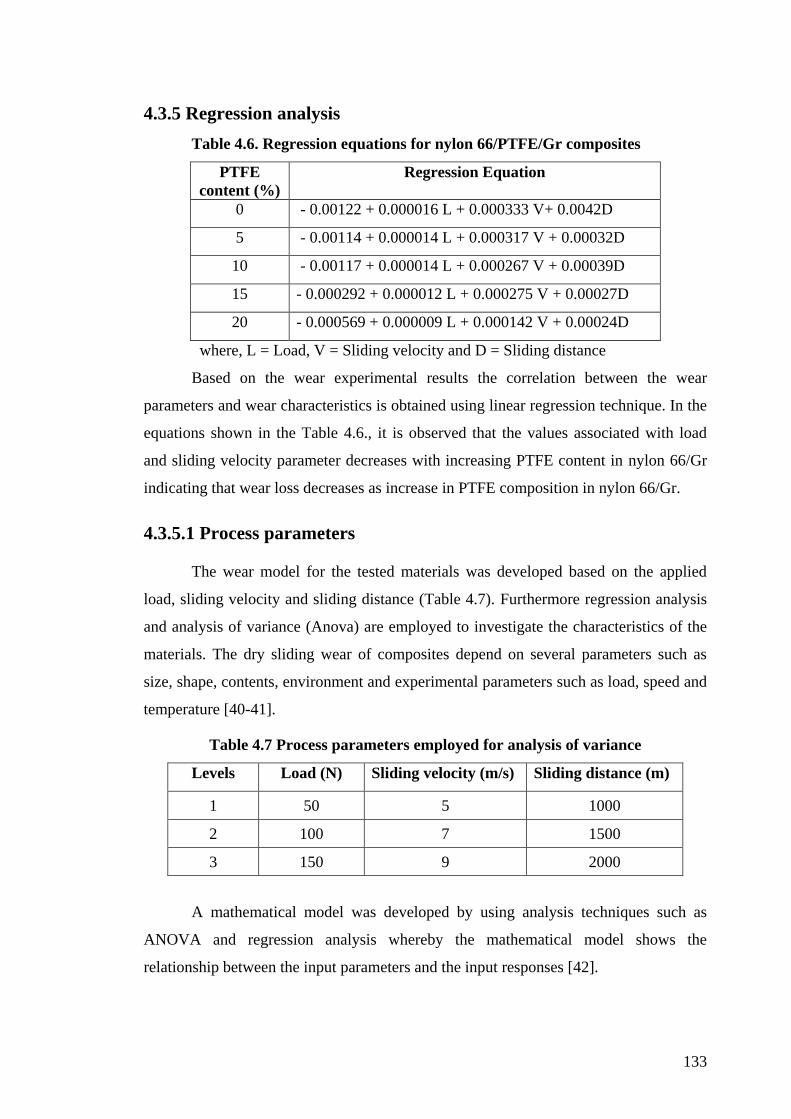
4.3 Results and Discussion
This section describes the characterization of nylon 66/PTFE/Gr composites for
different properties such as physico-mechanical, thermal, tribological, morphological
and laser etching characteristics. Nylon 66 is a rigid hydrophilic material and
incorporation of soft PTFE powder may affect its mechanical properties in dry
conditions, However, PTFE being hydrophobic in nature, the incorporation of PTFE in
the nylon 66 matrix does not affect its mechanical properties in wet conditions. Two
percentage of graphite (rigid) powder was incorporated in all the compositions
uniformly, the major role of graphite addition is twofold, one is to compensate
reduction in mechanical properties due to the incorporation of soft PTFE powder; it was
reported that hard particulate fillers dramatically improve the mechanical properties
such as wear resistance, even up to three orders of magnitude [24] and second one is to
compensate the great difference in surface energies and polarities of nylon (polar) and
PTFE (non-polar), which is expected to improve the dispersion of PTFE powder in
nylon 66 matrix. In order to prevent poor dispersion of non-polar PTFE powder in the
polar nylon 66 in the melt processing technique, the white PTFE powder, first
thoroughly mixed with black graphite powder and then mixed with nylon 66 granules
and melt compounded to make test specimens.
4.3.1 Physico-mechanical properties
The prepared nylon 66/PTFE/Gr composites were characterized for physico–
mechanical properties according to ASTM methods. The values of measured
mechanical properties such as density, surface hardness, tensile properties, and impact
strength of the nylon 66/PTFE composites were addressed in Table 4.1.
4.3.1.1 Density
Density is a significant indicator of end use of the polymeric materials and it
depends on the composition of the composites and their physical as well as chemical
properties. The measured density values of nylon 66/Gr/PTFE composites lies in the
range 1.143 -1.268 g/cc as shown in table 4.1. The measured density values of the nylon
66/PTFE composites were lower than the calculated values. This could be due to the
formation of voids at the interface between the components of the composites and also
immiscible nature of the nylon 66 and PTFE composites. The density values of the
114
composites increases as PTFE
content in the composites increases, due to the
incorporation of high dense PTFE in nylon 66 matrix.
4.3.1.2 Water uptake behaviour
When working with nylons, it is important to examine the water absorption,
because it severely affects its mechanical and thermal properties. In this investigation,
the results shown in the Table 4.1 indicates that the incorporation of PTFE has reduced
the water absorption from 2.4 (0% PTFE) to 1.5% (20% PTFE).This can be attributed
to the increase in water repellent or hydrophobic PTFE component in the nylon 66/Gr
matrix. This result clearly indicates that the significant improvement in the water
resistance behaviour of the composites.
4.3.1.3 Void content
PTFE being a higher dense material, the composite material density increases
with increase in PTFE content.The percentage of void content measured and shown in
Table 4.1 reveals that void content of this composite material increased drastically from
0.539 to 0.785 %. This shows that the increase in free volume with increase in PTFE
content. This is due to greater difference in surface energies and polarities of nylon
(polar/hydrophilic) and PTFE (non-polar/ hydrophobic) materials. This may also be due
to entrapment of air bubble during mixing particulate PTFE in crystalline nylon 66/Gr
matrix.
4.3.1.4 Surface hardness
Table 4.1. Physical properties of the nylon 66/Gr/PTFE composites
PTF
E
(%)
Water
uptake (%)
Density (g/cc) Void content
(%)
Surface hardness
(Shore D) + 1.5 Expt. Cal.
0 2.4 1.143 1.149 0.539 80
5 2.2 1.172 1.179 0.586 79
10 2.0 1.202 1.210 0.677 76
15 1.7 1.234 1.243 0.739 74
20 1.5 1.268 1.278 0.785 72
Hardness test can differentiate the relative hardness of different grades of
thermoplastics. Also hardness reveals the dimensional stability of the composites which
115
depends on the nature of composition of the components. The surface hardness of nylon
66/Gr/PTFE composites decreased from 80 to 72 shore D with incorporation of PTFE
content from 0 to 20 wt%. This can be attributed to soft PTFE materials as compared to
nylon 66.
4.3.1.5 Tensile behaviours
The effect of PTFE addition on mechanical properties such as tensile strength,
tensile modulus, percentage elongation at break, product parameter and impact strength
are given in Table 4.2. From Table 4.2, it is noticed that the tensile strength decreased
from 75 to 66 MPa, tensile modulus increased from 2739 to 2672 MPa and tensile
elongation decreased from 19.5 % to 14.5 % with increase in PTFE content from 0 to
20 wt%. The tensile strength decreased because the presence of soft and friction less
PTFE filler in-between the nylon 66 molecular layers does not resist tensile (stretching)
force, but assist stretching, so, tensile strength and elongation reduced. This is because,
as the filler loading increased, the interfacial area increased, worsening the interfacial
bonding between filler and the matrix polymer, which decreased the tensile strength. In
contrast to the tensile strength and tensile elongation, the tensile modulus increased.
Lancaster [6] stated that the product of σe factor (where, σ is the ultimate tensile
strength and e is the elongation at fracture) is a very important factor which controls the
abrasive behaviour of composites. In the present investigation, at lower filler loading
higher will be the tensile strength (σ) and ultimate elongation (e) of neat polymer, and
hence their product σe also higher. From the table it was noticed that the σe factor
decreases with increase in PTFE content.
In the present investigation wear behaviour is not dependent on the σe values,
that means wear behaviour strongly depend on the volume fraction of solid lubricant in
the composites.
Table 4.2. Mechanical properties of the nylon 66/Gr/PTFE composites
PTFE
(%)
Tensile
strength
(σ) (MPa)
Tensile
modulus
(MPa)
Elongation at
break (e) (%)
Product
parameter
(σ x e)
Impact
strength
(J/m)
0 75 2739 19.5 1463 35.1
5 72 2722 19.1 1375 36.3
10 70 2705 17.3 1211 39.5
15 69 2689 15.2 1049 41.9
20 66 2672 14.5 957 44.6
116
4.3.1.6 Impact strength
The impact strength of composites is even more complex than that of the
unfilled polymers because of the part played by the fillers and the interface in addition
to the polymer. The izod impact strength of composites at different filler loadings are
shown in Table 4.2. The izod impact strength of composites increased from 35.1 to 44.6
J/m with filler loading, which may be due to softness and poor adhesion of PTFE filler
with nylon 66, which dissipates the maximum energy by mechanical friction.
4.3.2 Thermal behaviours
The thermal characteristics of nylon 66/PTFE/Gr composites have been
characterized by using DSC, TGA and DMA. The results of thermal behaviours of the
composites briefly interpreted in the following section.
4.3.2.1 Heat distortion temperature (HDT)
Nylon 66 is a crystalline thermoplastic with a low linear thermal expansion co-
efficient. The measured HDT value of pristine nylon 66 is 205-210 o
C at 0.45 Mpa load.
A significant reduction in HDT values was noticed after incorporation of graphite and
PTFE into nylon 66 matrix and it lies in the range 155-170oC for 20 wt %PTFE loaded
nylon 66/Gr/PTFE composites. This is due to PTFE, being soft component and hence
reinforced nylon 66/Gr matrix undergo little dimensional change when the temperature
changes.
4.3.2.2 Differential scanning calorimetry
DSC was used to study the effect of filler loading on the transition temperature
behaviours of the composites. Figure 4.1 illustrates the DSC thermograms of pristine
PA66 and the composites filled with PTFE. The thermal data obtained from DSC
thermograms therm of PTFE filled nylon 66/Gr composites are tabulated in Table 4.3.
The calculated percent of crystallinity of nylon 66/PTFE/Gr lies in the range 43.7 –
36.2. As it can be inferred, melting temperature (Tm) and heat of melting (Hm) do not
change sensibly by incorporation of both PTFE. The percent deviation in Hm and
degree of crystallinity is less than 2.7. This clearly indicates that PTFE does not affect
the crystalline structure of the PA66. Such behaviour for nylon 66/PTFE/Gr
compounds, where an interfacial interaction was speculated, reveals that the extent of
interaction is not such a high value to influence crystallinity of PA66, probably because
117
of the low degree of functionality or small interfacial area. Thermal transition behaviour
observed here is accordance with crystallization characteristics of PAs/PTFE systems
reported in literature [21-22].
Figure 4.1. DSC thermograms of nylon 66/PTFE/Gr composites
Table 4.3. Thermal characteristics obtained from DSC thermograms for nylon
66/PTFE/Gr composites
*Heat of fusion value of crystalline nylon 66 is 191 J/g
4.3.2.3 Dynamic mechanical analysis
The investigation of dynamic modulus and damping over a temperature range has
proved to be very useful in studying the structure of the polymers and the variation of
properties in relation to performance [23-27]. The dynamic modulus indicates the
PTFE
content in
composite
(% by wt)
To
(ºC)
Tm
(ºC)
Tc
(ºC)
H (J/g) Crystallinity* χc
(%)
Exp. Cal. Dev.
(%)
Exp. Cal. Dev.
(%)
0 245 266 279 85.7 - - 43.7 - -
5 240 265 275 81. 0 81.4 -0.5 41.3 41.5 -0.5
10 239 264 273 77.6 77.1 +0.6 39.6 39.4 +0.6
15 237 263 271 75.1 72.8 +2.7 38.2 37.2 +2.7
20 236 262 269 71.3 68.6 +3.4 36.2 35.0 +3.4
118
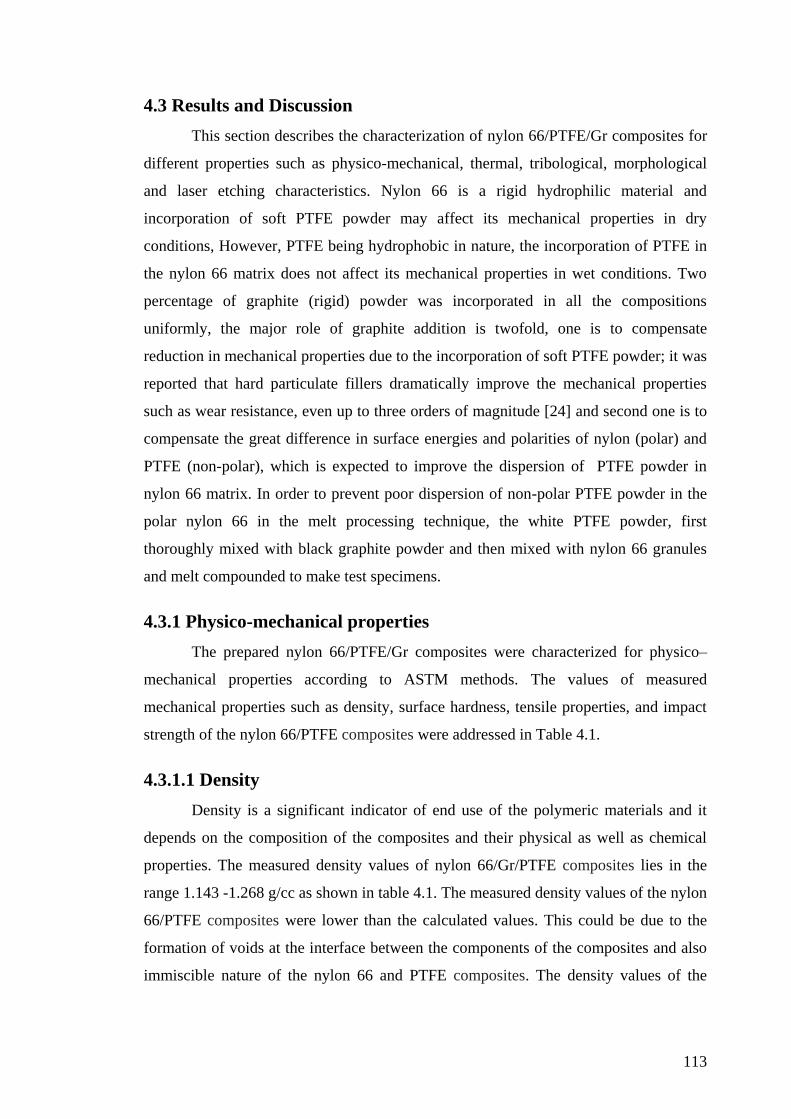
inherent stiffness of material under dynamic loading conditions. The mechanical
damping indicates the amount of energy dissipated as heat during the deformation of
the material. The dynamic mechanical properties of polymers are usually studied over a
wide temperature range. In the region where the dynamic modulus-temperature curve
has an inflection point, tan δ curve goes through a maximum. This dissipation is called
Tg region. A few polymeric mixtures are compatible and form one phase systems.
However, most mixtures of polymers form two phases due to incompatibility of the
components.
Figure 4.2. Plots of Storage modulus versus temperature for nylon 66//PTFE/Gr
composites
Figure 4.3. Plots of loss modulus versus temperature for 2% Gr filled nylon
66/PTFE/Gr composites
119
The plots of storage modulus verses temperature curves of nylon 66/PTFE/Gr
composites containing 0, 5, 10, 15 and 20% of the PTFE filler have been shown in
Figure 4.2. The break in modulus curves remain steep, and the modulus is just shifted
on temperature scale in proportion to the relative concentration of PTFE fillers. Here
the DMA studies have been studied to probe the temperature dependence of storage
modulus upon blending with nylon 66/PTFE. For all the compositions, the storage
modulus can be seen increasing in the investigated temperature range, indicating that
the introduction of PTFE increases the storage modulus of nylon 66/Gr composites
proportionately with the composition.
Figure 4.4. Plots of tan δ modulus versus temperature for nylon 66//PTFE/Gr
composites
Table 4.4. Data obtained from DMA analysis for nylon 66/PTFE/Gr composites
PTFE wt. % Tan δ
Tg (oC)
Storage modulus (MPa)
Expt. Cal. Glassy region Rubbery region
0 0.077 - 72.1 924 330
5 0.074 0.072 69.7 938 354
10 0.073 0.066 66.4 1046 363
15 0.072 0.063 66.0 1040 398
20 0.070 0.061 66.2 1224 422
120
The effect of temperature on loss modulus (E'') of PTFE loaded nylon 66 is
shown in Figure 4.3. From the thermogram, it can be noticed that, the incorporation of
PTFE into nylon, causes remarkable increase of E'' value as compared to pure nylon
66. This indicates that the increase in PTFE content in nylon 66 increased the energy of
dissipation.
The plots of loss tangent (tan δ) verses temperature for all composites is shown
in Figure 4.4. The obtained tan δ values (both predicted and experimental) from DMA
thermograms for nylon 66/PTFE/Gr composites along with Tg which was represented
by the peak temperature of the tan δ curve is addressed in Table 4.4.
The experimental tan δ decreased from 0.077 to 0.070 whereas, theoretical
values from 0.072 to 0.061. A noticeable reduction in Tg from 72.1 to 66.2 0C was
noticed with increase in PTFE content from 0 to 20 wt %, which clearly shows that
PTFE particle goes in between the nylon 66 molecular layers and reduced the Tg values.
The storage modulus in the glassy region increased from 924 to 1224 MPa and in the
rubbery region it increased from 330 to 422 MPa (Figure 4.2) as increase in PTFE
content.
4.3.3.4 Thermogravimetric analysis
In order to understand the effect of PTFE on the relative thermal stability of
nylon 66/Gr/PTFE composites, TGA studies have been carried out under nitrogen
atmosphere. TGA is one of the widely used techniques to evaluate thermal stability and
thermal-degradation kinetics of polymeric materials, blends, and composites.
Thermogravimetric technique essentially involves continuous monitoring of the weight
of a sample as a function of temperature using a sensitive microbalance. Typical TGA
traces obtained for the nylon 66/PTFE/Gr composite samples containing 0, 5, 0, 15 and
20% by weight of PTFE are shown in Figure 4.5.
As can be seen from Figure 4.5 that upto 350 oC there is only a minor weight
loss corresponds to the loss of the moisture content from nylon, thereafter the weight
loss begins at 350 oC. The weight loss observed in TGA runs on these samples is given
in Table 4.5. Data generally showed a distinct and consistent non-reversible loss in
weight, attributed to the pyrolysis of nylon 66 in the temperature interval of 350–500
oC. Obviously, the composites degraded in two stages.
121
The TGA thermogram of nylon showed single step thermal degradation
processes (360-498 °C) with a weight loss of 98 %. From the TGA thermogram it was
noticed that nylon/PTFE/Gr undergoes a two-step thermal degradation processes
(Figure 4.5). It was noticed that all PTFE filled nylon composites undergo two step
thermal degradation processes. The temperature range and percent weight loss for
different thermal degradation steps of composites are shown in Table 4.5. The first step
weight loss occurred in the temperature range 339-528 °C. The weight loss which
occurred in first step decreases from 88.0 to 70.0 %. The weight loss in the first step
decreases with increase in PTFE content in nylon 66. This result clearly indicates that
the weight loss in the first step is significantly dependent on the nylon content.
Figure 4.5. TGA thermograms for nylon 66/PTFE/Gr composites
The weight loss that occurs in the temperature range 514-598 °C is called second
stage thermal decomposition in which the weight loss lies in the range 10 – 20 %. From
the table it can be seen that, the ash content of the nylon 66 composites increases with
increase in PTFE content and it lies in the range 2-10 %. The TGA thermograms
obtained were analyzed to give the percentage weight loss as a function of temperature.
T0 (temperature of onset decomposition), T10 (temperature for 10% weight loss) and
Tmax (temperature for maximum weight loss) are the main criteria to indicate that
thermal stability of the composites(Figure 4.6). Higher the values of T0, T10 and Tmax
indicates higher the thermal stability of composites.
The outcome of the TGA analysis clearly reveals (Table 4.4) that the
temperature corresponding to To, T10 or T20 or Tmax are increasing progressively with
increase in PTFE content, which clearly shows the thermal stability of the nylon matrix
122
improved with incorporation of PTFE fillers. This is due to PTFE which has high