140
CHAPTER 5: ANALYSIS OF CAPITAL STRUCTURE

CHAPTER 5: ANALYSIS OF CAPITAL
STRUCTURE
5.0 Introduction
In finance, capital structure refers to the way a corporation finances its assets
through some combination of equity, debt, or hybrid securities. A firm's capital
structure is then the composition or 'structure' of its liabilities. For example, a firm
that sells $20 billion in equity and $80 billion in debt is said to be 20% equity
financed and 80% debt-financed. The firm's ratio of debt to total financing, 80% in
this example, is referred to as the firm's leverage. In reality, capital structure may
be highly complex and include tens of sources. Gearing Ratio is the proportion of
the capital employed of the firm which come from outside of the business
finance, e.g. by taking a long term loan etc.
The Modigliani-Miller theorem, proposed by Franco Modigliani and Merton Miller,
forms the basis for modern thinking on capital structure, though it is generally
viewed as a purely theoretical result since it assumes away many important
factors in the capital structure decision. The theorem states that, in a perfect
market, how a firm is financed is irrelevant to its value. This result provides the
base with which to examine real world reasons why capital structure is relevant,
that is, a company's value is affected by the capital structure it employs. These
other reasons include bankruptcy costs, agency costs, taxes, information
asymmetry, to name some. This analysis can then be extended to look at
whether there is in fact an optimal capital structure: the one which maximizes the
value of the firm.
Capital structure in a perfect market
Assume a perfect capital market (no transaction or bankruptcy costs; perfect
information); firms and individuals can borrow at the same interest rate; no taxes;
and investment decisions aren't affected by financing decisions. Modigliani and
Miller made two findings under these conditions. Their first 'proposition' was that
the value of a company is independent of its capital structure. Their second
288
'proposition' stated that the cost of equity for a leveraged firm is equal to the cost
of equity for an unleveraged firm, plus an added premium for financial risk. That
is, as leverage increases, while the burden of individual risks is shifted between
different investor classes, total risk is conserved and hence no extra value
created.
Their analysis was extended to include the effect of taxes and risky debt. Under a
classical tax system, the tax deductibility of interest makes debt financing
valuable; that is, the cost of capital decreases as the proportion of debt in the
capital structure increases. The optimal structure, then would be to have virtually
no equity at all.
Capital structure in the real world
If capital structure is irrelevant in a perfect market, then imperfections which exist
in the real world must be the cause of its relevance. The theories below try to
address some of these imperfections, by relaxing assumptions made in the M&M
model.
Trade-off theory allows the bankruptcy cost to exist. It states that there is an
advantage to financing with debt (namely, the tax benefit of debts) and that there
is a cost of financing with debt (the bankruptcy costs of debt). The marginal
benefit of further increases in debt declines as debt increases, while the marginal
cost increases, so that a firm that is optimizing its overall value will focus on this
trade-off when choosing how much debt and equity to use for financing.
Empirically, this theory may explain differences in DIE ratios between industries,
but it doesn't explain differences within the same industry.
Pecking Order theory tries to capture the costs of asymmetric information. It
states that companies prioritize their sources of financing (from internal financing
to equity) according to the law of least effort, or of least resistance, preferring to
289
raise equity as a financing means "of last resort". Hence: internal debt is used
first; when that is depleted, then debt is issued; and when it is no longer sensible
to issue any more debt, equity is issued. This theory maintains that businesses
adhere to a hierarchy of financing sources and prefer internal financing when
available, and debt is preferred over equity if extemal financing is required. Thus,
the form of debt a firm chooses can act as a signal of its need for external
finance. The pecking order theory is popularized by Myers (1984) when he
argues that equity is a less preferred means to raise capital because when
managers (who are assumed to know better about true condition of the firm than
investors) issue new equity, investors believe that managers think that the firm is
overvalued and managers are taking advantage of this over-valuation. As a
result, investors will place a lower value to the new equity issuance.
Concept of Agency Costs:
There are three types of agency costs which can help explain the relevance of
capital structure.
D Asset substitution effect: As DIE increases, management has an increased
incentive to undertake risky (even negative NPV) projects. This is because if
the project is successful, share holders get all the upside, whereas if it is
unsuccessful, debt holders get all the downside. If the projects are
undertaken, there is a chance of firm value decreasing and a wealth transfer
from debt holders to share holders.
D Underinvestment problem: If debt is risky (eg in a growth company), the gain
from the project will accrue to debt holders rather than shareholders. Thus,
management have an incentive to reject positive NPV projects, even though
they have the potential to increase firm value.
290
o Free cash flow: unless free cash flow is given back to investors, management
has an incentive to destroy firm val ue through empire building and perks etc.
Increasing leverage imposes financial discipline on management.
Capital Structure and related concepts:
a. Cost of Capital:
The required return necessary to make a project, such as building a new factory,
worthwhile is known as cost of capital. Cost of capital includes the cost of debt
and the cost of equity. The cost of capital determines how a company can raise
money (through a stock issue, borrowing, or a mix of the two). This is the rate of
return that a firm would receive if it invested in a different vehicle with similar risk.
b. Cost of Debt:
The effective rate that a company pays on its current debt is cost of debt. This
can be measured in either before- or after-tax returns; however, because interest
expense is deductible, the after-tax cost is seen most often. This is one part of
the company's capital structure, which also includes the cost of equity. A
company will use various bonds, loans and other forms of debt, so this measure
is useful for giving an idea as to the overall rate being paid by the company to
use debt financing. The measure can also give investors an idea as to the
riskiness of the company compared to others, because riskier companies
generally have a higher cost of debt.
c. Cost of Equity:
In financial theory, the return that stockholders require for a company is its cost
of equity. A firm's cost of equity represents the compensation that the market
demands in exchange for owning the asset and bearing the risk of ownership.
291
d. Debt Financing:
When a firm raises money for working capital or capital expenditures by selling
bonds. bills. or notes to individual and/or institutional investors it is known as debt
financing. In return for lending the money, the individuals or institutions become
creditors and receive a promise that the principal and interest on the debt will be
repaid.
e. Equity Financing:
The act of raising money for company activities by selling cornmon or preferred
stock to individual or institutional investors is known as equity financing. In return
for the money paid, shareholders receive ownership interests in the corporation.
f. Debt-Equity Ratio:
A measure of a company's financial leverage calculated by dividing its total
liabilities by stockholders' equity is known as debt-equity ratio. It indicates what
proportion of equity and debt the company is using to finance its assets. A high
debUequity ratio generally means that a company has been aggressive in
financing its growth with debt. This can result in volatile earnings as a result of
the additional interest expense.
If a lot of debt is used to finance increased operations (high debt to equity), the
company could potentially generate more earnings than it would have without
this outside financing. If this were to increase earnings by a greater amount than
the debt cost (interest), then the shareholders benefit as more earnings are being
292

spread among the same amount of shareholders. However, the cost of this debt
financing may outweigh the return that the company generates on the debt
through investment and business activities and become too much for the
company to handle. This can lead to bankruptcy, which would leave shareholders
with nothing.
g. Dividend Recapitalization:
When a company incurs a new debt in order to pay a special dividend to private
investors or shareholders it is known as dividend recapitalization. This usually
involves a company owned by a private investment firm, which can authorize a
dividend recapitalization as an alternative to selling its equity stake in the
company.
293

5.1 Cadila Healthcare Limited
5.1.1: Capital History
In year 1996 CHL came with an equity issue of outstanding capital with an issue
price of Rs. 5.Table 5.1.1 gives the details of the capital issues.
Table 5.1.1: Capital History of CHL
CAPITAL HISTORY DETAILS
I' .. . . . ,; . . j; . Opening/Issue date: Issue type: 31·May-96 Outstanding Capital
Security type Equity
Issue price (Rs.) 5
Source: CMIE Prowess
In year 1997 CHL came with an equity issue of outstanding capital with an issue
price of Rs. 5.Table 5.1.2 gives the details of the capital issues.
Table 5.1.2: Capital History of CHL
CAPITAL HISTORY DETAILS
,,-. Opening/Issue date: Issue type: 31-Mar-97 Outstanding Capital
Security type Equity
Issue price (Rs.) 5
Source. CMIE Prowess
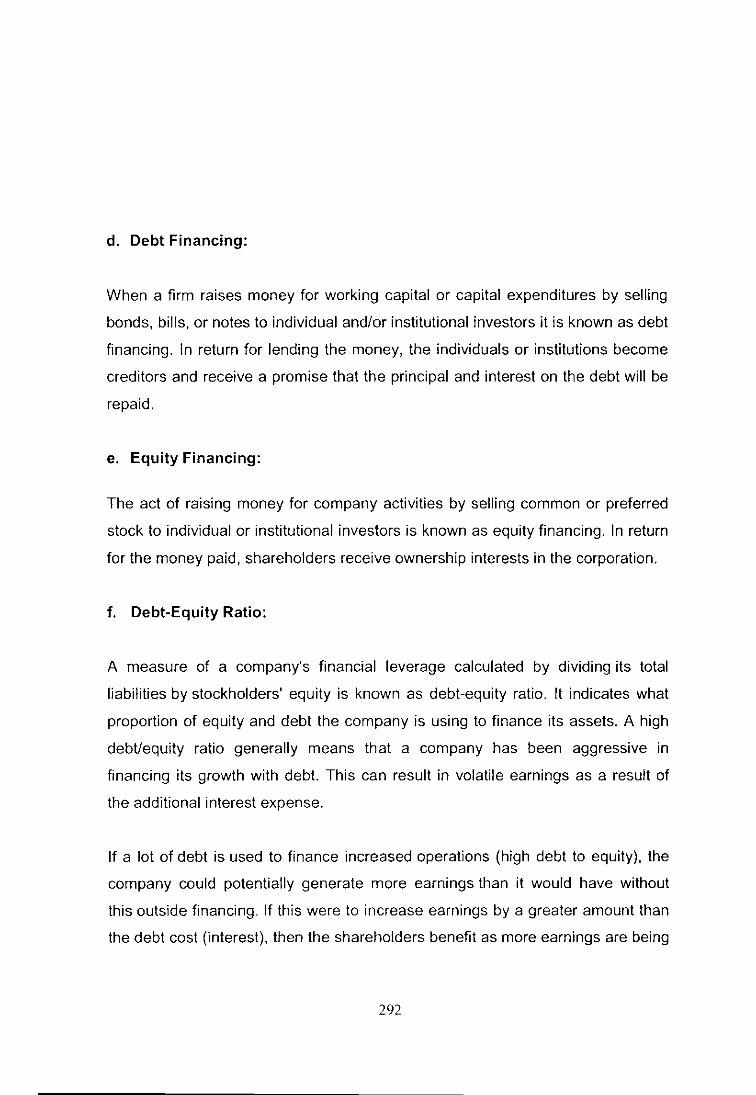
In year 1998 CHL came with an equity issue of outstanding capital with an issue
price of Rs. 5. CHL. the capital issue increased the PUC of CHL by Rs. 7.44 Crs.
Table 5.1 .2 gives the details of the capital issues.
294
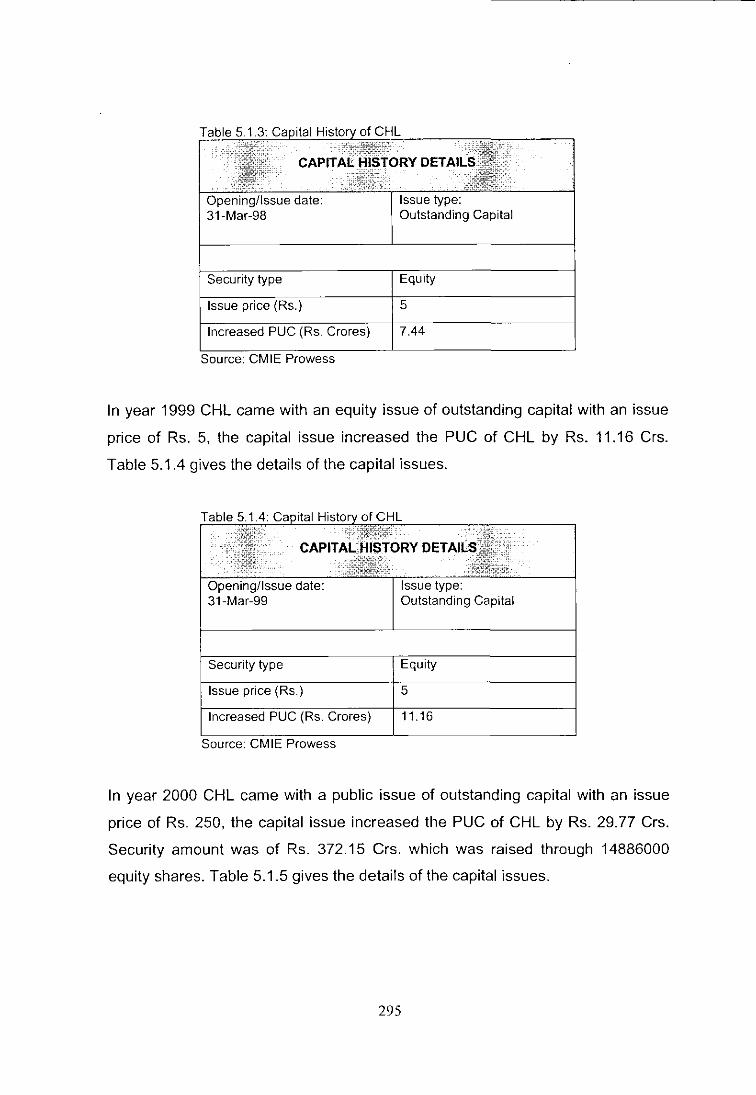
Table 5.1.3: ofCHL
date: Issue type: Outstanding Capital
Equity
Issue price (Rs.) 5
Increased PUC (Rs.
Source: CMIE Prowess
In year 1999 CHL came with an equity issue of outstanding capital with an issue
price of Rs. 5, the capital issue increased the PUC of CHL by Rs. 11.16 Crs.
Table 5.1.4 gives the details of the capital issues.
Security type
Issue price (Rs.)
Increased PUC (Rs. Crores) 11.16
Source: CMIE Prowess
In year 2000 CHL came with a public issue of outstanding capital with an issue
price of Rs. 250, the capital issue increased the PUC of CHL by Rs. 29.77 Crs.
Security amount was of Rs. 372.15 Crs. which was raised through 14886000
equity shares. Table 5.1.5 gives the details of the capital issues.
295
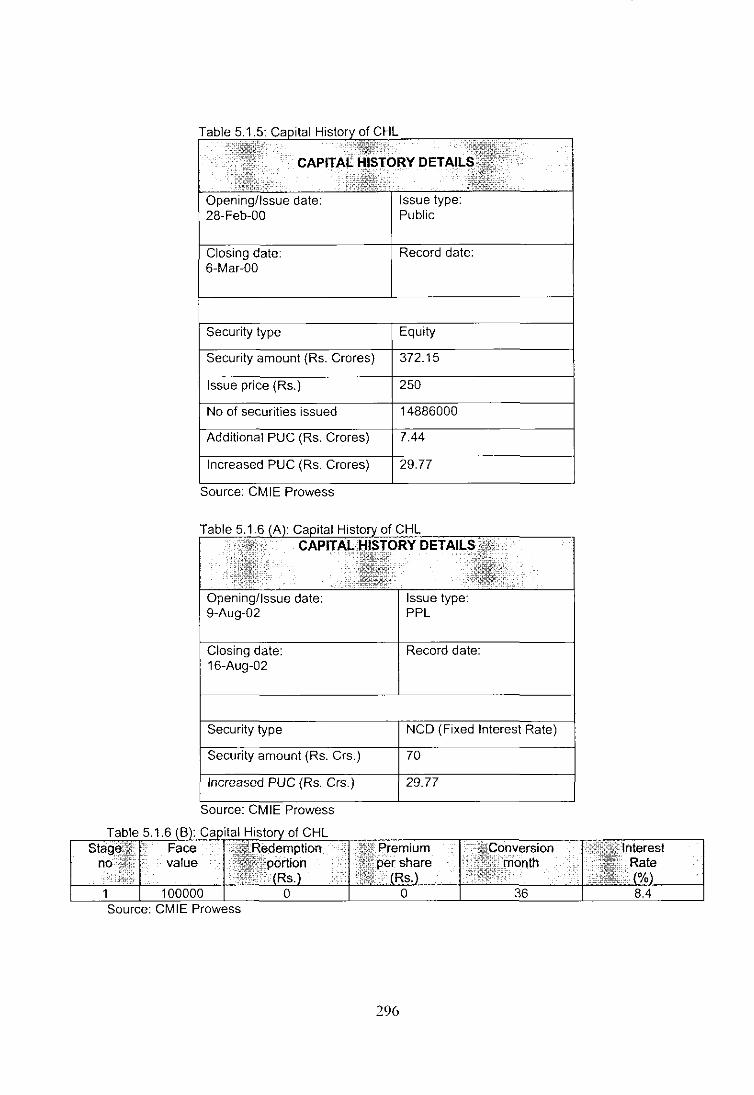
Table 5.1.5:
Closing date: 6-Mar-OO
Security type
amount (Rs.
olCHl
(Rs. Crares)
Opening/Issue date: 9-Aug-02
Closing 16-Aug-02
296
Issue type: Public
Equity
7.44
29.77
Issue type: PPl
Record date:
29.77
In year 2002 CHL issued non convertible debentures with a face value of Rs.
100000 with an interest rate of 8.4%. Through the issue CHL raised an amount of
Rs. 70 Crs. Table 5.1.6 (A &B) gives the details of the capital issues.
Table 5.1.7 (A): Capital History of CHL
CAPITAL HISTORY DETAILS
Opening/Issue date: Issue type: 1-Aug-03 PPL
Security type NCD (Fixed Interest Rate)
Security amount (Rs. Crores) 60
Issue price (Rs.) 100000
No of securities issued 0
Increased PUC (Rs. Crores) 29.77
Source: CMIE Prowess
Table 5.1.7 (B): Ca~ ital History of CHL Stage Face Redemption Premium Conversion Interest
no value p~rti,~n per, s~.~re month Rate
1 Rs. Rs. (0/0)
0 100000 0 45 7 Source. CMIE Prowess
In year 2003 CHL issued non convertible debentures with an issue price of Rs.
100000 with an interest rate of 7%. Through the issue CHL raised an amount of
Rs. 60 Crs. Table 5.1.7 (A &B) gives the details of the capital issues.
In year 2003 CHL came with a post-amalgamation issue with an exchange ratio
of 7:3. Issue price was Rs. 5 and 32,65,486 numbers of securities were issued
increasing PUC to Rs. 3.4 Crs. Table 5.1.8 gives the details of the capital issues.
In year 2006 CHL came with a bonus issue in the ratio of 1:1, 6,28,06,854
numbers of shares were issued. Issue increased the PUC to Rs. 62.8 Crs. Table
5.1.9 gives the details of the capital issues.
297

T bl 5 1 8 Ct I H' t f CHL a e apl a IS ory 0
E1~' .....;'
CAPITAL HISTORY DETAILS:;W ..• j .. '"
Opening/Issue date: Issue type: 5-Sep-03 Post-Amalgamation
Closing date: Record date: 12-Sep-03
Security type Equity
Issue price (Rs.) 5
Ratio 7.00: 4.00
No of securities issued 3265486
Additional PUC (Rs. Crores) 1.63
Increased PUC (Rs. Crores) 31.4
Equity shares alloted to the erstwhile shareholders of German Remedies Ltd., Recon Healthcare Ltd., Zydus Pathline Ltd. and Zoom Properties with Cadila Healthcare Ltd.
Source. CMIE Prowess
T bl 5 1 9 C 't I H t f CHL a e ... apia IS ory 0
CAPITAL HISTORY DETAILS .j ••
Opening/Issue date: Issue type: 30-Aug-06 Bonus Issue
Closing date: Record date: 31-Aug-06
Security type Equity
Issue price (Rs.) 5
Ratio 1.00:1.00
No of securities issued 62806854
Additional PUC (Rs. Crs.) 31.4
Increased PUC (Rs. Crs.) 62.8
Source. CMIE Prowess
298
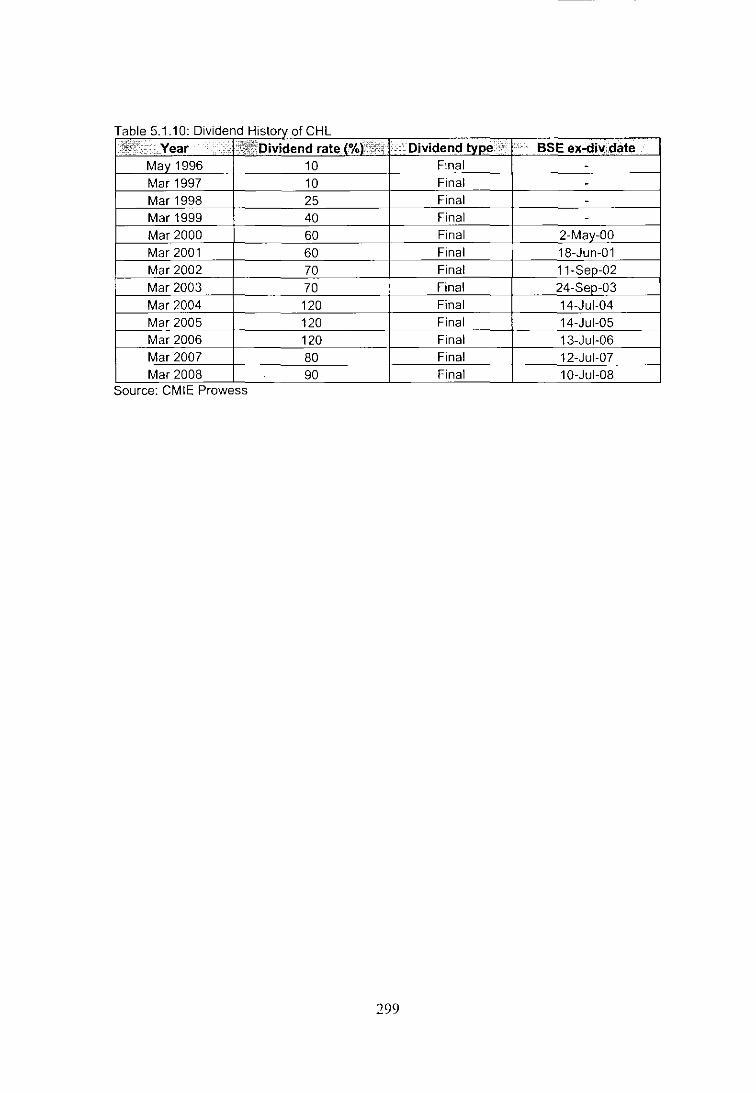
T bl 5 1 10 Od d H' t a e IVI en IS ory 0 fCHL
"joEt'"" Year i~~'Dividend rate (%r~cf:i' , ,'Dividend type ;"""
"
BSE ex-div,date May 1996 10 Final -Mar 1997 10 Final -Mar 1998 25 Final -Mar 1999 40 Final -Mar 2000 60 Final 2-May-00 Mar 2001 60 Final 18-Jun-01 Mar 2002 70 Final 11-Sep-02 Mar 2003 70 Final 24-Sep-03 Mar 2004 120 Final 14-Jul-04 Mar 2005 120 Final 14-Jul-05 Mar 2006 120 Final 13-Jul-06 Mar 2007 80 Final 12-Jul-07 Mar 2008 90 Final 10-Jul-08
Source: CMIE Prowess
299

5.1.2: Analysis of Liabilities
A. Sources of Funds
SC:
SL:
Share Capital
Secured Loans
RSP: Reserves & Surplus
USL: Unsecured Loans
Table 5 1 11· Sources of Funds of CHL Particulars 2003 2004 2005 2006 2007 2008
SC 68.2 62.8 62.8 31.4 31.4 31.4 RSP 1164.6 991 819.5 704.9 583 508.1 SL 636.7 559.3 362.7 312.5 287.4 343.7
USL 183.2 179.6 85 120.7 84.1 62 Source: CHL Annual Reports and CMIE Prowess
In case of CHL reserves & surplus and secured loans were the major sources of
funds during the period under study. The average reserves & surplus were Rs.
795.18 Crs. which reached to a level of Rs. 1164.60 Crs. in the AY 2002-03 and
in the AY 2007-08 it was at its lowest level of Rs. 508.10 Crs.
Figure 5.1.1: Sources of Funds of CHL
1400
1200
~ 1000 o 800
--- ---
SOURCES OF CAPITAL
600 -------- ----- ----- -
~ 400
200 o
2003 2004 2005 2006
YEAR
I-sc -RSP SL USL] -~--~.
Source: CHL Annual Reports and CMIE Prowess
2007 2008
During the period under study average secured loans were of Rs. 417.05 Crs.
which reached to a level of Rs. 636.70 Crs. in the A Y 2002-03 and in the A Y
2006-07 it was at its lowest level of Rs. 287.40 Crs.
300
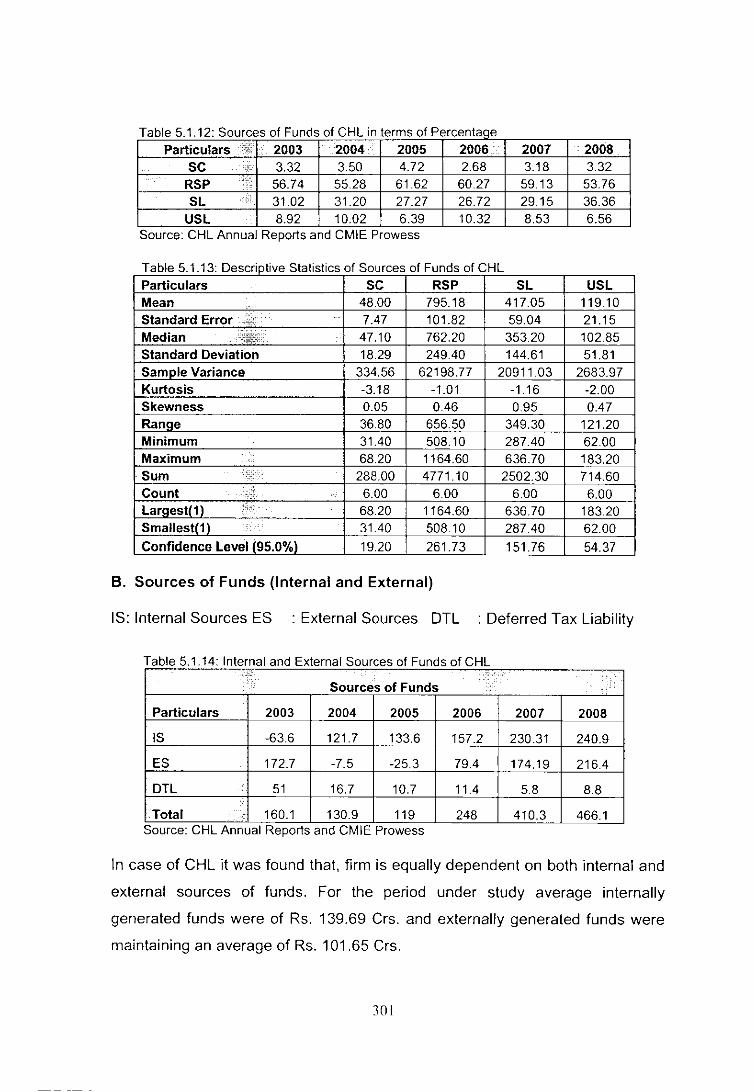
Table 5.1.12: Sources of Funds of CHL in terms of Percentaqe Particulars "ili 2003 2004 2005 2006. 2007 2008
SC 3.32 3.50 4.72 2.68 3.18 3.32 RSP
;-56.74 55.28 61.62 60.27 59.13 53.76
SL ;- 31.02 31.20 27.27 26.72 29.15 36.36 USL 8.92 10.02 6.39 10.32 8.53 6.56
Source: CHL Annual Reports and CMIE Prowess
Table 5.1.13: Descriptive Statistics of Sources of Funds of CHL Particulars SC RSP SL USL Mean 48.00 795.18 417.05 119.10
Standard Error ~ 7.47 101.82 59.04 21.15 Median 47.10 762.20 353.20 102.85 Standard Deviation 18.29 249.40 144.61 51.81 Sam ole Variance 334.56 62198.77 20911.03 2683.97 Kurtosis -3.18 -1.01 -1.16 -2.00 Skewness 0.05 0.46 0.95 0.47 Ranae 36.80 656.50 349.30 121.20 Minimum 31.40 508.10 287.40 62.00 Maximum .:'. 68.20 1164.60 636.70 183.20 Sum F. 288.00 4771.10 2502.30 714.60 Count ;'; . 6.00 6.00 6.00 6.00 Laraestl11 ;iF 68.20 1164.60 636.70 183.20 Smallest(1 ) ; .. 31.40 508.10 287.40 62.00 Confidence Level (95.0%\ 19.20 261.73 151.76 54.37
B. Sources of Funds (Internal and External)
IS: Internal Sources ES : External Sources DTL : Deferred Tax Liability
Table 5 1 14' Internal and External Sources of Funds of CHL ; ..
Sources of Funds : .:. Particulars 2003 2004 2005 2006 2007 2008
IS -63.6 121.7 133.6 157.2 230.31 240.9
ES 172.7 -7.5 -25.3 79.4 174.19 216.4
DTL 51 16.7 10.7 11.4 5.8 8.8 -=
Total 160.1 130.9 119 248 410.3 466.1 Source: CHL Annual Reports and CMIE Prowess
In case of CHL it was found that, firm is equally dependent on both internal and
external sources of funds. For the period under study average internally
generated funds were of Rs. 139.69 Crs. and externally generated funds were
maintaining an average of Rs. 101.65 Crs.
301

Figure 5.1.2: Sources of Funds (Internal and External) of CHL
SOURCES OF FUNDS (In!. & Ex!.)
300
250
200 -----~ 150
>< 0 0 100 e-,; 50 /
/
0: / /
0
209Z" -- /
-50 2004 2005 2006
/----/
aJ -ES
DTL
2007 2008
-100 -
YEAR
Source: CHL Annual Reports and CMIE Prowess
T bl 5 1 15 I t a e : n erna an dE t xerna IS Gurces 0 f F d f CHL· t t e un so In erms o· percen a,
Sources of Funds
Particulars 2003 2004 2005 2006 2007 2008
IS -39.73 92.97 112.27 63.39 56.13 51.68
ES 107.87 -5.73 -21.26 32.02 42.45 46.43
DTL 31.86 12.76 8.99 4.60 1.41 1.89
Table 5.1.16: Descriptive S tatistics 0 Internal and External Sources of Funds of CHL Particulars IS ES DTL Mean 136.69 101.65 17.40 Standard Error 44.87 41.63 6.88 Median 145.40 126.05 11.05 Standard Deviation 109.90 101.98 16.85 Sample Variance 12079.08 10400.56 283.77 Kurtosis 2.41 -2.18 5.06 Skewness -1.37 -0.31 2.21 Range 304.50 241.70 45.20 Minimum -63.60 -25.30 5.80 Maximum 240.90 216.40 51.00 Sum 820.11 609.89 104.40 Count 6.00 6.00 6.00 Largest(1 ) 240.90 216.40 51.00 Smaliest(1 ) -63.60 -25.30 5.80 Confidence Level (95.0%) 115.34 10702 17.68
302
i. Analysis of I nternal Sources
RP Retained Profits DEP Depreciation
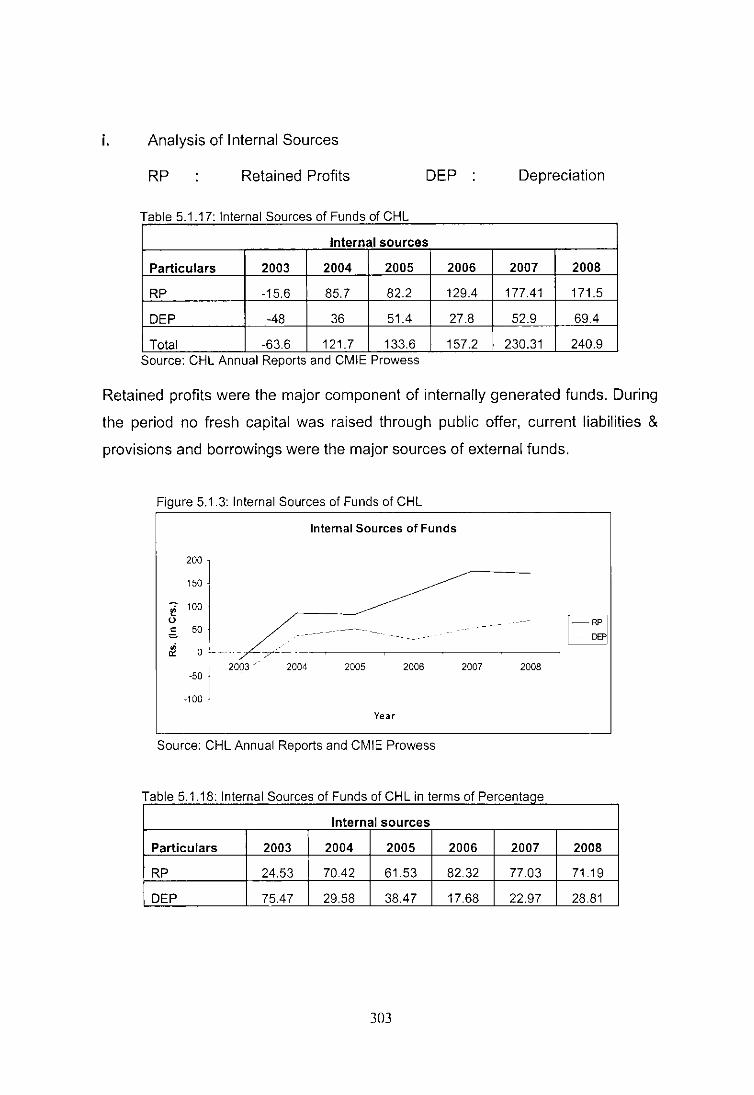
Table 5 1 17· Internal Sources 01 Funds 01 CHL ..
Internal sources
Particulars 2003 2004 2005 2006 2007 2008
RP -15.6 85.7 82.2 129.4 177.41 171.5
DEP -48 36 51.4 27.8 52.9 69.4
Total -63.6 121.7 133.6 157.2 230.31 240.9 Source: CHL Annual Reporls and CMIE Prowess
Retained profits were the major component of internally generated funds. During
the period no fresh capital was raised through public offer, current liabilities &
provisions and borrowings were the major sources of external funds.
Figure 5.1.3: Internal Sources 01 Funds 01 CHL
Internal Sources of Funds
200
150
------- ~I ~ 100 0 c 50
&! o !-~--.- /~-~.---------~------------------~
I 2003/
-50 I -100 "
2004 2005 2006 2007 2008
Year
Source: CHL Annual Reports and CMIE Prowess
T bl 5 1 18 I t a e .. : n erna IS ources 0 un so In erms 0 IF d ICHL· t IP ercen age
Internal sources
Particulars 2003 2004 2005 2006 2007 2008
RP 24.53 70.42 61.53 82.32 77.03 71.19
DEP 75.47 29.58 38.47 17.68 22.97 28.81
303
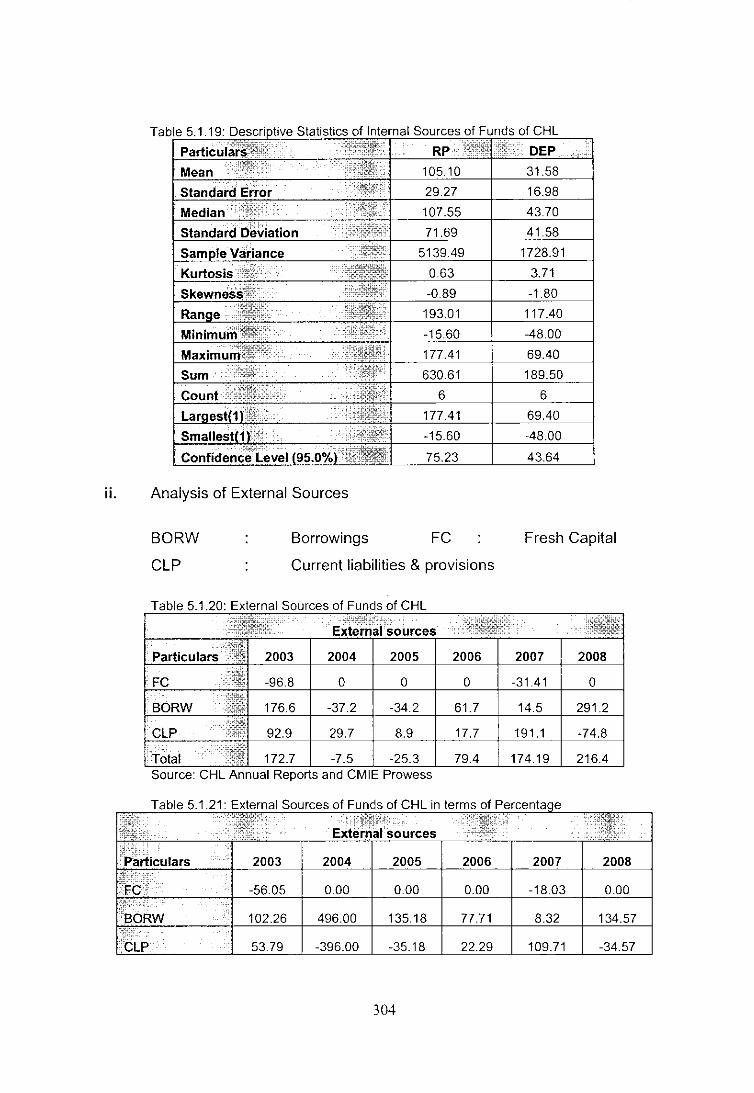
ii. Analysis of External Sources
Borrowings FC BORW
CLP Current liabilities & provisions
Table 5.1.20: External Sources of Funds of CHL
2004 2005 2006
FC o o o
29.7 8.9 7
172.7 -7.5 -25.3 79.4 Source: CHL Annual Reports and CMIE Prowess
Table 5.1.21: External Sources of Funds of CHL in terrns of
2003
77.71
53.79 -396.00 -35.18 22.29
304
Fresh Capital
2007 2008
-31 .41 o
191.1 -74.8
174.19 216.4
2008
109.71 -34.57

Figure 5.1.4: External Sources of Funds of CHL
SOURCES OF EXTERNAL FUNDS
400
300
~ 200 0
~" 0 100 '
12 0 ........
·100 20 2004 2005 2006 2007 2008
-200
YEAR
[- FC - BORW CLP j Source: CHL Annual Reports and CMIE Prowess
T bl 51 22 D a e r St r r f E t escrlpllve a IS les 0 xerna IS ources 0 f F d f CHL un so Particulars FC BORW CLP
Mean -21.37 78.77 44.25 Standard Error 15.93 53.33 36.64
Median 0.00 38.10 23.70
Standard Deviation 3903 130.64 89.75
Sample Variance 1523.44 17066.10 8054.18
Kurtosis 3.77 -0.27 1.02
Skewness -1.97 0.98 0.63 Range 96.80 328.40 265.90
Minimum -96.80 -37.20 -74.80
Maximum 0.00 291.20 191.10
Sum -128.21 472.60 265.50 Count 6.00 6.00 6.00 Largest(1 ) 0.00 291.20 191.10
Smaliestt11 -96.80 -37.20 -74.80
Confidence Level 195.0%) 40.96 137.10 94.18
C. Shareholder's Fund
AEC
IEC
SEC
CCSA
: Authorized equity capital
: Issued equity capital
: Subscribed equity capital
PEC
BSC
: Paid-up equity capital
: Bonus share capital
: Capital contribution, suspense & application money
In case of CHL for the AY 2002-03 paid up equity capital was Rs. 29.8 Crs. which
increased to Rs. 31.4 Crs. in the following year. Paid equity capital reached a
305

level of Rs. 62.8 ers. in the AY 2006-07. Except for AY 2002-03 capital
contribution, suspense & application money was zero. From AY 2002-03 to AY
2005-06 bonus share capital was Rs. 7.44 ers. which increased to Rs. 38.85
ers. in AY 2006-07.
T bl 51 23 C a e om position 0 1 Sh h Id ' F d 1 CHL are a ers un 0
Particulars 2003 2004 2005 2006 2007 2008
AEC 45 45 45 45 65 70
IEC 29.8 31.4 31.4 31.4 62.8 62.8
SEC 29.8 31.4 31.4 31.4 62.8 62.8
PEC 29.8 31.4 31.4 31.4 62.8 62.8
CCSA 1.6 0 0 0 0 0
BSC 7.44 7.44 7.44 7.44 38.85 38.85 Source: CHL Annual Reports and CMIE Prowess
Figure 5.1.5: Shareholder's Funds 01 CHL
Shareholder's Fund
80 1
70 j _ 60' -AEC
~ 50; -IEC
~ 40 J SEC
= I
/ FE(;
~ ~~ j -CCSA
-BSC
2003 2004 2005 2006 2007 2008
Year
Source: CHL Annual Reports and CMIE Prowess
T bl 5124 C a e omposltlon 0 1 Sh h Id ' F d f CHL . are 0 er s un 0 In percentage terms
Particulars 2003 2004 2005 2006 2007 2008
AEC 100 100 100 100 100 100
IEC 66.22 69.78 69.78 69.78 96.62 89.71
SEC 66.22 69.78 69.78 69.78 96.62 89.71
PEC 66.22 69.78 69.78 69.78 96.62 89.71
CCSA 3.56 0.00 0.00 0.00 0.00 0.00
BSC 16.53 16.53 16.53 16.53 59.77 55.50
306
D. NETWORTH
IEC: Issued equity capital FR: Free reserves SR: Specific reserves
CCSA Capital contribution, suspense & application money
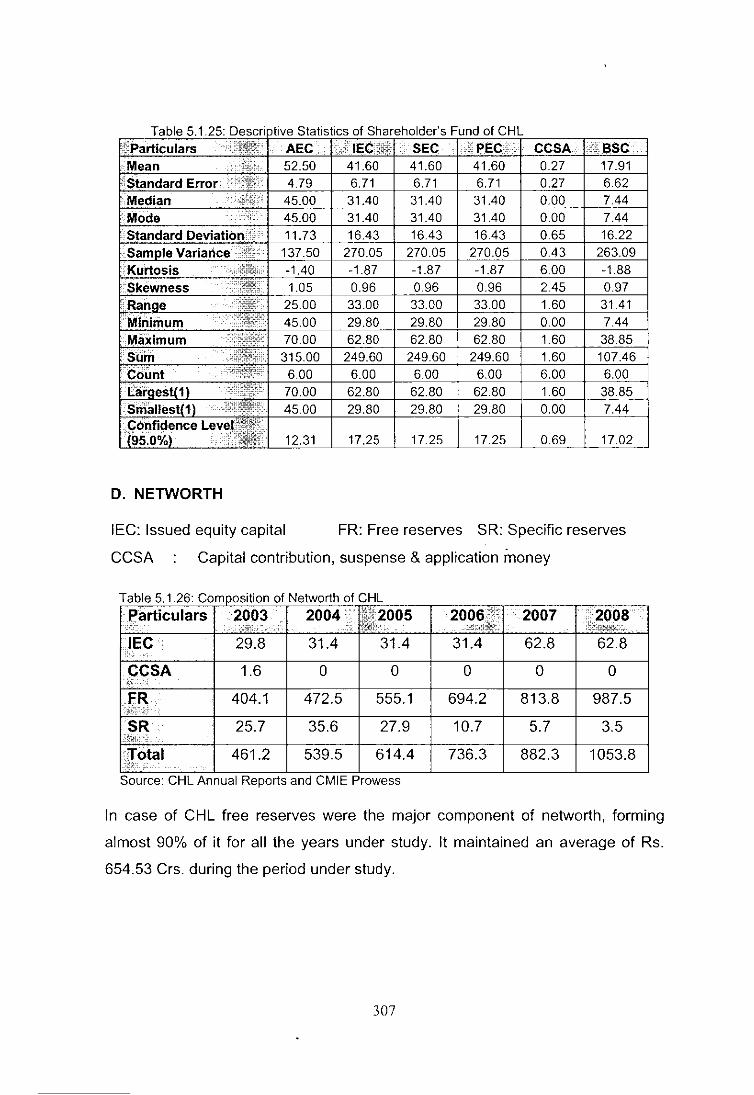
Table 5.1.26: Composition 01 Networth 0 IC HL
Particulars '2~~3 2004; 14:'.2005 2006i:~ 2007 2008 ,;¢~ In <:' ,;:rd:1:dtjr" :i:;1?m}iffi;;,~, ,
IE~ 29.8 31.4 31.4 31.4 62.8 62.8
CCSA 1.6 0 0 0 0 0 <;", .. FR 404.1 472.5 555.1 694.2 813.8 987.5 i:ti::: .:
SR 25.7 35.6 27.9 10.7 5.7 3.5 ::#kt,f ~i, "
.!Total 461.2 539.5 614.4 736.3 882.3 1053.8 :i': . : Source: CHL Annual Reports and CMIE Prowess
In case of CHL free reserves were the major component of networth, forming
almost 90% of it for all the years under study. It maintained an average of Rs.
654.53 Crs. during the period under study.
307
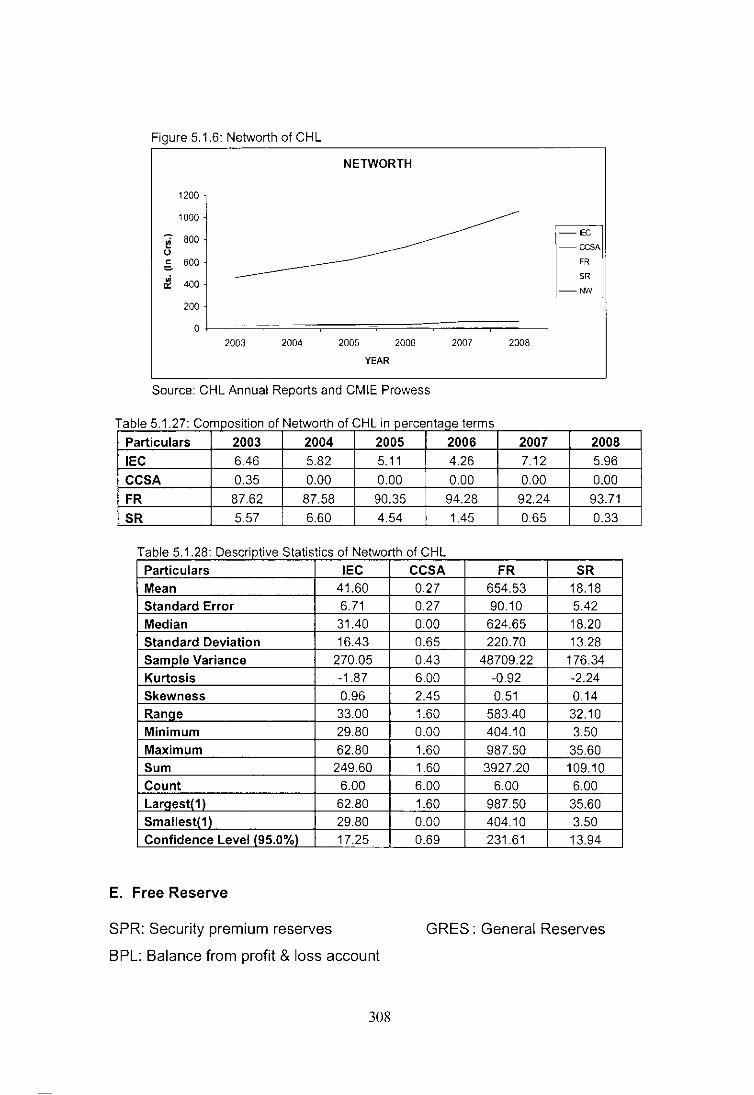
Figure 5.1.6: Networth 01 CHL
NETWORTH
1200
1 1000
-lee ~ 800 0
-CCSA
c 600 FR = • SR 0: 400
-tNV
200
0 2003 2004 2005 2006 2007 2008
YEAR
Source: CHL Annual Reports and CMIE Prowess
T bl 51 27 C a e omposltlon a IN etwort a In percentage terms h I CHL'
Particulars 2003 2004 2005 2006 2007 2008
IEC 6.46 5.82 5.11 4.26 7.12 5.96
CCSA 0.35 0.00 0.00 0.00 0.00 0.00
FR 87.62 87.58 90.35 94.28 92.24 93.71
SR 5.57 6.60 4.54 1.45 0.65 0.33
Table 5.1.28: Descriptive Statistics 01 Networth a CHL
Particulars IEC CCSA FR SR Mean 41.60 0.27 654.53 18.18 Standard Error 6.71 0.27 90.10 5.42
Median 31.40 0.00 624.65 18.20 Standard Deviation 16.43 0.65 220.70 13.28 Sample Variance 270.05 0.43 48709.22 176.34 Kurtosis -1.87 6.00 -0.92 -2.24
Skewness 0.96 2.45 0.51 0.14
Ranae 33.00 1.60 583.40 32.10 Minimum 29.80 0.00 404.10 3.50
Maximum 62.80 1.60 987.50 35.60 Sum 249.60 1.60 3927.20 109.10
Count 6.00 6.00 6.00 6.00 Laraest(1 ) 62.80 1.60 987.50 35.60 Smaliest(1 ) 29.80 0.00 404.10 3.50 Confidence Level (95.0%) 17.25 0.69 231.61 13.94
E. Free Reserve
SPR: Security premium reserves GRES: General Reserves
BPL: Balance from profit & loss account
308

Table 5.1.29: Composition 0 1 Free R eserve 0 ICHL
Particulars 2003 2004 2005 2006 2007 2008 SPR 256.1 256.1 256.1 256.1 224.7 224.7
GRES 91.3 110 150 200 505 600
BPL 56.7 106.4 149 238.1 84.1 162.8 Source: CHL Annual Reports and CMIE Prowess
In case of CHL general reserves showed a remarkable increase reaching to a
level of Rs. 600 Crs. in AY 2007-08 from a level of Rs. 91.3 Crs. in AY 2002-03.
Security premium reserve was almost at a level of Rs. 245 Crs. during the period
under study.
Figure 5.1.7: Free Reserve 01 CHL
700 600 J
-; 500 j o 400 : c ~ 300 '
FREE RESERVE
~ 200 i 100 ~
0~1----~----__ ----~----__ ----__ --~ 2003 2004 2005 2006 2007 2008
YEAR
r= SPR -=- GRES ---SPL]
Source: CHL Annual Reports and CMIE Prowess
T bl 51 30 C a e omposltlon 0 1 F R ree eserve 0 ICHL' In percentage terms
Particulars 2003 2004 2005 2006 2007 2008 SPR 63.38 54.20 46.14 36.89 27.61 22.75 GRES 22.59 23.28 27.02 28.81 62.05 60.76 BPL 14.03 22.52 26.84 34.30 10.33 16.49
309

T bl 51 31 0 a e escnpllve a IS ICS 0 ree t" St t" t" 1 F R eserve a ICHL Particulars SPR GRES BPL Mean 245.63 276.05 132.85
Standard Error 6.62 89.58 26.53 Median 256.10 175.00 127.70
Standard Deviation 16.21 219.43 64.98 Sample Variance 262.92 48147.82 4222.07
Kurtosis -1.88 -1.43 0.16
Skewness -0.97 0.93 0.68
Ran!le 31.40 508.70 181.40 Minimum 224.70 91.30 56.70
Maximum 256.10 600.00 238.10 Sum 1473.80 1656.30 797.10 Count 6.00 6.00 6.00
La!!lest(1 ) 256.10 600.00 238.10
Smallest(1 ) 224.70 91.30 56.70 Confidence Level (95.0%) 17.02 230.27 68.19
F. Borrowings (Secured I Unsecured)
Table 5.1.32: Composition of Borrowinqs (Secured I Unsecured) 01 CHL
Particulars 2003 2004 2005 2006 2007 2008
SB 329.3 343.7 287.4 312.5 362.7 5593
USB 113.6 62 84.1 120.7 85 179.6
TOTAL 442.9 405.7 371.5 433.2 447.7 738.9 Source. CHL Annual Reports and CMIE Prowess
In case of CHL 78% borrowings were secured and 22% borrowings were
unsecured. On an average secured borrowings were of Rs. 365.82 Crs. and
unsecured borrowings were of Rs. 107.50 Crs.
Figure 5.1.8 Borrowings (Secured I Unsecured) 01 CHL
SECURED & UNSECURED BORROWINGS
600 -
500
~ 400 u ,g. 300
iii 200 a:
100 ;
o ,-1---2003 2004 2005 2006
YEAR
Source: CHL Annual Reports and CMIE Prowess
310
2007 2008
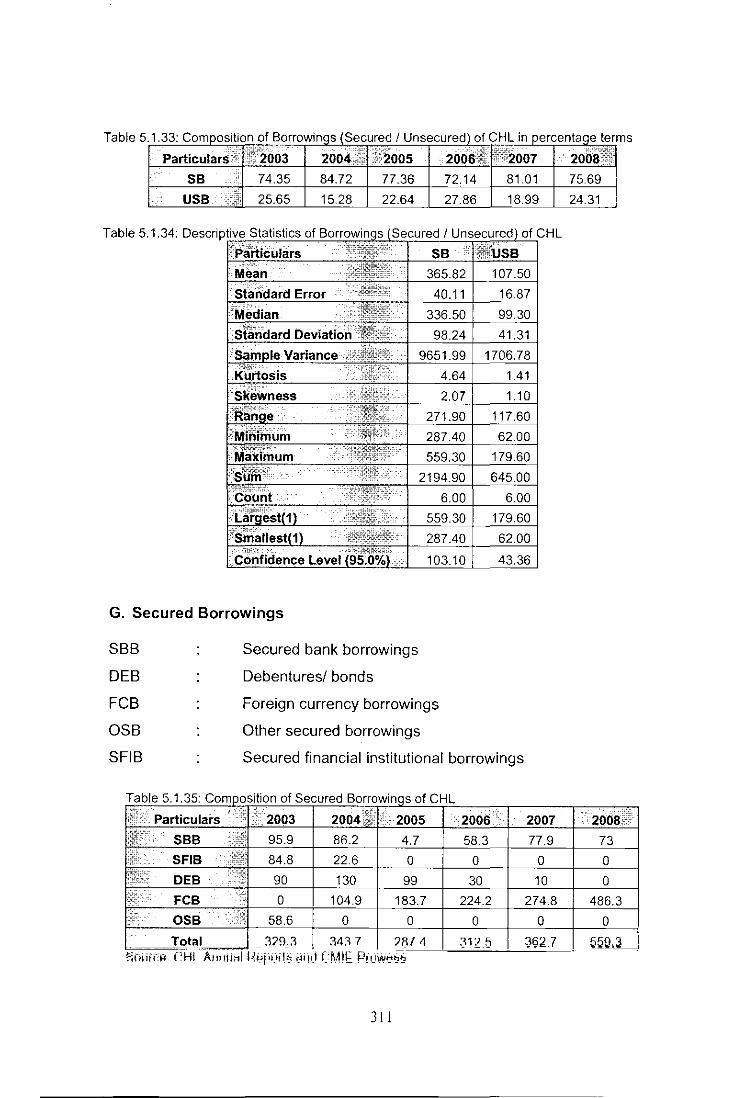
Table 5 .1.33: Composition of Borrowinqs (Secured I Unsecured) of CHL in percentaqe ter
ParticularS;i . ~'2()O3 2004.:~1 ~i:2005 2006~: ffl'1ll2007 SB . '.: 74.35 84.72 77.36 72.14 81.01
USB ~* 25.65 15.28 22.64 27.86 18.99
Table 5.1.34: DescriP~~~~~==~~~tE~~]ji~~~CI
G. Secured Borrowings
SBB
DEB
FeB OSB
SFIB
Secured bank borrowings
Debentures/ bonds
Foreign currency borrowings
Other secured borrowings
Secured financial institutional borrowings
J II
2oo811~ 75.69
24.31
ms

Figure 5.1.9: Secured Borrowings of CHL
SECURED BORROWINGS
600
500
~ 400 u c: 300 '=-iii 200 0:
100
O~~ =:=-= 2003 2004 2005
YEAR
2006 2007 2008
l-sBB -SFIS DEB FeB -ossl
Source: CHL Annual Reports and CMIE Prowess
Table 5.1.36: Composition of Secured Borrowinqs of CHL in percentaqe terms
Particulars 2003 2004 2005 2006 2007
SBB 29.12 2508 1.64 18.66 21.48
SFIB 25.75 6.58 0.00 0.00 0.00
DEB 27.33 37.82 34.45 9.60 2.76
FCB 0.00 30.52 63.92 71.74 75.77
aSB 17.80 000 0.00 0.00 0.00
Table 5.1.37: Descriptive Statistics of Secured Borrowinqs of CHL
Particulars SBB SFIB DEB FCB
Mean 66.00 17.90 59.83 212.32
Standard Error 13.30 13.88 21.85 67.47
Median 75.45 0.00 60.00 203.95
Standard Deviation 32.59 34.00 53.52 165.26
Sample Variance 1061.93 1155.87 2864.17 27309.57
Kurtosis 3.13 4.46 -2.22 1.09
Skewness -1.68 2.11 0.13 0.66
Range 91.20 84.80 130.00 486.30
Minimum 4.70 0.00 0.00 0.00
Maximum 95.90 84.80 130.00 486.30
Sum 396.00 107.40 359.00 1273.90
Count 6.00 6.00 6.00 6.00
Lanlest(1 ) 95.90 84.80 130.00 486.30
Smaliest(1 ) 4.70 0.00 0.00 0.00
Confidence Level (95.0%) 34.20 35.68 56.16 173.43
312
2008
13.05
0.00
0.00
86.95
0.00
aSB
9.77
9.77
0.00
23.92
572.33
6.00
2.45
58.60
0.00
58.60
58.60
6.00
58.60
0.00
25.11

H. Unsecured Borrowings
FD: Fixed deposits DC: Deferred credit
CP: Commercial papers
FCB: Foreign currency borrowings
UBB: Unsecured Bank borrowings
OUB: Other unsecured borrowings
UBFI: Unsecured borrowings from financial institutions
UDB: Unsecured debentures/bonds
Table 5.1.38: Composition of Unsecured Borrowinos of CHL
Particulars 2003 2004 2005 2006 FD 23.3 0 0 0
UBB 20 20 0 12.7
UBFI 0 0.4 0.3 0.2
UDB 25 0 0 0
DC 30.2 38.3 40.3 41
FCB 0 0 40.2 63.5
CP 10 0 0 0
QUB 5.1 3.3 3.3 3.3
Total 113.6 62 84.1 120.7 Source. CHL Annual Reports and CMIE Prowess
Figure 5.1.10: Unsecured Borrowings of CHL
160 -140
""7 120 & 100 c 80 ~
60 l 40 , 20 J o I
2003
UNSECURED BORROWINGS
~
-------- --L~ .. ~
2004 2005 2006
YEAR
2007 2008 0 0
0 0
0.2 0.1
0 0
41.3 43.3
43.5 136.2
0 0
0 0
85 179.6
/ 2007 2008
I-+- FD -.~ UBB UBFI UDB -----*- DC --- FeB -.~ cp - aUB I
Source: CHL Annual Reports and CMIE Prowess
313

Table 5.1.39: Composition of Unsecured Borrowinqs of CHL in percentaqe terms
• particularsil'r2()03 20()411 ~2005 2()()6itl~j:2007 . 20013;~ FD· Lii 20.51 0.00 000 000 0.00 0.00
. UBB:r: 17.61 32.26 0.00 10.52 0.00 0.00
UBFI,:~ 0.00 0.65 0.36 0.17 0.24 0.06
UDB ,ii, 22.01 0.00 0.00 0.00 0.00 0.00
DC \: 26.58 61.77 47.92 33.97 48.59 24.11
CP .. ~ 8.80 0.00 0.00 0.00 0.00 000
QUB 4.49 5.32 3.92 2.73 0.00 0.00
Mode::' L~; ,i .'.' 0.00 0.00 0.20 0.00 - 0.00 0.00 3.30
Standard "~",,,~,~i: 9.51 9.98 0.14 10.21 4.63 50.41 4.08 2.06
.,. .,.:."L.. '90.48 99.68 0.02 104.17 21.47 2541.01 16.67 4.24
~~_:e:::T 6.00 -2.75 -0.30 6.00 3.68 1.63 6.00 -1.37
~ 2.45 0.26 0.00 2.45 -1.81 1.16 2.45 -0.42
~~-~s= 23.30 20.00 0.40 25.00 13.10 136.20 10.00 5.10
.;;1":i,,,:· .i 0.00 0.00 0.00 0.00 30.20 0.00 000 0.00
,:'i~l:l it 23.30 20.00 0.40 25.00 43.30 136.20 10.00 5.10
Sum ~ ___ ' ____ ~·+-~23~.3~0-+_5~2~.7~0-+~1.~20~~2~5~.0~0~~2~34~.4~0~~2~83~.4~0~_1~0 .. 0~0r-1~5;~ ... 0~0 Count ',:1~'1~:': 6.00 6.00 6.00 6.00 6.00 6.00 _6:00 6.00
I '11~ . 23.30 20.00 0.40 25.00 43.30 136.20 1000 5.10
1);~li11,·' 0.00 0.00 000 0.00 30.20 0.00 0.00 0.00
;~'[~tel (95.0%):1 9.98 10.48.0.15 10.71 4.86 52.90 4.28 2.16
I. Borrowings (Sources)
BB Bank borrowings DB Debentures / bonds
FD Fixed deposits FB Foreign borrowings
CP Commercial paper DC Deferred credit
OB Other borrowings
FIB Financial institutional borrowings
314

Table 5.1.41: Composition 01 Borrowings (Sources olCHl
Particulars 2003 2004 2005 2006
BB 115.9 106.2 4.7 71
FIB 84.8 22.6 0 0
DB 90 130 99 30
FD 23.3 0 0 0
FB 0 104.9 223.9 287.7
CP 10 0 0 0
DC 30.2 38.3 40.3 41
OB 88.7 3.7 3.6 3.5
Total 442.9 405.7 371.5 433.2 Source. CHl Annual Reports and CMIE Prowess
Figure 5 1.11: Borrowings (Sources) 01 CHl
TOTAL BORROWINGS (SOURCES)
700 600
-; 500
U 400 c "" 300 ~ 200
2007 2008
77.9 73
0 0
10 0
0 0
318.3 622.5
0 0
41.3 43.3
0.2 0.1
447.7 738.9
10~ i_I _::o~~~:;;~~==============-~ 2003 2004 2005 2006 2007 2008
YEAR
DB FD -FB -CP - DC -08 I
Source: CHl Annual Reports and CMIE Prowess
Table 5.1.42: Composition 01 Borrowinc s (Sources 01 CHL in percentac e terms
Particulars 2003 2004 2005 2006 2007 2008
BB 26.17 26.18 1.27 16.39 17.40 9.88
FIB 19.15 5.57 0.00 0.00 0.00 0.00
DB 20.32 32.04 26.65 6.93 2.23 0.00
FD 5.26 0.00 0.00 0.00 0.00 0.00
FB 0.00 25.86 60.27 66.41 71.10 84.25
CP 2.26 0.00 0.00 0.00 0.00 0.00
DC 6.82 9.44 10.85 9.46 9.22 5.86
OB 20.03 0.91 0.97 0.81 0.04 0.01
315
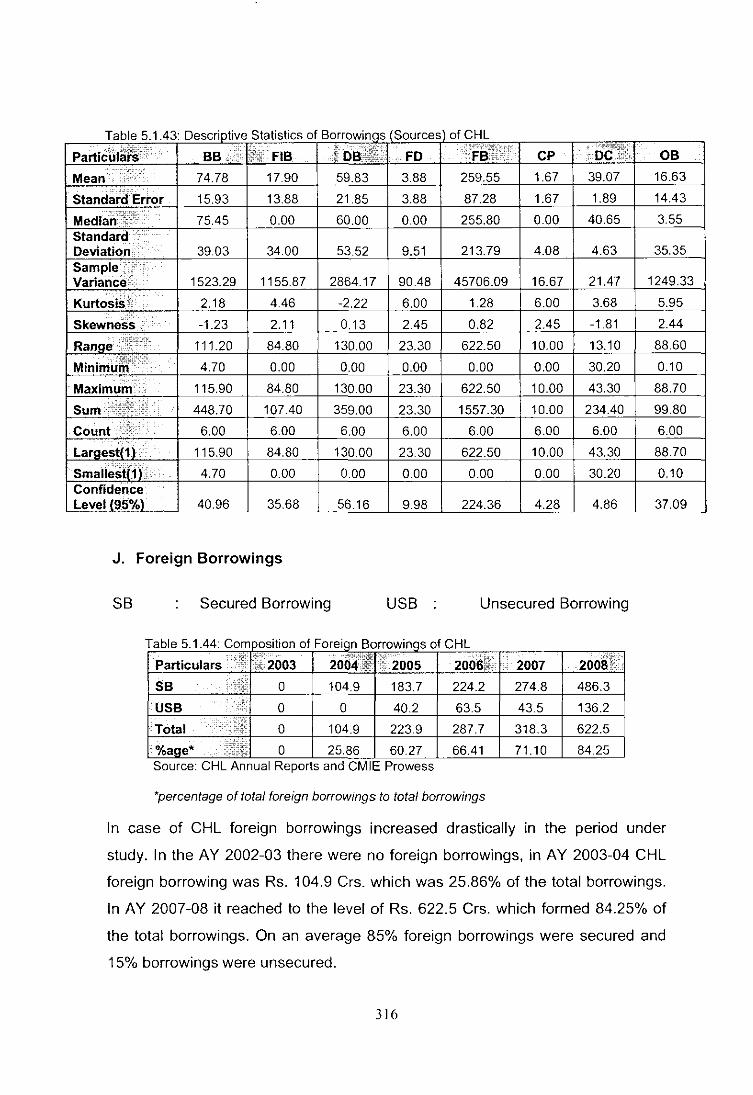
Table 5.1.43: Descriptive Statistics of Borrowings Sources
Mean,.:, 74.78 17.90 59.83 3.88 .' '''' ..
Standard Error 15.93 13.88 21.85 3.88
MedianT,;r: 75.45 0.00 60.00 0.00 Standard:: ..... ' Deviation: Sample.':, Variance':·: .
Kurtosi~H ' ..
Skewness,
. Maximum:
Largest!'\) : .
Confidence Level 19.5%l
39.03
1523.29
2.18
-1.23
111.20
4.70
115.90
448.70
6.00
115.90
4.70
40.96
34.00
1155.87
4.46
2.11
84.80
0.00
84.80
107.40
6.00
84.80
0.00
35.68
J. Foreign Borrowings
53.52 9.51
2864.17 90.48
-2.22 6.00
0.13 2.45
130.00 23.30
0.00 0.00
130.00 23.30
359.00 23.30
6.00 6.00
130.00 23.30
0.00 0.00
56.16 9.98
ofCHl
CP
259.55 1.67 39.07
87.28 1.67 1.89
255.80 0.00 40.65
213.79 4.08 4.63
45706.09 16.67 21.47
1.28 6.00 3.68
0.82 2.45 -1.81
622.50 10.00 13.10
0.00 0.00 30.20
622.50 10.00 43.30
1557.30 10.00 234.40
6.00 6.00 6.00
622.50 10.00 43.30
0.00 0.00 30.20
224.36 4.28 4.86
SB Secured Borrowing USB Unsecured Borrowing
T bl a e 5.1.44: C omposltlon 0 fF orelgn Borrowings of CHl
Particulars :.~ +>", 2004'1 1ft 2005 . 2006~f!; ;; 2007
;'>Fi, :~2003 2008::
SB :i~ 0 104.9 183.7 224.2 274.8 486.3
USB 't; 0 0 40.2 63.5 43.5 136.2
Total :j: 0 104.9 223.9 287.7 318.3 622.5
%age' 1] 0 25.86 60.27 66.41 71.10 84.25 Source: CHl Annual Reports and CMIE Prowess
'percentage of total foreign borrowings to total borrowings
OB
16.63
14.43
3.55
35.35
1249.33
5.95
2.44
88.60
0.10
88.70
99.80
6.00
88.70
0.10
37.09
In case of CHL foreign borrowings increased drastically in the period under
study. In the AY 2002-03 there were no foreign borrowings, in AY 2003-04 CHL
foreign borrowing was Rs. 104.9 Crs. which was 25.86% of the total borrowings.
In AY 2007-08 it reached to the level of Rs. 622.5 Crs. which formed 84.25% of
the total borrowings. On an average 85% foreign borrowings were secured and
15% borrowings were unsecured.
316

Figure 5.1.12: Foreign Borrowings 01 CHL
FOREIGN BORROWINGS
600
500
~ 400 o s:: 300 c !Ii 200
a::: 1000
' I --------~-~=
2003 2004 2005 2006
YEAR
Source: CHL Annual Reports and CMIE Prowess
2007 2008
T bl 5145 C a e om posllon 0 IF orelgn B orrowlngs 0 I CHL· In percen age erms
Particulars 2003 2004 2005 2006 2007 2008
SB - 100.00 82.05 77.93 86.33 78.12
USB - 0.00 17.95 2207 13.67 21.88
T bl 5146 0 a S escnpllve a IS les 0 r St t r IF orslgn B orrowln, so I CHL
Particulars SB USB
Mean 212.32 47.23
Standard Error 67.47 20.58
Median 203.95 41.85 Standard Deviation 165.26 50.41
Sample Variance 27309.57 2541.01
Kurtosis 1.09 1.63
Skewness 0.66 1.16
RanQe 486.30 136.20
Minimum 0.00 0.00 Maximum 486.30 136.20 Sum 1273.90 283.40
Count 6.00 6.00 LarQ8st(1) 486.30 136.20
Smallest(1) 0.00 0.00
Confidence Level (95.0%) 173.43 52.90
317
5.1.3: Determinants of Capital Structure
Dependent Variable:
DER Debt Equity Ratio
Independent Variable:
1. NWCGW " Net WC / Gross WC
2. SIZE " In (Total assets)
3. LRD " In (R&D Expenditure)
4. GFATA " Gross fixed asset / Total asset
318

A. Debt Equity Ratio and Size
Table 5.1.47: Debt Equity Ratio and Size of CHL
li.1TIL YEAR;U.,tOER ~SrZE I'ff~t 2003 14.86 7.09
'fl'll :'2006 13.80 7.35
1,::,.2007 ", 7.13 7.56
li~!il':2008 11.77 7.75
0.58
0.17
2.44
6
Table 5.1.51: Residual Output of Debt Equity Ratio and Size of CHL
:,;';,::~'~m2:;::- -" Predicted;~l! ,. Residuals'i':1 [r' Sta~dard~!I
I· Observation' DEFf'~!f,' ! Reslduals'l"'l' 1 13.64 1.22 0.56 2 13.22 -0.30 -0.14 3 12.97 -1.14 -0.52 4 1206 1.74 0.80
5 10.79 -3.66 -1.67
6 9.63 2.14 0.98
319
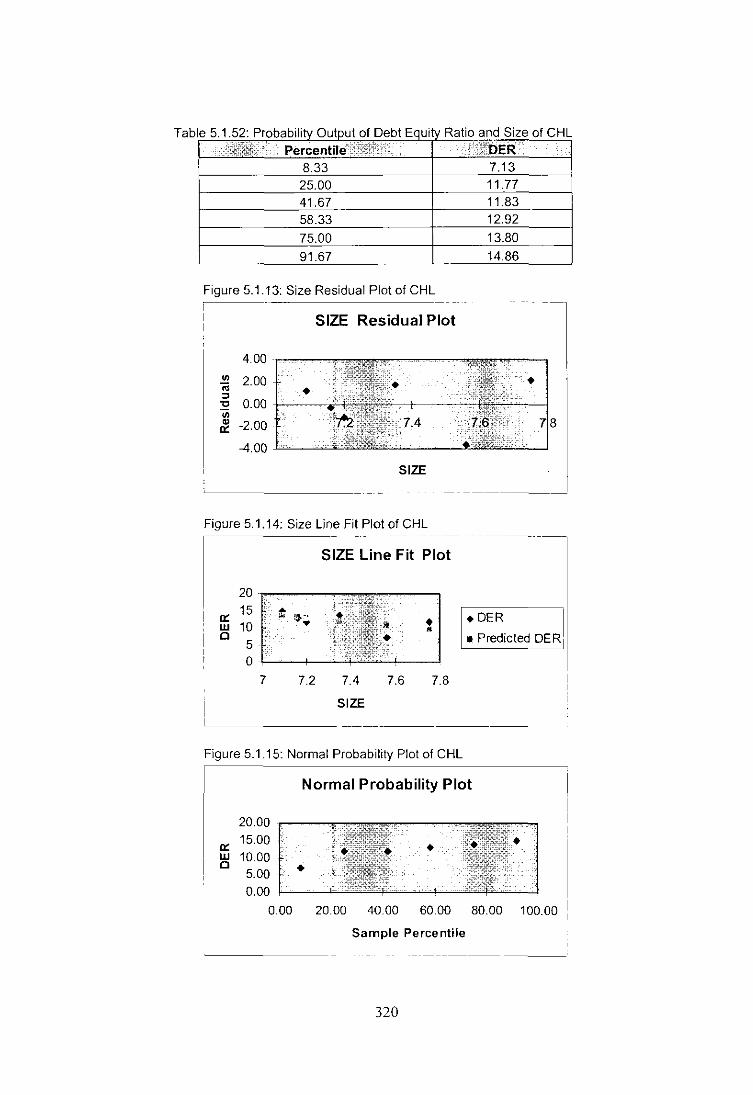
Ratio and Size
Figure 5.1.13: Size Residual Plot of CHL
SIZE Residual Plot
4.00
'" 2.00 OJ • => .., 0.00
'" ., -2.00 OC
-4.00
SIZE
Figure 5.1.14: Size Line Fit Plot of CHL -- ------------"
SIZE Line Fit Plot
20 15 ..
.OER I OC 1.» If; • w 10 • 0 • Predicted OER 5-0
7 7.2 7.4 7.6 7.8
SIZE
Figure 5.1.15: Normal Probability Plot of CHL
Normal Probability Plot
20.00
0:: 15.00
w 10.00 0 • 5.00
0.00
0.00 20.00 40.00 60.00 80.00 100.00
Sample Percentile
-------------
320

B. Debt Equity Ratio and R&D Expenditure
Table 5.1.
I R
R uare
0.33
Error 2.20
Observations 6
Table 5.1.55: ANOVA Results of Statistics of Debt Equity Ratio and LRD of CHL ·.ii'S'" :'''(If :,: 55 M5 :. ,;'i':: F . 5iQnific;ance F Regression 1 16.64 16.64 3.43 0.1376
Residual 4 19.40 4.85
Tofal:': 5 36.05
321

LRD of CHL
Figure 5.1.16: LRD Residual Plot of CHL
I R&D Expenditure Residual Plot
~ 2.00 ::l
"'C 'iii
'" 0::
0.00 r----+~~
-2.00 1
-4.00 "-'-~-~
R&D Expenditure
Figure 5.1.17: LRD Line Fit Plot of CHL
R&D Expenditure Line Fit Plot
20
0:: 15
• DER w 10 I'
,
0 • • Predicted DER. 5 -------
0
0 2 4 6
R&D Expenditure
Figure 5.1.18: Normal Probability Plot of CHL
Normal Probability Plot
20.00
0:: 15.00 • w 10.00
0 • 5.00 0.00
0.00 20.00 40.00 60.00 80.00 100.00
Sample Percentile
322
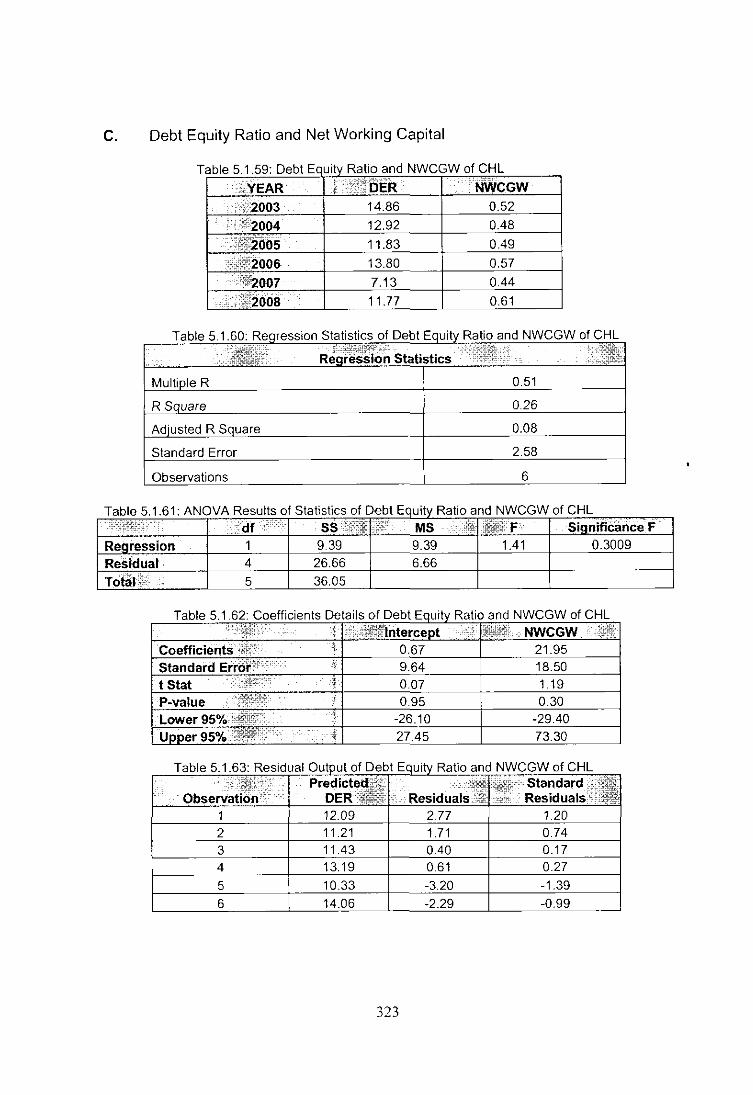
c. Debt Equity Ratio and Net Working Capital
Table 5.1.59: Debt Ec uity Ratio and NWCGW of CHL
: :>":2003 14.86 0.52 : ::; 1;':2004 12.92 0.48
·:;;tJ;~()b5 11.83 0.49
13.80 0.57
7.13 0.44
11.77 0.61
Statistics of Debt Ratio and NWCGW of CHL
Mul· R
R
0.08
Error 2.58
6
Table 5.1.63: Residual Output of Debt Equity Ratio and NWCGW of CHL
.
1 12.09 2.77 1.20 2 11.21 1.71 0.74 3 11.43 0.40 0.17 4 13.19 0.61 0.27
5 10.33 -3.20 -1.39
6 14.06 -2.29 -0.99
323
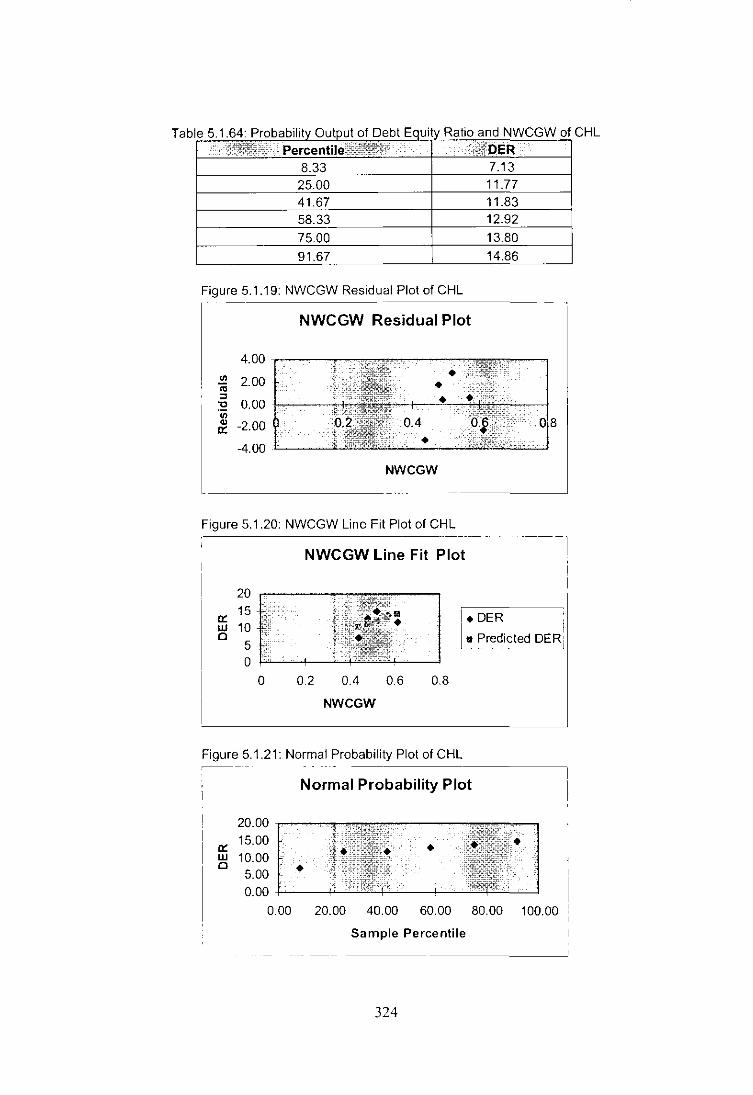
Tab Ie 5.1.64: Probability Output of Debt Equity Ratio and NWCGW of CHL . PercentileiS@:~!i:
. ; ii:fOER .. : 8.33 7.13 25.00 11.77
41.67 11.83
58.33 12.92
75.00 13.80
91.67 14.86
Figure 5.1.19: NWCGW Residual Plot of CHL
NWCGW Residual Plot
4.00
'" 2.00 ;;; ::l "0 0.00
'" ., -2.00 IX:
-4.00
NWCGW
Figure 5.1.20: NWCGW Line Fit Plot of CHL
NWCGW Line Fit Plot
20
IX: 15
LU 10 Cl
5
I.DER :
I• Predicted DER! .. _- ---~
0
0 0.2 0.4 0.6 0.8
NWCGW
Figure 5.1.21: Normal Probability Plot of CHL
Normal Probability Plot
20.00
IX: 15.00
LU 10.00 Cl • 5.00
0.00
000 20.00 40.00 60.00 80.00 100.00
Sample Percentile
324
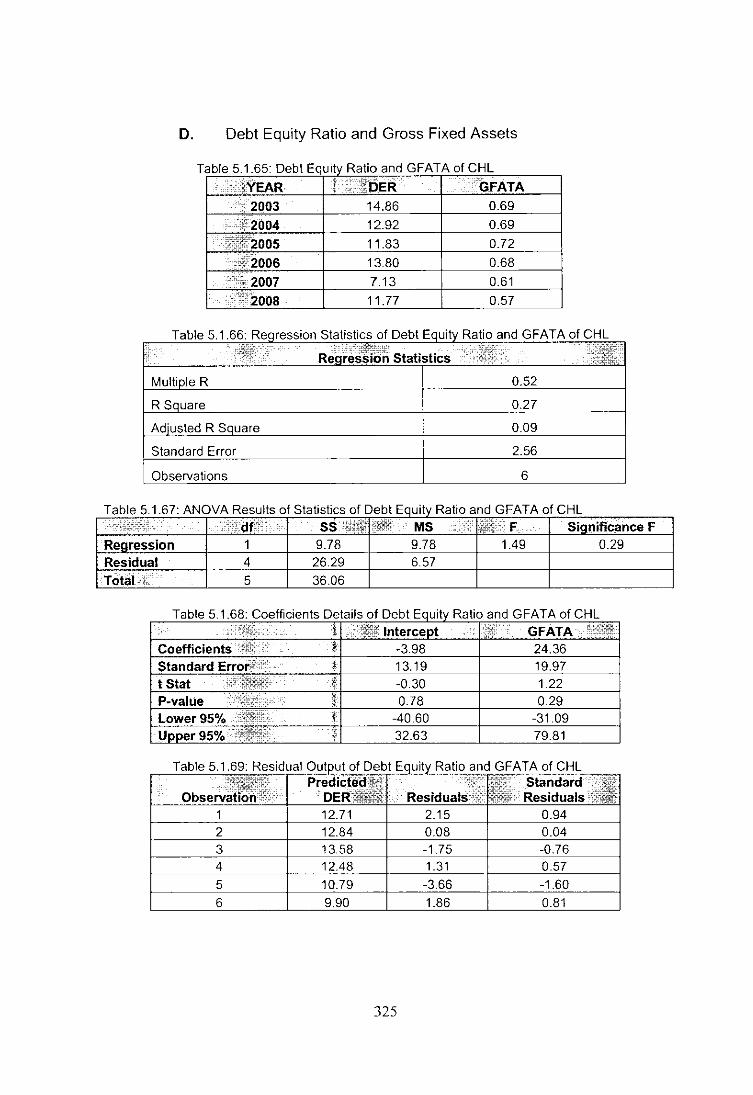
D. Debt Equity Ratio and Gross Fixed Assets
Table 5 165: Debt Equity Ratio and GFATA of CHL
2003 14.86 0.69
::lf2004 12.92 0.69
51$'2006 13.80 0.68
1:~.2007 7.13 0.61 _12:"1
':"··2008 11.77 0.57
Table 5.1.66: Statistics of Debt
Statistics
i I 0.52
Standard Error
Table 5.1.67: AN o VA Results 0 fS tatistlcs 0 f D b E e t :qUlty R abo an d GFATA fCHL 0
.. ··'t~:·" .. , .. SS .... MS .. 0; .,;&~, •..... F Significance F Reoression 1 9.78 9.78 1.49 0.29 Residual 4 26.29 6.57
·Tohil.,. 5 3606
Table 5.1.68: Coefficients Details of Debt Equity Ratio and GFATA of CHL . .. I Intercept I~~~ ., GFATA ..... 'E'!cm:-1' Coefficients· :':ji,i' ~ -3.98 24.36 Standard Error;::·"·· . t 13.19 19.97 t Stat . :.:. 'Ft""":- f -0.30 1.22 P-value ' :.0:. ., .. ~ 0.78 0.29 Lower 95% 1! -40.60 -3109 Upper
. " f 32.63 79.81
325

Tab Ie 5.1.70: Probability Output of Debt Equitv Ratio and GFATA of C :.', Percentile;'i;f;~,:",i:: .. ' .·:;4t~bER
8.33 7.13 25.00 11.77 41.67 11.83 58.33 12.92
75.00 13.80
91.67 14.86
Figure 5.1.22: GFATA Residual Plot of CHL I ---
GFATA Residual Plot
4.00
'" 2.00 ;;; :::l "C 0.00
'" Q)
a: -4.00
GFATA - - --------~
Figure 5.1.23: GFATA Line Fit Plot of CHL
20.00
a: 15.00 w 10.00 0
5.00 0.00
0.00
- ------------~
GFATA Line Fit Plot
~~ • DER
0.20 0.40 0.60 0.80
GFATA
• Predicted DER
Figure 5.1.24: Normal Probability Plot of CHL
Normal Probability Plot
20.00
a: 15.00 • w 10.00 0 • 5.00
0.00
0.00 20.00 40.00 60.00 80.00 100.00
Sample Percentile
326
HL

Dependent Variable
1. DER = Total Borrowings / Equity Capital (Paid Up)
Independent variables
1. NWCGW = Net we / Gross we
2. SIZE = In (Total assets)
3. LRD = In (R&D Expenditure)
4. GFATA = Gross fixed asset / Total asset
Tabl ~ - .... " .............. " ....... ,., ... "~ "' ............ " dent Variables of ..... ''-
YEAR DER NWCGW SIZE LRD GFATA .
2003. 14.86 0.52 7.09 3.64 0.69
···2004···· . ~~i~j~'$,·k; ;;y;;t\l%i1il~k;'pi
12.92 0.48 7.16 4.48 0.69
00;2005 •• 11.83 0.49 7.20 4.64 0.72
. 2006 13.80 0.57 7.35 4.78 0.68
2007. 7.13 0.44 7.56 5.05 0.61
..... 2008 .. 11.77 0.61 7.75 5.09 0.57 ~ill;;.:.;·;.!>,,, ';;0":41< ~,
327

Table 5.1.72: Descriptive Statistics
Descriptive Statistics
Mean Std. Deviation N DER 12.0517 2.6851 6 NWCGW .5199 6.318E-02 6 SIZE 7.3512 .2554 6 LRD 4.6121 .5291 6 GFATA .6583 5.740E-02 6
Table 5.1.73: Correlation Matrix
Correlations
DER NWCGW SIZE LRD GFATA Pearson Correlation DER 1.000 .513 -.583 -.681 .520
NWCGW .513 1.000 .388 .117 -.341 SIZE -.583 .388 1.000 .820 -.928
LRD -.681 .117 .820 1.000 -.597
GFATA .520 -.341 -.928 -.597 1.000 Sig. (1-tailed) DER .149 .112 .068 .145
NWCGW .149 .223 .413 .254
SIZE .112 .223 .023 .004
LRD .068 .413 .023 .106 GFATA .145 .254 .004 .106
N DER 6 6 6 6 6 NWCGW 6 6 6 6 6 SIZE 6 6 6 6 6 LRD 6 6 6 6 6 GFATA 6 6 6 6 6
328

Table 5.1.74: Model Summary
Model SummarY'
Chanae Statistics
Adjusted Std. Error of R Square Durbin-W Model R R Square R Square the Estimate Chanqe F Chanqe df1 df2 Sia. F Chanae atson 1 1.000a .999 .995 .1847 .999 263.996 4 1 .046 1.970
a. Predictors: (Constant), GFATA, NWCGW, LRD, SIZE
b. Dependent Variable: DER
Table 5.1.75: ANOVA Results
ANOVAb
Sum of Model Squares df Mean Square F Siq. 1 Regression 36.015 4 9.004 263.996 .046a
Residual 3.411 E-02 1 3.411 E-02
i Total 36.049 5
a. Predictors: (Constant), GFATA, NWCGW, LRD, SIZE
b. Dependent Variable: DER
329

Table 5.1.76: Coefficients
Coefficients"
Slandardi zed
Unstandardized Coefficien Coefficients Is 95% Confidence Interval for B Correlations CoJlinearit Statistics
Model B Std. Error Beta I Sig Lower Bound Upper Bound Zero-order Partial Part Tolerance VIF 1 (Constant) 136.064 21.147 6.434 .098 -132.633 404.760
NWCGW 40.186 1.917 .946 20.962 .030 15.827 64.545 .513 .999 .645 .465 2.151 SIZE -18.052 2.635 -1.717 -6.850 .092 -51.537 15.433 -.583 -.990 -.211 .015 66.433 LRD 1.327 .581 .262 2.283 .263 -6.060 8.714 -.681 .916 .070 .072 13.872 GFATA -27.832 7.625 -.595 -3.650 .170 -124.717 69.053 .520 -.964 -.112 036 28.085
a. Dependent Variable: DER
Table 5.1.77: Coefficients Correlation tn·
Coefficient CorrelationS' Ol :Ie
Model GFATA NWCGW LRD SIZE 1 Correlations GFATA 1.000 -.599 -.861 .968
::r: :>-;> -::;
< '2 r~
NWCGW -.599 1.000 .671 -.683 LRD -.861 .671 1.000 -.942
):. Cl l>
SIZE .968 -.683 -.942 1.000 :u , Covariances GFATA 58.141 -8.758 -3.819 19.456
NWCGW -8.758 3.675 .748 -3.451 LRD -3.819 .748 .338 -1.443
w (.) ~.
: .'~
C --.. -:1
" I\.) ., ", ., SIZE 19.456 -3.451 -1.443 6.945 "'
a. Dependent Variable: DER
330
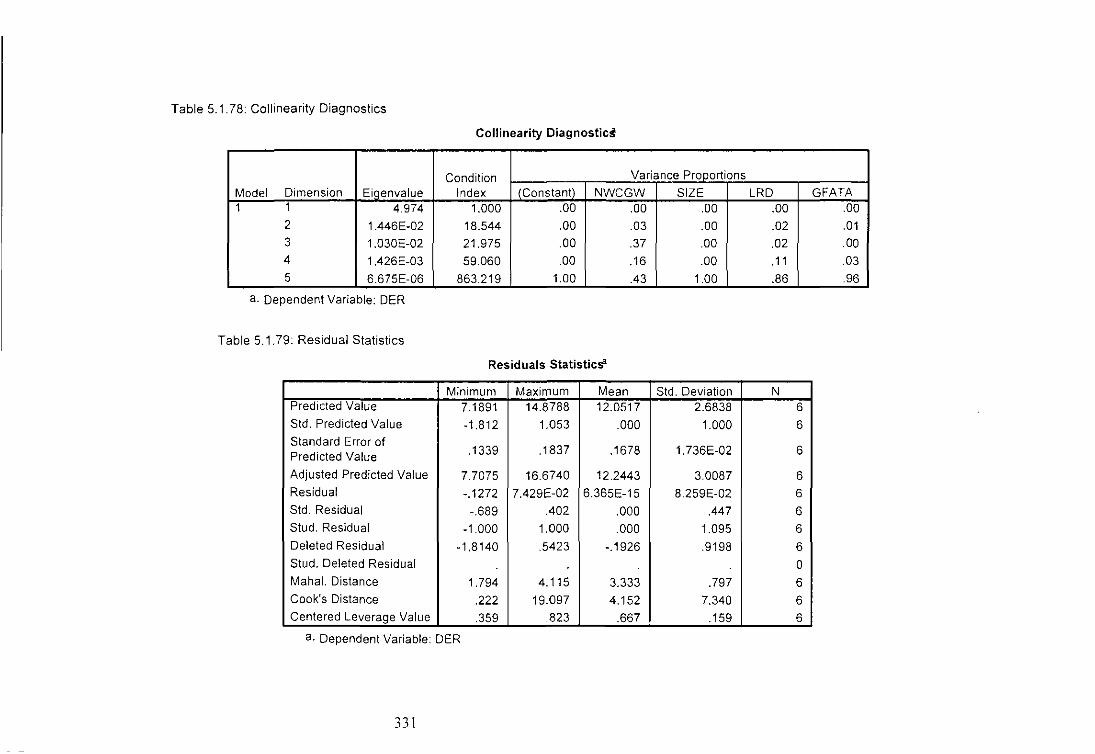
Table 5.1.78: Collinearity Diagnostics
Collinearity Diagnostics
Condition Variance Proportions
Model Dimension Eigenvalue Index (Constant) NWCGW SIZE LRD GFATA 1 1 4.974 1.000 .00 .00 .00 .00 .00
2 1.446E-02 18.544 .00 .03 .00 .02 .01 3 1.030E-02 21.975 .00 .37 .00 .02 .00 4 1.426E-03 59060 .00 .16 .00 .11 .03 5 6.675E-06 863.219 1.00 .43 1.00 .86 .96
a. Dependent Variable: DER
Table 5.1.79: Residual Statistics
Residuals Statistics"
Minimum Maximum Mean Std. Deviation N Predicted Value 7.1891 14.8788 12.0517 2.6838 6 Std. Predicted Value -1.812 1.053 .000 1.000 6 Standard Error of
.1339 .1837 .1678 1.736E-02 6 Predicted Value
Adjusted Predicted Value 7.7075 16.6740 12.2443 3.0087 6 Residual -.1272 7.429E-02 6.365E-15 8.259E-02 6 Std. Residual -.689 .402 .000 .447 6 Stud. Residual -1.000 1.000 .000 1.095 6 Deleted Residual -1.8140 .5423 -.1926 .9198 6 Stud. Deleted Residual a Mahal. Distance 1.794 4.115 3.333 .797 6 Cook's Distance .222 19.097 4.152 7.340 6 Centered Leverage Value .359 .823 .667 .159 6
a. Dependent Variable: DER
331
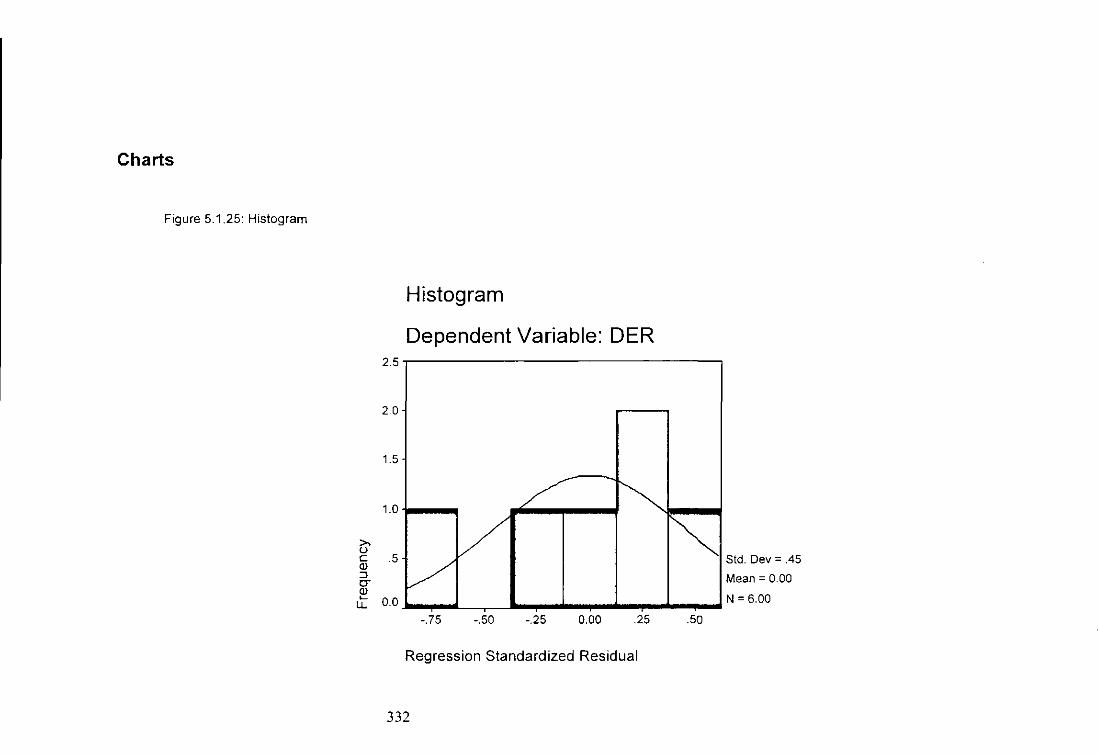
Charts
Figure 5.1.25: Histogram
;>, u c Q) OJ 0-Q) ~
LL
Histogram
Dependent Variable: DER 2.5
2.0
1.5
1.0
.5
0.0
-.75 -.50 -.25 0.00 .25
Regression Standardized Residual
332
.50
Std. Dev = .45
Mean = 0.00
N = 6.00

100
Figure 5.1.26: Normal P-P Plot of Regression Standardized Residual
Dependent Variable: DER
Expected Cum Prob
75
c c c
50
25 c
0.00
0.00 25 50 75 100
Observed Cum Prob
Scatterplot
Dependent Variable: DER 16,------------------------------------.
14
12
10
8
DER
",~.0;----:.,r;.5:---.7,.-;:0----."';.5:----;:0'::.0----...,5:----:,".0:----:l,.5
Figure 5.1.27: Regression Standardized Predicted Value
333
DER
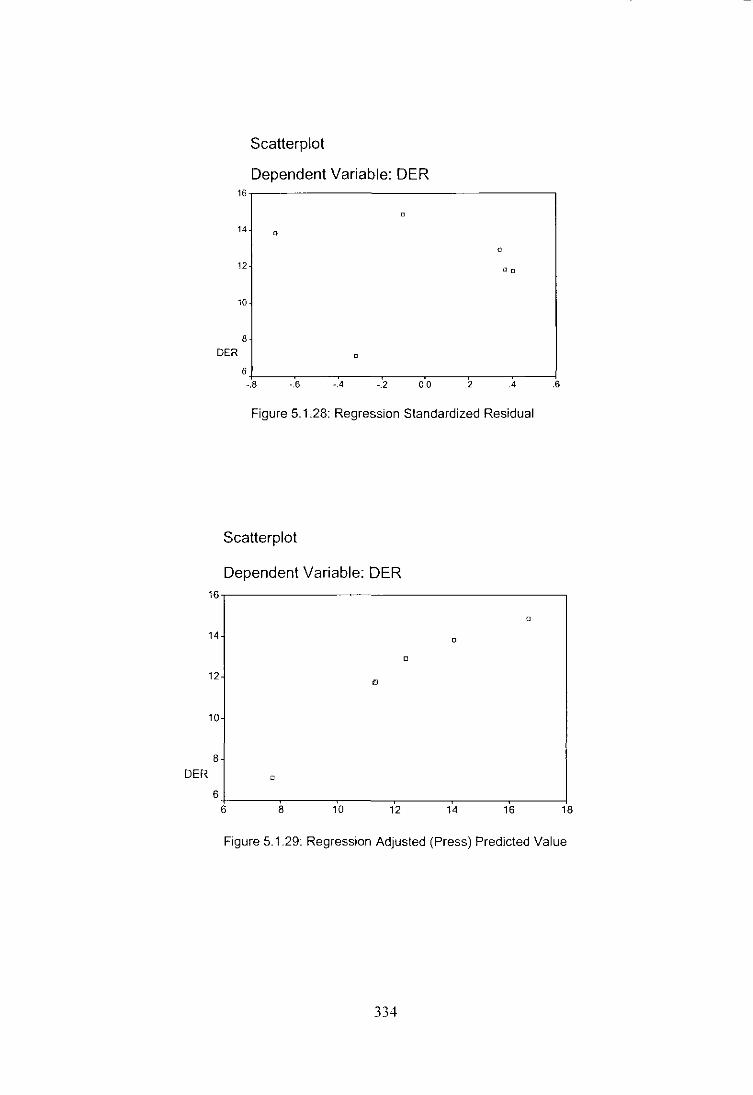
Scatterplot
Dependent Variable: DER 16,------------------------------------,
14
n
12
10
8
DER
H-I::.8----.":.6:---~ .. c-4 ----.-,:.2----0"O:---~2c----.c4------!.6
Figure 5.1.28: Regression Standardized Residual
Scatterplot
Dependent Variable: DER 16
a
14 a
a
12 B
10
8
0
6 6 8 10 12 14 16 18
Figure 5.1.29: Regression Adjusted (Press) Predicted Value
334
Scatterplot
Dependent Variable: DER 16
0
14 0
0
12 • 10
B
DER 0
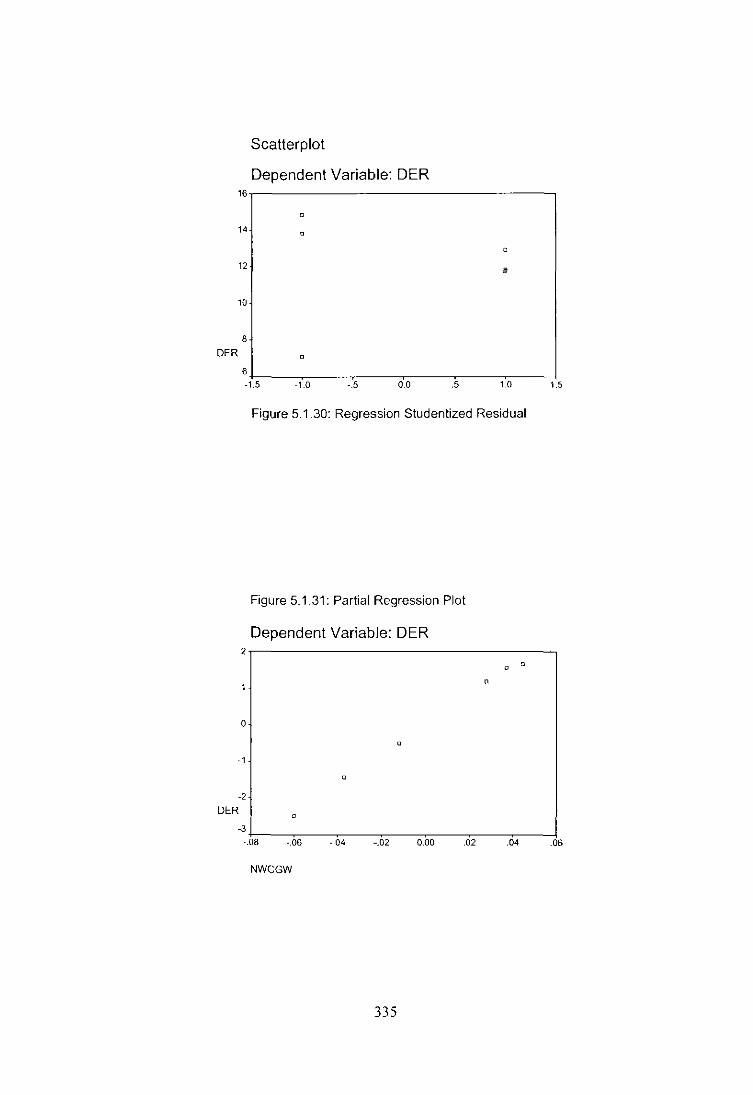
6 -1.5 -1.0 -.5 0.0 .5 1.0 1.5
Figure 5.1.30: Regression Studentized Residual
Figure 5.1.31: Partial Regression Plot
Dependent Variable: DER 2,-----------------------------------~
o 0
o
-1
-2
DER
-3 -.~OB~---'.0~6-----.0~4-----.'02~--0~.0~0----.0~2----.704~--~.06
NWCGW
335

Figure 5.1.32: Partial Regression Plot
Dependent Variable: DER 1.5,---------------------,
1.0
.5
0.0
-.5
DER
o
o
00
-1.0 !-:----y-:------,-:------=-c:---~:__--__j -.06 -.04 -.02 0.00 .02 .04
SIZE
Figure 5.1.33: Partial Regression Plot
Dependent Variable: DER .4,-------------------;-----;----,
.3
.,
.1
-.0
-.1 o
DER-·' o
-.3 +:----..,,-----:-r:----,,-----~------1 -.2 -.1 0.0 .1 .2 .3
LRD
336

Figure 5.1.34: Partial Regression Plot
Dependent Variable: DER .6,-----------------,
.4
.2
·.0
. .2
. .4 DER
D
o
·.6 ±:------,:-;-----::c::-----;,-:-------:! -.02 -.01 0_00 .01 .02
GFATA
In case of CHL all the four independent variables (SIZE, LRD, GFATA, and
NWCGW) are able to explain about 99.5% deviation in the dependent variable
(DER). The coefficients of constant and all the independent variables are
statistically significant.
337
5.2 DISHMAN PHARMACEUTICALS LIMITED
5.2.1 Capital History
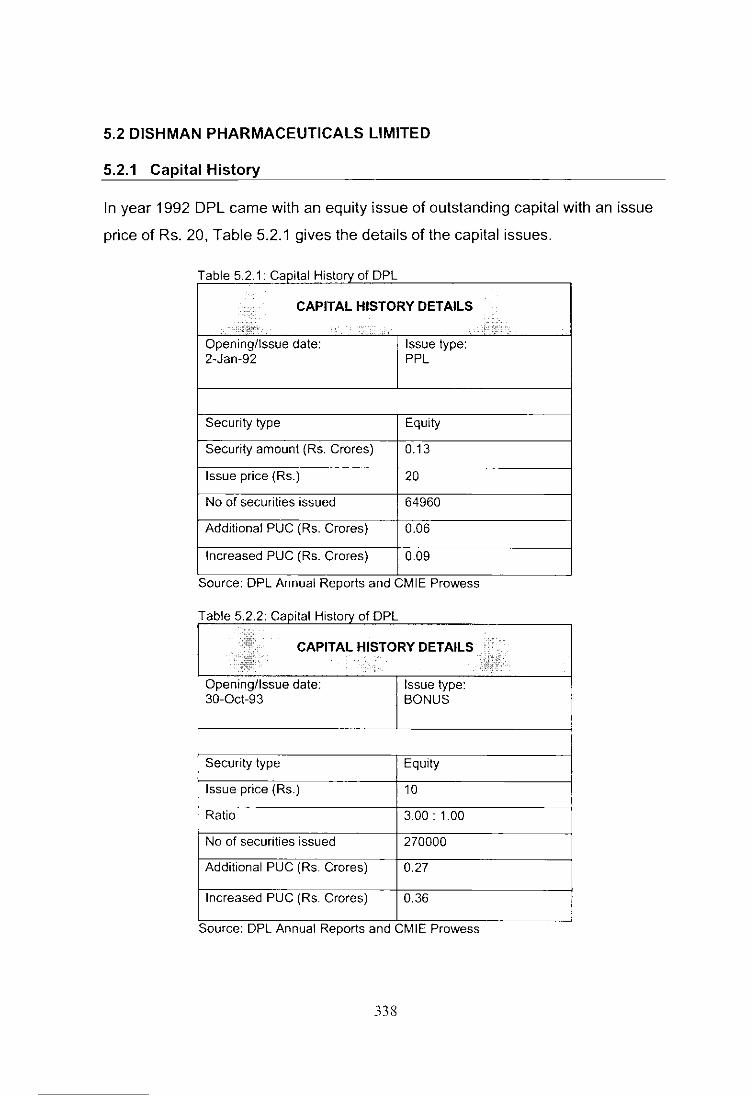
In year 1992 DPL came with an equity issue of outstanding capital with an issue
price of Rs. 20, Table 5.2.1 gives the details of the capital issues.
T bl 5 2 1 G 't I H' t 1 DPL a e apl a IS ory 0
+,~, CAPITAL HISTORY DETAILS;:
" . . .J; Opening/Issue date: Issue type: 2-Jan-92 PPL
Security type Equity
Security amount (Rs. Grares) 0.13
Issue price (Rs.) 20
No 01 securities issued 64960
Additional PUG (Rs. Grares) 0.06
Increased PUG (Rs. Grores) 0.09
Source: DPL Annual Reports and GMIE Prawess
Table 5.2.2: Gapital History 01 DPL ,
... ~: CAPITAL HISTORY DETAILS ,~W,
. .., Opening/Issue date: Issue type: 30-0ct-93 BONUS
Security type Equity
Issue price (Rs.) 10
Ratio 3.00: 1.00
No 01 securities issued 270000
Additional PUG (Rs. Grares) 0.27
Increased PUG (Rs. Grares) 0.36
Source. DPL Annual Reports and GMIE Prawess
338
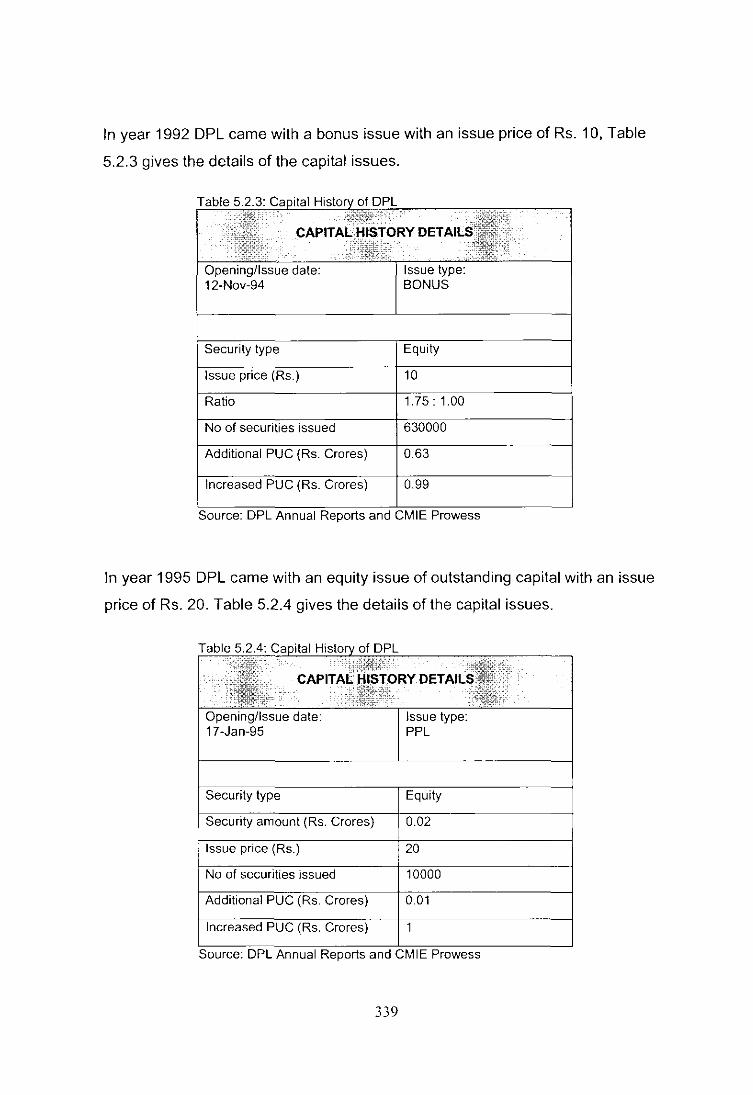
In year 1992 DPL came with a bonus issue with an issue price of Rs. 10, Table
5.2.3 gives the details of the capital issues.
Security type Equity
Issue
Ratio
No of securities issued
(Rs.
(Rs.
Source: DPL Annual Reports and CMIE Prowess
In year 1995 DPL came with an equity issue of outstanding capital with an issue
price of Rs. 20. Table 5.2.4 gives the details of the capital issues.
Opening/Issue date: 17-Jan-95
Security type
amount (Rs.
Issue price (Rs.)
No of
Ad i C (Rs. Crores)
Increased PUC (Rs. Crores)
Issue type: PPL
Equity
20
10000
0.01
Source: DPL Annual Reports and CMIE Prowess
339

In year 1995 DPL came with a capital issue, Table 5.2.5 gives the details of the
capital issues.
Table 5.2.~5:...!: ~~IJ::I.i~~o~f !20~P1L~~~,---==-~~~-,
I
15-0ec-95
Security type
(Rs.)
No of securities issued
Increa
Equity
Source: DPL Annual Reports and CMIE Prowess
In year 1996 DPL came with a capital issue, Table 5.2.6 gives the details of the
capital issues.
No of securities issued
(Rs. "'I<JI '"'' J
PUC (Rs. 3.1
Source: DPL Annual Reports and CMIE Prowess
340

In year 1998 DPL came with a capital issue, Table 5.2.7 gives the details of the
capital issues.
Security type Equity
Issue price (Rs.
Ratio
No of securities issued
Additional
Increased PUC (Rs. Crores) 5.15
Source: DPL Annual Reports and CMIE Prowess
In year 2000 DPL came with a capital issue, Table 5.2.8, gives the details of the
capital issues.
Opening/Issue date: 10-Apr-00
Security type
Additional PUC (Rs. Crores)
Increased PUC (Rs. Crores)
Issue type: BONUS
Equity
5.15
10.3
Source: DPL Annual Reports and CMIE Prowess
341

In year 2004 DPL came with a capital issue, Table 5.2.9, gives the details of the
capital issues.
Opening/lssue date: 29-Mar-04
Closing date: 7-Apr-04
Security type
tssue type: PUBLIC
date:
Equity
175
3433500
Additional PUC (Rs. Crares) 3.43
Increased PUC (Rs. Crores) 13.73
::'oIJme:: DPL Annual Reports and CMIE Prowess
In year 200 DPL came with a capital issue, Table 5.2. gives the details of the
capital issues.
T able 5.2.10: Capital History of DPL
;'ilX,'( " !!J0f1idlllrW ,~jf:':s~)~JjL,,':: CAPITAL~!~JPRY DETAIL~i~1tN:i "
Opening/Issue date: Issue type: 21-0ct-05 SPLIT
Closing date: Record date: 28-0ct-05
Security type Equity
Issue price (Rs.) 2
Ratio 10.00 : 2.00
No of securities issued 0
Increased PUC (Rs. Crares) 13.73
Source: DPL Annual Reports and CMIE Prawess
342

Of the total, 75,53,300 equity sharse distinctive number from 1 to 2262380,
2504791 to 5151000, 7654291 to 10300000 are not transferable upto 17 Apr
2005 and 27,46,700 equity shares DNR from 2262381 to 2504790 and 5150001
to 7654290 are not transferable upto 17 April 2007.
Table 5.2.11: Capital History of DPL
CAPITAL HISTORY DETAILS
.......
Opening/Issue date: Issue type: 21-0ct-05 SPLIT
Closing date: Record date: 28-0ct-05
Security type Equity
Issue price (Rs.) 2
Ratio 10.00: 2.00
No of securities issued 0
Increased PUC (Rs. Crores) 13.73
Source. DPL Annual Reports and CMIE Prowess
The Board of Directors of the company to the sub-division of each of the existing
issued, subscribed and paid-up 1,37,33,500 Equity Shares of the face value of
Rs 101- (Rupees Ten only) each in the capital of the Company into five Equity
Shares of the face value of Rs 21- (Rupees two only) each credited as fully paid
up.
343
i 23-Mar-06
Security type
price (Rs.)
No of securities issued
Additional
of DPL
0.02 Increased PUC (Rs. Crores)
13.75 Source: DPL Annual Reports and CMIE Prowess
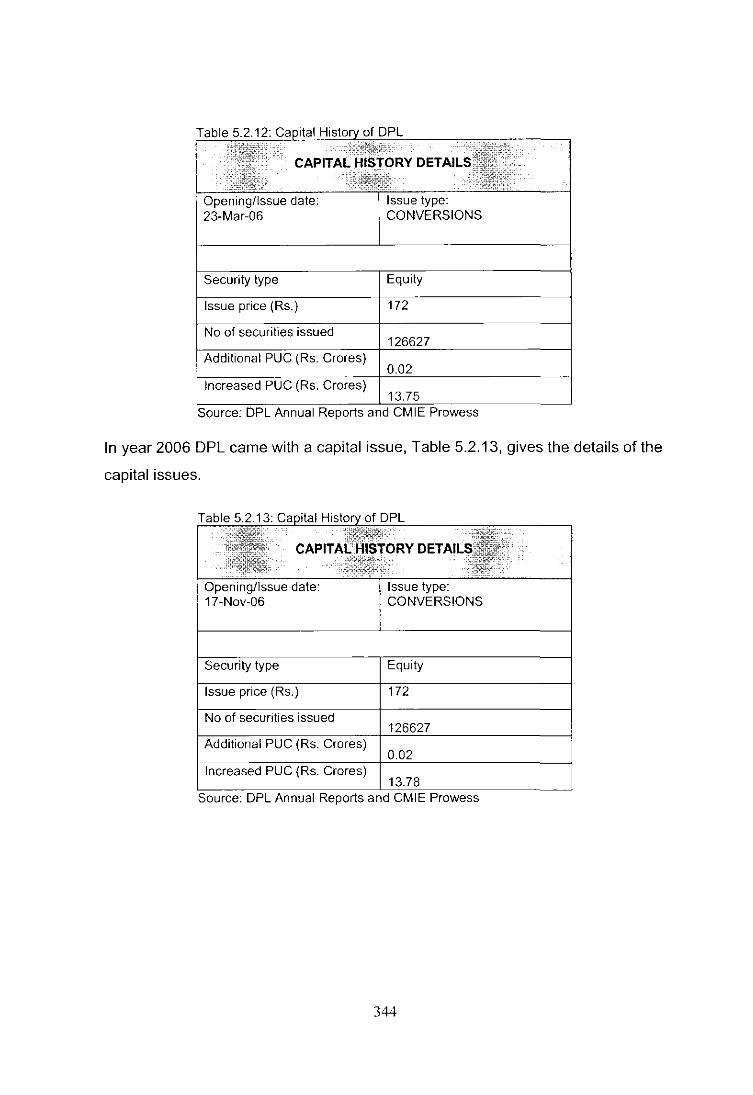
In year 2006 DPL came with a capital issue, Table 5.2.13, gives the details of the
capital issues.
Openingllssue date: 17-Nov-06
Security type
Issue price (Rs.)
securities issued
Issue type: CONVERSIONS
Equity
126627
0.02
DPL Annual Reports and CMIE Prowess
344

In year 2006 DPL came with a capital issue, Table 5.2.14, gives the details of the
capital issues.
Opening/lssue date: 18-0ec-06
Security type
Issue price (Rs.)
securities issued
Additional PUC (Rs. Crores)
Increased PUC (Rs. Crores)
Issue type: CONVERSIONS
Equity
126627
0.02
:-'0'"0.''' OPL Annual Reports and CMIE Prowess
In year 2007 DPL came with a capital issue, Table 5.2.15 gives the details of the
capital issues.
Opening/Issue date: 12-Jan-07
Security type
Issue price (Rs.)
No
Additional PUC (Rs. Crores)
Issue type: CONVERSIONS
Equity
172
345

In year 2007 DPL came with a capital issue, Table 5.2.16 gives the details of the
capital issues.
Opening/Issue date: 29-Jan-07
Security type
Issue price (Rs.)
Additional PUC (Rs. Crores)
Increased PUC (Rs. Crores)
Issue type: CONVERSIONS
Equity
3039068
0.6
14.44 Source: DPL Annual Reports and CMIE Prowess
In year 2007 DPL came with a capital issue, Table 5.2.17 gives the details of the
capital issues.
Table 5.2.1~7~:~'l'i.I:<lIJ:~S!.'X of DPL
Opening/lssue date: 16-Apr-07
Security type
Issue price (Rs.)
DEl
Issue type: CONVERSIONS
Equity
172
346

In year 2007 DPL came with a capital issue, Table 5.2.18 gives the details of the
capital issues.
14-May-07
Security type
No of securities issued
Additional PUC 0.02
Increased PUC (Rs. 14.61
Source: DPL Annual Reports and CMIE Prowess
In year 2007 DPL came with a capital issue, Table 5.2.19 gives the details of the
capital issues.
Issue price (Rs.)
No of securities issued
14.74 Source: DPL Annual Reports and I
347
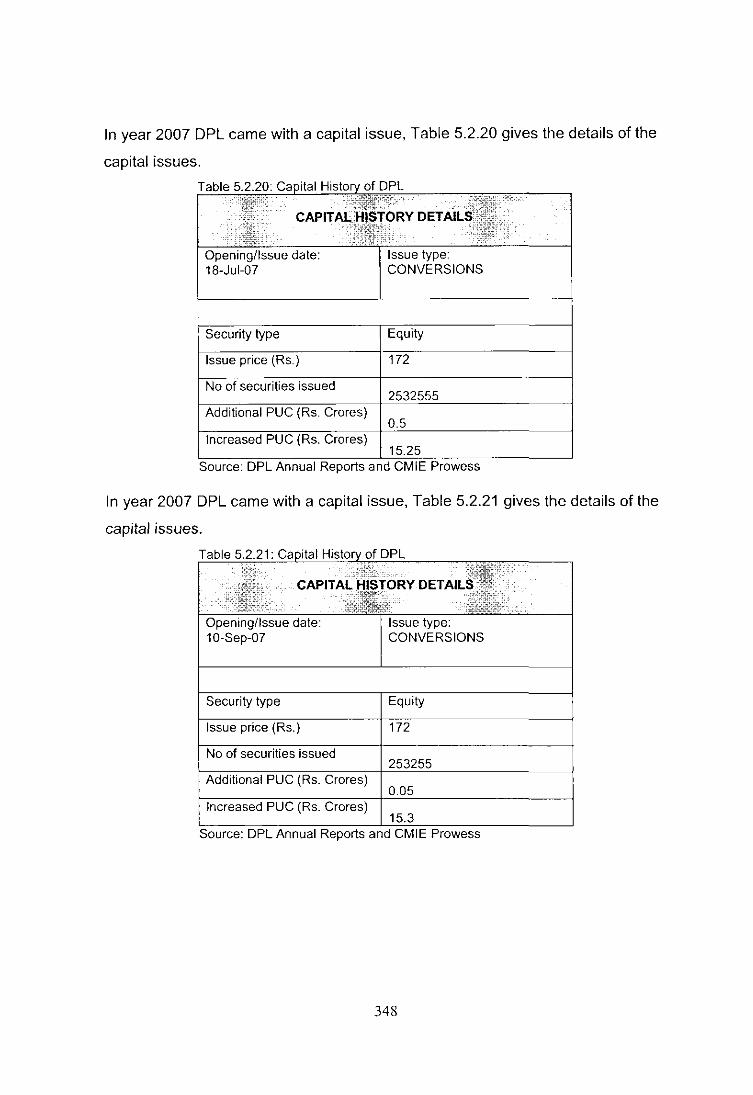
In year 2007 DPL came with a capital issue, Table 5.2.20 gives the details of the
capital issues.
Security type Equity
2532555 Additional PUC (Rs. Crores)
0.5 Increased PUC (Rs. Crores)
15.25 Annual Reports and CMIE Prowess
In year 2007 DPL came with a capital issue, Table 5.2.21 gives the details of the
capital issues.
Opening/Issue date: 10-Sep-07
Security type
No of securities issued
Additional PUC (Rs. Crores)
Increased PUC (Rs. Crores)
Issue type: CONVERSIONS
Equity
253255
0.05
15.3 Source: DPL Annual Reports and CMIE Prowess
348

In year 2007 DPL came with a capital issue, Table 5.2.22 gives the details of the
capital issues.
Opening/Issue date: 29-Sep-07
Security type
No of securities issued
Additional PUC (Rs. Crores)
Increased PUC (Rs. Crores)
Equity
1013023
0.2
15.5 Source: DPL Annual Reports and CMIE Prowess
In year 2008 DPL came with a capital issue, Table 5.2.23 gives the details of the
capital issues.
25-Jan-08
type Equity
Issue price (
No of securities issued 1139650
(Rs. 0.22
Increased PUC (Rs. Crores) 15.73
Source: DPL Annual Reports and CMIE Prowess
349
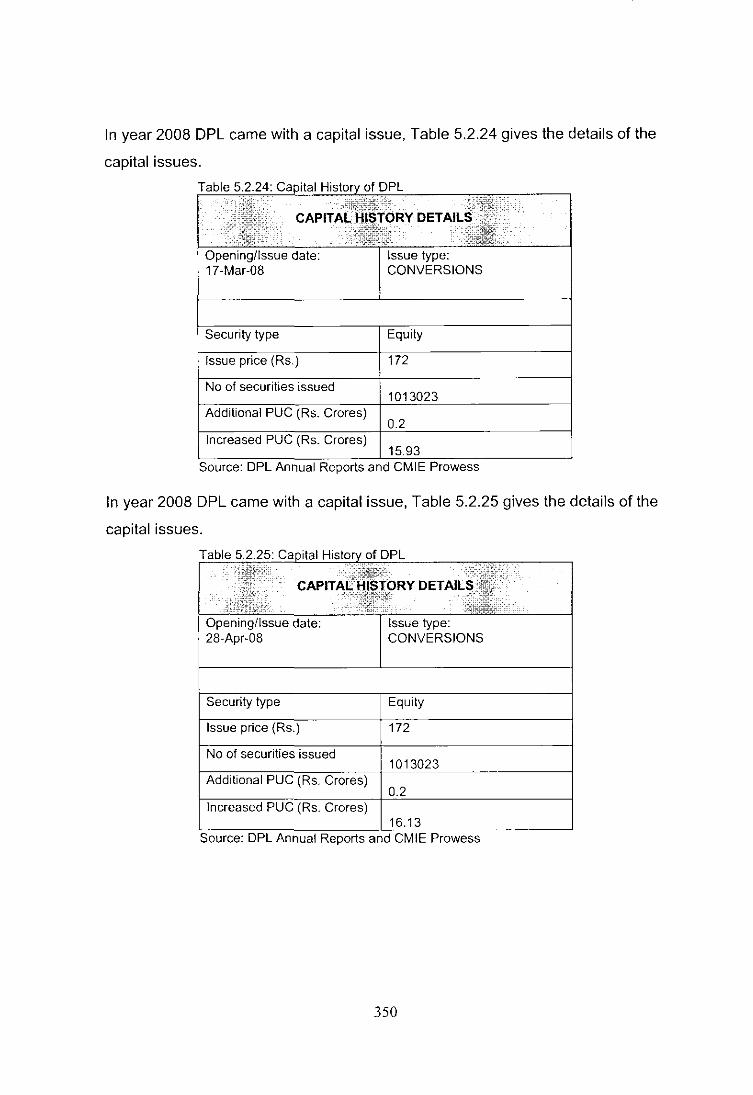
In year 2008 DPL came with a capital issue, Table 5.2.24 gives the details of the
capital issues.
Table 5.2.24: ofDPL
Opening/Issue date: 17-Mar-08
Security type
Issue price (Rs.)
i' issued
Issue type: CONVERSIONS
Equity
172
1013023
In year 2008 DPL came with a capital issue, Table 5.2.25 gives the details of the
capital issues.
Table 5.2.25: Ca ital Histo of DPL "::;::~;::::,
CAPITALI-U$TORY DETAIL , ""'~,1t~Tt:~~~
Opening/Issue date: 28-Apr-08
Security type
Issue price (Rs.)
No of securities issued
Additional PUC (Rs. Crores)
Increased PUC (Rs. Crores)
Issue type: CONVERSIONS
Equity
172
1013023
0.2
16.13 Source: DPL Annual Reports and CMIE Prowess
350
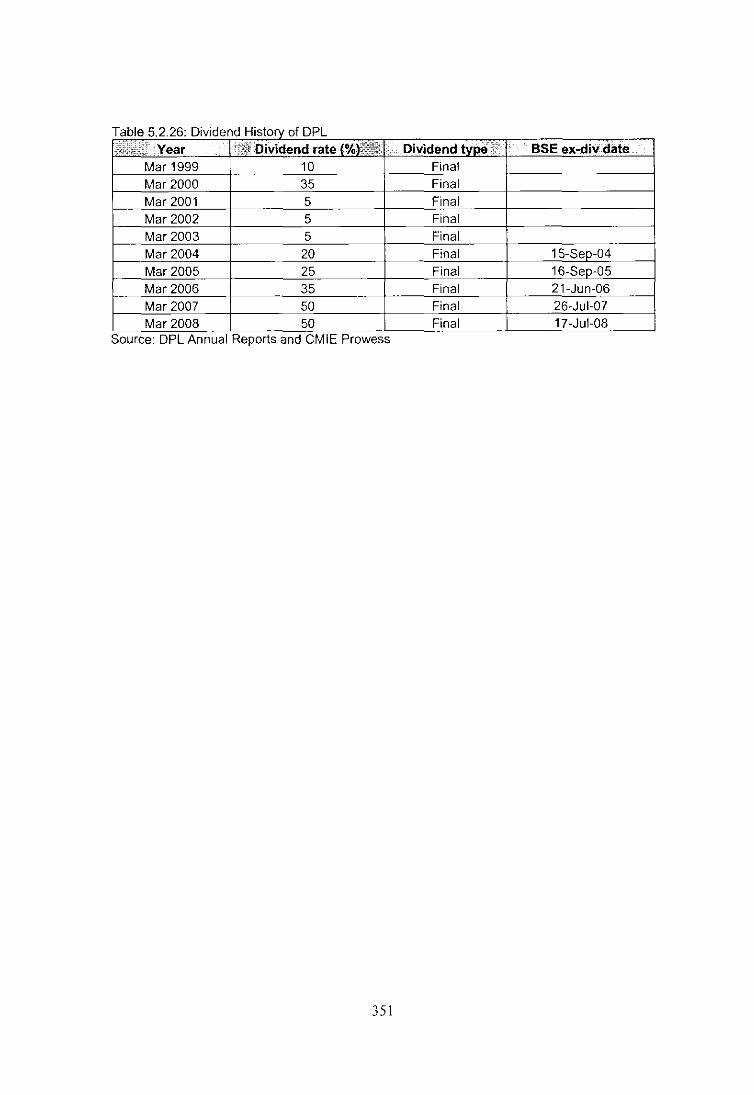
Source: DPL Annual Reports and CMIE Prowess
351
5.2.2 Analysis of Liabilities
A. Sources of Funds
SC:
SL:
Share Capital
Secured Loans
RSP: Reserves & Surplus
USL: Unsecured Loans
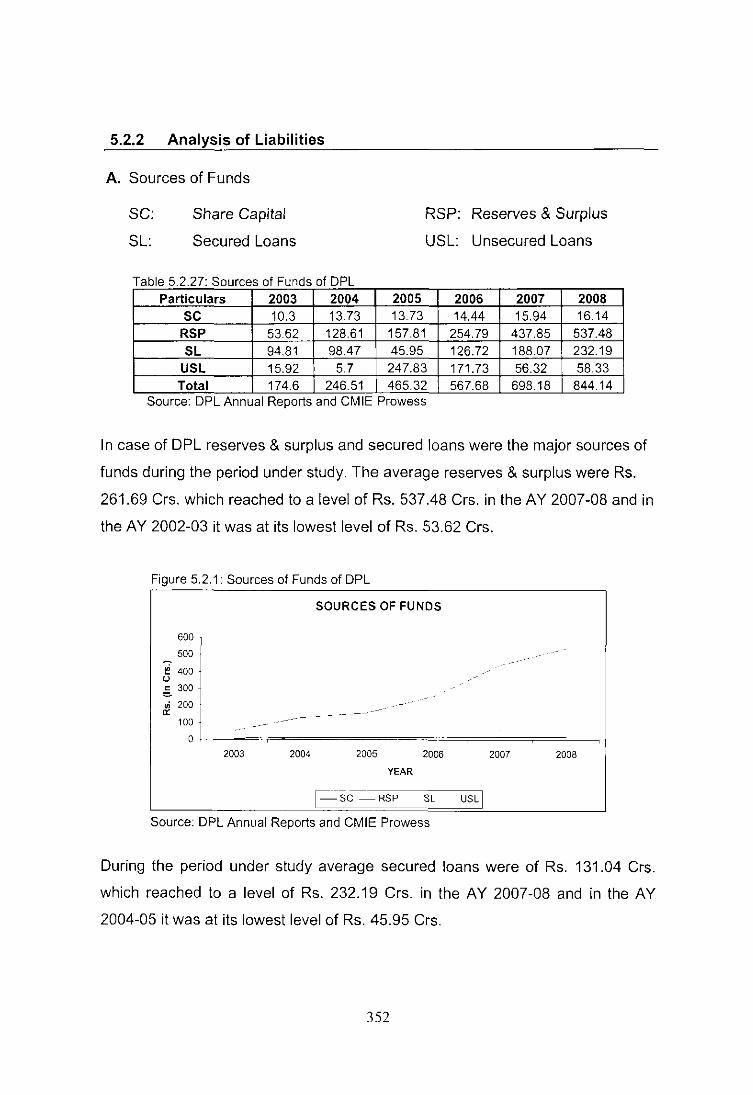
Table 5 2 27' Sources of Funds of DPL Particulars 2003 2004 2005 2006 2007 2008
SC 10.3 13.73 13.73 14.44 15.94 16.14 RSP 53.62 128.61 157.81 254.79 437.85 537.48 SL 94.81 98.47 45.95 126.72 188.07 232.19
USL 15.92 5.7 247.83 171.73 56.32 58.33 Total 174.6 246.51 465.32 567.68 698.18 844.14
Source: DPL Annual Reports and CMIE Prowess
In case of DPL reserves & surplus and secured loans were the major sources of
funds during the period under study. The average reserves & surplus were Rs.
261.69 Crs. which reached to a level of Rs. 537.48 Crs. in the AY 2007-08 and in
the AY 2002-03 it was at its lowest level of Rs. 53.62 Crs.
Figure 5.2.1: Sources of Funds of DPL
600 1 500
~ 400 o :§. 300
SOURCES OF FUNDS
-~----
~ :~~ L -------" o ~"~===;====;=====;=====-~
2003 2004 2005 2006 2007 2008
YEAR
E-SC - RSP SL USL I
Source: DPL Annual Reports and CMIE Prowess
During the period under study average secured loans were of Rs. 131.04 Crs.
which reached to a level of Rs. 232.19 Crs. in the A Y 2007-08 and in the A Y
2004-05 it was at its lowest level of Rs. 45.95 Crs.
352

a e 5. T bl 228 S ources 0 un so D L In terms 0 fF d f P . fP ercentage ,<2 Particulars'';; . '(2003 2004. !If, "2005 200S:'- - 2007 "'20oal,lkl
.' SC'· "<,~;,, 5.90 5.57 2.95 2.54 2.28 1.91 . RSP 30.70 52.17 33.91 44.88 62.71 63.67
t" SL ' .• '".'
54.29 39.95 9.87 22.32 26.94 27.51 , USL "[ffi0 9.12 2.31 53.26 30.25 8.07 6.91
Table 5.2.29: Statistics of Sources of Funds of DPL
B. Sources of Funds (Internal and External)
IS : Internal Sources ES : External Sources
DTL : Deferred Tax Liability
Table 5.2.30: Internal and External Sources of Funds of DPL
2005 2006 2007 2008
34.11 48.74 56.09 62.27
-2.9 -0.2 10.53 8.02
82.13 243.82 171.62 152.84 and CMIE Prowess
In case of DPL it was found that, firm is equally dependent on both internal and
external sources of funds. For the period under study average internally
generated funds were of Rs. 44.21 Crs. and externally generated funds were
353
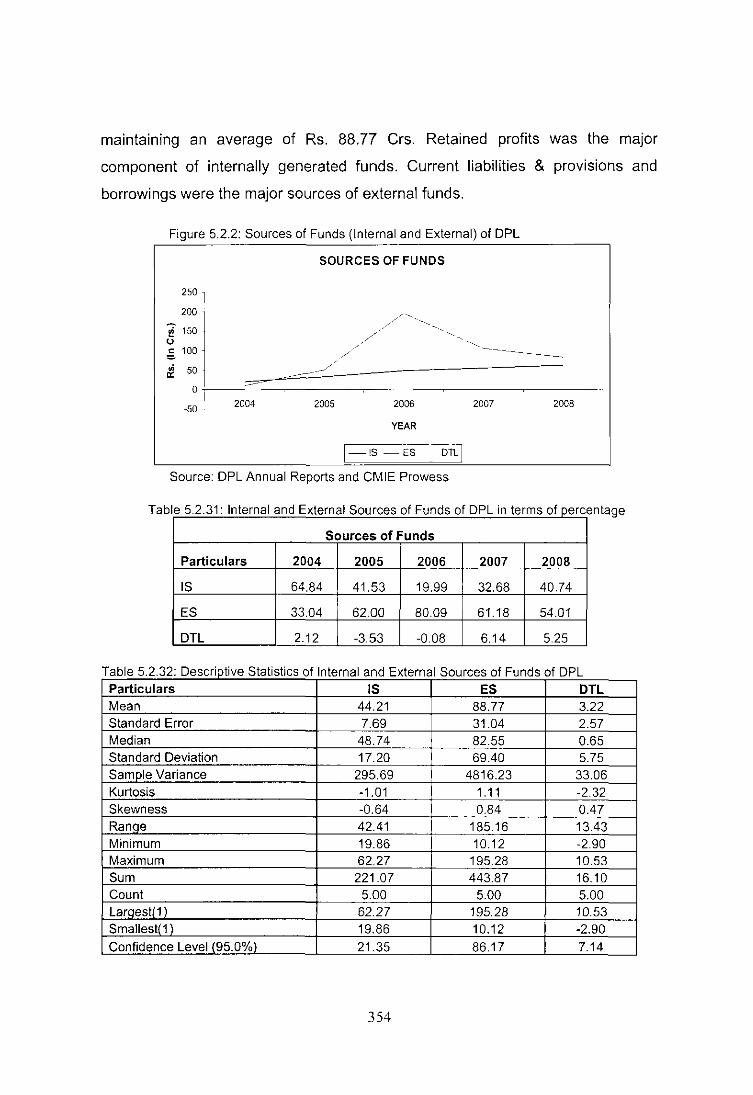
maintaining an average of Rs. 88.77 Crs. Retained profits was the major
component of internally generated funds. Current liabilities & provisions and
borrowings were the major sources of external funds.
Figure 5 2.2: Sources of Funds (Internal and External) of DPL
SOURCES OF FUNDS
250 1 200 •
~ 150 U
,§, 100 ~------,; 50 a:
2005 2006 2007 2008 o I
2004 -50 .
YEAR
I-'s -ES DTI:] Source: DPL Annual Reports and CMIE Prowess
Tab 2 Ie 5 .. 31: nterna an dE xternal Sources 0 Funds 0 f DPL in terms o' perce ntage
Sources of Funds
Particulars 2004 2005 2006 2007 2008
IS 64.84 41.53 19.99 32.68 40.74
ES 33.04 62.00 80.09 61.18 54.01
DTL 2.12 -3.53 -008 6.14 5.25
Table 5.2.32: Descriptive Statistics of Internal and External Sources of Funds of DPL Particulars IS ES DTL Mean 44.21 88.77 3.22 Standard Error 7.69 31.04 2.57 Median 48.74 82.55 0.65 Standard Deviation 17.20 69.40 5.75 Sample Variance 295.69 4816.23 33.06 Kurtosis -1.01 1.11 -2.32 Skewness -0.64 0.84 0.47 Ranqe 42.41 185.16 13.43 Minimum 19.86 10.12 -2.90 Maximum 62.27 195.28 10.53 Sum 221.07 443.87 16.10 Count 5.00 5.00 5.00 Largest(l ) 62.27 195.28 10.53 Smallest(l ) 19.86 10.12 -2.90
Confidence Level (95.0%) 21.35 86.17 7.14
354
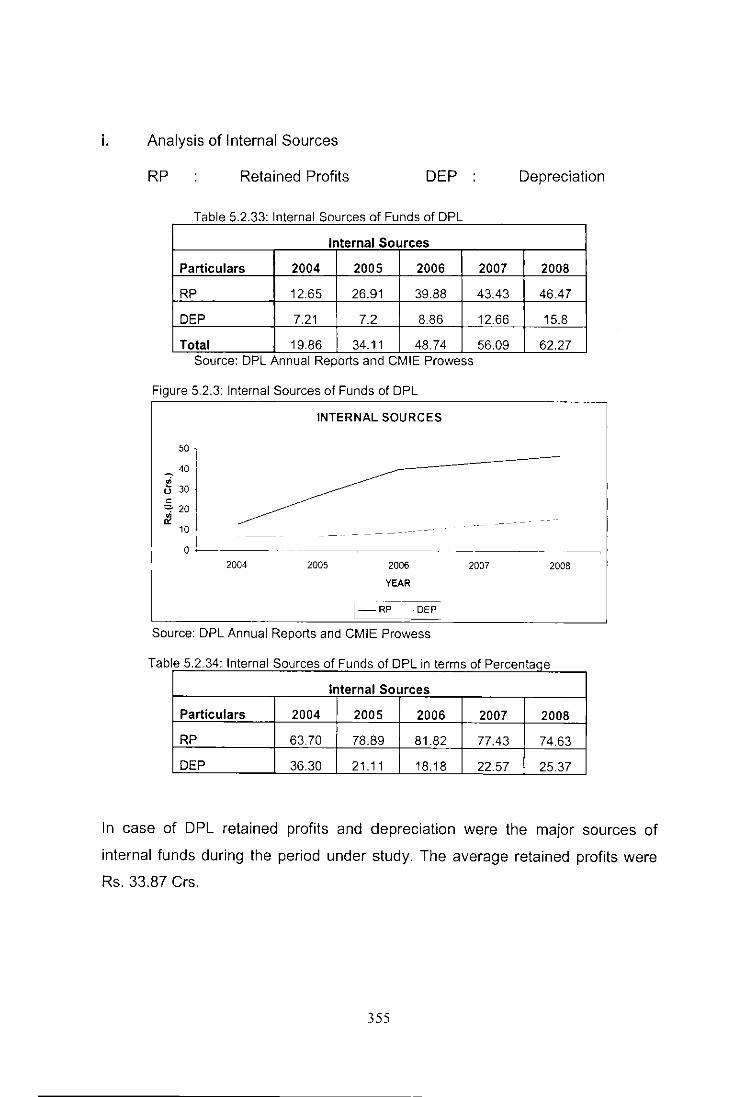
i. Analysis of I nternal Sources
RP Retained Profits DEP
Table 5 2 33· Internal Sources of Funds of DPL
Internal Sources
Particulars 2004 2005 2006 2007
RP 12.65 26.91 39.88 43.43
DEP 7.21 7.2 8.86 12.66
Total 19.86 34.11 48.74 56.09 Source: DPL Annual Reports and CMIE Prowess
Figure 5.2.3: Internal Sources of Funds of DPL
50
40
& 30 c ~ 20 iP.
10
o ! 2004
INTERNAL SOURCES
2005 2006
YEAR
Source: DPL Annual Reports and CMIE Prowess
2007
Depreciation
2008
46.47
15.8
62.27
200B
Tab Ie 5.2.34: Internal Sources of Funds of DPL in terms of Percentaoe
Internal Sources
Particulars 2004 2005 2006 2007 2008
RP 63.70 78.89 81.82 77.43 74.63
DEP 36.30 21.11 18.18 22.57 25.37
In case of DPL retained profits and depreciation were the major sources of
internal funds during the period under study. The average retained profits were
Rs. 33.87 Crs.
355

Table 5.2.35: Descriotive Statistics of Internal Sources of Funds of DPL
Particulars: . RP DEP
Mean ~!> .. ,:
33.87 10.35
Standard Error 6.26 1.69
Median 39.88 8.86
Standard Deviation 14.01 3.78
Sam DIe Variance 196.25 14.26
Kurtosis -0.21 -1.16
Skewness -1.03 0.85
Ranae --- 33.82 8.60
Minimum .r;';; .... . 12.65 7.20
Maximum.'. 46.47 15.80
Sum 169.34 51.73
Count 5.00 5.00
Laraest(1) 46.47 15.80
Smallest(1) 12.65 7.20
Confidence Level 195.0%\ 17.39 4.69
ii. Analysis of External Sources
CLP: Current liabilities & provisions BORW: Borrowings
FC: Fresh Capital
Table 5 2 36' External Sources of Funds of DPL
External Sources
Particulari':: 2004 2005 2006 2007 2008 :,:.:
FC 0 53.85 -11.01 54.59 138.24
BORW 9.27 -5.68 189.61 4.66 -35.93
CLP 0.85 2.75 16.68 45.75 -19.76
Total 10.12 50.92 195.28 105 82.55 Source: DPL Annual Reports and CMIE Prowess
Table 5.2.37: External Sources of Funds of DPL in terms of Percentaae
·.·~If ,.
' .. ,.(". External Sources ..........
Particulars 2004 2005 2006 2007 2008
FC 0.00 105.75 -5.64 51.99 167.46
BORW 91.60 -11.15 97.10 4.44 -43.53
CLP 8.40 5.40 8.54 43.57 -23.94
356

Figure 5.2.4: External Sources of Funds of DPL
250 I 200 - ,
EXTERNAL SOURCES
~ 150 i u c: 100 j
'" .. , ~
~50' ~ ~ ~ ~- .. --- ----- . 0--- --' -. ,.- -- .. _, -~ ---............ ~ - - __
I -50 J
2004 2005 2006 2007
YEAR
[=- Fe -' BORW CLPj
Source: DPL Annual Reports and CMIE Prowess
T bl 5238 0 a e .. eSCrlpllve a IS lCS 0 xerna t St t t f E t IS ources 0 un so f F d f DPL Particulars Mean Standard Error Median Standard Deviation Sample Variance Kurtosis Skewness Ran~e
Minimum Maximum Sum Count Largest(l ) Smallest(l ) Confidence Level (95.0%)
C. Shareholder's Fund
AEC: Authorized equity capital
SEC: Subscribed equity capital
BSC: Bonus share capital
FC BORW CLP 47.13 32.39 9.25 26.46 40.09 10.82 53.85 4.66 2.75 59.17 89.64 24.20
3500.83 8034.64 585.46 0.70 4.31 1.09 0.92 2.01 0.70
149.25 225.54 65.51 -11.01 -35.93 -19.76 138.24 189.61 45.75 235.67 161.93 46.27
5.00 5.00 5.00 138.24 189.61 45.75 -11.01 -35.93 -19.76
73.47 111.30 30.04
IEC: Issued equity capital
PEC: Paid-up equity capital
In case of DPL for the AY 2002-03 to A Y 2003-04 paid up equity capital was Rs.
10.3 Crs. which increased to Rs. 13.73 Crs. in the following year. Paid equity
capital reached a level of Rs. 14.44 Crs. in the AY 2006-07 and in AY 2007-08 it
357

was Rs. 15.94 Crs. Bonus share capital was Rs. 10.1 Crs. for the period under
study.
Table 5.2.39: Comoosition of Shareholder's Fund of DPL
Particulars 2003 2004 2005 2006 AEC 15 15 15 20
IEC 10.3 10.3 13.73 13.73
SEC 10.3 10.3 13.73 13.73
PEC 10.3 10.3 13.73 13.73
esc 10.1 10.1 10.1 10.1 Source: DPL Annual Reports and CMIE Prowess
Figure 5.2.5: Shareholder's Funds of DPL
SHAREHOLDERS FUND
25 .
_ 20 te u 15 o
'=' 10
~ 5
o I 2003 2004 2005 2006
YEAR
2007
20
14.44
14.44
14.44
10.1
2007
-AEC --IEC SEC PEG - Bse:
Source: DPL Annual Reports and CMIE Prowess
2008 20
15.94
15.94
15.94
10.1
2008
Table 5.2.40: Comoosition of Shareholder's Fund of DPL in percentaqe terms
Particulars 2003 2004 2005 2006 2007 2008 AEC 100 100 100 100 100 100
IEC 68.67 68.67 91.53 68.65 72.20 79.70
SEC 68.67 68.67 91.53 68.65 72.20 79.70
PEC 68.67 68.67 91.53 68.65 72.20 79.70
CCSA 67.33 67.33 67.33 50.50 50.50 50.50
esc 100 100 100 100 100 100
358
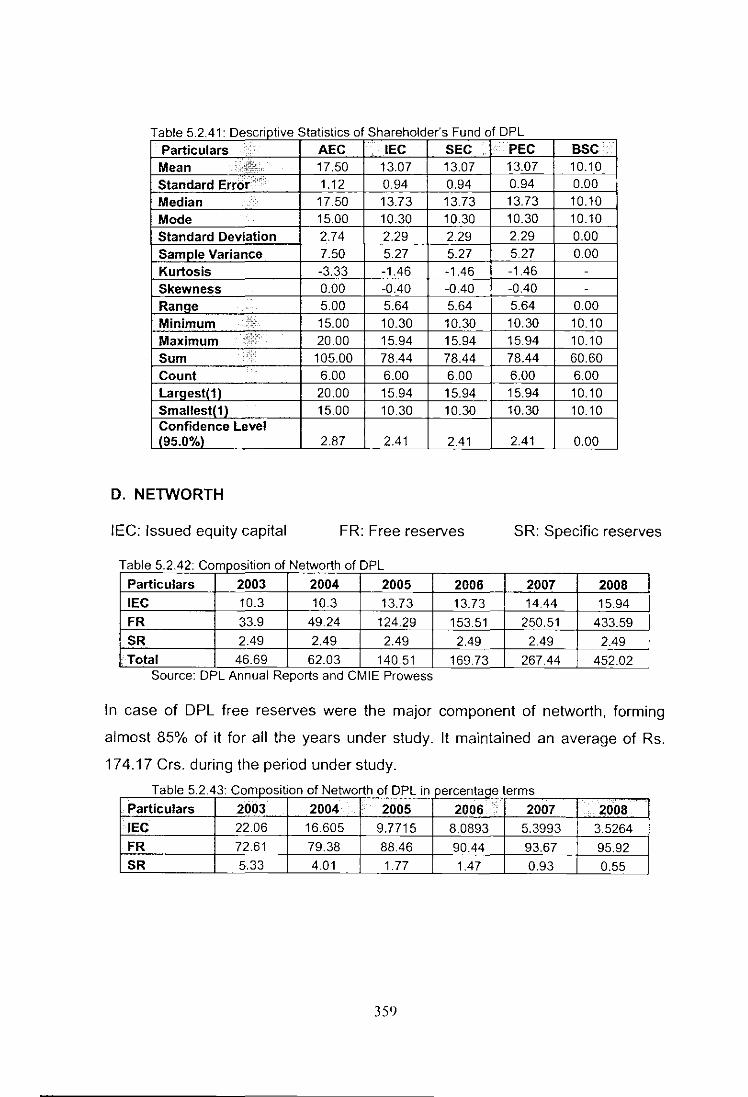
Table 5.2.41: Descriptive Statistics of Shareholder's Fund 0 DPL
Particulars AEC IEC SEC PEC SSC·
Mean :1j11zs" 17.50 13.07 13.07 13.07 10.10 Standard Error::" 1.12 0.94 0.94 0.94 0.00 Median 17.50 13.73 13.73 13.73 10.10
Mode 15.00 10.30 1 0.30 10.30 10.10 Standard Deviation 2.74 2.29 2.29 2.29 0.00 Sample Variance 7.50 5.27 5.27 5.27 0.00 Kurtosis -3.33 -1.46 -1.46 -1.46 -
Skewness 0.00 -0.40 -0.40 -0.40 -
Range 5.00 5.64 5.64 5.64 0.00 Minimum P:: 15.00 10.30 10.30 10.30 10.10 Maximum .::::' 20.00 15.94 15.94 15.94 10.10 Sum :::: 105.00 78.44 78.44 78.44 60.60 Count 6.00 6.00 6.00 6.00 6.00 Largest(1) 20.00 15.94 15.94 15.94 10.10 Smallest(1) 15.00 10.30 10.30 10.30 10.10 Confidence Level (95.0%) 2.87 2.41 2.41 2.41 0.00
D. NETWORTH
IEC: Issued equity capital FR: Free reserves SR: Specific reserves
T bl 5242 C a e omposllon 0 e 0 0 f N tw rth f DPL
Particulars 2003 2004 2005 2006 2007 2008 IEC 10.3 10.3 13.73 13.73 14.44 15.94 FR 33.9 49.24 124.29 153.51 250.51 433.59
SR 2.49 2.49 2.49 2.49 2.49 2.49 Total 46.69 62.03 140.51 169.73 267.44 452.02
Source: DPL Annual Reports and CMIE Prowess
In case of DPL free reserves were the major component of networth, forming
almost 85% of it for all the years under study. It maintained an average of Rs,
174.17 Crs. during the period under study.
T bl 5243 C a e omposltlon 0 fN etwort h f DP 0 L in percentaQe terms Particulars 2003 2004 2005 2006 2007 2008 IEC 2206 16.605 9.7715 80893 5.3993 3.5264 FR 72.61 79.38 88.46 90.44 93.67 95.92 SR 5.33 401 1.77 1.47 0.93 0.55
359

Figure 5.2.6: Networth of DPL
500 I .-. 400 ~ o 300· o =- 200 .
~ 100 .;
NETWORTH
o-~~=r============~====~=========---2003 2004 2005 2006 2007 2008
YEAR
Source: DPL Annual Reports and CMIE Prowess
T bl 5244 D a e escnptlve S . r f N tw h f DPL tatlS ICS 0 e ort 0
Particulars IEC FR SR Mean 13.07 174.17 2.49
Standard Error 0.94 60.92 0.00
Median 13.73 138.90 2.49
Standard Deviation 2.29 149.21 0.00
Sample Variance 5.27 22264.91 0.00
Kurtosis -1.46 1.09 -Skewness -0.40 1.18 -RanQe 5.64 399.69 0.00
Minimum 10.30 33.90 2.49
Maximum 15.94 433.59 2.49
Sum 78.44 1045.04 14.94
Count 6.00 6.00 6.00
LarQest(11 15.94 433.59 2.49
Smallest(1 ) 10.30 33.90 2.49
Confidence Level (95.0%) 2.41 156.59 0.00
E. Free Reserve
SPR: Security premium reserves GRES : General Reserves
BPL Balance from profit & loss account
Table 5.2.45: Composition 0 f Free Reserve 0 DPL
Particulars 2003 2004 2005 2006 2007 2008 SPR 0 0 50.42 39.41 93.29 23003
GRES 7.56 9.56 12.56 17.56 108.73 154.95
BPL 26.34 39.68 61.31 96.54 48.49 48.61
Total 33.9 49.24 124.29 153.51 250.51 433.59 Source: DPL Annual Reports and CM IE Prowess
360
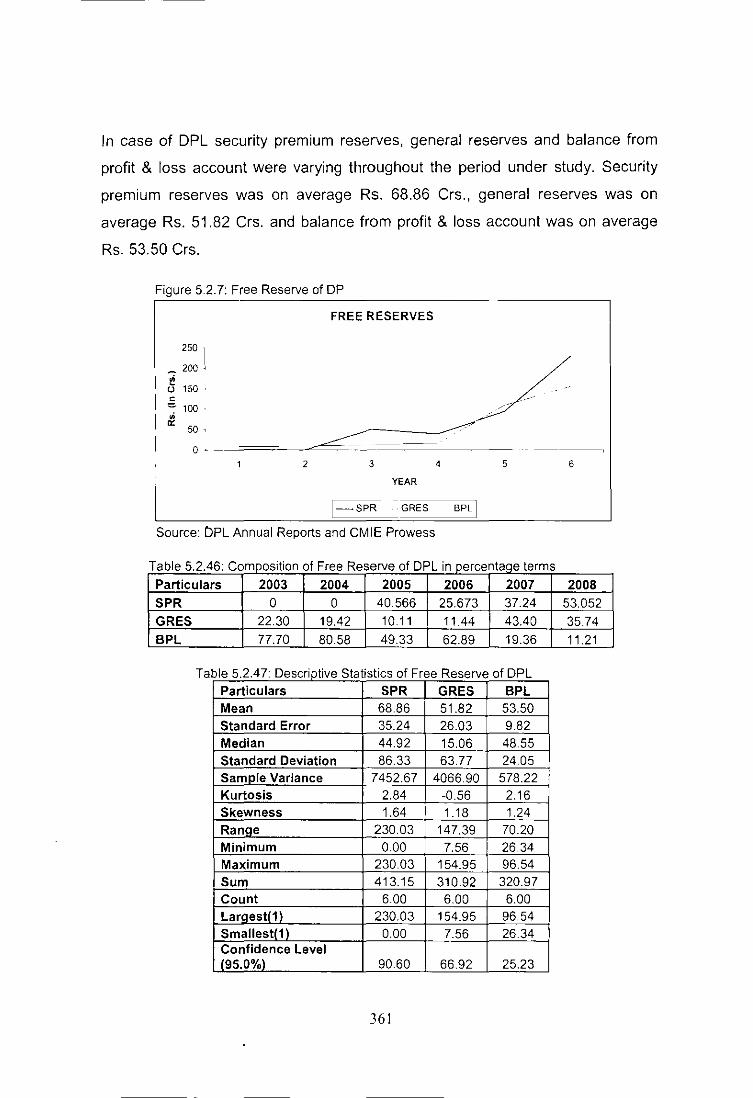
In case of DPL security premium reserves, general reserves and balance from
profit & loss account were varying throughout the period under study. Security
premium reserves was on average Rs. 68.86 Crs., general reserves was on
average Rs. 51.82 Crs. and balance from profit & loss account was on average
Rs. 53.50 Crs.
Figure 5.2.7: Free Reserve of DP
FREE RESERVES
250 I __ 200 <
~ U 150 <
" :::.. 100 .
i2 50 •
o • 2 3 4 5 6
YEAR
1-SPR GRES BPl J
Source: DPL Annual Reports and CMIE Prowess
Table 5.2.46: Composition of Free Reserve of DPL in percentaqe terms
Particulars 2003 2004 2005 2006 2007 2008 SPR 0 0 40.566 25.673 37.24 53.052 GRES 22.30 19.42 10.11 11.44 43.40 35.74 BPL 77.70 80.58 49.33 62.89 19.36 11.21
Ta ble 5.2.47: Descriptive Statistics of Free Reserve of DPL Particulars SPR GRES BPL Mean 68.86 51.82 53.50 Standard Error 35.24 26.03 9.82 Median 44.92 15.06 48.55 Standard Deviation 86.33 63.77 2405 Sample Variance 7452.67 4066.90 578.22 Kurtosis 2.84 -0.56 2.16 Skewness 1.64 1.18 1.24 Range 230.03 147.39 70.20 Minimum 0.00 7.56 26.34 Maximum 23003 154.95 96.54 Sum 413.15 310.92 320.97 Count 6.00 6.00 6.00 Largest(1) 230.03 154.95 96.54 Smallest{ 1) 0.00 7.56 26.34 Confidence Level (95.0%) 90.60 66.92 25.23
361

F. Borrowings (Secured I Unsecured)
Table 5.2.48: Composition of Borrowinqs (Secured I Unsecured) of DPL
Particulars 2003 2004 2005 2006 2007 2008 SB 99.74 93.93 98.47 45.95 126.72 206.19
USB 0.84 15.92 5.7 247.83 171.72 56.32
Total 100.58 109.85 104.17 293.78 298.44 262.51 Source: DPL Annual Reports and CMIE Prowess
In case of DPL 69% borrowings were secured and 31 % borrowings were
unsecured. On an average secured borrowings were of Rs. 111.83 Crs. and
unsecured borrowings were of Rs. 83.06 Crs.
Table 5
Figure 5.2.8 Borrowings (Secured I Unsecured) of DPL
300 l
250
I!! 200 u c 150 = ~ 100
50
o 2003 2004
BORROWINGS
2005 2006
YEAR
I-SB -uSBI
Source: DPL Annual Reports and CMIE Prowess
2007 2008
.2.49: Composition of Borrowinqs (Secured I Unsecured) of DPL in percentage ter
Particulars 2003 2004 2005 2006 2007 2008 SB 99.16 85.51 94.53 15.64 42.46 78.55
USB 0.84 14.49 5.47 84.36 57.54 21.45
362
ms
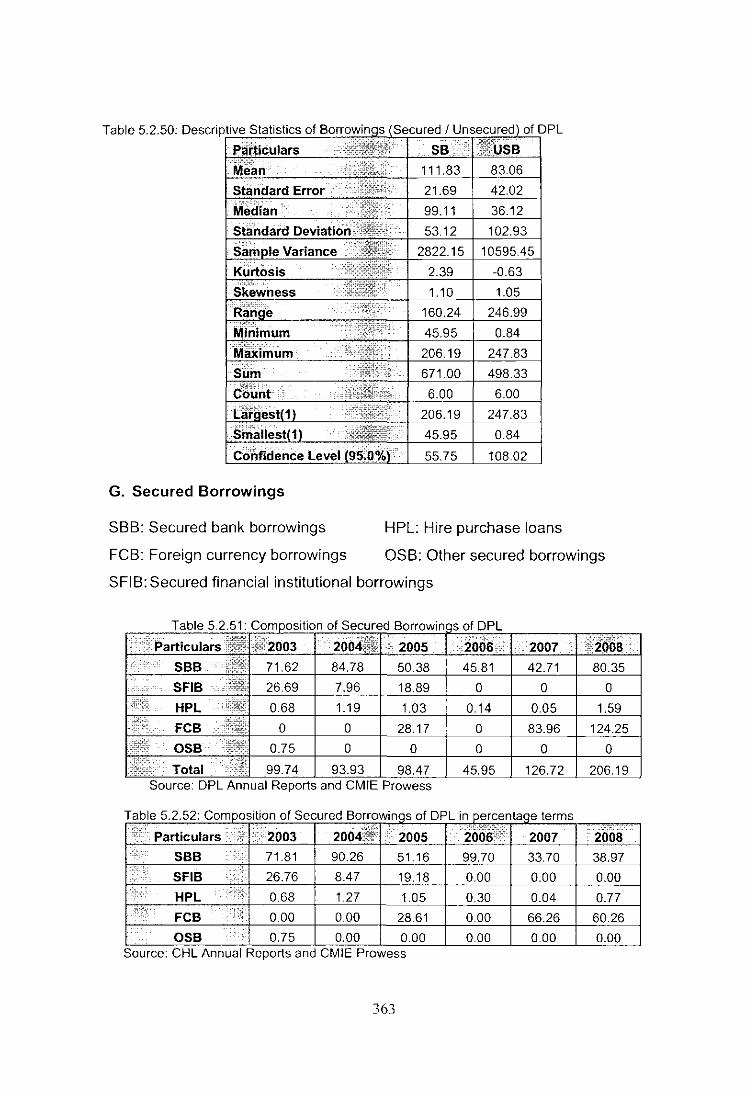
Table 5.2.50: DescriP,[tiv~e~S~t~a~ti~st~ic~S~O=1 =]~~t=[~~]i~~=r
55.75 108.02
G. Secured Borrowings
HPL: Hire purchase loans SBB: Secured bank borrowings
FeB: Foreign currency borrowings OSB: Other secured borrowings
SFIB: Secured financial institutional borrowings
01 DPL
99.74 98.47 45.95 126.72 : DPL Annual Reports and CMIE Prowess
a e T bl 5252 C ompOSllon 0 IS ecure dB orrowmgs 0 I DPL' In percentage terms
I~': Particulars '':2003 2004i.~ IL 2005 20(j6's: 2007 ... :::' ..
: 2008 I':::' SBB ••• 71.81 90.26 51.16 99.70 33.70 38.97 I.'.:": SFIB :
26.76 8.47 19.18 0.00 0.00 0.00 I::,.· HPL . :,.:: 0.68 1.27 1.05 0.30 0.04 0.77
::: FeB .:if 0.00 000 28.61 000 66.26 60.26 ..
OSB :. 0.75 0.00 0.00 000 000 0.00 Source. CHL Annual Reports and CMIE Prowess
363
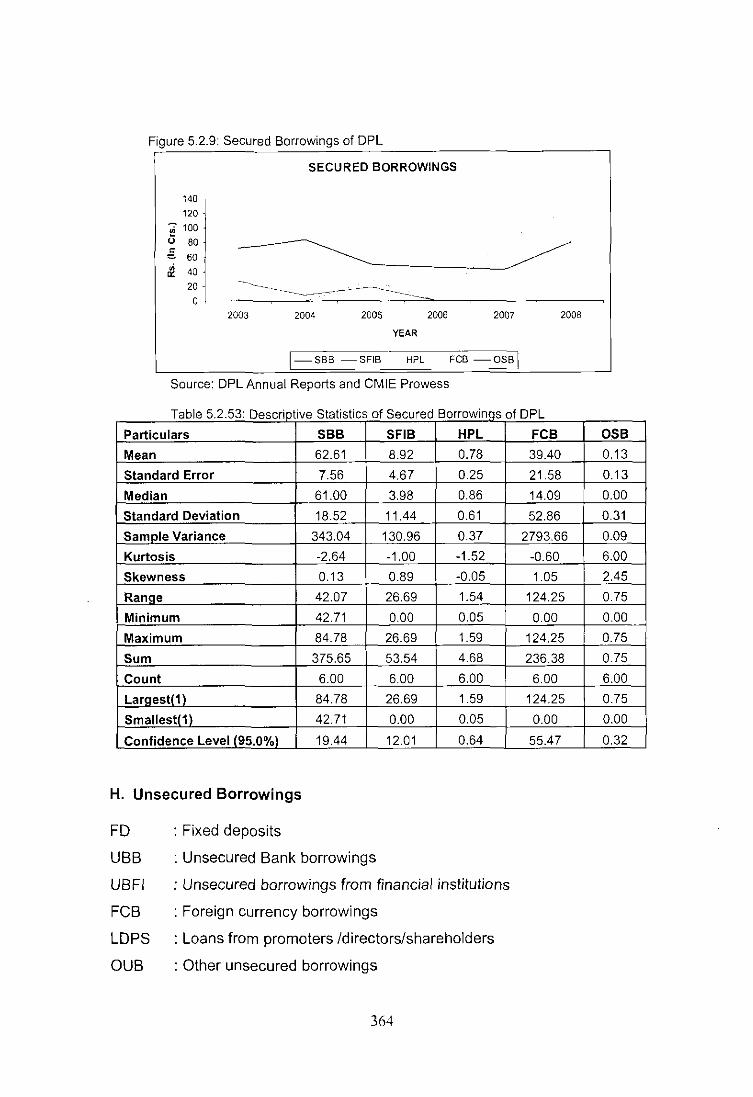
Figure 5 2.9: Secured Borrowings of DPL
140
120
-; 100 U 80 c
SECURED BORROWINGS
~ 60
£ ~~j~----------.---~~--.~ .. ~.-~-----------~~.-~:.~~~~~:~~:-----------2003 2004 2005 2006 2007 2008
YEAR
l--sBB -SFIS HPL FCB --OSB I Source: DPL Annual Reports and CMIE Prowess
Table 5.2.53: Descriptive Statistics of Secured Borrowinqs of DPL
Particulars SBB SFIB HPL
Mean 62.61 8.92 0.78
Standard Error 7.56 4.67 0.25
Median 61.00 3.98 0.86
Standard Deviation 18.52 11.44 0.61
Sample Variance 343.04 130.96 0.37
Kurtosis -2.64 -1.00 -1.52
Skewness 0.13 0.89 -0.05
Range 42.07 26.69 1.54
Minimum 42.71 0.00 0.05
Maximum 84.78 26.69 1.59
Sum 375.65 53.54 4.68
Count 6.00 6.00 6.00
Lar!lest(1) 84.78 26.69 1.59
Smallest(1) 42.71 0.00 0.05
Confidence Level (95.0%) 19.44 1201 0.64
H. Unsecured Borrowings
: Fixed deposits
: Unsecured Bank borrowings
FD
UBB
UBFI
FeB LDPS
OUB
: Unsecured borrowings from financial institutions
: Foreign currency borrowings
: Loans from promoters Idirectors/shareholders
: Other unsecured borrowings
364
FCB
39.40
21.58
14.09
52.86
2793.66
-0.60
105
124.25
0.00
124.25
236.38
6.00
124.25
0.00
55.47
OSB
0.13
0.13
0.00
0.31
0.09
6.00
2.45
0.75
0.00
0.75
0.75
6.00
0.75
0.00
0.32
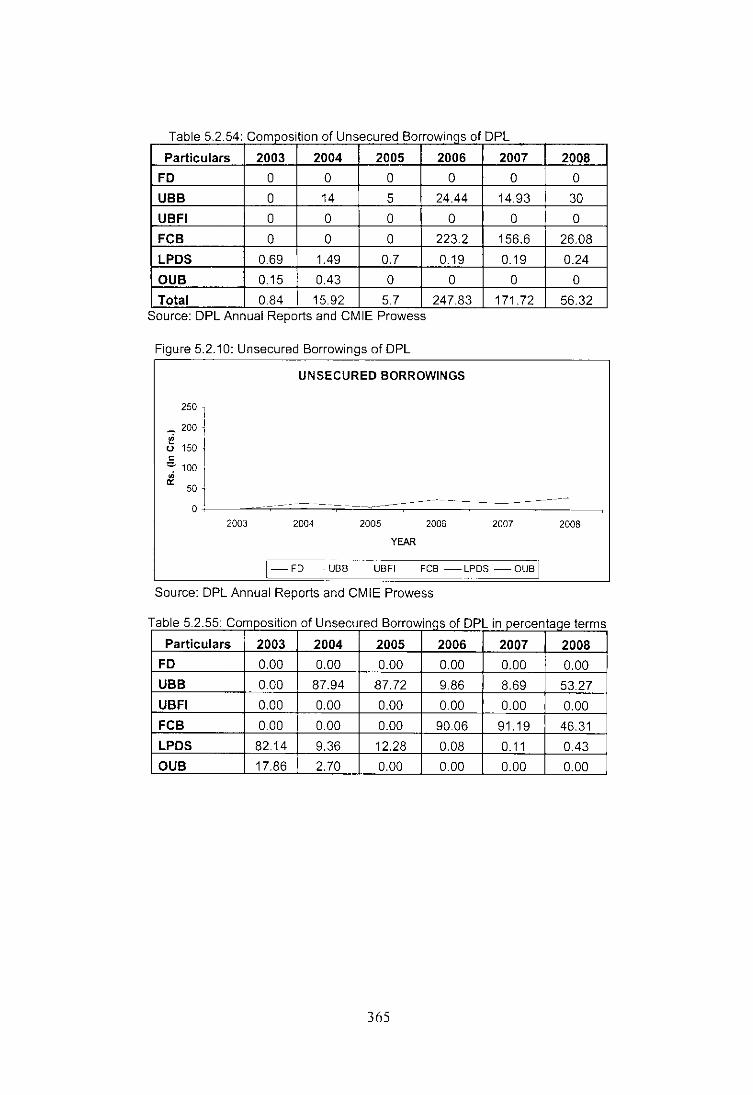
Table 5.2.54: Comoosition of Unsecured Borrowinas of DPL
Particulars 2003 2004 2005 2006 FD 0 0 0 0
UBB 0 14 5 24.44
UBFI 0 0 0 0
FCB 0 0 0 223.2
LPDS 0.69 1.49 0.7 0.19
DUB 0.15 0.43 0 0
Total 0.84 15.92 5.7 247.83 Source: DPL Annual Reports and CMIE Prowess
Figure 5.2.10: Unsecured Borrowings of DPL
UNSECURED BORROWINGS
250 1 200 J
. I
~ 150 I '-" 100 ~
2007 0
14.93
0
156.6
0.19
0
171.72
2008 0
30
0
26.08
0.24
0
56.32
£ 50 I 0~1 __ ~~==~~====~ ____ ~_--__ -_-__ _
2003 2004 2005 2006 2007 2008
YEAR
[-FD UBB UBFI FeB - LPDS - DUB I Source: DPL Annual Reports and CMIE Prowess
Table 5.2.55: Comoosition of Unsecured Borrowinas of DPL in oercentaae terms
Particulars 2003 2004 2005 2006 2007 2008 FD 0.00 0.00 0.00 0.00 0.00 0.00
UBB 0.00 87.94 87.72 9.86 8.69 53.27
UBFI 0.00 0.00 0.00 0.00 0.00 0.00
FCB 0.00 0.00 0.00 9006 91.19 46.31
LPDS 82.14 9.36 12.28 0.08 0.11 0.43
DUB 17.86 2.70 0.00 0.00 0.00 0.00
365

Table 5.2.56: i~StiCS of unsec~ i~~ ....... ·co. . Fo,I;·· .. UB Nle~~ '. .• ;o:"'!;: 000 14.73 000 67.65 0.58 0.10
c;;r Error JIt. 000 '"
0.00 39.82 0.21 0.07 ~ ... 0.00 1304 0.47 0.00
~ ~: •• ~ .' ~.~~ 14:47 0.00 0.00 0.19 0.00
----:; ~., 0.00 11.31 000 97.54 0.50 0.17 . : ...
. : ...• : :} . 0.00 127.94 0.00 9513.11 0.25 0.03 :: '. : -,. =3;. -1.15 -0.73 1.70 3.46 - -
.:. 0.07 1.12 1.37 1.91 . .
"':.'Hfi'[: 0.00 30.00 0.00 223.20 1.30 0.43 --::-::-, --:;-
~. 0.00 0.00 0.00 0.00 0.19 0.00 I ~....-:c ....-:c
0.00 30.00 0.00 ??'1 ?n 1.49 0.43
• -000 88.37 0.00 AI"\~ QQ 3.50 0.58
'. .: 6.00 6.00 6.00 6.00 6.00 6.00 . .
0.00 30.00 0.00 223.20 1.49 0.43 ;'" ".
11 ...~~;::: 0.00 0.00 0.00 0.00 0.19 0.00
~"" , Level 195:00/0\ .-:"'. 000 11.87 000 102.36 0.53 0.18
I. Borrowings (Sources)
OB: Other borrowings BB: Bank borrowings
FB: Foreign borrowings HPB: Hire Purchase Borrowing
FIB: Financial institutional borrowings
BPD: Borrowings from promoters / directors
Ta%:~.:5257: comDOSJti~~:~fBorrOWinqSS of DPL 0' "I "l""i~Y+i; >FFi1T> ~articulars 2003::: 2004 '" 2006,~j/,:~ 2007 ,1f:irz008 ....
BS':,!·: 71.62 98.78 55.38 70.25 57.64 110.35 :ii.:.· ..
26.69 7.96 18.89 0 0 0 'FBJj~;f 0 0 28.17 223.2 240.56 150.33
I . ,,;.A.: ••• BPO':'" . 0.69 1.49 0.7 0.19 0.19 0.24 HPEf-;- ... 0.68 1.19 1.03 0.14 0.05 1.59
oa'.; 0.9 0.43 ·1.42E·14 0 0 5.68E·14
Toi~I' 100.58 109.85 104.17 293.78 298.44 262.51 Source: DPL Annual Reports and CMIE Prowess
366

Figure 5.2.11: Borrowings (Sources) of DPL
300
250
..,. 200 ~ o 150 c
~ '~~ 1
BORROWINGS (SOURCES)
2003 2004 2005 2006 2007 2008 °r'--==~~==~====~~--~---------
·50 .
YEAR
[=W-FIB FB BPD -HPB -OB I
Source: DPL Annual Reports and CMIE Prowess
Table 5.2.58: Composition of Borrowings (Sources) of DPL in percentage terms
Particulars 2003 2004 2005 2006 2007
SB 71.21 89.92 53.16 23.91 19.31
FIB 26.54 7.25 18.13 0.00 0.00
FS 0.00 0.00 27.Q4 75.98 80.61
SPD 0.69 1.36 0.67 0.06 0.06
HPS 0.68 1.08 0.99 005 0.02
OS 0.89 0.39 0.00 0.00 0.00
367
2008
42.04
0.00
57.27
0.09
0.61
0.00
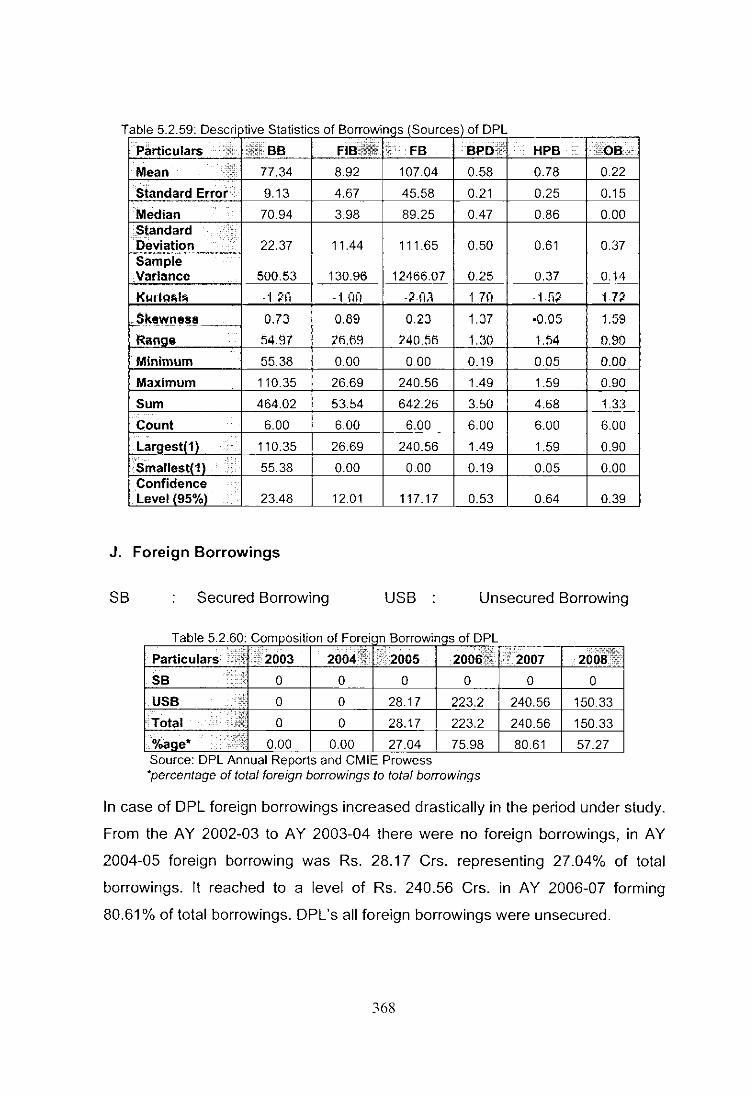
T able 5.2.59: Descriptive Statistics of Borrowings (Sources) of DPL
Pllrticulars >H1 :~BB FIB~'ii I, 'FB BPO'''' HPB ...... 1foB:·
Mean t: 77.34 8.92 10704 0.58 0.78 0.22
Standard Error' 9.13 4.67 45.58 0.21 0.25 0.15
Median ......
70.94 3.98 89.25 0.47 0.86 0.00 ,:;!andard n Deviation 22.37 11.44 111.65 0.50 0.61 0.37 Sample Variance 500.53 130.96 12466.07 0.25 0.37 0.14
---- --
Klllh1AI .. -1 ~tl -100 )0.1 1 70 1 .fii ·I·n Jl kl!W-'l e!!~ on 0.89 0.23 1.37 -0.05 1.59
Ranoa 54.91 26.69 ;>40.55 1.:30 1.54 0.90
Minimum 55.38 000 000 0.19 0.05 0.00
Maximum 110.35 26.69 240.56 1.49 1.59 0.90
Sum 464.02 53.54 642.26 3.50 4.68 1.33 .
Count 6.00 6.00 6.00 6.00 6.00 6.00
Largest(1) :,. 110.35 26.69 240.56 1.49 1.59 0.90
'Smallest(1) ,q 55.38 0.00 0.00 0.19 0.05 0.00 Confidence
.'. Level (95%) 23.48 12.01 117.17 0.53 0.64 0.39
J. Foreign Borrowings
SB Secured Borrowing USB Unsecured Borrowing
T bl 5260 C a e om position 0 fF ore"ln Borrowin>ls of DPL
Particularsm~ )2003 2004'f!" ["2005 . ""r,'
200sl:f • SB ...... ~ 0 0 0 0
USB .:: 0 0 28.17 223.2
Total ' .'~ 0 0 28.17 223.2
%age' .;: 0.00 0.00 27.04 75.98 Source. DPL Annual Reports and CMIE Prowess 'percentage of total foreign borrowings to total borrowings
.. 200111 . , 2007
0 0
240.56 150.33
240.56 150.33
80.61 57.27
In case of DPL foreign borrowings increased drastically in the period under study.
From the AY 2002-03 to A Y 2003-04 there were no foreign borrowings, in AY
2004-05 foreign borrowing was Rs. 28.17 Crs. representing 27.04% of total
borrowings. It reached to a level of Rs. 240.56 Crs. in AY 2006-07 forming
80.61 % of total borrowings. DPL's all foreign borrowings were unsecured.
368
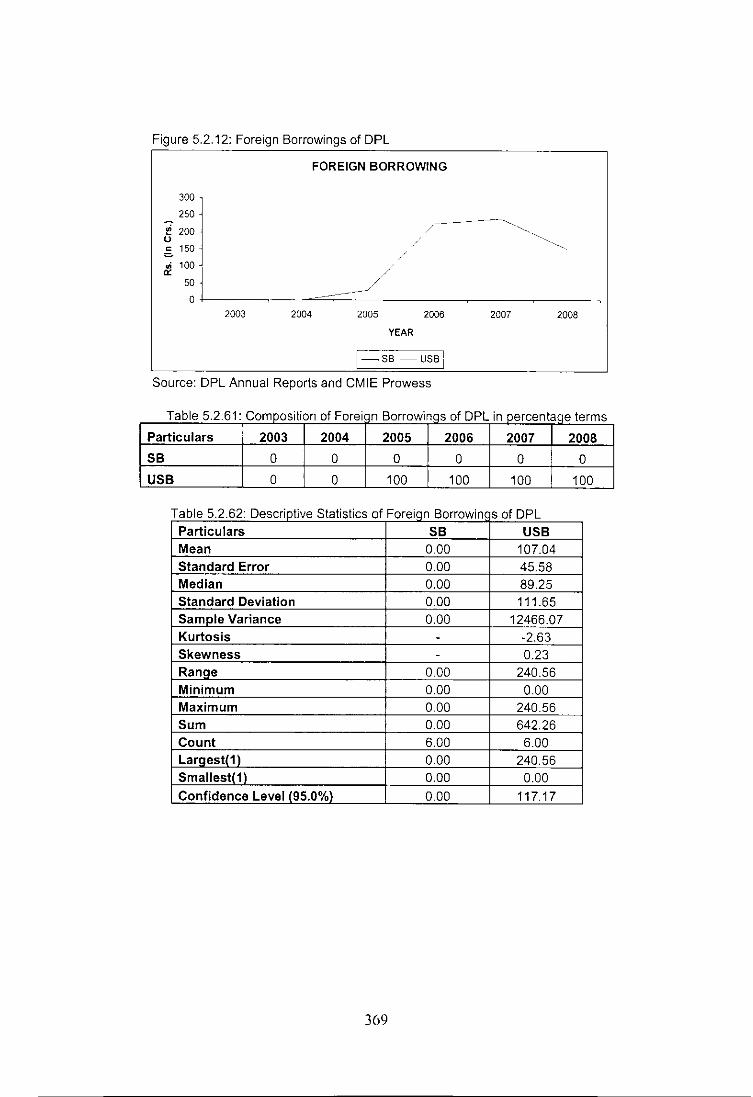
Figure 5.2.12: Foreign Borrowings of DPL
300
250
!! 200 u ~ 150
~ 100 I 50 j
o+-I--~ 2003
FOREIGN BORROWING
2004 2005 2006
YEAR
[-S8 -USBI
Source: DPL Annual Reports and CMIE Prowess
2007 2008
Table 5.2.61: Composition of Forei n Borrowinqs of DPL in percentaqe terms
Particulars 2003 2004 2005 2006 2007 2008
SB 0 0 0 0 0 0
USB 0 0 100 100 100 100
Table 5.2.62: Descriptive Statistics of Foreiqn Borrowin s of DPL Particulars SB USB Mean 0.00 107.04 Standard Error 0.00 45.58 Median 0.00 89.25 Standard Deviation 0.00 111.65 Sam ole Variance 0.00 12466.07 Kurtosis - -2.63 Skewness - 0.23 Ranoe 000 240.56 Minimum 0.00 0.00 Maximum 0.00 240.56 Sum 0.00 642.26 Count 6.00 6.00 Laraesll1\ 0.00 240.56 Smallestl11 0.00 0.00 Confidence Level (95.0%1 0.00 117.17
369
5.2.3: Determinants of Capital Structure
Dependent Variable:
DER Debt Equity Ratio
Independent Variable:
1. Size Ln Total Assets)
2. LRD Ln (R&D Expenditure)
3. GFATA Gross Fixed Assetsrrotal Assets
4. NWCGW Net Working Capital! Gross Working Capital
370

A. Debt - Equity Ratio and NWCGW
T bl 52 63 D b E 't R t a e e t :c ulty a 10 an d NWCGW I DPL 0
"'YEAR DER NWCGW
.' 2003 9.77 0.49
2004 10.67 0.56
2005 7.59 0.68
2006 21.40 0.80
2007 2067 0.59
2008 16.47 0.69
T bl 5264 R a e egression St ttl D bt E 't R t a IS lCS 0 e =qulty a 10 an d NWCGW IDPL 0
.:'ii0 "
. Regression Statistics ,<
Multiple R 0.49
R Square 0.24
Adiusted R Square 0.04
Standard Error 5.77
Observations 6
In case of DPL independent variable (NWCGW) is able to explain only 4%
deviation in the dependent variable (DER). The coefficients of constant and
independent variable are statistically insignificant.
T bl 5265 ANOVA R a e esu ts 0 IS tatlstlcs 0 I D b E R e t :qUlty atlo an d NWCGW I DP 0 L Df SS MS F Significance F
Regression 1 41.13 41.13 1.23 0.3287 Residual 4 133.23 33.31
Total 5 174.36
T bl 5 2 66 C If t D t'l f D bt E 't R t a e De JClen s e 31 S 0 e :qulty a 10 an d NWCGW IDPL 0
Intercept NWCGW Coefficients -1.90 25.73 Standard Error 14.88 23.15 t Stat "< -0.13 1 .11 P-value 111. . 0.90 0.33 Lower 95%
, -43.21 -38.56
Upper 95% ..... 39.41 90.02
371

Table 5.2.67: Residual Output 01 Debt Equity Ratio and NW CGW IDPL a , Predicted Standard
Observation' DER .• !'.·. Residuals I; Residuals 1 10.60 -0.83 -0.16
2 12.54 -1.87 -0.36
3 15.67 -8.08 -1.57
4 18.63 2.77 0.54
5 13.20 7.47 1.45
6 15.92 0.55 0.11
Tabl 5268 P b bTl 0 ttl 0 bt E e ro a Illy UlpU a e =qulty R atlo an d NWCGW IDPL a .• Ttl? Percentile'····";- .' . ;-DER
8.33 7.59 25.00 9.77 41.67 10.67 58.33 16.47
75.00 20.67
91.67 21.40
Figure 5.2.13: NWCGW Residual Plot 01 DPL
NWCGW Residual Plot
10.00 ,---------------, • 5.00
0.00 f--~~+-.-.-"'.:.-+--. ~-+I~""--~~--~ • -5.0<1JOO 0.20 0.40 0.60 0.80 1. 0
-10.00 •
NWCGW I
. '
Figure 5.2.14. NWCGW Line Fit Plot 01 DPL
NWCGW Line Fit Plot
30.00
0:: 20.00 w 0 10.00 t
.DER :i I. Predict"d DERi I
0.00
0.00 0.50
NWCGW
372
1.00
.... , ..

Figure 5.2.15: Normal Probability Plot of DP ------
Normal Probability Plot
30.00
t 0:: 20.00 w 0 10.00 •
0.00
•
0.00 20.00 40.00 60.00 80.00 100.00 I ,
I , __ -
Sample Percentile _I B. Debt - Equity Ratio and Size
Table 5. 269 D b E e t oqUlty R atlo an d SIZE f DPL 0
:YEAR ~,' , COER SIZE
2003 9.77 5.28
2004 10.67 5.40
2005 7.59 5.68
"":!O06 21.40 6.27
2007 20.67 6.53
2008 16.47 6.72
Table 5.2.70: R egression S . tatlstlcs 0 Debt Equity Ratio an dS IZE 0 DPL :.
Regression Statistics
Multiple R 0.81
R Square 0.65
Adjusted R Square 0.56
Standard Error 3.91
Observations 6
In case of DPL independent variable (SIZE) is able to explain about 56%
deviation in the dependent variable (DER). The coefficient of independent
variable is statistically significant and coefficient of constant is statistically
insignificant.
T bl 5 2 71 ANOVA R It f St r r f D b E a e esu so a IS ICS 0 e t R qUity atlo an d SIZE f DPL 0
:. .. Of SS :. MS ,C" F Significance F Regression 1 113.20 113.20 7.40 0.0529 Residual 4 61.17 15.29
Total 5 174.36
373
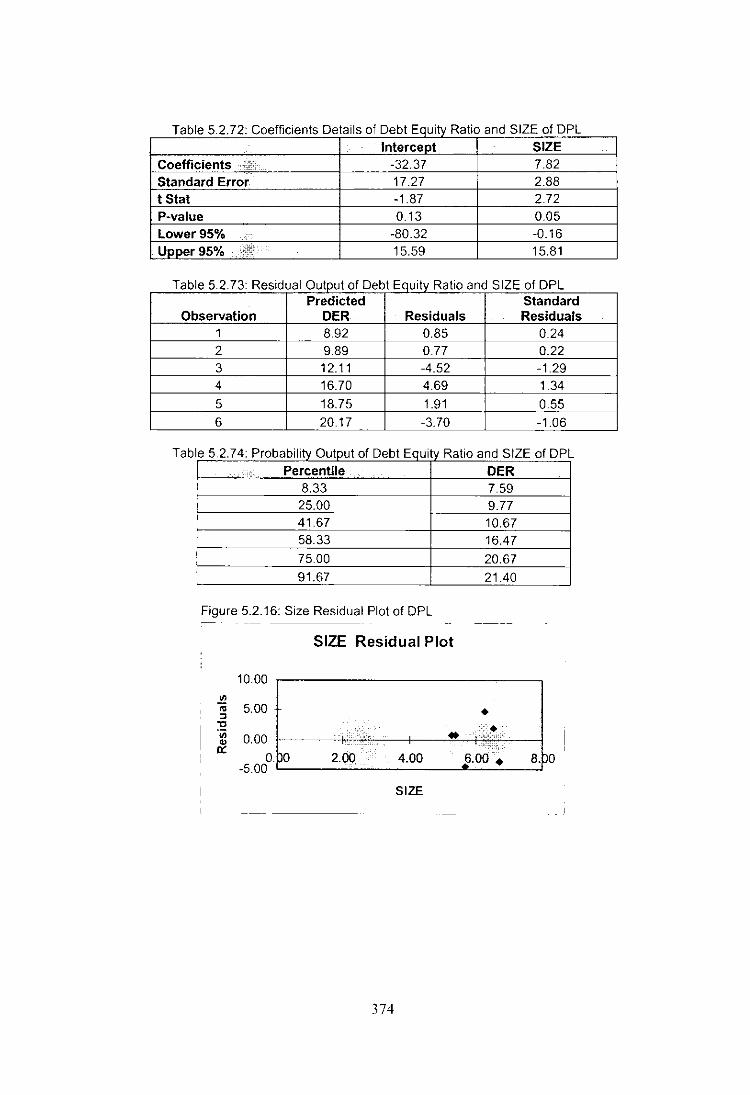
Table 5.2.72: Coefficients Details 01 Debt Equity Ratio and SIZE of DPL Intercept . SIZE
Coefficients,';: -32.37 7.82 Standard Error 17.27 2.88 t Stat -1.87 2.72 P-value 0.13 0.05 Lower 95% , -80.32 -0.16 Upper 95% ;;ii: 15.59 15.81
T bl 52 73 Rd lOt tiD bt Et R t a e eSI ua U{pU 0 e :qulty a 10 an d SIZE 1 DPL 0
Predicted Standard Observation DER Residuals Residuals
1 8.92 0.85 0.24 2 9.89 077 0.22 3 12.11 -4.52 -1.29 4 16.70 4.69 1.34
5 18.75 1.91 0.55 6 20.17 -3.70 -1.06
Tab Ie 5.2.74: Probability Output of Debt Equity Ratio and SIZE of DPL
.' Percentile DER 8.33 7.59 25.00 9.77 41.67 10.67 58.33 16.47
75.00 20.67 91.67 21.40
Figure 5.2.16: Size Residual Plot of DPL
SIZE Residual Plot
1000
.!!! 5.00 '" • " -0
:;:.,~., 'iii 0.00 '" .. " '" 0::
O~O 2.00 4.00 i·OO • 8. 0 -5.00
SIZE
374

Figure 5.2.17: Size Line Fit Plot of DPL
a: 20.00 w o 10.00
SIZE Line Fit Plot
A1' ..• .. !It. 30.00 j.
0.00 '--_-'-_--"-_----1-_-'
0.00 2.00 4.00 6.00 8.00
SIZE
Figure 5.2.18: Normal Probability Plot of DPL
.DER II • Predicted DER
Normal Probability Plot
ffi ~~.~~ j o 10.00 •
0.00 '--_--' __ -+1 __ ---'--__ -+-_----'
• • • • •• 0.00 20.00 40.00 60.00 80.00 100.00
Sample Percentile
c. Debt - Equity Ratio and LRD
Table 5.2.75: Debt Equity Ratio and LRD of DPL 1$7
YEAR ij+"
'bER LRD 2003 9.77 0.25
2004 10.67 0.60
2005 7.59 1.38
·2006 21.40 3.20
2007 20.67 2.29
2008 16.47 0.78
Table 5.2.76: Reqression Statistics of Debt Equity Ratio and LRD of DPL .
Re!lression Statistics
Multiple R 0.76
R Square 0.58
Adiusted R Square 0.47
Standard Error 4.29
Observations 6
375

In case of DPL independent variable (LRD) is able to explain only 47% deviation
in the dependent variable (DER). The coefficients of constant and independent
variable are statistically significant.
Table 5.2.77: ANOVA Results 01 Statistics 01 Debt Equity Ratio and LRD 01 DPL .. Of 55 .... MS / •• &. F Si<:lOificance F
Regression 1 100.80 100.80 5.48 0.0793 Residual 4 73.57 18.39
Total 5 174.36
T bl 52 78 elf' a e oe IClents DI 1 D b E etal s 0 e t :qulty R atlo an d LRD 1 DPL 0 . " ... Intercept '.' LRO
Coefficients 8.79 3.97 Standard Error 2.98 1.70 t Stat .c:. 2.96 2.34 P-value ,,~: 0.04 0.08 Lower 95% 0.53 -0.74 Upper 95% 17.05 8.69
T bl 5 2 79 R . d lOt t f D bt E 't R r a e eSI ua UlpU 0 e =qullY a 10 an d LRD 1 DPL 0
observati~~ Predicted . Standard . ··C.
OER Residuals .' Residuals 1 9.77 -0.01 0.00 2 11.20 -0.53 -0.14 3 14.27 -6.69 -1.74 4 21.51 -0.11 -0.03 5 17.91 2.76 0.72 6 11.89 4.58 1.19
Tab Ie 5.2.80: Probability Output 01 Debt Equity Ratio and LRD 01 DPL
'. Percentile .' OER 8.33 7.59
25.00 9.77 41.67 10.67 58.33 16.47
75.00 20.67 91.67 21.40
376

Figure 5.2.19: LRD Residual Plot of DPL
LRD Residual Plot
10.00 ,-----------_----,
'" .. 5.00 • • ::J 1l 0.00 +--+- •. -+l ___ --+-----Ib:,.,:: ___ --l ti. -50dl·PO 1.00 2.00 3.00 •
4.:10 I -10.00 '--_____________ ..J
_I __ _
LRD
Figure 5.2.20: LRD Line Fit Plot of DPL ----- -------
LRD Line Fit Plot
30.00 ,.---_____ -,
~ :::i,,:; , 0.00 t I ;:., :;';, f
0.00 1.00 2.00 3.00 4.00
LRD
l--;DER --, • Predicted DE R : '
--I I
Figure 5.2.21: Normal Probability Plot of DPL ~--
! Normal Probability Plot
• ~ ~~.~~ j. .;5.~" 0.00 f_----'----"-i-"---~-~f_p~--1
• •
0.00 20.00 40.00 60.00 80.00 100.00
Sample Percentile
377
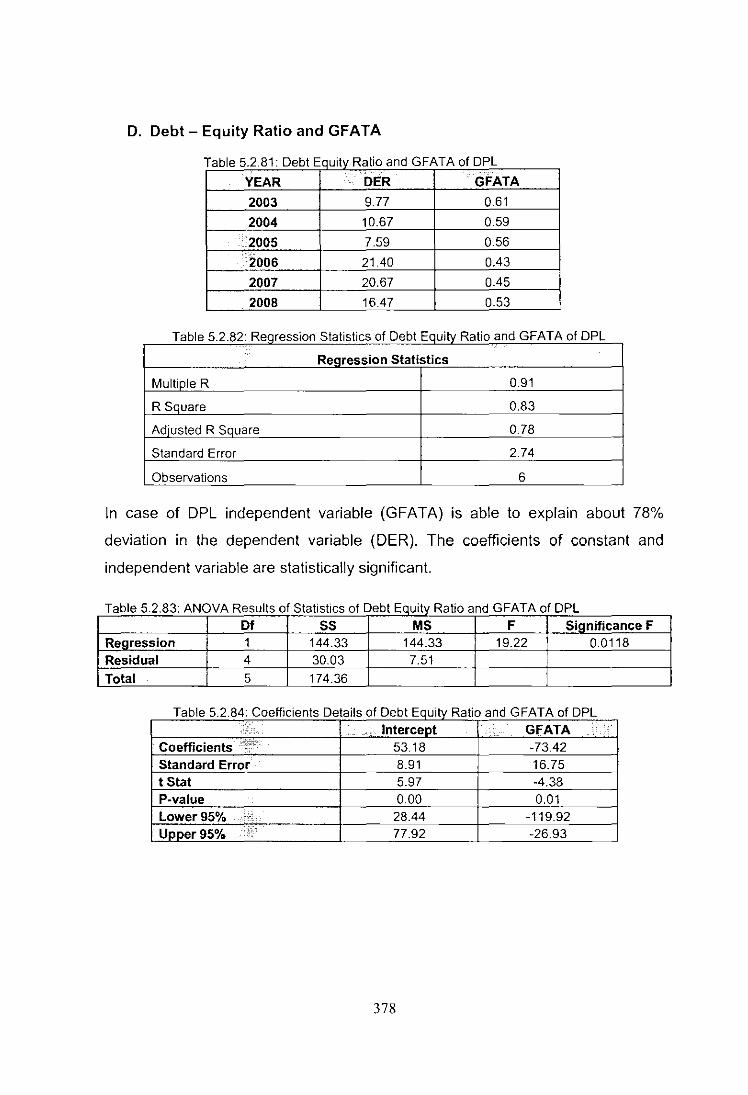
D. Debt - Equity Ratio and GFATA
Table 5.2.81: Debt Equity Ratio and G FATAo DP L
YEAR .. DER . GFATA
2003 9.77 0.61
2004 10.67 0.59
:.2005 7.59 056
2006 21.40 0.43
2007 20.67 0.45
2008 16.47 0.53
Table 5.2.82: Reqression Statistics of Debt Equity Ratio and G FATAo DPL
Regression Statistics
Multiple R 0.91
R Square 0.83
Adiusted R Square 0.78
Standard Error 2.74
Observations 6
In case of DPL independent yariable (GFATA) is able to explain about 78%
deviation in the dependent variable (DER). The coefficients of constant and
independent variable are statistically significant.
Table 5.2.83: ANOVA Results of Statistics of Debt Equity Ratio and G FATA of DPL Of SS MS F Si!lnificance F
Re!lression 1 144.33 144.33 19.22 0.0118 Residual 4 30.03 7.51
Total 5 174.36
Table 5.2.84: Coefficients Details of Debt Equity Ratio and GFATA of DPL -",':. • :.' Intercept . GFATA ,{
Coefficients':;'c 53.18 -73.42
Standard Error 8.91 16.75 t Stat 5.97 -4.38 P-value 0.00 0.01 Lower 95% .' 28.44 -119.92 Upper 95% .\:: 77.92 -26.93
378

Table 5.2.84: Coefficients Details of Debt Equity Ratio and GFATA of DPL
Observatio~ Predicted Ii Standard
OER . Residuals Residuals
Tab
1 8.48 1.28 0.52
2 9.75 0.92 0.37 3 12.35 -4.76 -1.94 4 21.43 -0.03 -0.01
5 20.23 0.43 0.18
6 14.31 2.16 0.88
Ie 5.2.86: P robability o utput a fD E ebt :qulty R atlo and GFATA f DPL a ',m Percentile ·'OER
8.33 7.59 25.00 9.77 41.67 10.67 58.33 16.47
75.00 20.67
91.67 21.40
Figure 5.2.22: GFATA Residual Plot of DPL
GFATA Residual Plot
4.00 ,.
'" 2.00 • ;;; 0.00 -+ ••
" " po '" -2.0m. 0.20 0.40 0.60 '" a: -4.00 • -6.00
GFATA
----- ---- ._-_.
Figure 5.2.23: GFATA Line Fit Plot of DPL ----
GFATA Line Fit Plot
30.00
a: 20.00 :-',)
• : .DER
O.~O
" , I w
0 10.00 ·'Zz . ~,. I • Predicted DE R: I
0.00 I I
000 0.20 OAO 0.60 0.80
GFATA
379
.....
'.'

Figure 5.2.24: Normal Probability Plot of DPL
Normal Probability Plot
30.00
t I 0:: 20.00 • • w • Cl 10.00 +:,' • , . • .
0.00
0.00 20.00 40.00 60.00 80.00 100.00 ,
Sample Percentile
~
380
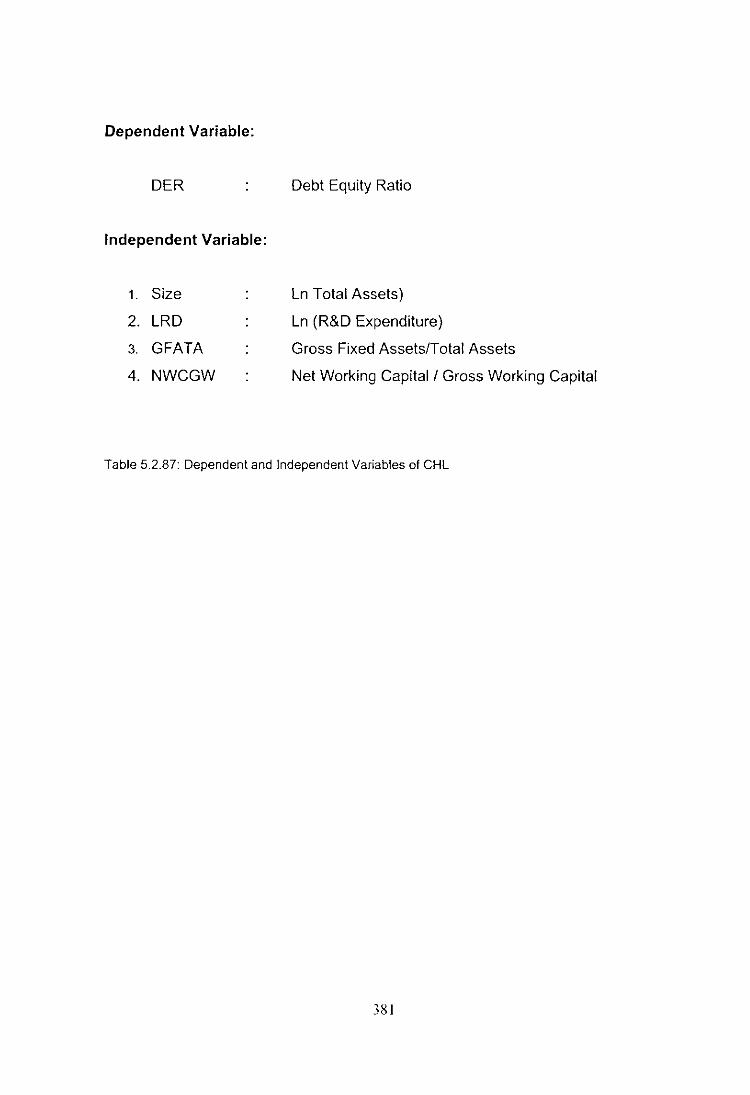
Dependent Variable:
DER Debt Equity Ratio
Independent Variable:
1. Size Ln Total Assets)
2. LRD Ln (R&D Expenditure)
3. GFATA Gross Fixed AssetslTotal Assets
4. NWCGW Net Working Capital! Gross Working Capital
Table 5.2.87: Dependent and Independent Variables of CHL
381

Table 5.2.88: Descriptive Statistics
Descriptive Statistics
Mean Std. Deviation N DER 14.4283 5.9046 6 NWCGW .6350 .1104 6 SIZE 5.9800 .6084 6 LRD 1.4167 1.1294 6 GFATA .5283 7.387E-02 6
Table 5.2.89: Correlation Matrix
Correlations
DER NWCGW SIZE LRD GFATA Pearson Correlation DER 1.000 .500 .805 .760 -.917
NWCGW .500 1.000 .582 .720 -.678 SIZE .805 .582 1.000 .532 -.769 LRD .760 .720 .532 1.000 -.939 GFATA -.917 -.678 -.769 -.939 1.000
Sig. (1-talled) DER .156 .027 .040 .005 NWCGW .156 .113 .053 .069 SIZE .027 .113 .139 .037 LRD .040 .053 .139 .003 GFATA .005 .069 .037 .003
N DER 6 6 6 6 6 NWCGW 6 6 6 6 6 SIZE 6 6 6 6 6 LRD 6 6 6 6 6 GFATA 6 6 6 6 6
382
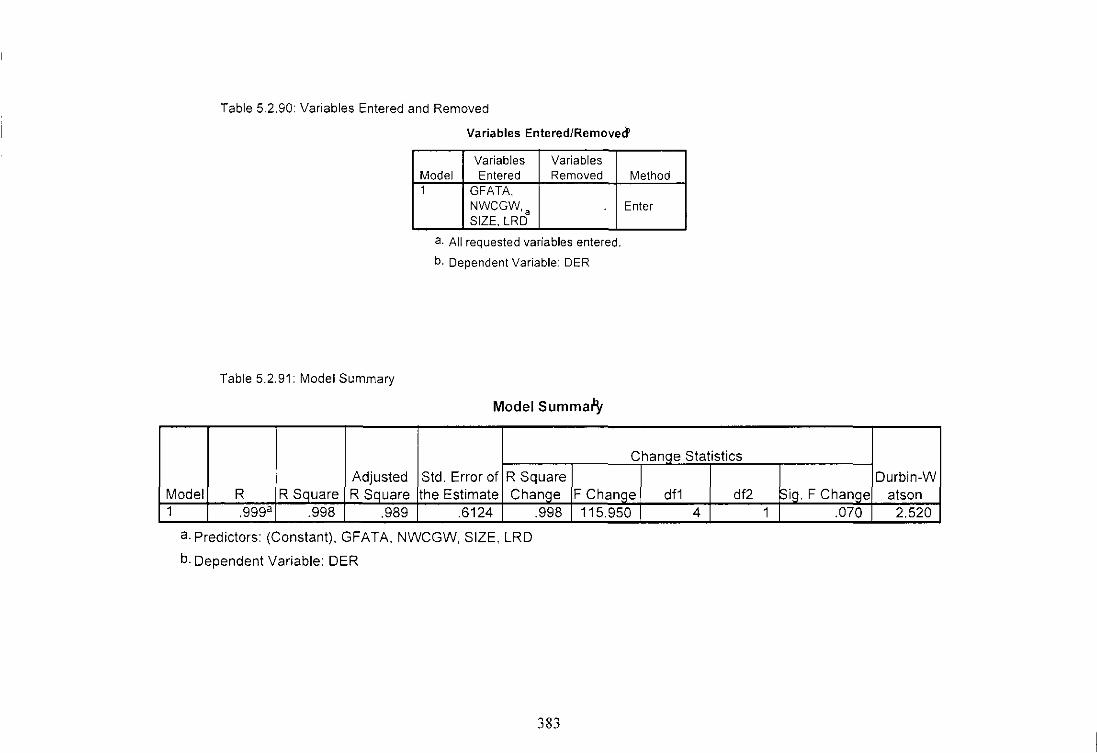
Table 5.2.90: Variables Entered and Removed
Variables Entered/Removed>
Variables Variables Model Entered Removed Method 1 GFATA,
NWCGW,. Enter SIZE, LRD
a. All requested variables entered.
b. Dependent Variable: DER
Table 5.2.91: Model Summary
Model Summa/y
Chanqe Statistics
Adjusted Std. Error of R Square Model R R Square R Square the Estimate Change 1 .999a .998 .989 .6124
a·Predictors: (Constant), GFATA, NWCGW, SIZE, LRD
b. Dependent Variable: DER
.998
383
F Change df1 df2 115.950 4
Durbin-W Sig. F Change atson
1 .070 2.520
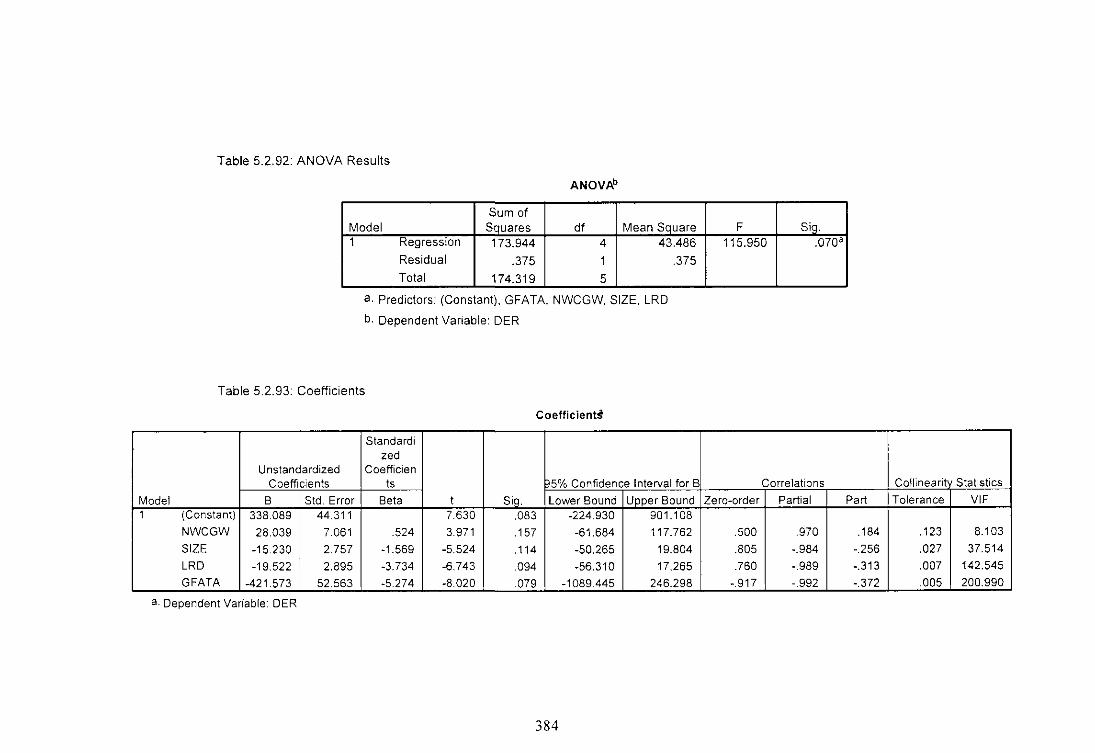
Table 5.2.92: ANOVA Results
ANOVAb
Sum 01 Model Sauares dl Mean Sauare F Sia. 1 Regression 173.944 4 43.486 115.950 .070a
Residual .375 1 .375
Total ____ L ....... !?4.319 5
a. Predictors: (Constant), GFATA, NWCGW, SIZE, LRD
b. Dependent Variable: DER
Table 5.2.93: Coefficients
Coefficient$
Standardl zed
Unstandardized Coefficien Coefficients ts 5% Confidence Interval for B Correlations Collinearit Statistics
Model B Std. Error Beta t Sic. Lower Bound Upper Bound Zero-order Partial Part Tolerance VIF 1 (Constant) 338.089 44.311 7.630 .083 -224.930 901.108
NWCGW 28.039 7.061 .524 3.971 .157 -61.684 117.762 .500 .970 .184 .123 8.103
SIZE -15.230 2.757 -1.569 -5.524 .114 -50.265 19.804 .805 -.984 -.256 .027 37.514
LRD -19.522 2.895 -3.734 -6.743 .094 -56.310 17.265 .760 -.989 -.313 .007 142.545
GFATA -421.573 52.563 -5.274 -8.020 079 -1089.445 246.298 -.917 -.992 -.372 .005 200.990
a. Dependent Variable: DER
384
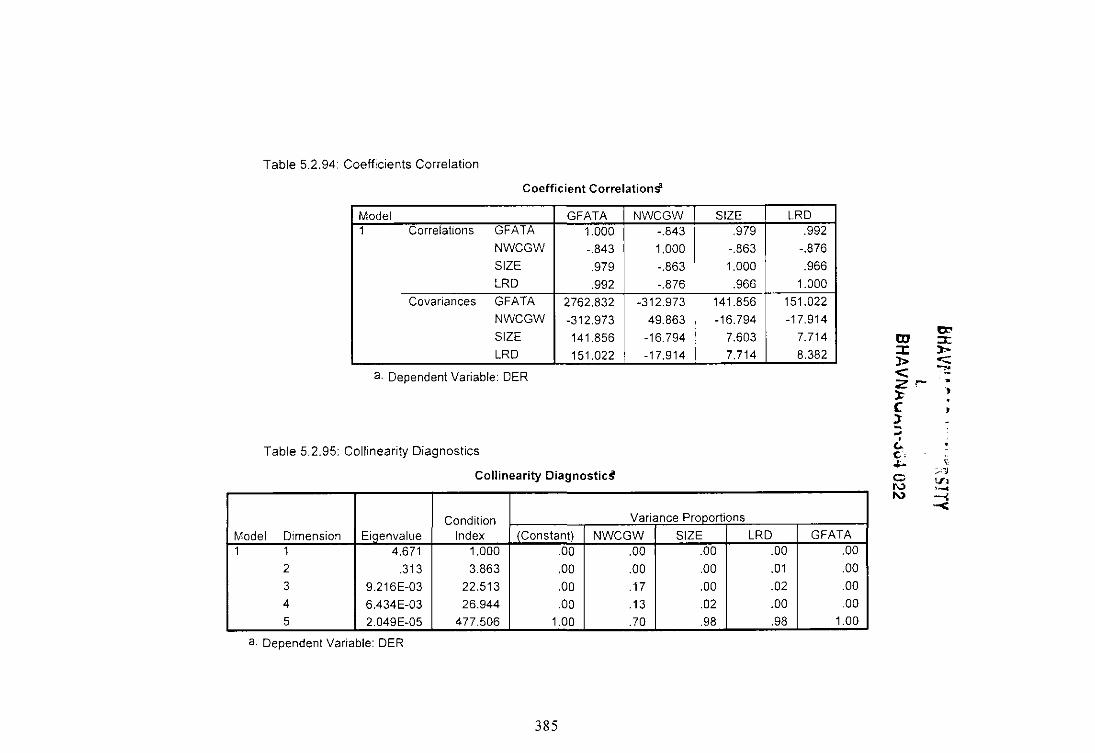
Table 5.2.94: Coefficients Correlation
Coefficient Correlationg'!
Model GFATA NWCGW SIZE LRD 1 Correlations GFATA 1.000 -.843 .979 .992
NWCGW -.843 1.000 -.863 -.876
SIZE .979 -.863 1.000 .966 LRD .992 -.876 .966 1.000
Covariances GFATA 2762.832 -312.973 141.856 151.022 NWCGW -312.973 49.863 -16.794 -17.914
SIZE 141.856 -16.794 7.603 7.714 lD 0::-::I:
LRD 151.022 -17.914 7.714 8.382
a. Dependent Variable: DER
:::J: ". l> 0:::: < C! zr- , ~ C :t ~ .. ,
Table 5.2.95: Collinearity Diagnostics c.. c'
Collinearity Diagnostic~ < ..
:;'-.] C !,I'. I\) ' .... I\) -l
~
Condition Variance Proportions
Model Dimension Eigenvalue Index (Constant) NWCGW SIZE LRD GFATA 1 1 4.671 1.000 .00 .00 .00 .00 .00
2 .313 3.863 .00 .00 .00 .01 .00
3 9.216E-03 22.513 .00 .17 .00 .02 .00
4 6.434E-03 26.944 .00 .13 .02 .00 .00
5 2049E-05 477.506 1.00 .70 .98 .98 1.00
a. Dependent Variable: DER
385
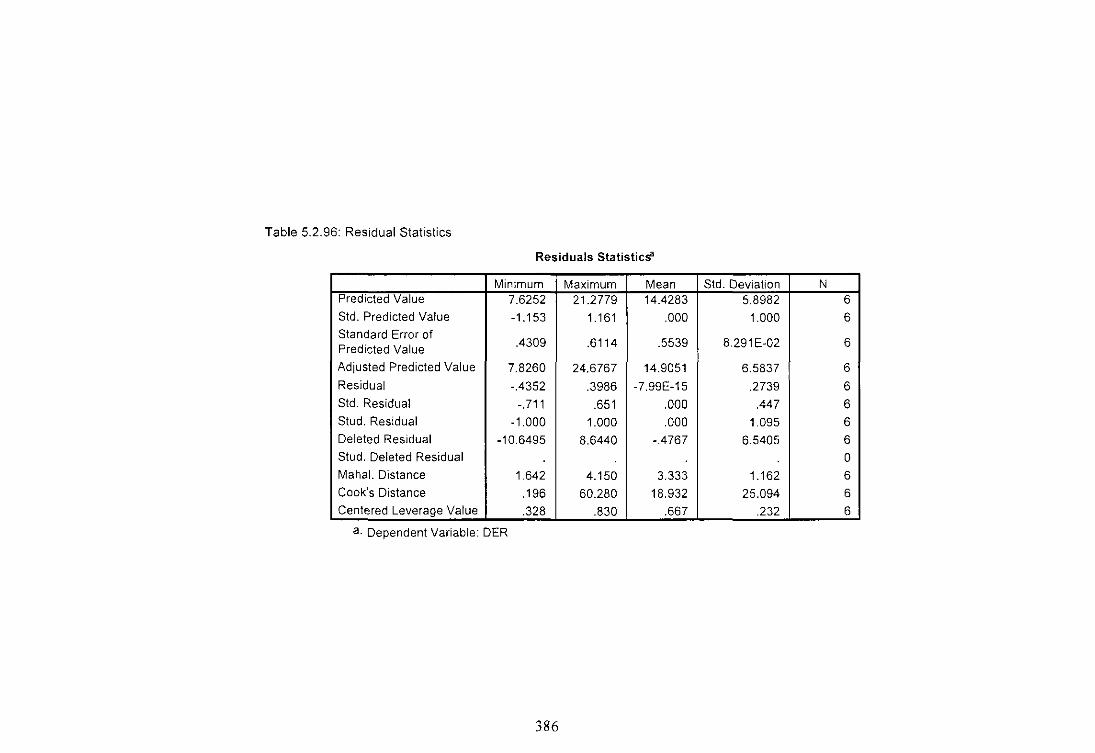
Table 5.2.96: Residual Statistics
Residuals Statistics"
Minimum Maximum Mean Std. Deviation N Predicted Value 7.6252 21.2779 14.4283 5.8982 6
Std. Predicted Value -1.153 1.161 .000 1.000 6
Standard Error of .4309 .6114 .5539 8.291 E-02 6 Predicted Value
Adjusted Predicted Value 7.8260 24.6767 14.9051 6.5837 6
Residual -.4352 .3986 -7.99E-15 .2739 6
Std. Residual -.711 .651 .000 .447 6
Stud. Residual -1.000 1.000 .000 1095 6
Deleted Residual -10.6495 8.6440 -.4767 6.5405 6
Stud. Deleted Residual 0
Mahal. Distance 1.642 4.150 3.333 1.162 6
Cook's Distance .196 60.280 18.932 25.094 6
Centered Leverage Value .328 .830 .667 .232 6
a. Dependent Variable: DER
386

Charts
Figure 5.2.25: Histogram
Histogram
Dependent Variable: DER 2.5
2.0
1.5
1.0 /, ~
>-() c .5
'" ::> CT ~ 0.0 lL
V ~ V
-.75 -.50 -.25 0.00 .25 .50
Regression Standardized Residual
~ .75
SId. Dev = .45
Mean = 0.00
N = 6.00
Figure 5.2.26: Normal Pop Plot of Regression Standardized Residual
Dependent Variable: DER 1.00
Expected Cum Prob .75
c
.50 c c
25 c
0,00
0,00 50 .75 1.00
Observed Cum Prob
387

Figure 5.2.27: Scatterpiot
Dependent Variable: DER 22
0
20
18
16
14
12
10
DER 8 0
6 -1.5 -1.0 -.5 0.0 .5 1.0 1.5
Regression Standardized Predicted Value
Figure 5.2.28: Scatterpiot
Dependent Variable: DER 22,---------------------~------------_,
20
18
16
14
12
o 10
DER 8
6+-____ --__ ~------~----------------~ -.8 -.6 -.4 -.2 0.0 .2 .4 .6 .8
Regression Standardized Residual
388
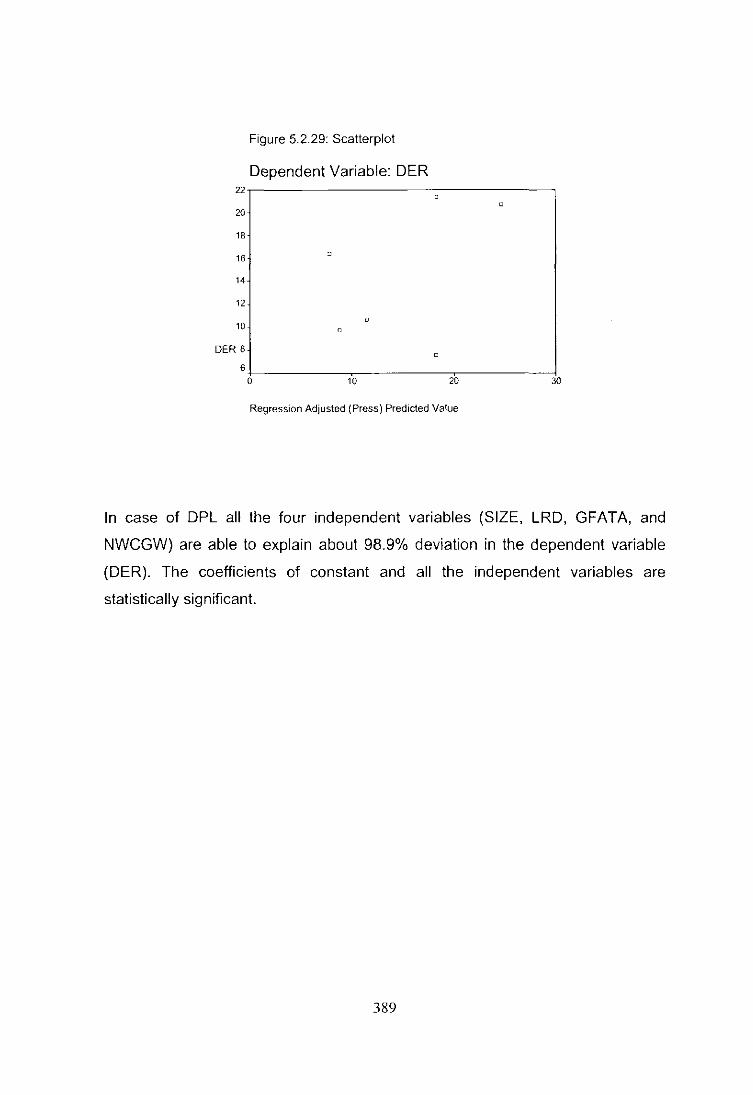
Figure 5.2.29: Scatterplot
Dependent Variable: DER 22,----------------------------------,
20
18
16 "
14
12
[)
10 , DER 8
6 0 10 20 30
Regression Adjusted (Press) Predicted Value
In case of DPL all the four independent variables (SIZE, LRD, GFATA, and
NWCGW) are able to explain about 98.9% deviation in the dependent variable
(DER). The coefficients of constant and all the independent variables are
statistically significant.
389
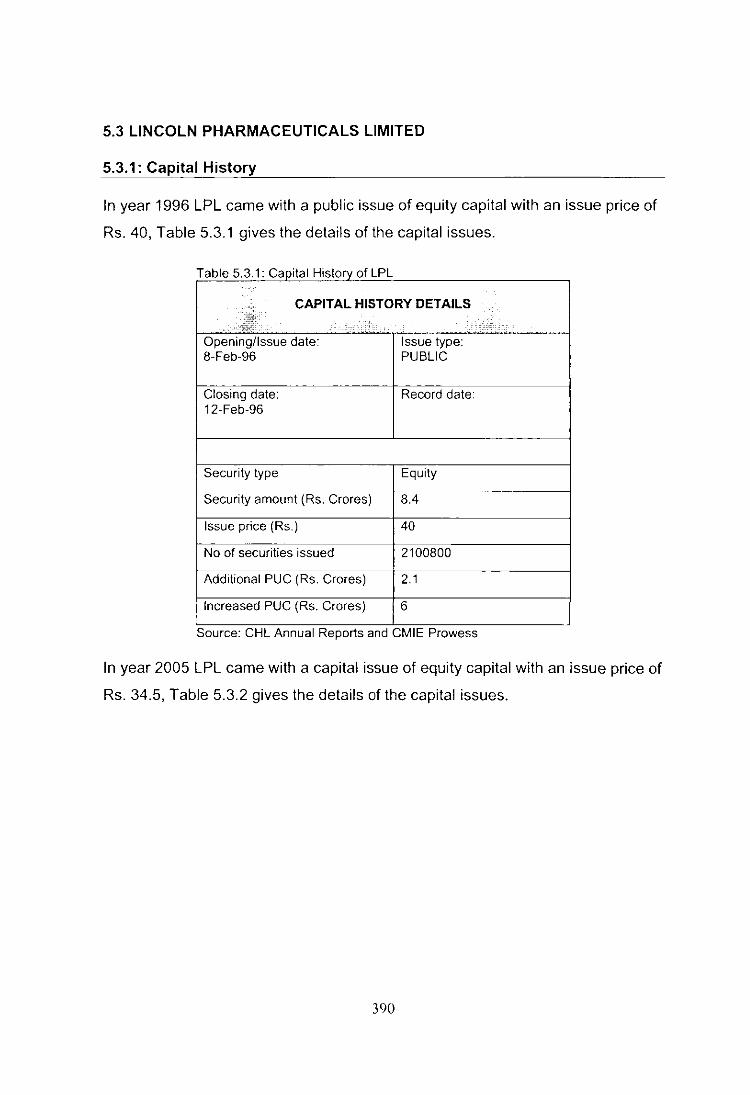
5.3 LINCOLN PHARMACEUTICALS LIMITED
5.3.1: Capital History
In year 1996 LPL came with a public issue of equity capital with an issue price of
Rs. 40, Table 5.3.1 gives the details of the capital issues.
Table 5.3.1: Capital History of LPL .. '
,I CAPITAL HISTORY DETAILS :;."., ,'>:.,:t.: ,', .,,:
Opening/Issue date: Issue type: 8·Feb·96 PUBLIC
Closing date: Record date, 12·Feb·96
Security type Equity
Security amount (Rs. Crores) 8.4
Issue price (Rs.) 40
No of securities issued 2100800
Additional PUC (Rs. Crores) 2.1
Increased PUC (Rs. Crores) 6
Source: CHL Annual Reports and CMIE Prowess
In year 2005 LPL came with a capital issue of equity capital with an issue price of
Rs. 34.5, Table 5.3.2 gives the details of the capital issues.
390
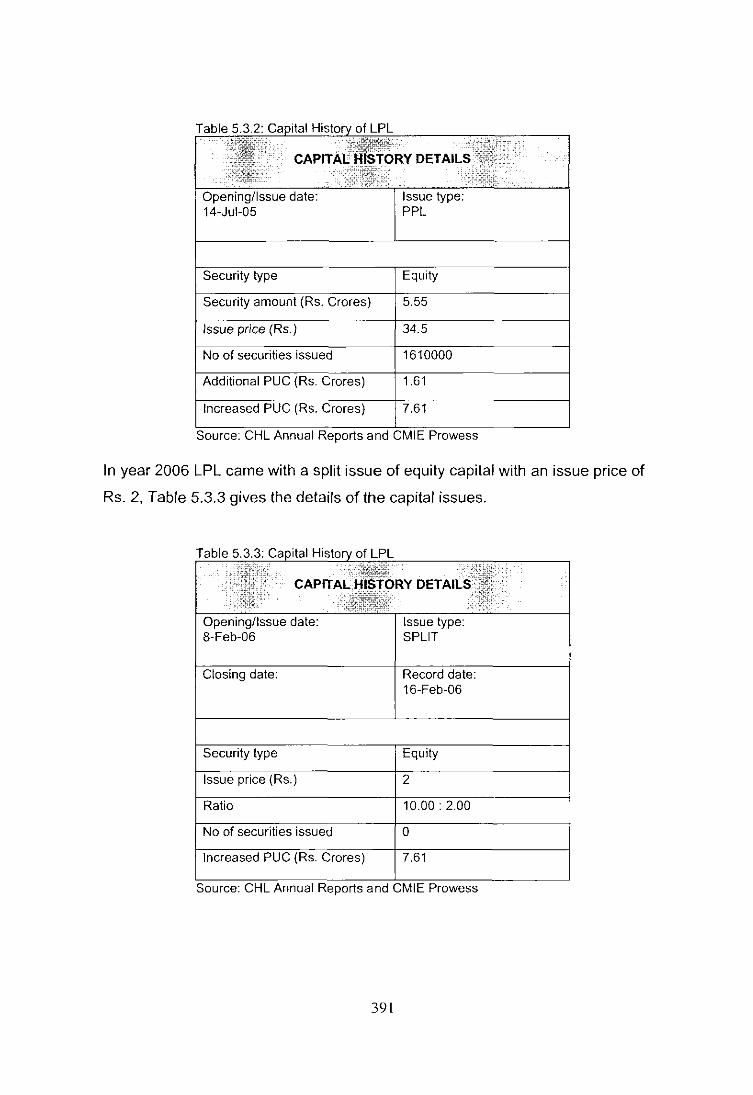
CAPITAL: HISTORY nO::1r1'"
Openingllssue date: 14-Jul-05
Security type
Security amount (Rs. Crores)
Issue price (Rs.)
No of securities issued
Additional PUC (Rs. Crores)
Increased PUC (Rs. Crores)
Issue type: PPL
Equity
5.55
34.5
1610000
1.61
7.61
Source: CHL Annual Reports and CMIE Prowess
In year 2006 LPL came with a split issue of equity capital with an issue price of
Rs. 2, Table 5.3.3 gives the details of the capital issues.
Table 5.3.3: Capital History of LPL :'::v;;\1h'X::, ,'.i?:UJJ.;-:;;
CAPITAL: HlS%RY DET AIL:S"}~C' ",; :;;~~.~J~Y: j :~;tjt-t -
Openingllssue date: 8-Feb-06
Closing date:
Security type
Issue price (Rs.)
Ratio
No of securities issued
Increased PUC (Rs. Crores)
Issue type: SPLIT
Record date: 16-Feb-06
Equity
2
10.00: 2.00
o 7.61
Source: CHL Annual Reports and CMIE Prowess
391
.
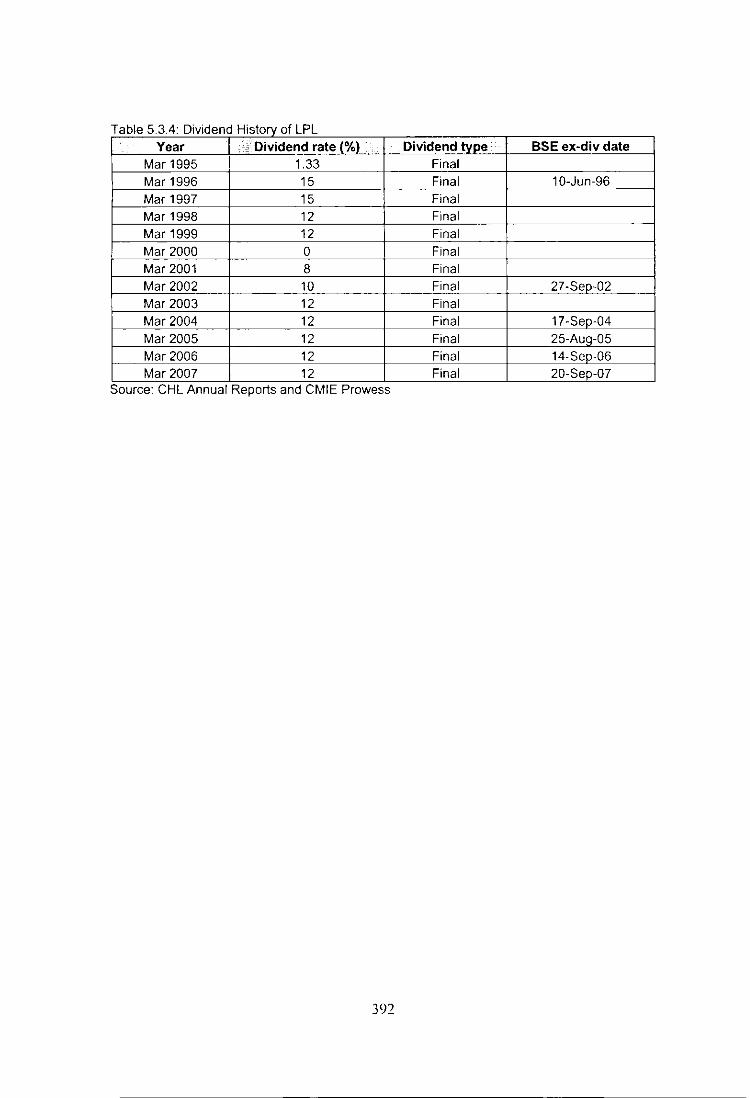
Table 5.3.4: Dividend History of LPL . Year : :,. Dividend rate (%1 Dividend type:· SSE ex-div date
Mar 1995 1.33 Final Mar 1996 15 Final 10-Jun-96
Mar 1997 15 Final Mar 1998 12 Final Mar 1999 12 Final Mar 2000 0 Final Mar 2001 8 Final Mar 2002 10 Final 27-Sep-02 Mar 2003 12 Final Mar 2004 12 Final 17-Sep-04 Mar 2005 12 Final 25-Aug-05 Mar 2006 12 Final 14-Sep-06 Mar 2007 12 Final 20-Sep-07
Source: CHL Annual Reports and CMIE Prowess
392

5.3.2: Analysis of Liabilities
A. Sources of Funds
SC:
SL:
Share Capital
Secured Loans
RSP: Reserves & Surplus
USL: Unsecured Loans
Table 5 3 5· Sources of Funds of LPL
Particulars 2003 2004 2005 2006 2007 2008 SC 5.88 5.9 6 7.61 7.61 7.61
RSP 11.23 12.51 13.53 19.03 20.97 24.54 SL 6.19 5.41 6.19 8.48 8.95 8.85
USL 2.98 3.23 3.52 4.67 4.52 4.21 Total 26.28 27.05 29.24 39.79 42.05 45.21
Source: LPL Annual Reports and CMIE Prowess
In case of LPL reserves & surplus was the major sources of funds during the
period under study. The average reserves & surplus were Rs. 16.97 Crs. which
reached to a level of Rs. 24.54 Crs. in the AY 2007-08 and in the AY 2002-03 it
was at its lowest level of Rs. 11.23 Crs.
Figure 5.3.1: Sources of Funds of LPL
SOURCES OF FUNDS
30 -
25 .
~ 10,
5 .
0---
2003 2004 2005 2006 2007 2008
YEAR
-sc -- RSP SL USLI
Source: LPL Annual Reports and CMIE Prowess
Table 5.3.6: Sources of Funds of LPL in terms of Percentaoe Particulars 2003 2004 2005 2006 2007 2008
SC 22.37 21.81 20.52 19.13 18.10 16.83 RSP 42.73 46.25 46.27 47.83 49.87 54.28 SL 23.55 20.00 21.17 21.31 21.28 19.58
USL 11.34 11.94 1204 11.74 10.75 9.31
393

Tbl537D a e . r St r r 1 S escnpllve a IS les 0 ources 0 1 F d 1 LPL un SO
Particulars ,li<. SC RSP SL USL
Mean ,ii< . . 6.77 16.97 7.35 3.86 Standard Error ·Fe 0.38 2.18 0.65 0.29 Median
.. ,. 6.81 16.28 7.34 3.87
Standard Deviation 0.92 5.33 1.58 0.71 Sample Variance 0.85 28.44 2.51 0.50 Kurtosis -3.31 -1.77 -2.80 -2.32 Skewness -0.01 0.37 -0.10 -0.06 Range 1.73 13.31 3.54 1.69 Minimum 5.88 11.23 5.41 2.98 Maximum .,:- . 7.61 24.54 8.95 4.67 Sum !l r.· .
40.61 101.81 44.07 23.13 Count 6.00 6.00 6.00 6.00 Largest(1) 7.61 24.54 8.95 4.67 Smallest(1) 5.88 11.23 5.41 2.98
Confidence Level (95.0%1 0.97 5.60 1.66 0.74
B. Sources of Funds (Internal and External)
IS: Internal Sources ES: External Sources DTL: Deferred Tax Liability
Table 5 3 8· Internal and External Sources 01 Funds 01 LPL
Sources of Funds
Particulars 2003 2004 2005 2006 2007 2008
IS -0.94 1.16 1.76 0.93 1.99 2.45
ES -0.19 1.43 4.14 0.44 10.58 1.17
DTL ! 1.71 0.07 -0.03 0.03 -0.28 -0.01
Total 0.58 2.66 5.87 1.4 12.29 3.61 Source. LPL Annual Reports and CMIE Prowess
In case of LPL it was found that, firm is equally dependent on both internal and
external sources of funds. For the period under study average internally
generated funds were of Rs. 1.23 Crs. and externally generated funds were
maintaining an average of Rs. 2.93 Crs. Retained profits was the major
component of internally generated funds. During the period no fresh capital was
raised through public offer, current liabilities & provisions and borrowings were
the major sources of external funds.
394
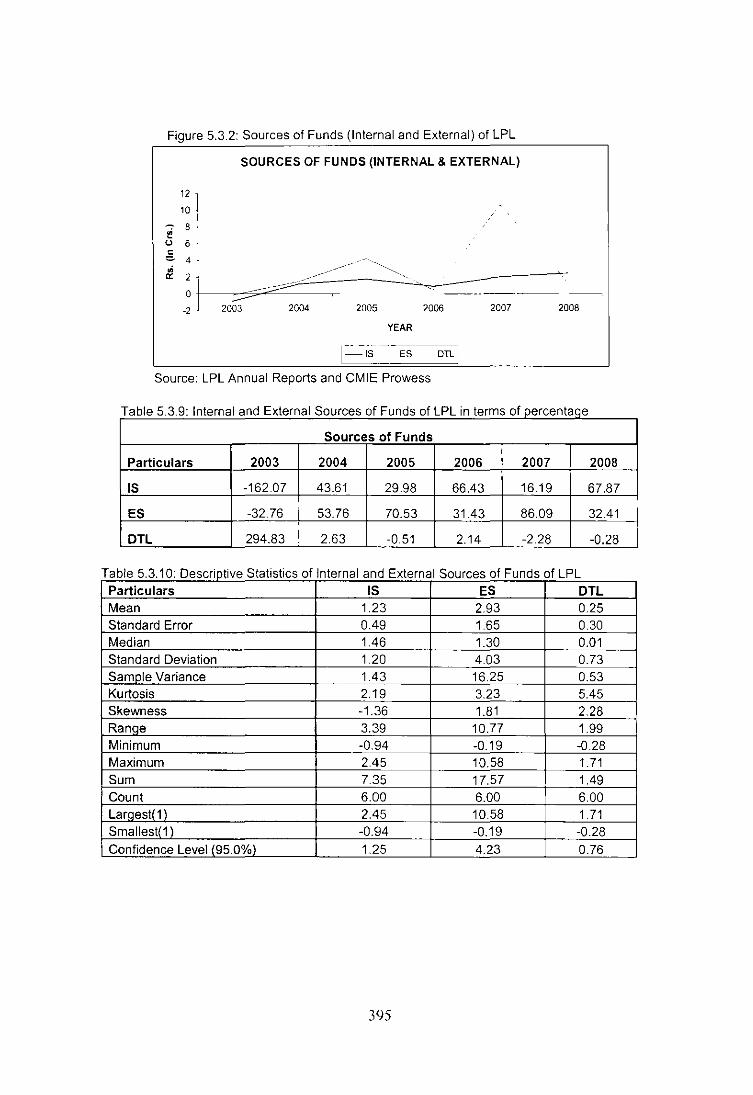
Figure 5.3.2: Sources of Funds (Internal and External) of LPL
SOURCES OF FUNDS (INTERNAL & EXTERNAL)
YEAR
Source: LPL Annual Reports and CMIE Prowess
Table 5.3.9: Internal and External Sources of Funds of LPL in terms 0 percentaQe
Sources of Funds
Particulars 2003 2004 2005 2006 2007 2008
IS -162.Q7 43.61 29.98 66.43 16.19 67.87
ES -32.76 53.76 70.53 31.43 86.09 32.41
DTL 294.83 2.63 -0.51 2.14 -228 -0.28
a e 5 .. T bl 310 D escriptive S tatlstlcs 0 f I nterna an dE xternal S ources 0 fF unds 0 LPL Particulars IS ES DTL Mean 1.23 2.93 0.25 Standard Error 0.49 1.65 0.30 Median 1.46 1.30 0.01 Standard Deviation 1.20 403 0.73 Sample Variance 1.43 16.25 0.53 Kurtosis 2.19 3.23 5.45 Skewness -1.36 1.81 2.28 Range 3.39 10.77 199 Minimum -0.94 -0.19 -0.28 Maximum 2.45 10.58 1.71 Sum 7.35 17.57 1.49 Count 6.00 6.00 6.00 Largest(1 ) 2.45 10.58 1.71 Smallest(1 ) -0.94 -0.19 -0.28 Confidence Level (95.0%) 1.25 4.23 0.76
395

i. Analysis of I nternal Sources
RP: Retained Profits DEP: Depreciation
Table 5 3 11· Internal Sources of Funds of LPL
Internal sources
Particulars 2003 2004 2005
RP -1.2 0.74 1.35
DEP 0.26 0.42 0.41
Total -0.94 1.16 1.76 Source: LPL Annual Reports and CMIE Prowess
Figure 5.3.3: Internal Sources of Funds of LPL
251
2 ' '.5 I
1! o ' I c 0.5 j e iii 0 ~----,-,L~
INTERNAL SOURCES
2006
0.44
0.49
0.93
a:: -0 5 2003 2004 2005 2006
-, --1.5 -
YEAR
!-RP -DEP:
Source: LPL Annual Reports and CMIE Prowess
2007
1.55
0.44
1.99
2007
T bl 5312 I a e nterna IS ources 0 f F d un s D LPL in terms of Percenta~e
Internal sources
Particulars 2003 2004 2005 2006 2007
RP 127.66 63.79 76.70 47.31 77.89
DEP -27.66 36.21 23.30 52.69 22.11
396
2008
1.94
0.51
2.45
2008
2008
79.18
20.82

Table 5.3.13: Descriptive Statistics 0 1 I nterna IS ources 0 1 F d 1 LPL un so
Particulars,· : RP . '? DEP .
Mean ,;~ .. . ..... 0.80 042
Standard Error 046 0.04
Median 1.05 043
Standard Deviation 1.12 0.09
Sample Variance 1.26 0.01
Kurtosis 1.78 2.52
Skewness -1.28 -1.39
Range :. . : 3.14 0.25 • . 'i!:iit: MinImum .... ...... -1.20 0.26
Maximum:: ... . : 1.94 0.51
Sum • 4.82 2.53
Count 6.00 6.00
Largest(1) 1.94 0.51
Smallest(1) -1.20 0.26
Confidence Level (95.0%) 1.18 0.09
ii. Analysis of External Sources
CLP: Current liabilities & provisions
FC: Fresh Capital
BORW: Borrowings
Table 5 3 14· External Sources 01 Funds 01 LPL
External sources •
Particulars .: 2003 2004 2005 2006 2007 2008
FC .~
0.01 0 0.1 0.85 5.55 0
BORW 1.34 0.97 -0.54 0.96 201 -0.07
CLP -1.54 046 4.58 -1.37 302 1.24
Total -0.19 143 4.14 044 10.58 1.17 Source: LPL Annual Reports and CMIE Prowess
T bl 5315 E a e xterna IS ources 0 un so In terrns a 1 F d 1 LPL . IP ercentage I: . in ...
j • ... External so urces
Particulars 2003 2004 2005 2006 2007 2008
FC -5.26 0.00 242 193.18 5246 0.00
BORW -705.26 67.83 -13.04 218.18 19.00 -5.98
CLP 810.53 32.17 110.63 -311.36 28.54 105.98
397

Figure 5.3.4: External Sources of Funds of LPL
6 -5 j 4 J
e 3 ~ ~ 2J :. I
EXTERNAL SOURCES
~ ~~1 ____ ~~----________ ~~-=~4_0~~--, j 2003 2004 .0 2005- 2006 2007
-2 J
YEAR
I--FC -BORW CLPI
Source: LPL Annual Reports and CMIE Prowess
Ta ble 5.3.16: DescriDtive Statistics of External Sources of Fun Particulars FC BORW CLP Mean 1.09 0.78 1.07 Standard Error 0.90 0.38 0.99 Median 0.05 0.97 0.85 Standard Deviation 2.21 0.93 2.42 Sample Variance 4.89 0.87 5.86 Kurtosis 5.51 -0.78 -1.18 Skewness 2.33 -0.31 0.39 Ranae 5.55 2.55 6.12 Minimum 0.00 -0.54 -1.54 Maximum 5.55 2.01 4.58 Sum 6.51 4.67 6.39 Count 6.00 6.00 6.00 Largest(1 ) 5.55 2.01 4.58 Smallest(1 ) 0.00 -0.54 -1.54 Confidence Level (95.0%) 2.32 0.98 2.54
2008
ds of LPL
C. Shareholder's Fund
AEC
SEC
: Authorized equity capital
: Subscribed equity capital
IEC : Issued equity capital
PEC : Paid-up equity capital
In case of LPL for the AY 2002-03 to AY 2003-04 paid up equity capital was Rs.
5.88 Crs. which increased to Rs. 5.79 Crs. in the following year. Paid equity
capital reached a level of Rs. 6 Crs. in the AY 2005-06 and in AY 2006-07 it was
Rs. 7.61 Crs.
398

Table 5.3.17: Composition of Shareholder's Fund of LPL
Particulars 2003 2004 2005 2006
AEC 7 7 7 7
IEC 6 6 6 6
SEC 6 6 6 6
PEC 5.88 5.88 5.79 6
Total 24.88 24.88 24.79 25 Source: LPL Annual Reports and CMIE Prowess
Figure 5 3.5' Shareholder's Funds of LPL
SHAREHOLDERS FUND
10· 9 8 •
~ 7
0 6 c 5 •
,; 4
a: 3 2 • 1 0
2003 2004 2005 2006 2007
YEAR
Source: LPL Annual Reports and CMIE Prowess
Table 5.3.18: Composilion of Shareholder's Fund of LPL in
Particulars 2003 2004 2005 2006
AEC 100.00 100.00 100.00 100.00
IEC 85.71 85.71 85.71 85.71
SEC 85.71 85.71 85.71 85.71
PEC 84.00 84.00 82.71 85.71
399
2007
9
7.61
7.61
7.61
31.83
2008
2008
9
7.61
7.61
7.61
31.83
-AEC
-IEC
SEC
PEC
ercentaqe lerms
2007 2008
100.00 100.00
84.56 84.56
84.56 84.56
84.56 84.56
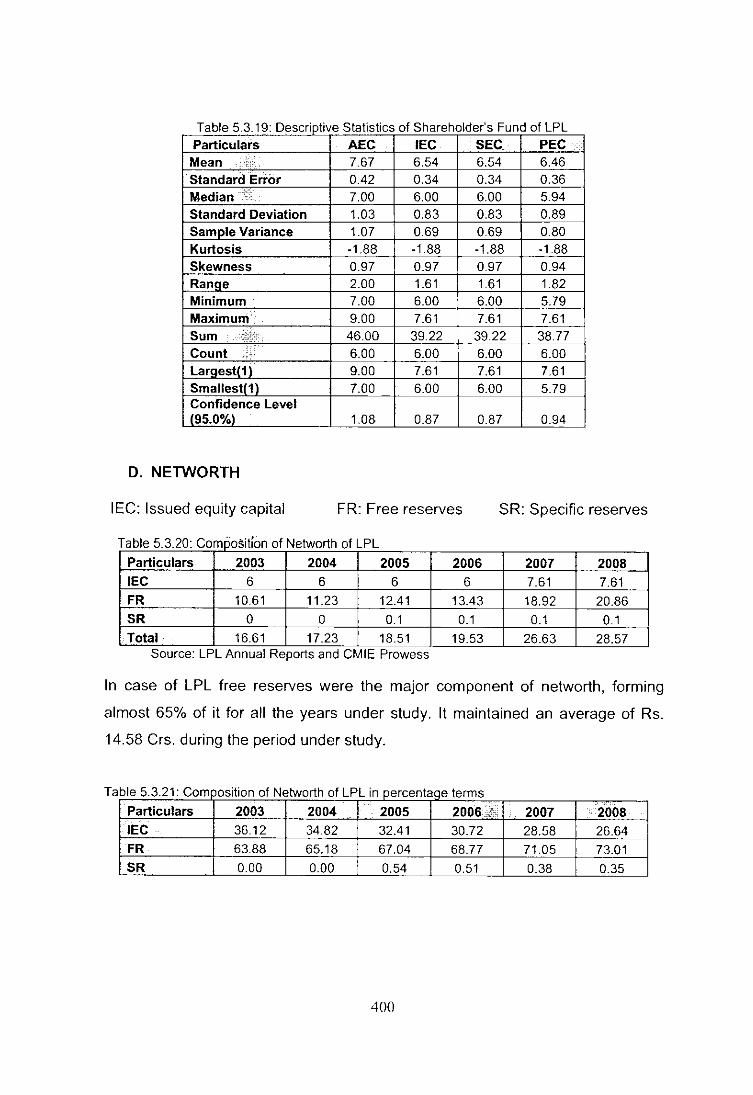
Table 5.3.19: Descriptive Statistics of Shareholder's Fund of LPL Particulars AEC IEC SEC PEC Mean :it: 7.67 6.54 6.54 6.46 Standard Error 0.42 0.34 0.34 0.36 Mediant: 7.00 6.00 6.00 5.94 Standard Deviation 1.03 0.83 0.83 0.89 Sam Die Variance 1.07 0.69 0.69 0.80 Kurtosis -1.88 -1.88 -1.88 -1.88 Skewness 0.97 0.97 0.97 0.94 Ranoe 2.00 1.61 1.61 1.82 Minimum' 7.00 6.00 6.00 5.79 Maximum 9.00 7.61 7.61 7.61 Sum ~ 46.00 39.22 39.22 38.77 Count :i, 6.00 6.00 6.00 6.00 Laraestl1\ 9.00 7.61 7.61 7.61 Smallest(1) 7.00 6.00 6.00 5.79
~onfi~~nce Level 95.0% 1.08 0.87 0.87 0.94
D. NETWORTH
IEC: Issued equity capital FR: Free reserves SR: Specific reserves
Table 5.3.20: Composition of Networth of LPL
Particulars 2003 2004 2005 2006 2007 2008 IEC 6 6 6 6 7.61 7.61
FR 10.61 11.23 12.41 13.43 18.92 20.86 SR 0 0 0.1 0.1 0.1 0.1
Total 16.61 17.23 18.51 19.53 26.63 28.57 Source: LPL Annual Reports and CMIE Prowess
In case of LPL free reserves were the major component of networth, forming
almost 65% of it for all the years under study, It maintained an average of Rs.
14.58 Crs, during the period under study.
T able 5.3.21: Com osition of Networth of LPL in percentaqe terms
Particulars 2003 2004 . 2005 2006:6: 2007 . 2008 lEe .. 36.12 34.82 32.41 30.72 28.58 26.64 FR 63.88 65.18 67.04 68.77 71.05 73.01
SR 0.00 0.00 0.54 0.51 0.38 0.35
400

Figure 5 3 6: Networth of LPL
25 1 ..,. 20 j I!'! : u 15 . c :. 10 " rP. '
5 •
o~-
2003 2004
NETWORTH
2005 2006
YEAR
Source: LPL Annual Reports and CMIE Prowess
T able 5.3.22: Descriolive Statistics of Networth of LPL Particulars IEC FR Mean 6.54 14.58 Standard Error 0.34 1.74 Median 6.00 12.92 Standard Deviation 0.83 4.27 Sample Variance 0.69 18.26 Kurtosis -1.88 -1.40 Skewness 0.97 0.84 Ranoe 1.61 10.25 Minimum 6.00 10.61 Maximum 7.61 20.86 Sum 39.22 87.46 Count 6.00 6.00 Laraestl11 7.61 20.86 Smallestlll 6.00 10.61 Confidence Level (95.0%1 0.87 4.48
E. Free Reserve
2007 2008
SR 0.07 0.02 0.10 0.05 0.00 -1.88
-0.97 0.10 0.00 0.10 0.40 6.00 0.10 0.00 0.05
SPR: Security premium reserves GRES: General Reserves
BPL: Balance from profit & loss account
Table 5.3.23: Composition of Free Reserve of LPL Particulars 2003 2004 2005 2006 2007 2008 SPR 8.5 8.5 8.58 9.33 13.27 13.27 GRES 0.96 1.21 1.31 1.41 1.56 1.81 BPL 1.15 1.52 2.52 2.69 409 5.78 Total 10.61 11.23 12.41 13.43 18.92 20.86
Source: LPL Annual Reports and CM IE Prowess
401

In case of LPL security premium reserves was the major component of free
reserve maintaining an average of Rs. 10.24 during the period under study.
Figure 5.3.7: Free Reserve of LPL
14 1 12 .
11 10 . o 8. c '" 6 ~ 4
2
FREE RESERVE
-----~ 0----=-__ ---- --__ ----__________ ------__ __
2003 2004 2005 2006 2007 2008
YEAR
1--SPR -- GRES - -BPL] Source: LPL Annual Reports and CMIE Prowess
Table 5.3.24: Composition of Free Reserve of LPL in percentaqe terms Particulars 2003 2004 2005 2006 2007 2008 SPR 80.11 75.69 69.14 69.47 70.14 63.61 GRES 9.05 10.77 10.56 10.50 8.25 8.68 BPL 10.84 13.54 20.31 20.03 21.62 27.71
Table 5.3.25: Descriotive Statistics of Free Reserve of LPL Particulars SPR GRES BPL Mean 10.24 1.38 2.96 Standard Error 0.97 0.12 0.70 Median 8.96 1.36 2.61 Standard Deviation 2.37 0.29 1.72 Samole Variance 5.60 0.09 2.97 Kurtosis ·1.90 0.17 0.11 Skewness 0.90 0.12 0.88 Ranoe 4.77 0.85 4.63 Minimum 8.50 0.96 1.15 Maximum 13.27 1.81 5.78 Sum 61.45 8.26 17.75 Count 6.00 6.00 6.00 Laraest(1 \ 13.27 1.81 5.78 Smallestc1l 8.50 0.96 1.15 Confidence Level (95.0%\ 2.48 0.31 1.81
402

F. Borrowings (Secured I Unsecured)
Table 5.3.26: Comoosition of Borrowinos (Secured / Unsecured) of LPL
Particulars 2003 2004 2005 2006 2007 2008 SB 6.15 6.2 5.41 6.19 8.48 8.95
USB 2.06 2.98 3.23 3.41 3.13 2.59
Total 8.21 9.18 8.64 9.6 11.61 11.54 Source: LPL Annual Reports and CMIE Prowess
Figure 5.3.8 Borrowings (Secured / Unsecured) of LPL
BORROWINGS
10 I
8 I ~ u 6 : ~
4 C
" -----~
0: 2 j 0
I
2003 2004 2005 2006 2007 2008
YEAR
Source: LPL Annual Reports and CMIE Prowess
In case of LPL 70% borrowings were secured and 30% borrowings were
unsecured. On an average secured borrowings were of Rs. 6.90 Crs. and
unsecured borrowings were of Rs. 2.90 Crs .
Table 5 . 3.27: Comoosition of Borrowinos (Secured / Unsecured) of LPL in oercentaqe ter ms
Particulars 2003 2004 2005 2006 2007 2008 SB 74.91 67.54 62.62 64.48 7304 77.56
USB 25.09 32.46 37.38 35.52 26.96 22.44
403
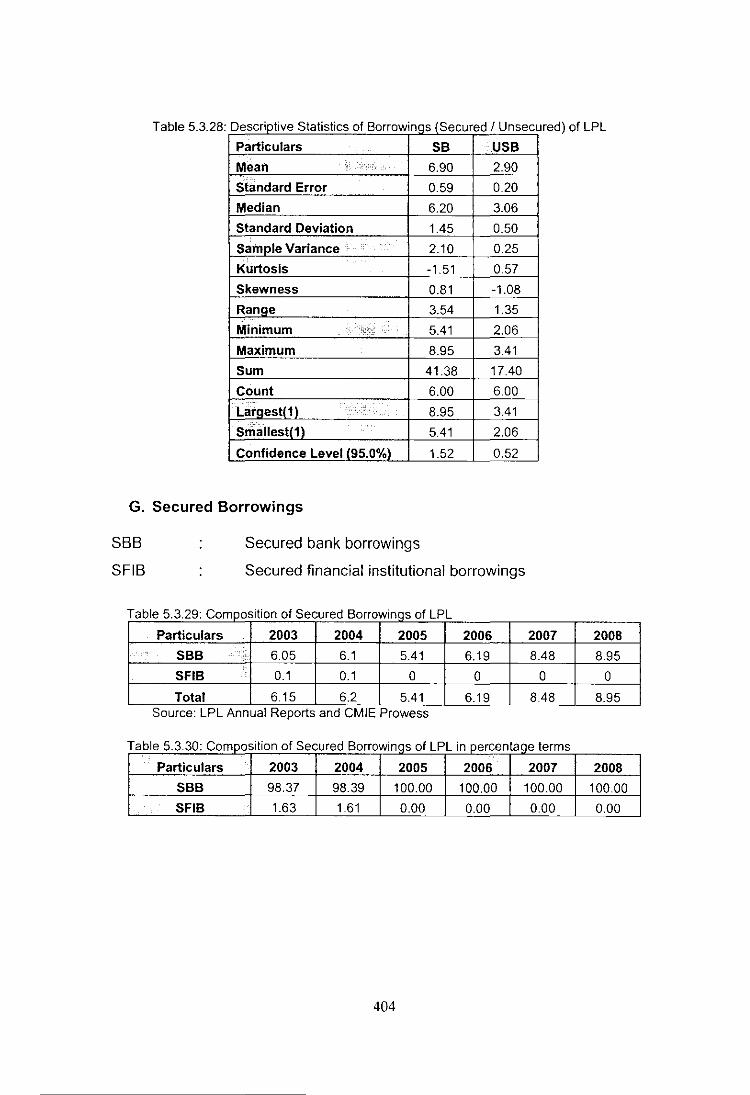
Table 5.3.28 : Descriptive Statistics of Borrowings (Secured I Unsecu red) of LPL
Particulars SB USB
Mean :». '. 6.90 2.90
Standard Error 0.59 0.20
Median 6.20 3.06
Standard Deviation 1.45 0.50
Sample Variance: ... : 2.10 0.25
Kurtosis -1.51 0.57
Skewness 0.81 -1.08
Range 3.54 1.35
Minimum ..::;:: 5.41 2.06
Maximum 8.95 3.41
Sum 41.38 17.40
Count 6.00 6.00
LarQest( 1)_ ' .. :>- ... 8.95 3.41
Smallest(1) 5.41 2.06
Confidence Level (95.0%) 1.52 0.52
G. Secured Borrowings
Secured bank borrowings SBB
SFIB Secured financial institutional borrowings
Table 5.3.29: Composition of Secured Borrowinqs of LPL
Particulars 2003 2004 2005 2006 2007 .' SBB .':: 6.05 6.1 5.41 6.19 8.48 .
SFIB 0.1 0.1 0 0 0
Total 6.15 6.2 5.41 6.19 8.48 Source: LPL Annual Reports and CMIE Prowess
Table 5.3.30: Composition of Secured Borrowinqs of LPL in percentaqe terms
Particulars 2003 2004 2005 2006 2007
SBB 98.37 98.39 100.00 100.00 100.00
SFIB : 1.63 1.61 0.00 0.00 0.00
404
2008
8.95
0
8.95
2008
100.00
0.00

Figure 5.3.9: Secured Borrowings of LPL
SECURED BORROWING
-----~ O~------r-----~------~------~------__ ------~
2003 2004 2005 2006 2007 2008
YEAR
1-- SBB -- SF'B !
Source: LPL Annual Reports and CMIE Prowess
Table 5. 3.31: Descriplive Statistics of Secured Borrowinqs of LPL
Particulars SBB SFIB
Mean 6.86 0.03
Standard Error 0.60 0.02
Median 6.15 0.00
Standard Deviation 1.47 0.05
Sample Variance 2.16 0.00
Kurtosis -1.54 -1.88
Skewness 0.85 0.97
Range 3.54 0.10
Minimum 5.41 0.00
Maximum 8.95 0.10
Sum 41.18 0.20
Count 6.00 6.00
Largest(1) 8.95 0.10
Smallest(1 ) 5.41 0.00
Confidence Level (95.0%) 1.54 0.05
H. Unsecured Borrowings
DC: Deferred credit ICL: Inter Corporate Loan
OUB: Other unsecured borrowings
405

T bl 5332 C a e omposllon 0 fU nsecure dB orrowlngs 0 fLPL
Particulars 2003 2004 2005 2006 2007 2008 DC 1.61 2.03 2.54 2.81 2.35 1.89
ICL 0 0.52 0.5 0.6 0.78 0.7
OUB 0.45 0.43 0.19 0 0 0
Total 206 2.98 3.23 3.41 3.13 2.59 Source: LPL Annual Reports and CMIE Prowess
Figure 5.3.10: Unsecured Borrowings of LPL
UNSECURED BORROWINGS
-, 2~ 1 5 21
: :l L--~---~~----===--~--~~===-~------~-------. --2003 2004 2005 2006 2007 2008
YEAR
I-DC -ICL DUB I
Source: LPL Annual Reports and CMIE Prowess
Table 5.3.33: Composition of Unsecured Borrowinqs of LPL in percentaqe terms
Particulars 2003 2004 2005 2006 2007 2008 DC 78.16 68.12 78.64 82.40 75.08 72.97
ICL 0.00 17.45 15.48 17.60 24.92 2703
OUB 21.84 14.43 5.88 0.00 0.00 0.00
406

Table 5.3.34:
6.00 6.00 6.00
2.81 0.78 0.45
1.61 0.00 0.00
0.47 0.29
2.21 0.52 0.18
I. Borrowings (Sources)
BFIB : Bank/Fin. Inst. Borrowings BCB: Borrowings from corporate bodies
OB : Other borrowings
Ta ble 5.3.36: ComDosition of Borrowinas (Sources) of LPL in Dercenta e terms
:iParticulars ••••
bill>;,," li!I!2003 200!fJW. Im'!2005 20~~ 2007 : ~\)k
iBFIB :: 48.51 5.15 146.30 81.25 113.93 -671.43
iBCa ! .. 0.00 53.61 3.70 10.42 8.96 114.29 I·:
:; OB 51.49 41.24 -50.00 8.33 -22.89 657.14
407
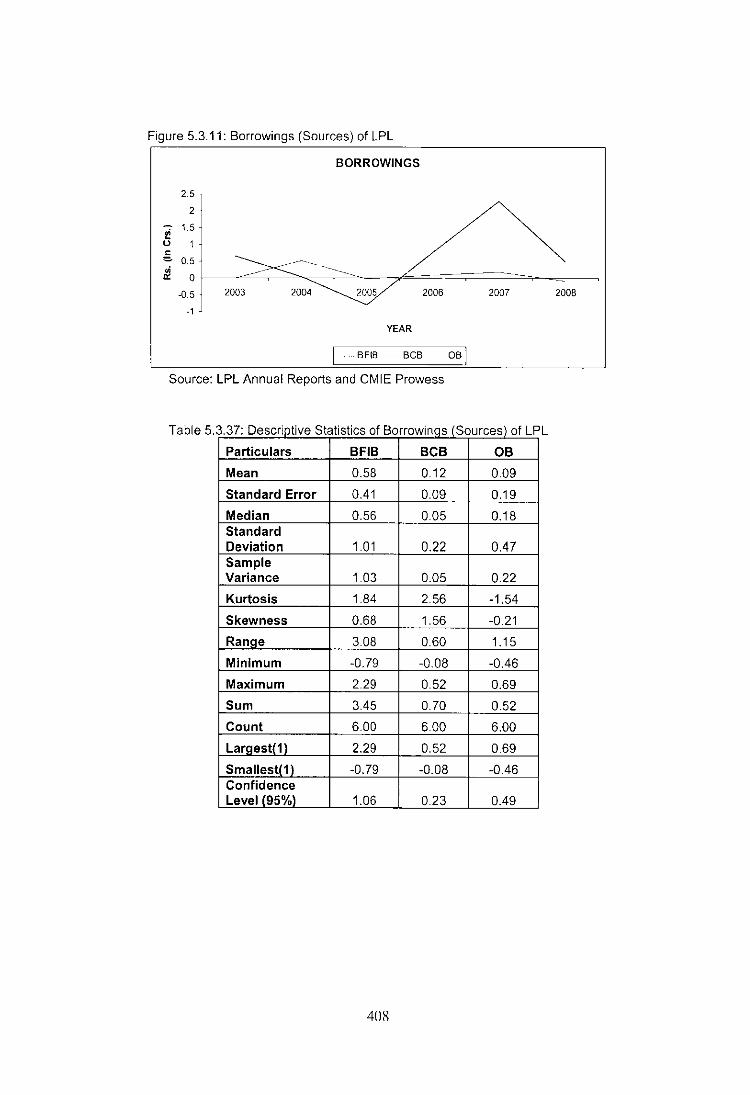
Figure 5.3.11: Borrowings (Sources) of LPL
BORROWINGS
25
2
~ 1.5
0 c
'"" 0.5 • -----.~-
'" 0
-0.5 2003 2004 2005 2006 2007 2008
-1
YEAR
I-BFIB -BCB OB]
Source: LPL Annual Reports and CMIE Prowess
Table 5. 3.37: Descriptive Statistics of Borrowinos (Sources) of LP L
Particulars BFIB BCB OB
Mean 0.58 0.12 0.09
Standard Error 0.41 0.09 0.19
Median 0.56 0.05 0.1B Standard Deviation 1.01 0.22 0.47 Sample Variance 1.03 0.05 0.22
Kurtosis 1.B4 2.56 -1.54
Skewness 0.68 1.56 -0.21
Range 3.08 0.60 1.15
Minimum -0.79 -O.OB -0.46
Maximum 2.29 0.52 0.69
Sum 3.45 0.70 0.52
Count 6.00 6.00 6.00
Lar~est{1 ) 2.29 0.52 0.69
Smallest(1) -0.79 -O.OB -0.46 Confidence Level (95%) 1.06 0.23 0.49
408
5.3.3: Determinants of Capital Structure
Dependent Variable:
DER Debt Equity Ratio
Independent Variable:
A. Size Ln Total Assets)
B. GFATA Gross Fixed AssetslTotal Assets
C. NWCGW Net Working Capital/Gross Working Capital
409
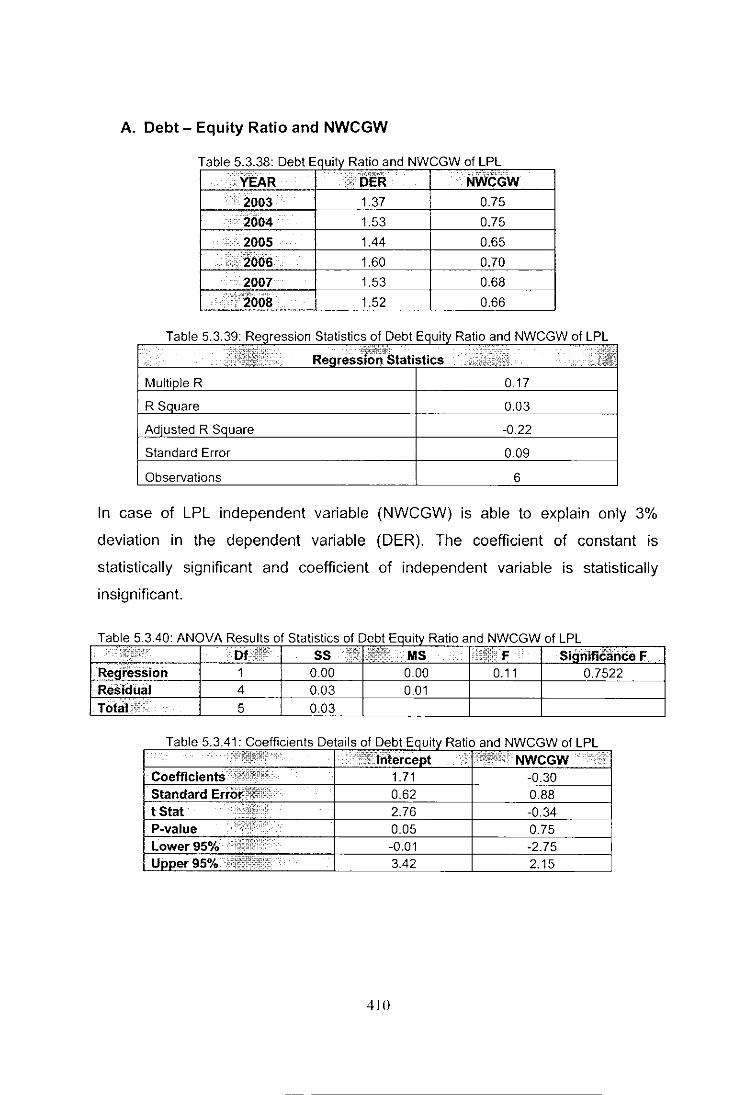
A. Debt - Equity Ratio and NWCGW
Table 5.3.38: Debt Equity Ratio and NWCGW of LPL "'~''''''' . .:,:!DER NWCGW : YEAR
······2003 1.37 0.75
2004 1.53 0.75
·2005 1.44 0.65 ... ,./:2006 1.60 0.70
:2007 . 1.53 0.68 '",/,Hi, __ '"",
::;:2008 1.52 0.66
Table 5.3.39: Statistics of Debt
0.17
In case of LPL independent variable (NWCGW) is able to explain only 3%
deviation in the dependent variable (DER). The coefficient of constant is
statistically significant and coefficient of independent variable is statistically
insignificant.
a e T bl 5340 ANOVA R esu ts 0 fS tatlstlcs 0 fD E ebt eqUity Ratio and NWCGW of LPL hit:::: ;-' Df~~~' SS .• ~:ft I~:MS ... "Tn,!"' 1': Significance 1'.
Regression 1 0.00 0.00 0.11 0.7522 Residual 4 0.03 0.01 Tolal;~::: 5 0.03
Ratio and NWCGW of LPL
410
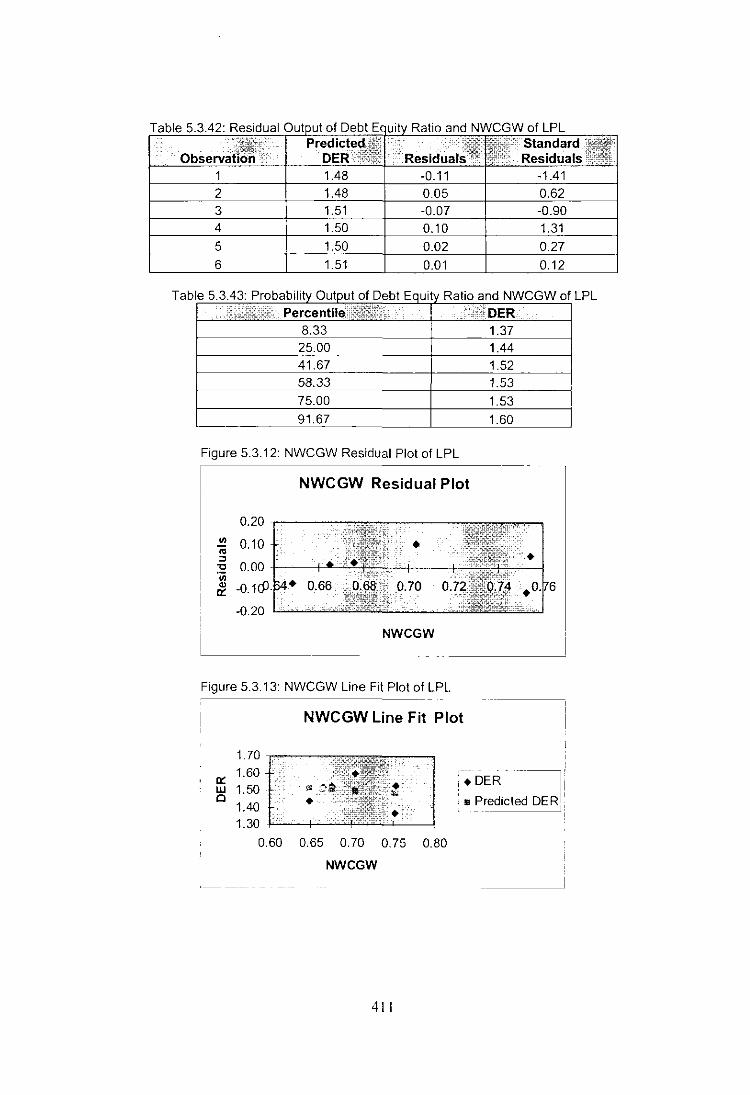
Tab Ie 5.3.43: Probability o utput a f Debt Equity Ratio and NWCGW of .. Percentil~::~~~~.: '. d.:':rr. DER 8.33 1.37 25.00 1.44 41.67 1.52 58.33 1.53 75.00 1.53 91.67 1.60
Figure 5.3.12: NWCGW Residual Plot of LPL
NWCGW Residual Plot
II) • ~ :0 "C 'iii Q) O. 0::
NWCGW
Figure 5.3.13: NWCGW Line Fit Plot of LPL
NWCGW Line Fit Plot
1.70 """'""-_-0:: 1.60 w 1.50 c
1.40 1.30 ./-'--+'_""""'"
0.60 0.65 0.70 0.75 0.80
NWCGW
411
-~DER---I
• Predicted DE R:
LPL
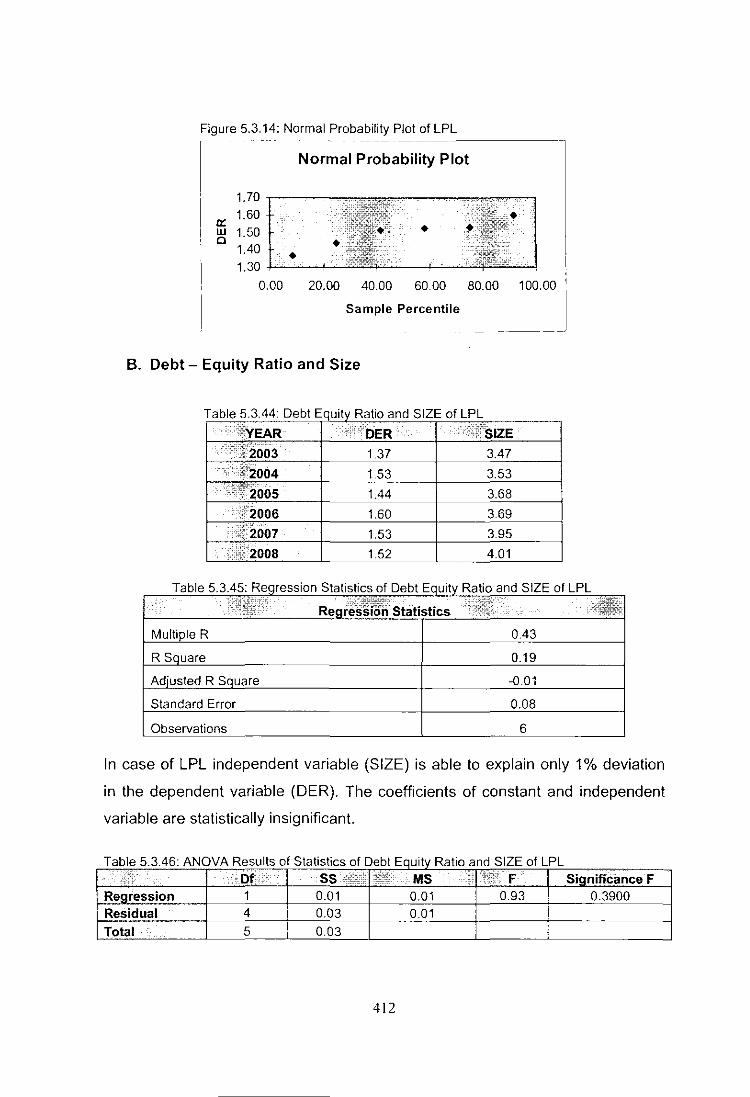
Figure 5.3.14: Normal Probability Plot of LPL -----
Normal Probability Plot
1.70
• a: 1.60 w 0
1.40 1.30
0.00 20.00 40.00 60.00
Sample Percentile
B. Debt - Equity Ratio and Size
Table 5.3.44: Debt Equity Ratio and SIZE of LPL
""~"2003 1.37 3.47
. '~·2004 1.53 3.53
~T2005 1 A4 3.68 .~i2006 1.60 3.69 " -"y'," \~2007 1.53 3.95
j.iW2008 1.52 4.01
0.43
0.19
-0.01
Standard Error 0.08
Observations 6
In case of LPL independent variable (SIZE) is able to explain only 1% deviation
in the dependent variable (DER). The coefficients of constant and independent
variable are statistically insignificant.
Table 5.3.46: ANOVA Results 0 1 S tatistics of Debt Equity Ratio and SIZE 01 LPL r,i ,.Of.:'; . SS MS :: I~i~i F Significance F
Regression 1 0.01 0.01 0.93 0.3900 Residual 4 0.03 0.01
Total· '. 5 0.03
412

Table 5.3.47: Coefficients Details of Debt Equity Ratio and SIZE of LPL ..... ""i'if': "1 ,~i~l~: Intercept i; iil,ii:': SIZE :i::~~
Coefficients ,.i:·if 0.90 0.16 Standard Error' 0.62 0.17 t Stat . "":'.ii:· '. 1.46 0.96 P-value .... :: . 0.22 0.39 Lower 95% ':j".:; -0.82 -0.30 Upper 95%":':ij:Jj:::C· .
2.62 0.62
Table 5.3.48: Residual Output of Debt Equity Ratio and SIZE of LPL : ::iip; :s- Predicted:!!: ,l: i.x Standard~ . ObservatiBIi.:.:· . DER;t:~M: Residuals "iW: Residuals
1 1.46 -0.09 -1.20 2 1.47 0.06 0.88 3 1.49 -0.05 -0.68 4 1.49 0.11 1.48 5 1.53 -0.01 -0.11
6 1.54 -0.03 -0.36
Figure 5.3.15: Size Residual Plot of LPL
SIZE Residual Plot
0.20
'" '" 0.10 ::l "C 'iii 0.00 '" 0:: o
-0.10
SIZE ______ .. _ .... ___ ..J
413
- -- --- ---------
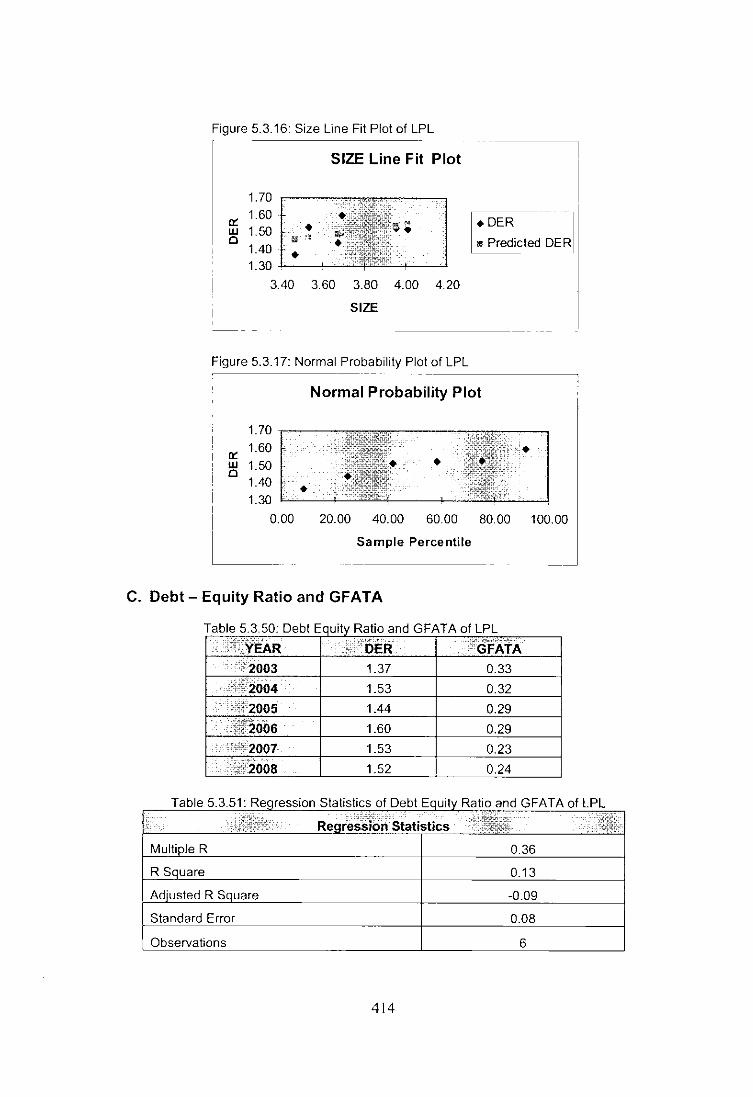
Figure 5.3.16: Size Line Fit Plot of LPL
SIZE Line Fit Plot
1.70
• DER - -I • Predicted DE R
0:: 1.60
w 1.50 • 0 ~ ' ..
1.40 • 1.30
3.40 3.60 3.80 4.00 4.20
SIZE
Figure 5.3.17: Normal Probability Plot of LPL -------~
Normal Probability Plot
1.70
0:: 1.60
w 1.50 0
1.40 • 1.30
0.00 20.00 40.00 60.00 80.00 100.00
L __ Sample Percentile
c. Debt - Equity Ratio and GFATA
Table 5.3.50: Debt Equity Ratio and GFATA of LPL
:;'2003 1.37 0.33
1.53 0.32
1.44 0.29
1.60 0.29
I :?':12007 1.53 0.23 I ..... l:~:?2008 1.52 0.24
Table 5.3.51:
R 0.36
R
Standard Error
Observations 6
414

In case of LPL independent variable (GFATA) is able to explain only 9%
deviation in the dependent variable (DER). The coefficient of constant is
statistically significant and coefficient of independent variable is statistically
insignificant.
Table 5.3.52: ANOVA
Table 5.3.54: Residual
T able 5.3.55: Probability o utput of Debt Equity Ratio and GFATA ofLPL . Percentile.,c, 'j!!!:.:",: '.' · .. ::tOER
8.33 1.37 25.00 1.44 41.67 1.52 58.33 1.53 75.00 1.53 91.67 1.60
415
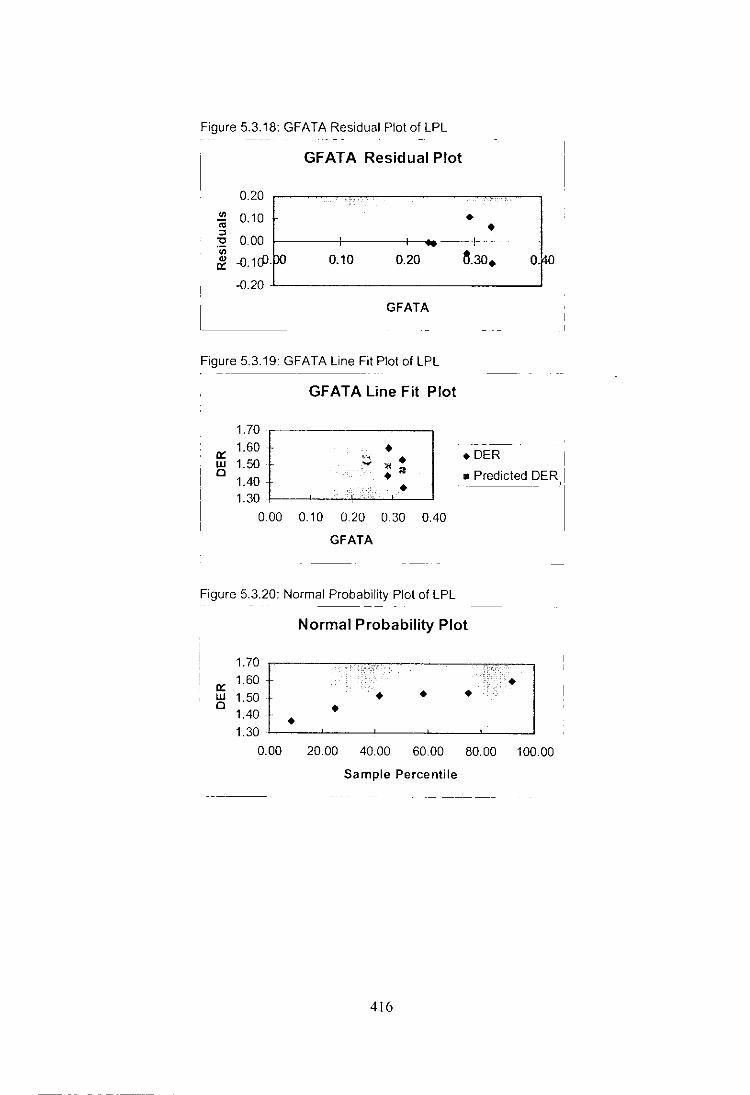
Figure 5.3.18: GFATA Residual Plot of LPL
GFATA Residual Plot
0.20
'" 0.10 -;;
" 0.00 "C .. . ;;; -0.1cP· po 0.10 0.20 '" ex: -0.20
GFATA
Figure 5.3.19: GFATA Line Fit Plot of LPL
ex: 1.60 .
w 1.50" Cl
1.40
GFATA Line Fit Plot
• •
1.70 j""
1.30 I---'----'...:.:.fl-"-'''--'--..J
0.00 0.10 0.20 0.30 0.40
GFATA
Figure 5.3.20: Normal Probability Plot of LPL
•
• • a.30. O.~O
.DER
• Predicted DER,
Normal Probability Plot
1.70 j ex: 1.60 w 1.50"
Cl 1.40. • 1.30 L-_---'-__ -'-__ ....... __ +--_......l
• • • • • 0.00 20.00 40.00 60.00 80.00 100.00
Sample Percentile
416

Dependent Variable:
DER Debt Equity Ratio
Independent Variable:
A. Size Ln Total Assets)
B. LRD Ln (R&D Expenditure)
C. GFATA Gross Fixed AssetslTotal Assets
D. NWCGW Net Working Capital/Gross Working Capital
Table 5.3.56: Dependent and Independent Variables
417
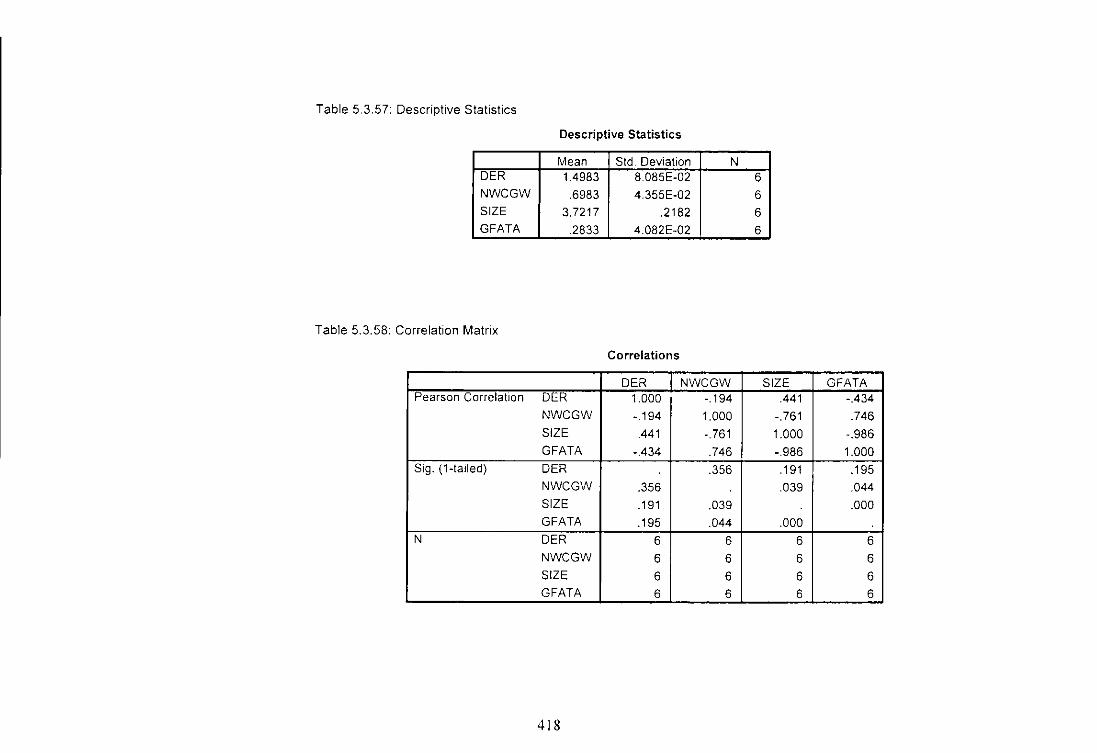
Table 5.3.57: Descriptive Statistics
Descriptive Statistics
Mean Std. Deviation N DER 1.4983 8.085E-02 6 NWCGW .6983 4.355E-02 6 SIZE 3.7217 .2182 6 GFATA .2833 4.082E-02 6
Table 5.3.58: Correlation Matrix
Correlations
DER NWCGW SIZE GFATA Pearson Correlation DER 1.000 -.194 .441 -.434
NWCGW -.194 1.000 -.761 .746 SIZE .441 -.761 1.000 -.986 GFATA -.434 .746 -.986 1.000
Sig. (1-talled) DER .356 .191 .195 NWCGW .356 .039 .044 SIZE .191 .039 .000 GFATA .195 .044 .000
N DER 6 6 6 6 NWCGW 6 6 6 6 SIZE 6 6 6 6 GFATA 6 6 6 6
418

Table 5.3.59: Variables Entered and Removed
Variables Entered/Removed'
Variables Variables Model Entered Removed 1 GFATA,
Method
NWC"GW, Enter SIZE
a. All requested variables entered.
b. Dependent Variable: DER
Table 5.3.60: Model Summary
Model Summary
Change Statistics
Adjusted Std. Error of R Square Model R R Square R Square the Estimate Change F Change df1 df2 1 .493a .243 -.893 .1112 .243 .214 3
a. Predictors: (Constant), GFATA, NWCGW, SIZE
b. Dependent Variable: DER
419
Durbin-W Sig. F Change atson
2 .880 2.270

Table 5.3.61: ANOVA Results
ANOVAb
Sum of Model Squares df Mean Square F Sig. 1 Regression 7.935E-03 3 2.645E-03 .214 .880a
Residual 2.475E-02 2 1.237E-02 Total 3.268E-02 5
- ---
a. Predictors: (Constant), GFATA, NWCGW, SIZE
b. Dependent Variable: DER
Table 5.3.62: Coefficients
Coefficien~
Standardi zed
Unstandardized Coefficien Coefficients ts % Confidence Interval for Correlations Collinearit Statistics
Model B Std. Error Beta t Sig. ower Bound Jpper Bound Zero-order Partial Part Tolerance VIF 1 (Constant ~49E-02 7.663 -.011 .992 -33.056 32.886
NWCGW .629 1.764 .339 .357 .756 -6.962 8.220 -.194 .244 .219 419 2.385
SIZE .293 1422 .792 .206 .856 -5.826 6413 441 .144 .127 .026 38.921
'----- -GFATA .185 7402 .094 .025 .982 -31.661 32.032 -434 .018 .015 .027 36.894
a. Dependent Variable: DER
420
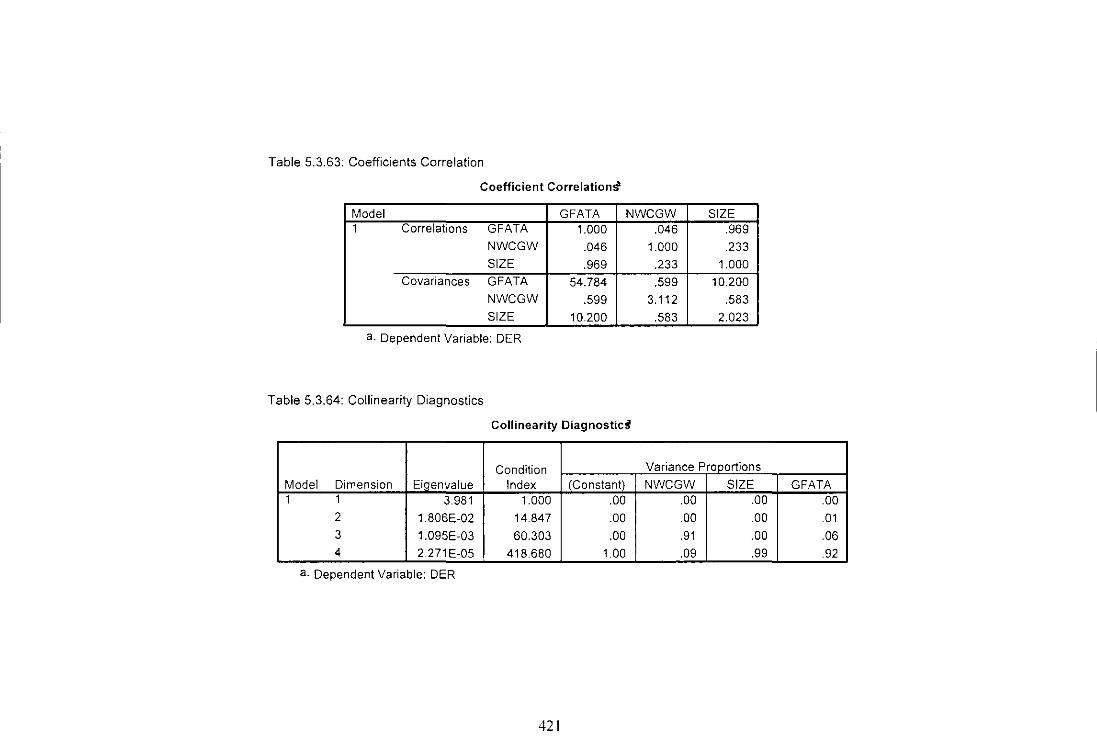
Table 5.3.63: Coefficients Correlation
Coefficient Correlationoi
Model GFATA NWCGW SIZE 1 Correlations GFATA 1.000 .046 .969
NWCGW .046 1.000 .233 SIZE .969 .233 1.000
Covariances GFATA 54.784 .599 10.200 NWCGW .599 3.112 .583 SIZE 10.200 .583 2.023
a. Dependent Variable: DER
Table 5.3.64: Collinearity Diagnostics
Collinearity Diagnostics
Condition Variance Proportions
Model Dimension Eigenvalue Index (Constant) NWCGW SIZE GFATA 1 1 3.981 1.000 .00 .00 .00 .00
2 1806E-02 14.847 .00 .00 .00 .01 3 1.095E-03 60.303 .00 .91 .00 .06 4 2.271 E-05 418.680 1.00 .09 .99 .92
a. Dependent Variable: DER
421

Table 5.3.65: Residual Statistics
Residuals StatisticS'
Minimum Maximum Mean Std. Deviation N Predicted Value 1.4570 1.5507 1.4983 3.984E-02 6
Std. Predicted Value -1.039 1.316 .000 1.000 6
Standard Error of 4.668E-02 .1107 8.772E-02 2.580E-02 6 Predicted Value
Adjusted Predicted Value 1.4402 3.0006 1.9096 .6199 6
Residual -9.57E-02 .1087 7.401E-17 7.035E-02 6
Std. Residual -.860 .977 .000 .632 6 Stud. Residual -1.385 1.076 -.465 1.054 6
Deleted Residual -1.4706 .1319 -.4113 .6119 6 Stud. Deleted Residual -4.862 1.173 -1.237 2.163 6 Mahal. Distance .047 4.119 2.500 1.707 6 Cook's Distance .062 43.281 9.437 17.173 6 Centered Leverage Value .009 .824 .500 .341 6
a. Dependent Variable: DER
422

Charts Figure 5.3.21: Histogram
>-" c: Q) ::J C" ~ LL
Histogram
Dependent Variable: DER 2.5 ~---------------,
2.0
1.5
1.0
.5
0.0
Std. Dev = .63
Mean = 0.00 .I-__ .... __ ...L. __ ..J ___ ol.. __ "j N = 6.00
-1.00 -.50 0.00 .50 1.00
Regression Standardized Residual
Figure 5.3.22: Normal pop Plot of Regression Standardized Residual
Dependent Variable: DER 1.00
Expected C c
75
.50 c
c
25
c
0,00
0.00 .25 50 .75 1.00
Observed Cum Prob
423

Figure 5.3.23: Scatterplot
Dependent Variable: DER 1.7~------------------~
1.6 "
" " " 1.5
" 1.4
" DER
1.3
-1.5 -10 -.5 0.0 .5 1.0 1.5
Regression Standardized Predicted Value
Figure 5.3.24: Scatterplot
Dependent Variable: DER 1.7.------------------~
1.6 "
" " 1.5
1.4
DER
1.3+:-____ ---_---~----_--___l -1.0 -.5 0,0 .5 1.0 1.5
Regression Standardized Residual
424

Figure 5.3.25: Scatterplot
Dependent Variable: DER 1.7,------------------,
1.6
1.5
1.4
DER
1.3.f:------:r::-------.;:------:::c:-----i -1.5 -1.0 -.5 0,0 .5
Regression Deleted (Press) Residual
Figure 5.3.26: Scatterplot
Dependent Variable: DER 1.7,---------------------,
1.6 a
1.5
DER
1.31,---,..-:-_-:...,-_-:-_=_-".-,_-:-_--::'":_--::'::---:1 1 A 1.6 1.8 2.0 2.2 2.4 2.6 2.8 3.0 3.2
Regression Adjusted (Press) Predicted Value
425

Figure 5.3.27: Scatterpiot
Dependent Variable: DER 1.7,----------------------,
DER
DER
1.6
1.5
1.4
, ,
1.3 :I-::----,.-:-----.::----:-':"-----c----,.:,-----4 -1.5 -1.0 -.5 0.0 .5 1.0 1.5
Regression Studentized Residual
Figure 5.3.28: Scatterpiot
Dependent Variable: DER 1.7,----------------------,
1.6 ,
, , 1.5
1.4
1.3 ·5 ·4 ·3 ·2 ·1 0 2
Regression Studentized Deleted (Press) Residual
In case of LPL all the three independent variables (SIZE, GFATA, and NWCGW)
are able to explain about 89.3% deviation in the dependent variable (DER). The
coefficients of constant and all the independent variables are statistically
insignificant.
426


