Chapter 5 Helical and Phased Antennas Plasma production using a helical antenna launching an mode was reported by Komori et al [72]. This is at odds with the results of the previous chapter in which no significant mode was observed under any conditions using the double saddle coil antenna even though the antenna was capable of exciting this mode. To account for this discrepancy and to potentially study the mode a helical antenna was constructed for use on Basil. Measurements of wave properties on both sides of the antenna were made by reversing the direction of the applied magnetic field. Measurement were made predominately using argon, however measurements were also taken with helium, neon, and krypton. As there was no success in launching the mode with a helical antenna a phased double saddle coil antenna was constructed in the hope of launching other modes without the presence of the dominant mode. The phased antenna is made from two double saddle antennas rotated with respect to each other and driven indepen- dently. Attempts were made both to produce a plasma, and to maintain a pre-formed 102
Transcript
Chapter 5
Helical and Phased Antennas
Plasma production using a helical antenna launching an mode was reported
by Komori et al [72]. This is at odds with the results of the previous chapter in which no
significant mode was observed under any conditions using the double saddle coil
antenna even though the antenna was capable of exciting this mode. To account for this
discrepancy and to potentially study the mode a helical antenna was constructed
for use on Basil. Measurements of wave properties on both sides of the antenna were
made by reversing the direction of the applied magnetic field. Measurement were made
predominately using argon, however measurements were also taken with helium, neon,
and krypton.
As there was no success in launching the mode with a helical antenna a
phased double saddle coil antenna was constructed in the hope of launching other modes
without the presence of the dominant mode. The phased antenna is made from
two double saddle antennas rotated with respect to each other and driven indepen-
dently. Attempts were made both to produce a plasma, and to maintain a pre-formed
102
plasma. Waves were also launched at low power levels into a pre-formed plasma.
5.1 Helical Antenna Current Density
To calculate the current density of the helical antenna a simplified geometry was assumed
with infinitely thin wire and a single complete loop around the tube at either end to com-
plete the circuit. Thus the generalised antenna model used to calculate the current density
consists of two helical windings, each making one rotation in a distance and displaced
by . The total length of the antenna is , and the radius of the antenna is . This is
the simplified antenna configuration employed by the numerical model [68] when making
a comparison with the experimental results in section 5.2. With the origin in the middle
of the antenna the component of the current density can be written as
(5.1)
where , , and is defined by equation 4.2.
Equation 5.1 can be Fourier transformed into the more useful coordinates of the az-
imuthal mode number , and the wave number .
(5.2)
103
This has the property
(5.3)
When the parallel wave number is close to the peak in the current density spectrum,
the azimuthal wave number is predominately . This antenna has positive helicity,
in the positive direction is dominant, while in the negative direction
is predominant. The dominance of in the positive direction is shown
in figure 5.1(b). Figure 5.1(a) shows how the spectra becomes more selective as the
length of the antenna is increased. The total length of the antenna used for Basil was
0.27m, where 0.18m.
5.2 Helical Antenna Wave Dispersion
and Radiation Resistance
A helical antenna was constructed in the hope of producing plasma with the
azimuthal mode. It would be expected that if a plasma were produced in the
direction that the wave mode responsible for the plasma production would be .
It was immediately clear from the light emission that the helical antenna only produced
plasma in the direction of positive azimuthal modes.
Measurements in both directions of the wave were taken by reversing the direction
of the static magnetic field. Azimuthal magnetic wavefield measurements confirmed that
the mode in the direction of strong plasma was . The plasma extended a short
104
Figure 5.1: The current density spectrum of the simple helical antenna, 0.0225 m,0.18 m. (a) Axial spectra for azimuthal mode number for different antenna
lengths, , (dotted), (solid), (dashed), and(dot-dash). (b) Azimuthal mode number spectra for parallel wave number 35 m , and
.
105
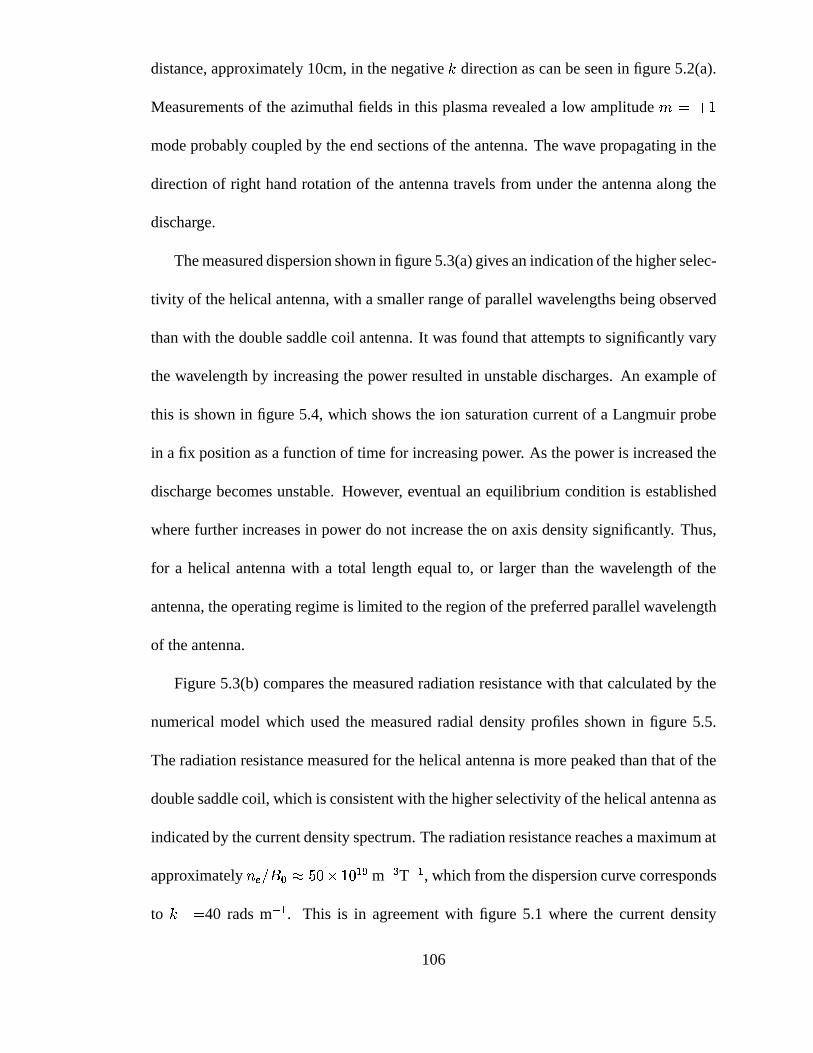
distance, approximately 10cm, in the negative direction as can be seen in figure 5.2(a).
Measurements of the azimuthal fields in this plasma revealed a low amplitude
mode probably coupled by the end sections of the antenna. The wave propagating in the
direction of right hand rotation of the antenna travels from under the antenna along the
discharge.
The measured dispersion shown in figure 5.3(a) gives an indication of the higher selec-
tivity of the helical antenna, with a smaller range of parallel wavelengths being observed
than with the double saddle coil antenna. It was found that attempts to significantly vary
the wavelength by increasing the power resulted in unstable discharges. An example of
this is shown in figure 5.4, which shows the ion saturation current of a Langmuir probe
in a fix position as a function of time for increasing power. As the power is increased the
discharge becomes unstable. However, eventual an equilibrium condition is established
where further increases in power do not increase the on axis density significantly. Thus,
for a helical antenna with a total length equal to, or larger than the wavelength of the
antenna, the operating regime is limited to the region of the preferred parallel wavelength
of the antenna.
Figure 5.3(b) compares the measured radiation resistance with that calculated by the
numerical model which used the measured radial density profiles shown in figure 5.5.
The radiation resistance measured for the helical antenna is more peaked than that of the
double saddle coil, which is consistent with the higher selectivity of the helical antenna as
indicated by the current density spectrum. The radiation resistance reaches a maximum at
approximately m T , which from the dispersion curve corresponds
to 40 rads m . This is in agreement with figure 5.1 where the current density
106
Figure 5.2: Longitudinal measurements of (a) electron density (b) and temperature onaxis (c) axial magnetic wavefield amplitudes and (c) phase and (d) 3 azimuthal magneticwavefield amplitudes and (e) phase 30msec into an Argon discharge with a helical antennaat a static field of 960 Gauss and filling pressure of 30mTorr. The position of the antennais indicated by the vertical dashed lines and the end of the static field coils by the solidline.
107
Figure 5.3: Comparison of measured and calculated dispersion and radiation resistanceof the helicon wave launched by the helical antenna in argon.
108
0.000
0.005
0.010
0.015
0.020
0.025
Power=
0.80kW
1.0kW
1.4kW
1.8kW
010
2030
0.000
0.005
0.010
0.015
0.020
Ion Saturation Current (amps)
2.3kW
010
2030
2.9kWTim
e (msec)
010
2030
4.0kW
010
2030
40
5.1kW
Figure 5.4: Power scan with a helical antenna, =576 Gauss, pressure=30 mTorr.
109
spectrum reaches a maximum at approximately the same value. It also agrees with the
numerical model which also reaches a maximum at approximately the same value.
It is noticeable that the radiation resistance of the helical antenna is much higher than
the double saddle coil antenna. However there is a significant discrepancy between the
measured and calculated radiation resistance for the higher values of . As discussed
in section 4.6 the results from the numerical model can be strongly influenced by system-
atic errors in the density profiles. This is especially the case with the helical antenna which
has a higher selectivity of parallel wavelength. However, Kamenski demonstrated that by
altering the maximum in the density profiles only slightly higher radiation resistances
could be obtained, which are not as high as the experimental results. The peak value of
the radiation resistance for the helical antenna is 4 times higher than for the double saddle
coil antenna. Below the peak the radiation resistance drops off sharply, consistent with the
current density spectrum and is in reasonable agreement with the model. Above the peak
there appears a systematic discrepancy between the measured and model results which is
not presently understood.
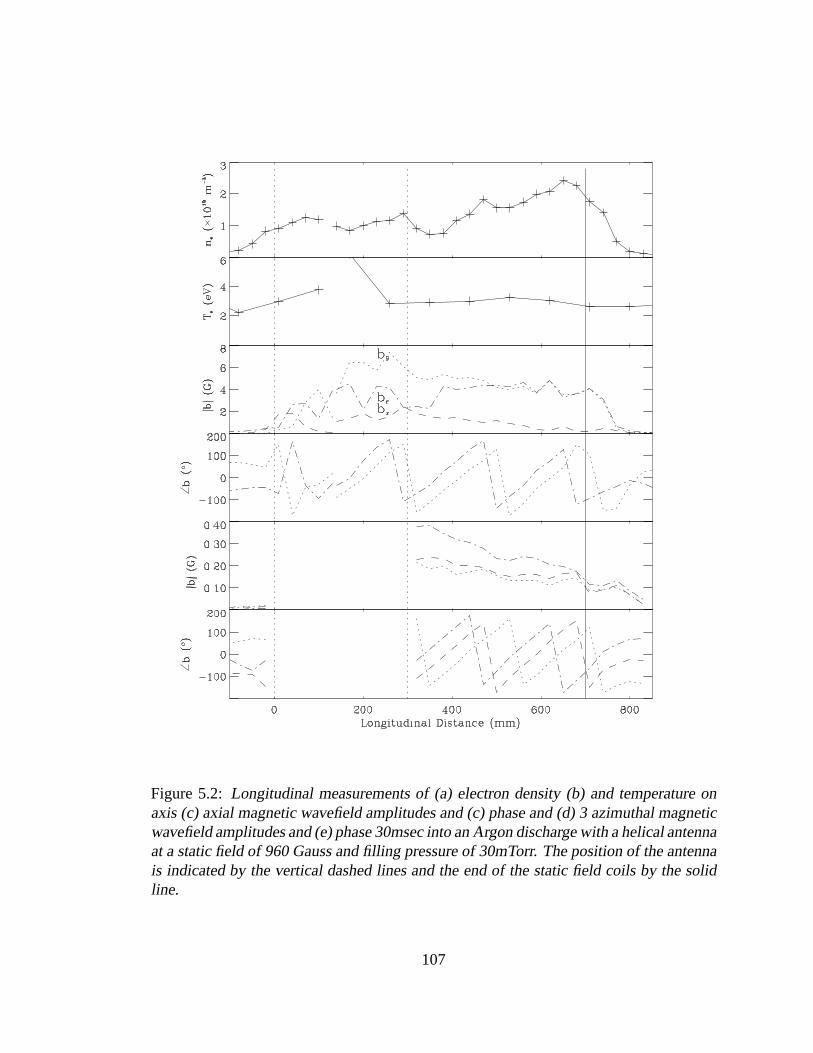
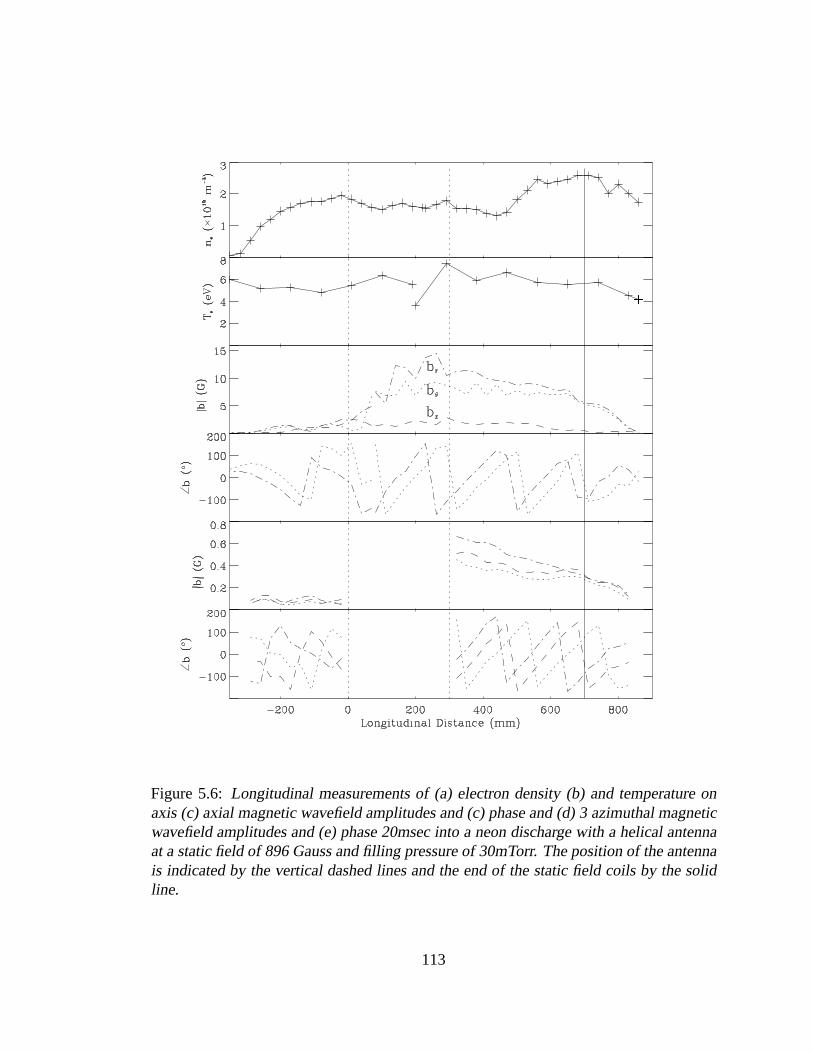
In figure 5.2, and figures 5.6, and 5.7, which show longitudinal measurements for
neon and krypton, it is clear that the plasma extends in the direction of left hand rotation of
the antenna beyond the region of power deposition by the wave. This is due to ionisation
by electrons travelling from the region of power deposition. As expected the distance the
plasma extends in this direction is strongly dependent on the gas, with the collision cross
section, and thus the mean free path of the electrons being a function of the gas type and
filling pressure. In an measurement at similar conditions to those in figure 5.2, but with
a filling pressure of 13mTorr, the plasma extended 35cm past the antenna compared to
110
Figure 5.5: Radial density profiles of Argon plasmas produced with a helical antenna asa function of applied field.
111
10cm as in the figure, demonstrating the dependence on pressure. Also noticeable in the
axial density profiles is the peak in the density near the end of the discharge where the
plasma reaches the end of the field. This is believed to be due to depletion of neutrals
along the length of the discharge and supply of neutrals from the end of the tube and will
be studied in detail in chapter 6.
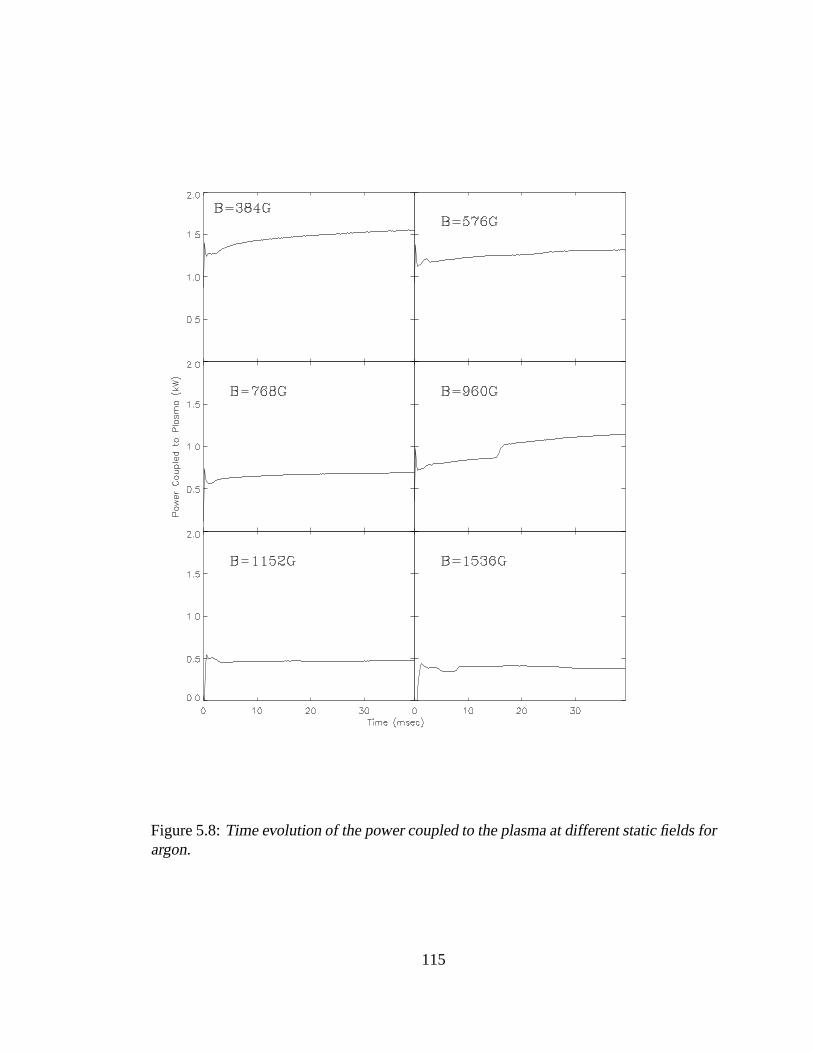
By comparing the radial density profiles obtained with the helical antenna (see fig-
ure 5.5 and those obtained with the double saddle coil antenna (see figure 4.14) it can be
seen that the densities obtained in both cases are similar in magnitude. However, compar-
ing the corresponding plots of power coupled to the plasma for the helical antenna profiles
(see figure 5.8) and double saddle coil antenna profiles (see figure 4.4) it is clear that the
power required to produce discharges of similar densities was much lower for the helical
antenna. This is not surprising, as with only half the plasma, the plasma losses have also
been halved. Thus if a plasma on only one side of the antenna is sufficient the helical
antenna is far more efficient, but has a less flexible operating regime.
5.3 Phased Antenna
An important objective in helicon wave research is to have a sufficient understanding of
the antenna-wave coupling, and the resultant plasma, that a system could be designed to
produce a desired plasma. It has been suggested by previous research [34] that different
density profiles are a result of different wave modes. Perhaps one method of obtaining a
desired plasma, with for example a flat density profile, is to control the modes producing
the plasma. To test this idea an antenna was constructed with two double saddle coil
112
Figure 5.6: Longitudinal measurements of (a) electron density (b) and temperature onaxis (c) axial magnetic wavefield amplitudes and (c) phase and (d) 3 azimuthal magneticwavefield amplitudes and (e) phase 20msec into a neon discharge with a helical antennaat a static field of 896 Gauss and filling pressure of 30mTorr. The position of the antennais indicated by the vertical dashed lines and the end of the static field coils by the solidline.
113
Figure 5.7: Longitudinal measurements of (a) electron density (b) and temperature onaxis (c) axial magnetic wavefield amplitudes and (c) phase and (d) 3 azimuthal magneticwavefield amplitudes and (e) phase 30msec into a krypton discharge with a helical antennaat a static field of 768 Gauss and filling pressure of 50mTorr. The position of the antennais indicated by the vertical dashed lines and the end of the static field coils by the solidline.
114
Figure 5.8: Time evolution of the power coupled to the plasma at different static fields forargon.
115
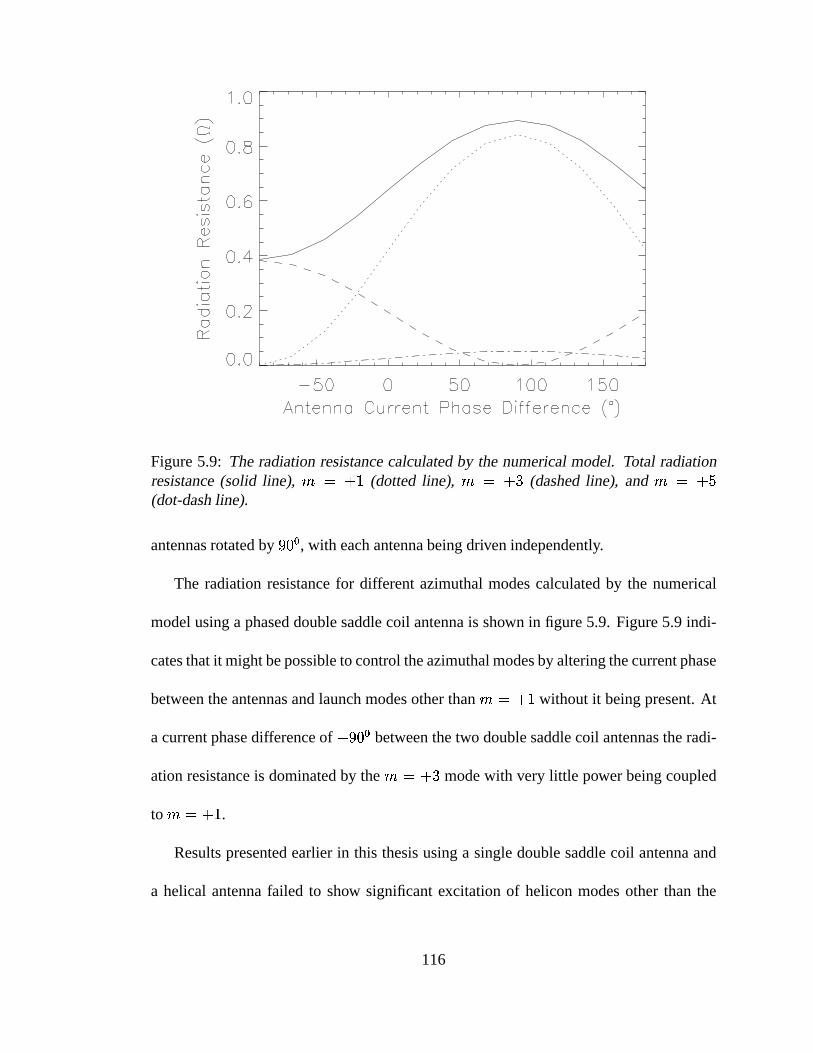
Figure 5.9: The radiation resistance calculated by the numerical model. Total radiationresistance (solid line), (dotted line), (dashed line), and(dot-dash line).
antennas rotated by , with each antenna being driven independently.
The radiation resistance for different azimuthal modes calculated by the numerical
model using a phased double saddle coil antenna is shown in figure 5.9. Figure 5.9 indi-
cates that it might be possible to control the azimuthal modes by altering the current phase
between the antennas and launch modes other than without it being present. At
a current phase difference of between the two double saddle coil antennas the radi-
ation resistance is dominated by the mode with very little power being coupled
to .
Results presented earlier in this thesis using a single double saddle coil antenna and
a helical antenna failed to show significant excitation of helicon modes other than the
116
single radial azimuthal mode. From the radiation resistance spectra of the
phased antenna it would be expected that the mode could be excited. It might
even be possible to maintain a plasma with this mode, if the dominance of the
mode can be lessened.
There were a number of technical problems to be solved before the phased antenna
would function efficiently. To drive the two antennas independently a power splitter was
made so that only one rf source was needed, and the current phase difference was varied
by delay cables. With two antennas, two matching networks, current transformers, and
power measuring circuits were also required. The main Basil matching network is con-
tained in a large copper box with lots of spatial separation between components, and high
voltage fixed value ceramic and variable vacuum capacitors to prevent arc discharges.
With two matching networks crowded into the same space, using air gap variable plate
capacitors and with less separation of antenna feeders and elements the maximum power
was restricted to 1kW per antenna.
A major problem was mutual inductive coupling between the double saddle coils in
the phased antenna. This was overcome by placing a de-coupling transformer in series
with each double saddle coil antenna. The de-coupling transformer had the ratio 1:1
with 2 turns in each winding on a 3cm diameter bakelite tube, wound in such a way
that it cancelled the mutual inductance of the antennas. Rough adjustment was made by
separating the winding and fine adjustment was made by moving a copper core in and out.
De-coupling was achieved by driving one antenna at low power and making adjustments
while monitoring the antenna current in the other. It was not possible to adjust for the
change of mutual coupling in the presence of a plasma.
117
The main result of this experiment was obtained by exciting a helicon wave in a pre-
formed plasma. Since most components of the main Basil matching network were being
used for the phased antenna another matching box had to be constructed so that another
double saddle coil antenna could be used to produce the pre-formed plasma. This antenna
was placed 40cm from the phased antenna and was driven at 7.1MHz, so as not to interfere
with rf measurements and so that the two waves could be distinguished. The plasma was
produced approximately 10msec before the phased antenna was turned on. By observing
the wavefield measurements in the first 10msec it was confirmed that the 7.1MHz was
totally rejected by the rf measuring system.
The use of a the phased antenna to produce a rotating wave field is similar to that
of rotamak devices [52]. Rotamak devices are used to produce plasmas by feeding or-
thogonally oriented coils outside the discharge vessel with rf current pulses. By changing
the relative phasing of the current in the two coils the applied wave field can be made to
rotate in a right or left hand sense. While the operating regimes of Basil and rotamaks
are significantly different, the inability to produce plasmas with rotamaks with an applied
field rotating in a left hand sense may be related to the poor coupling of helicon
waves as seen in Basil.
5.4 Phased Antenna Results
The first experiment carried out with the phased antenna was to produce a plasma. It was
found that it was possible to produce a plasma with an antenna phasing of , however
the wave was found to be an mode giving the same result as a single double
118
saddle coil antenna. Phasing the antenna more than away from it was not possible
to produce any plasma even though the tuning was adjusted for maximum antenna current
and the power increased until the air gap variable capacitors in the matching networks
arced. It was expected that some form of discharge would have been produced, even if
not by wave coupling. This was probably due to the lower power limit due to the complex
matching arrangement, resulting in a lower voltage on the antenna.
The inability of the phased antenna to produce a plasma, with phasing other than
, might be a failure to initiate breakdown. However, once a plasma is formed it may
be possible to maintain the discharge with alternative phasing. To test this hypothesis
another antenna was set up to pre-form a plasma, as described in the previous section.
The single double saddle coil antenna was used to produce a plasma and after a 10msec
delay the phased antenna was turned on. After a further 10msec, during which both
antennas were operating, the single antenna was turned off and the phased antenna was
left to maintain the plasma. This was unsuccessful. With a phasing of the plasma
was unstable while both single and phased antennas were operating presumably due to
each antenna having different preferred operating conditions. Once the single antenna
was turned off the phased antenna behaved the same as a double saddle coil antenna,
as studied earlier. With a phasing approximately away from the plasma was
severly disturbed when both antennas were operating and would extinguish completely
when the single double saddle coil antenna was turned off.
In a final attempt to launch other modes in a pre-formed plasma the power to the
phased antenna was reduced until no adverse effects were evident on the pre-formed
plasma. Azimuthal wavefield measurements were then made at 10,20,30cm from the
119
end of the antenna. Very detailed measurements were difficult to make due to low wave
amplitudes. The mutual coupling in the phased antenna due to the presence of the plasma
made it difficult to tune the antennas and maintain equal antenna currents in each individ-
ual double saddle coil.
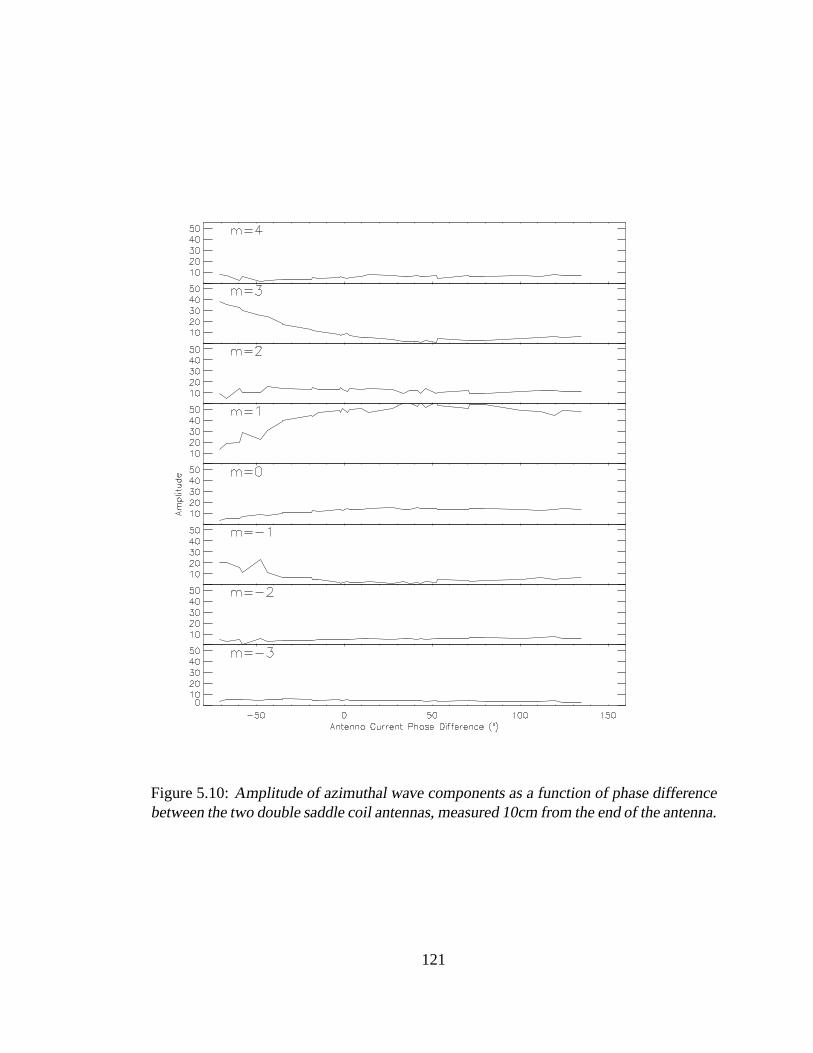
Figures 5.10 and 5.11 show the normalised amplitudes of the different azimuthal
modes as a function of the phase difference between the two double saddle coil anten-
nas measured at 10cm and 20cm from the phased antenna. At the mode is
as expected from the earlier experiments. However as the phase approaches a sig-
nificant amount of is launched and the amplitude of is reduced. There
was also signs of other modes that would not be expected with this antenna, such as
. These are due to the complex azimuthal feeder arrangement of the antenna and
asymmetries in the loop areas.
Measured radial density and temperature profiles were input to the MHD numerical
model in order to theoretically calculate the impedance of different modes as a function of
the antenna phasing. The result from the numerical model shown in figure 5.9 are in good
agreement with the experimental measurements in figures 5.10 and 5.11. Of the modes
considered only the and are significantly excited with the
impedance peaking at , where the is minimum, and the opposite being
true at . The noise in the experimental data is due to the unequal amplitudes of the
antenna currents. It is interesting that the total radiation resistance is less than for both the
single double saddle coil and helical antenna. At the theoretical radiation resistance
is , the same order of magnitude as the ohmic losses in the matching network.
120
Figure 5.10: Amplitude of azimuthal wave components as a function of phase differencebetween the two double saddle coil antennas, measured 10cm from the end of the antenna.
121
Figure 5.11: Amplitude of azimuthal wave components as a function of phase differencebetween the two double saddle coil antennas, measured 20cm from the end of the antenna.
122
5.5 Summary
A helical antenna was constructed and successfully used to produce a plasma. However
the antenna was only capable of producing an axially asymmetric plasma, that is, the
plasma was produced in the direction of right hand rotation of the antenna elements with
respect to the static magnetic field. The wave that produced the plasma was found to
be the azimuthal mode. No mode was observed in the plasma that
extended a short distance in the left hand rotation direction of the antenna.
Using a phased antenna it was not possible to produce or maintain a plasma with
modes other than the azimuthal mode. By exciting helicon waves at low power
in a pre-formed plasma it was possible to excite a significant mode while at the
same time reducing the at an antenna phasing approaching .
To maintain high density plasmas in equilibrium the only viable mode is the single
radial azimuthal mode. The radiation resistance of modes other than is
too low to couple significant power to the plasma.