+ All Categories
Home > Documents > CHAPTER 5 Outcomes of Education

CHAPTER 5 Outcomes of Education

Date post: 28-Nov-2021
Category:
Upload: others
View: 3 times
Download: 0 times
Share this document with a friend
24
DIGEST OF EDUCATION STATISTICS 2005 609 CHAPTER 5 Outcomes of Education This chapter contains tables comparing educational attainment and workforce characteristics. The data show labor force participation and income levels of high school dropouts and high school and college graduates. Population characteristics are provided for many of the measures to help provide comparisons among various demographic groups. Tables 368 to 370 contain data from the U.S. Census Bureau on educational attainment of the labor force, and data from the Bureau of Labor Statistics on employment and unem- ployment. These tables provide information on the educa- tional attainment of the labor force, by occupation, sex, race/ ethnicity, and unemployment rates. Tables 372 and 373 were compiled from Bureau of Labor Statistics data on high school completers and dropouts. These data show the labor force participation and college enrollment of high school students within the year after they leave school. The tabulations also provide comparative labor force partici- pation and unemployment rates for high school completers and dropouts. Additional information on college enrollment rates by race/ethnicity and sex has been included to help form a more complete picture of high school outcomes. Tables 374 to 377 were prepared from the Recent College Graduates and Baccalaureate and Beyond surveys by the National Center for Education Statistics (NCES). These tables provide data on employment outcomes for college graduates. Tables 378 and 379 provide an income comparison by education level and sex for the entire population. Trends in salaries received by all college graduates also are featured in this section. The last tables in this chapter deal with literacy skills, community ser- vice, drug use, and life values. Statistics related to outcomes of education appear in other sections of the Digest. For example, statistics on educational attainment of the entire population are in chapter 1. More detailed data on the numbers of high school and college graduates are contained in chapters 2 and 3. Chapter 3 con- tains trend data on the proportion of high school completers going to college. Additional data on the income of persons by educational attainment may be obtained from the U.S. Census Bureau in the Current Population Reports, Series P-60. The Bureau of Labor Statistics has a series of publica- tions dealing with the educational characteristics of the labor force. Further information on survey methodologies is in the Guide to Sources in the appendix and in the publications cited in the source notes. Labor Force Adults with higher levels of education were generally more likely to participate in the labor force (which consists of those employed or actively seeking employment) than adults with less education (table 368). Among persons 25 years old and over, about 78 percent of those with a bache- lor’s or higher degree participated in the labor force in 2004, compared with 63 percent of those who had completed only high school. In contrast, 45 percent of those 25 and older who had not completed high school were in the labor force (figure 21). The 2004 labor force participation rates for Blacks and Hispanics age 25 and older whose highest level of educational attainment was a high school diploma were higher than the rate for Whites with similar levels of educa- tion (table 368). The labor force participation rates for Blacks and Hispanics age 25 and over with a bachelor’s or higher degree were also higher than the rate for Whites. Persons with lower levels of educational attainment were generally more likely to be unemployed than those who had higher levels of educational attainment (table 370). The 2004 unemployment rate for adults (25 years old and over) who had not completed high school was 8.5 percent, compared with 5.0 percent for those who had completed high school and 2.7 percent for those with a bachelor’s or higher degree (figure 22). Younger people with high school diplomas tended to have higher unemployment rates than persons 25 years old and over with similar levels of education (table 370). The relative difficulties in entering the job market for dropouts are highlighted by comparing their labor force par- ticipation and unemployment rates to other youth. Of the 2004 high school completers who were not in college, 77 percent were in the labor force in October 2004, and 20 per- cent of those in the labor force were looking for work (table 372). In comparison, about 54 percent of 2003–04 dropouts were in the labor force (employed or looking for work) in October 2004, and 40 percent of those in the labor force were looking for work (table 373 and figure 23). One year after graduating from college in 1999–2000, 87 percent of individuals receiving bachelor’s degrees were employed (77 percent full time and 11 percent part time), 6 percent were unemployed, and 6 percent were not in the labor force (table 375).
Transcript

CHAPTER 5Outcomes of Education

This chapter contains tables comparing educationalattainment and workforce characteristics. The data showlabor force participation and income levels of high schooldropouts and high school and college graduates. Populationcharacteristics are provided for many of the measures to helpprovide comparisons among various demographic groups.Tables 368 to 370 contain data from the U.S. Census Bureauon educational attainment of the labor force, and data fromthe Bureau of Labor Statistics on employment and unem-ployment. These tables provide information on the educa-tional attainment of the labor force, by occupation, sex, race/ethnicity, and unemployment rates.

Tables 372 and 373 were compiled from Bureau of LaborStatistics data on high school completers and dropouts. Thesedata show the labor force participation and college enrollmentof high school students within the year after they leave school.The tabulations also provide comparative labor force partici-pation and unemployment rates for high school completersand dropouts. Additional information on college enrollmentrates by race/ethnicity and sex has been included to help forma more complete picture of high school outcomes. Tables 374to 377 were prepared from the Recent College Graduates andBaccalaureate and Beyond surveys by the National Center forEducation Statistics (NCES). These tables provide data onemployment outcomes for college graduates. Tables 378 and379 provide an income comparison by education level and sexfor the entire population. Trends in salaries received by allcollege graduates also are featured in this section. The lasttables in this chapter deal with literacy skills, community ser-vice, drug use, and life values.

Statistics related to outcomes of education appear in othersections of the Digest. For example, statistics on educationalattainment of the entire population are in chapter 1. Moredetailed data on the numbers of high school and collegegraduates are contained in chapters 2 and 3. Chapter 3 con-tains trend data on the proportion of high school completersgoing to college. Additional data on the income of personsby educational attainment may be obtained from the U.S.Census Bureau in the Current Population Reports, SeriesP-60. The Bureau of Labor Statistics has a series of publica-tions dealing with the educational characteristics of the laborforce. Further information on survey methodologies is in theGuide to Sources in the appendix and in the publicationscited in the source notes.

Labor ForceAdults with higher levels of education were generally

more likely to participate in the labor force (which consistsof those employed or actively seeking employment) thanadults with less education (table 368). Among persons 25years old and over, about 78 percent of those with a bache-lor’s or higher degree participated in the labor force in 2004,compared with 63 percent of those who had completed onlyhigh school. In contrast, 45 percent of those 25 and olderwho had not completed high school were in the labor force(figure 21). The 2004 labor force participation rates forBlacks and Hispanics age 25 and older whose highest levelof educational attainment was a high school diploma werehigher than the rate for Whites with similar levels of educa-tion (table 368). The labor force participation rates forBlacks and Hispanics age 25 and over with a bachelor’s orhigher degree were also higher than the rate for Whites.

Persons with lower levels of educational attainment weregenerally more likely to be unemployed than those who hadhigher levels of educational attainment (table 370). The 2004unemployment rate for adults (25 years old and over) who hadnot completed high school was 8.5 percent, compared with5.0 percent for those who had completed high school and 2.7percent for those with a bachelor’s or higher degree(figure 22). Younger people with high school diplomas tendedto have higher unemployment rates than persons 25 years oldand over with similar levels of education (table 370).

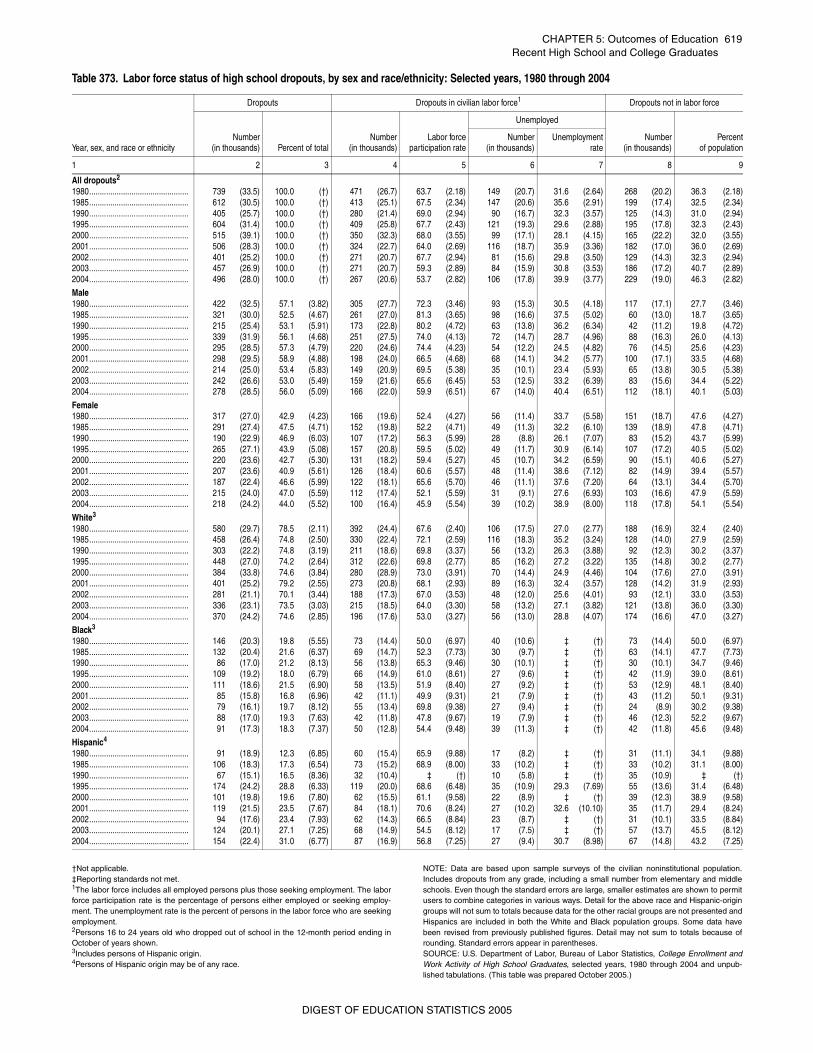
The relative difficulties in entering the job market fordropouts are highlighted by comparing their labor force par-ticipation and unemployment rates to other youth. Of the2004 high school completers who were not in college, 77percent were in the labor force in October 2004, and 20 per-cent of those in the labor force were looking for work(table 372). In comparison, about 54 percent of 2003–04dropouts were in the labor force (employed or looking forwork) in October 2004, and 40 percent of those in the laborforce were looking for work (table 373 and figure 23).

One year after graduating from college in 1999–2000, 87percent of individuals receiving bachelor’s degrees wereemployed (77 percent full time and 11 percent part time), 6percent were unemployed, and 6 percent were not in thelabor force (table 375).

DIGEST OF EDUCATION STATISTICS 2005 609

610 CHAPTER 5: Outcomes of Education

IncomeThe median annual income of male full-time year-round

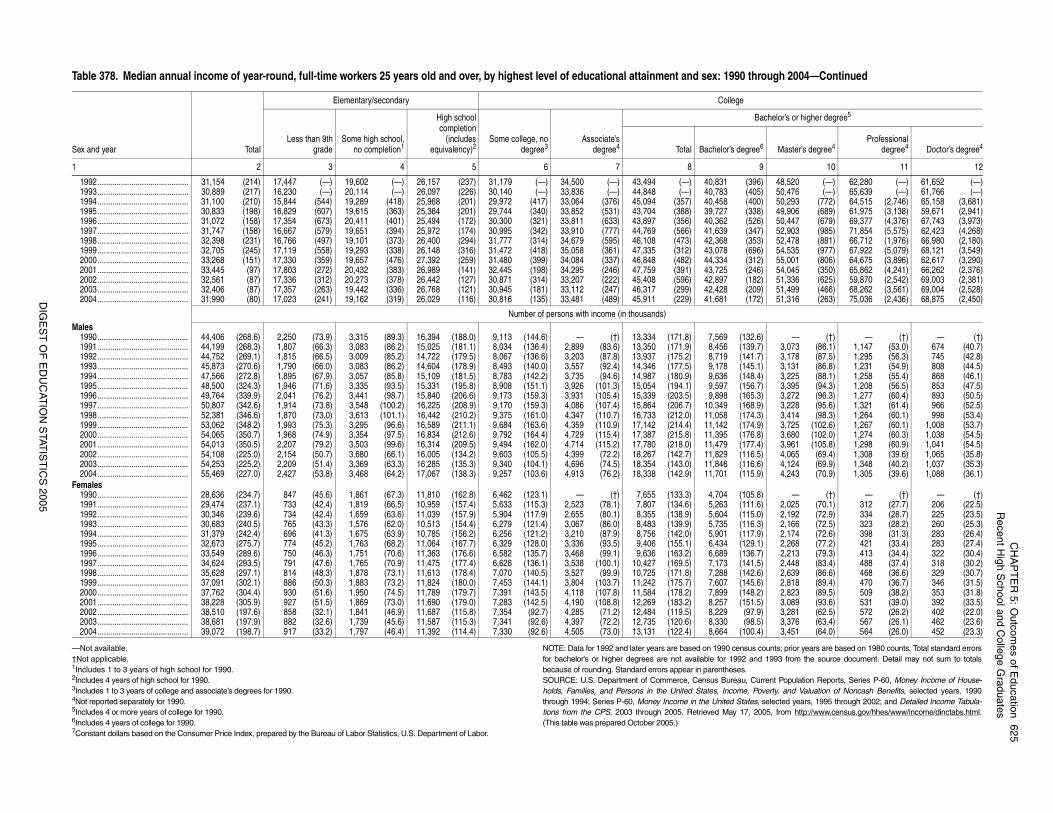
workers, when adjusted for inflation, was about the same in2004 as it was in 1995 (table 378). Income for females rosebetween 1995 and 2001, but then declined between 2001 and

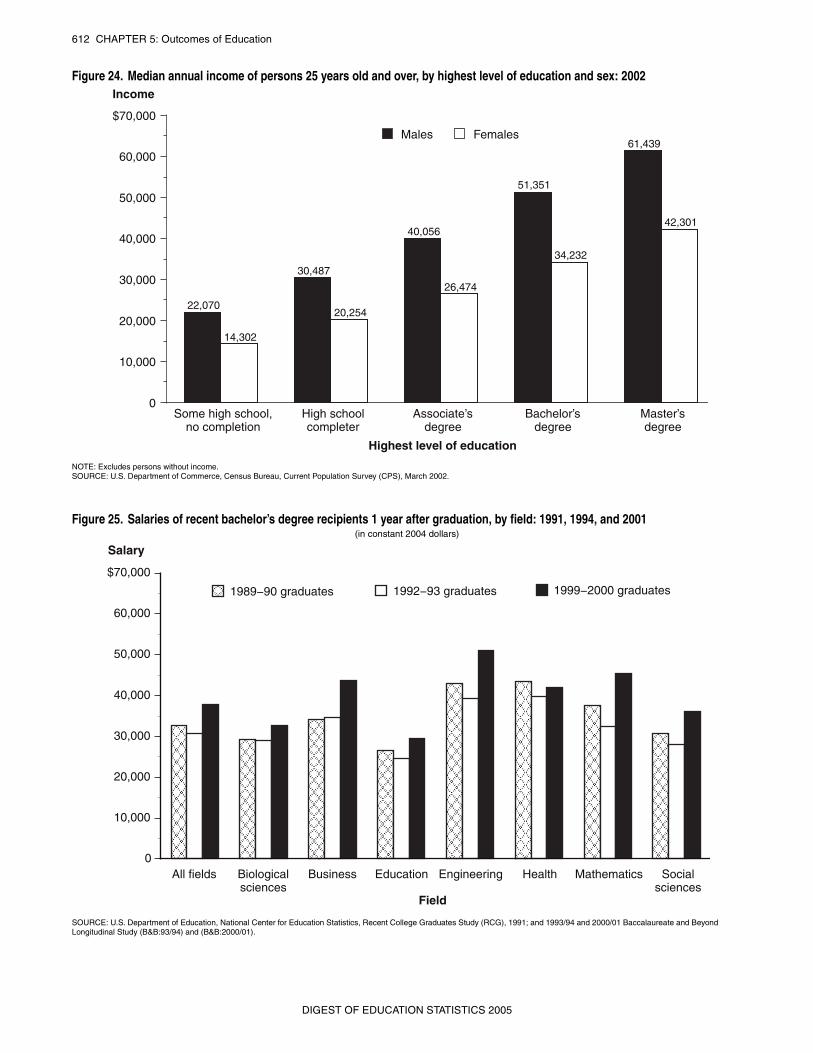
2004, for a net increase of 4 percent. Women’s incomesremained lower than men’s incomes, even after adjusting forlevel of education. For example, the average 2004 incomesfor full-time year-round workers with a bachelor’s degreewere $57,220 for men and $41,681 for women.

Figure 21. Labor force participation rate of persons 20 years old and over, by age and highest level of education: 2004

SOURCE: U.S. Department of Labor, Bureau of Labor Statistics, Office of Employment and Unemployment Statistics, Current Population Survey (CPS), 2004.

Age

25 and over

20 to 24

0 1 0 2 0 3 0 4 0 5 0 6 0 7 Labor force participation rate

0 8 0 9 0 100

78

77

63

45

83

82

79

68

Bachelor’s or higher degree Associate’s degree

High school completion Less than high school completion

DIGEST OF EDUCATION STATISTICS 2005

CHAPTER 5: Outcomes of Education 611

Figure 22. Unemployment rates of persons 25 years old and over, by highest level of education: 2004

SOURCE: U.S. Department of Labor, Bureau of Labor Statistics, Office of Employment and Unemployment Statistics, Current Population Survey (CPS), 2004.

Figure 23. Labor force status of 2003–04 high school dropouts and completers not enrolled in college: October 2004

NOTE: Dropouts are persons who have not completed high school, and are not enrolled in school. Detail may not sum to totals because of rounding.SOURCE: U.S. Department of Labor, Bureau of Labor Statistics, “College Enrollment and Work Activity of 2004 High School Graduates.”

Percent unemployed

Less than high school completion

Some college, no degree

Associate’s degree

Highest level of education

Bachelor’s or higher degree

0

5

10

8.5

5.0 4.5

3.7

All education levels 4.4

2.7

High school completer, no college

Percent

Dropouts

High school completion status

High school completers, not enrolled in college

0

20

40

60

80

100

32.3

21.4

62.1

15.5Employed

Unemployed (looking for work)

Not in labor force

46.3

22.4

DIGEST OF EDUCATION STATISTICS 2005

612 CHAPTER 5: Outcomes of Education

Figure 24. Median annual income of persons 25 years old and over, by highest level of education and sex: 2002

NOTE: Excludes persons without income.SOURCE: U.S. Department of Commerce, Census Bureau, Current Population Survey (CPS), March 2002.

Figure 25. Salaries of recent bachelor’s degree recipients 1 year after graduation, by field: 1991, 1994, and 2001(in constant 2004 dollars)

SOURCE: U.S. Department of Education, National Center for Education Statistics, Recent College Graduates Study (RCG), 1991; and 1993/94 and 2000/01 Baccalaureate and BeyondLongitudinal Study (B&B:93/94) and (B&B:2000/01).

Highest level of education

Income

Some high school, no completion

High school completer

Associate’s degree

Bachelor’s degree

Master’s degree

0

10,000

20,000

30,000

40,000

50,000

60,000

$70,000

Males Females

22,070

14,302

30,487

20,254

40,056

26,474

51,351

34,232

61,439

42,301

0

10,000

20,000

30,000

40,000

50,000

60,000

$70,000

Salary

Field

1989−90 graduates 1992−93 graduates 1999−2000 graduates

All fields Biologicalsciences

Business Education Engineering Health Mathematics Socialsciences

DIGEST OF EDUCATION STATISTICS 2005

CH

AP

TE

R 5: O

utcomes of E

ducation613

Educational C

haracteristics of the Workforce

DIG

ES

T O

F E

DU

CAT

ION

STAT

IST

ICS

2005

tics, Office of Employment and Unemployment Statistics, Currentns. (This table was prepared April 2005.)

ucatio , sex, and race/ethnicity: 2004

yment/population ratio2

h schoolmpletion

College

Some college,no degree

Associate’sdegree

Bachelor’s orhigher degree

10 11 12 13

(1.59) 50.6 (1.86) ‡ (†) ‡ (†)(2.25) 48.9 (2.80) ‡ (†) ‡ (†)(2.24) 51.9 (2.47) ‡ (†) ‡ (†)(1.94) 53.8 (2.20) ‡ (†) ‡ (†)(4.38) 39.1 (5.91) ‡ (†) ‡ (†)(4.37) 48.1 (5.78) ‡ (†) ‡ (†)

(0.74) 65.4 (0.69) 77.6 (1.50) 78.6 (1.03)(1.26) 65.5 (1.37) 79.4 (3.01) 80.0 (2.13)(1.51) 65.3 (1.25) 76.2 (2.64) 77.7 (1.78)(0.91) 68.1 (0.83) 80.8 (1.68) 81.4 (1.12)(2.89) 56.7 (2.91) 67.5 (8.00) 73.4 (5.72)(2.40) 66.7 (2.86) 71.3 (6.23) 77.3 (6.21)

(0.25) 67.1 (0.33) 73.8 (0.44) 75.8 (0.24)(0.47) 73.8 (0.62) 80.1 (0.83) 80.6 (0.42)(0.46) 61.3 (0.61) 69.1 (0.80) 70.9 (0.47)(0.30) 66.1 (0.39) 73.7 (0.50) 75.3 (0.27)(1.04) 67.6 (1.36) 73.0 (2.01) 79.5 (1.21)(1.06) 75.1 (1.47) 76.5 (2.21) 79.2 (1.42)

_

†Not applicable.‡Reporting standards not met.1Percent of the civilian population who are employed or seeking employment.2Number of persons employed as a percent of civilian population.3Includes persons reporting no school years completed.

4Excludes persons enrolled in school.NOTE: Standard errors appear in parentheses.SOURCE: U.S. Department of Labor, Bureau of Labor StatisPopulation Survey (CPS), March 2004, unpublished tabulatio

EdTable 368. Labor force participation rates and employment to population ratios of persons 16 years old and over, by highest level of education, age

Age, sex, and race/ethnicity

Labor force participation rate1 Emplo

Total

Less thanhigh schoolcompletion3

High schoolcompletion

College

Total

Less thanhigh schoolcompletion3

Higco

Some college,no degree

Associate’sdegree

Bachelor’s orhigher degree

1 2 3 4 5 6 7 8 9

16 to 19 years old4 ......................... 43.9 (2.14) 36.0 (0.79) 64.0 (1.53) 55.6 (1.84) ‡ (†) ‡ (†) 36.4 (2.07) 28.8 (0.75) 53.9Male ............................................. 43.9 (0.95) 36.4 (1.10) 66.4 (2.14) 54.4 (2.79) ‡ (†) ‡ (†) 35.9 (0.92) 28.6 (1.03) 55.5Female ......................................... 43.8 (0.96) 35.6 (1.15) 61.7 (2.18) 56.6 (2.45) ‡ (†) ‡ (†) 37.0 (0.94) 29.0 (1.09) 52.3White, non-Hispanic..................... 49.1 (0.86) 41.4 (1.04) 67.7 (1.84) 58.6 (2.17) ‡ (†) ‡ (†) 42.2 (0.85) 34.7 (1.01) 58.6Black, non-Hispanic ..................... 31.2 (1.74) 23.7 (1.88) 53.6 (4.48) 46.6 (6.04) ‡ (†) ‡ (†) 21.2 (1.54) 14.5 (1.55) 38.6Hispanic ....................................... 38.2 (1.73) 31.1 (1.91) 60.5 (4.27) 53.8 (5.77) ‡ (†) ‡ (†) 30.4 (1.64) 23.6 (1.76) 50.0

20 to 24 years old4 ......................... 75.0 (0.38) 67.6 (1.10) 78.9 (0.66) 70.7 (0.66) 82.4 (1.37) 83.3 (0.94) 67.9 (0.41) 56.5 (1.16) 70.1Male ............................................. 79.6 (0.69) 79.9 (1.69) 85.5 (1.04) 71.5 (1.30) 84.1 (2.72) 85.1 (1.90) 71.6 (0.77) 68.2 (1.96) 75.8Female ......................................... 70.5 (0.75) 51.3 (2.33) 70.8 (1.42) 70.0 (1.21) 81.2 (2.42) 82.0 (1.64) 64.3 (0.78) 41.0 (2.29) 63.3White, non-Hispanic..................... 77.8 (0.47) 67.5 (1.81) 82.0 (0.80) 72.7 (0.79) 84.8 (1.54) 85.6 (1.01) 71.9 (0.51) 56.9 (1.91) 74.4Black, non-Hispanic ..................... 68.1 (1.63) 58.2 (4.08) 72.1 (2.63) 65.8 (2.79) 73.1 (7.57) 80.5 (5.12) 55.4 (1.74) 37.9 (4.01) 57.8Hispanic ....................................... 74.5 (1.31) 72.7 (2.31) 77.0 (2.19) 72.0 (2.72) 77.4 (5.76) 81.0 (5.82) 67.6 (1.40) 64.8 (2.48) 69.3

25 and older ................................... 66.9 (0.14) 45.1 (0.38) 63.2 (0.25) 70.3 (0.32) 76.6 (0.42) 77.9 (0.23) 64.0 (0.14) 41.2 (0.37) 60.0Male ............................................. 75.3 (0.25) 58.3 (0.73) 73.5 (0.45) 77.3 (0.59) 83.5 (0.77) 82.8 (0.40) 72.0 (0.26) 53.8 (0.73) 69.8Female ......................................... 59.3 (0.26) 32.5 (0.65) 54.1 (0.46) 64.3 (0.60) 71.5 (0.78) 72.8 (0.46) 56.7 (0.26) 29.2 (0.63) 51.5White, non-Hispanic..................... 66.1 (0.16) 35.8 (0.52) 60.9 (0.29) 68.6 (0.38) 76.2 (0.49) 77.3 (0.26) 63.7 (0.17) 33.1 (0.51) 58.3Black, non-Hispanic ..................... 66.9 (0.60) 38.5 (1.44) 67.5 (1.00) 73.8 (1.28) 77.5 (1.89) 83.0 (1.13) 61.5 (0.62) 32.5 (1.39) 61.6Hispanic ....................................... 71.2 (0.56) 62.3 (0.93) 74.0 (1.01) 79.1 (1.38) 79.8 (2.09) 82.1 (1.34) 67.1 (0.58) 57.6 (0.95) 70.2

614C

HA

PT

ER

5: Outcom

es of Education

Educational C

haracteristics of the WorkforceD

IGE

ST

OF

ED

UC

ATIO

N S

TATIS

TIC

S 2005

tics, Office of Employment and Unemployment Statistics, Currentns. (This table was prepared April 2005.)

attainment

College

Associate's degree Bachelor's degreeMaster's or

higher degree

8 9 10

9.8 (0.34) 21.3 (0.47) 11.5 (0.37)10.4 (0.57) 35.4 (0.89) 26.4 (0.82)

8.8 (0.81) 36.1 (1.37) 16.6 (1.06)11.5 (0.79) 34.9 (1.17) 33.6 (1.16)

4.2 (0.94) 36.1 (2.25) 42.8 (2.32)11.4 (5.32) 36.1 (8.03) 16.7 (6.24)

1.7 (1.03) 49.8 (4.02) 43.4 (3.99)1.7 (1.56) 44.4 (5.96) 50.7 (6.00)2.5 (3.27) 39.1 (10.23) 52.6 (10.47)2.4 (1.85) 14.2 (4.22) 79.5 (4.88)8.7 (2.74) 24.2 (4.17) 19.6 (3.86)9.8 (0.91) 10.3 (0.93) 2.0 (0.43)

10.5 (0.72) 20.1 (0.94) 3.8 (0.45)10.1 (1.08) 6.1 (0.85) 1.1 (0.38)

6.5 (0.79) 6.3 (0.78) 1.2 (0.35)

8.4 (0.59) 21.1 (0.87) 11.8 (0.69)7.9 (0.97) 36.1 (1.72) 28.7 (1.62)7.3 (1.32) 37.4 (2.46) 18.1 (1.96)8.6 (1.41) 34.7 (2.39) 39.0 (2.45)2.7 (2.01) 32.4 (5.76) 56.5 (6.11)9.3 (1.85) 13.2 (2.16) 2.6 (1.01)8.8 (1.51) 27.9 (2.38) 5.7 (1.23)

10.2 (1.50) 5.8 (1.16) 1.1 (0.52)6.8 (1.25) 6.6 (1.23) 1.2 (0.54)

11.3 (0.70) 21.5 (0.91) 11.2 (0.70)12.8 (1.15) 34.7 (1.64) 24.0 (1.47)10.9 (1.79) 34.1 (2.73) 14.5 (2.03)13.9 (1.48) 35.1 (2.04) 29.3 (1.95)

4.7 (1.51) 37.5 (3.45) 37.8 (3.45)10.1 (1.58) 8.1 (1.43) 1.6 (0.65)11.4 (1.21) 15.8 (1.39) 2.8 (0.62)

8.7 (6.21) 12.5 (7.29) 2.0 (3.08)5.5 (1.94) 5.6 (1.97) 1.2 (0.92)

_

†Not applicable.#Rounds to zero.NOTE: Detail may not sum to totals because of rounding. Standard errors appear in parentheses.

SOURCE: U.S. Department of Labor, Bureau of Labor StatisPopulation Survey (CPS), March 2004, unpublished tabulatio

Table 369. Occupation of employed persons 25 to 64 years old, by educational attainment and sex: 2004

Occupation and sexTotal employed,

in thousands

Percentage distribution, by highest level of educational

TotalLess than 1

year of high school

High school

1–4 years of highschool, no completion

High schoolcompletion

Some college,no degree

1 2 3 4 5 6 7

All personsTotal ....................................................................................... 119,622 (274.3) 100.0 3.5 (0.21) 6.0 (0.28) 30.0 (0.53) 17.8 (0.44)

Management, professional, and related......................................... 45,661 (236.1) 100.0 0.4 (0.12) 1.2 (0.22) 12.8 (0.62) 13.4 (0.64)Management, business, and financial operations ...................... 19,404 (166.6) 100.0 0.7 (0.24) 1.9 (0.40) 18.5 (1.11) 17.4 (1.08)Professional and related ............................................................ 26,257 (190.1) 100.0 0.2 (0.11) 0.7 (0.23) 8.6 (0.69) 10.5 (0.75)

Education, training, and library............................................... 7,244 (105.2) 100.0 0.2 (0.20) 0.6 (0.42) 8.3 (1.29) 7.9 (1.26)Preschool and kindergarten teachers................................. 568 (30.0) 100.0 0.7 (1.40) 1.9 (1.87) 17.3 (6.31) 15.7 (6.07)Elementary and middle school teachers ............................ 2,449 (61.9) 100.0 # (†) 0.2 (0.09) 2.5 (1.25) 2.4 (1.22)Secondary school teachers ................................................ 1,101 (41.7) 100.0 0.1 (0.36) 0.1 (0.19) 0.7 (1.02) 2.4 (1.82)Special education teachers ................................................ 361 (23.9) 100.0 0.6 (1.56) 0.6 (0.27) 3.3 (3.76) 1.9 (2.89)Postsecondary teachers ..................................................... 1,085 (41.4) 100.0 # (†) # (†) 1.7 (1.54) 2.1 (1.74)Other education, training, and library workers.................... 1,679 (51.4) 100.0 0.4 (0.58) 1.4 (0.39) 23.8 (4.14) 22.0 (4.03)

Service occupations....................................................................... 17,016 (157.1) 100.0 7.9 (0.82) 11.4 (1.09) 39.6 (1.49) 19.0 (1.20)Sales and office occupations ......................................................... 28,875 (197.8) 100.0 1.2 (0.25) 4.0 (0.69) 35.3 (1.12) 25.1 (1.02)Natural resources, construction, and maintenance........................ 12,472 (136.1) 100.0 9.0 (1.02) 12.3 (1.10) 44.2 (1.77) 17.1 (1.34)Production, transportation, and material moving ........................... 15,598 (151.0) 100.0 7.7 (0.85) 13.0 (2.66) 48.9 (1.59) 16.3 (1.18)

MaleTotal ....................................................................................... 64,326 (208.5) 100.0 4.5 (0.44) 6.9 (0.54) 30.4 (0.98) 16.9 (0.80)

Management, professional, and related......................................... 22,887 (220.6) 100.0 0.6 (0.27) 1.4 (0.43) 12.4 (1.18) 12.9 (1.20)Management, business, and financial operations ...................... 11,305 (169.2) 100.0 0.9 (0.48) 2.3 (0.76) 17.9 (1.95) 16.2 (1.87)Professional and related ............................................................ 11,581 (170.9) 100.0 0.2 (0.25) 0.6 (0.40) 7.0 (1.29) 9.8 (1.49)

Education, training, and library............................................... 1,929 (74.3) 100.0 0.1 (0.40) 0.3 (0.69) 3.4 (2.24) 4.5 (2.56)Service occupations....................................................................... 7,222 (139.0) 100.0 9.4 (1.85) 10.0 (1.91) 35.7 (3.05) 19.9 (2.54)Sales and office occupations ......................................................... 10,380 (163.1) 100.0 1.5 (0.65) 3.8 (1.02) 28.9 (2.41) 23.4 (2.25)Natural resources, construction, and maintenance........................ 11,918 (173.0) 100.0 8.9 (1.41) 12.5 (1.64) 44.4 (2.46) 17.1 (1.87)Production, transportation, and material moving ........................... 11,919 (173.0) 100.0 7.0 (1.27) 12.4 (1.63) 48.9 (2.48) 17.1 (1.87)

FemaleTotal ....................................................................................... 55,296 (219.1) 100.0 2.4 (0.34) 5.1 (0.48) 29.7 (1.01) 18.8 (0.86)

Management, professional, and related......................................... 22,775 (210.3) 100.0 0.3 (0.17) 0.9 (0.33) 13.3 (1.17) 13.9 (1.19)Management, business, and financial operations ...................... 8,098 (140.2) 100.0 0.4 (0.37) 1.4 (0.69) 19.4 (2.28) 19.2 (2.27)Professional and related ............................................................ 14,676 (180.0) 100.0 0.2 (0.17) 0.7 (0.35) 9.9 (1.28) 11.0 (1.34)

Education, training, and library............................................... 5,315 (115.7) 100.0 0.2 (0.32) 0.7 (0.58) 10.0 (2.14) 9.1 (2.05)Service occupations....................................................................... 9,794 (152.3) 100.0 6.9 (1.33) 12.5 (1.73) 42.5 (2.59) 18.3 (2.03)Sales and office occupations ......................................................... 18,495 (196.3) 100.0 1.0 (0.37) 4.1 (0.76) 38.9 (1.86) 26.1 (1.68)Natural resources, construction, and maintenance........................ 553 (38.5) 100.0 11.0 (6.91) 9.6 (6.50) 38.7 (10.75) 17.5 (8.39)Production, transportation, and material moving ........................... 3,679 (97.3) 100.0 10.0 (2.57) 14.8 (3.04) 49.0 (4.28) 14.0 (2.97)

CH

AP

TE

R 5: O

utcomes of E

ducation615

Educational C

haracteristics of the Workforce

DIG

ES

T O

F E

DU

CAT

ION

STAT

IST

ICS

2005

ed figures. Standard errors appear in parentheses.tics, Office of Employment and Unemployment Statistics, Currentublished tabulations. (This table was prepared May 2005.)

Unemployment rate, 20041

16- to 24-year-olds225 years

old and overTotal 16 to 19 years 20 to 24 years

10 11 12 13

(0.29) 17.0 (0.51) 9.4 (0.36) 4.4 (0.08)(0.57) 20.0 (0.66) 16.4 (1.19) 8.5 (0.29)(0.60) 15.8 (1.16) 11.1 (0.69) 5.0 (0.15)(0.48) 9.1 (1.07) 7.5 (0.53) 4.5 (0.20)(1.16) ‡ (†) 5.9 (1.17) 3.7 (0.26)(0.79) ‡ (†) 5.6 (0.79) 2.7 (0.12)

(0.43) 18.4 (0.74) 10.1 (0.52) 4.4 (0.12)(0.79) 21.4 (0.93) 14.7 (1.51) 7.6 (0.40)(0.83) 16.4 (1.68) 11.4 (0.95) 5.1 (0.23)(0.73) 10.2 (1.70) 8.4 (0.81) 4.4 (0.29)(1.73) ‡ (†) 5.6 (1.74) 4.0 (0.41)(1.26) ‡ (†) 5.9 (1.28) 2.7 (0.17)

(0.40) 15.5 (0.70) 8.7 (0.49) 4.4 (0.11)(0.84) 18.4 (0.93) 20.1 (1.97) 10.0 (0.44)(0.87) 15.2 (1.61) 10.6 (1.02) 4.9 (0.21)(0.62) 8.4 (1.37) 6.8 (0.70) 4.7 (0.28)(1.57) ‡ (†) 6.2 (1.58) 3.4 (0.33)(1.00) ‡ (†) 5.3 (1.01) 2.7 (0.18)

(0.34) 14.1 (0.60) 7.6 (0.41) 3.6 (0.09)(0.73) 16.3 (0.78) 15.7 (1.93) 7.7 (0.40)(0.71) 13.5 (1.34) 9.3 (0.84) 4.3 (0.17)(0.54) 8.2 (1.21) 6.4 (0.60) 3.7 (0.21)(1.26) ‡ (†) 4.8 (1.25) 3.3 (0.28)(0.86) ‡ (†) 4.9 (0.86) 2.5 (0.13)

(1.07) 32.0 (1.75) 18.6 (1.36) 8.1 (0.35)(1.88) 38.7 (2.15) 34.9 (3.94) 15.5 (1.07)(2.03) 28.0 (4.03) 19.9 (2.34) 8.7 (0.60)(1.85) 16.2 (4.46) 13.9 (2.03) 8.4 (0.81)(4.20) ‡ (†) 7.2 (4.42) 5.9 (1.07)(3.63) ‡ (†) 8.8 (3.67) 4.2 (0.60)

(0.75) 20.4 (1.43) 9.3 (0.87) 5.7 (0.28)(1.19) 24.0 (1.77) 10.9 (1.61) 7.5 (0.51)(1.43) 17.2 (3.30) 10.0 (1.56) 5.2 (0.51)(1.45) 10.6 (3.56) 7.4 (1.59) 5.1 (0.75)(3.69) ‡ (†) 8.1 (3.77) 4.2 (1.05)(3.22) ‡ (†) 5.0 (3.22) 3.5 (0.64)

_

†Not applicable.‡Reporting standards not met.1The unemployment rate is the percent of individuals in the labor force who are not working and who made specific efforts tofind employment sometime during the prior 4 weeks. The labor force includes both employed and unemployed persons.2Excludes persons enrolled in school.

3Persons of Hispanic origin may be of any race.NOTE: Some data have been revised from previously publishSOURCE: U.S. Department of Labor, Bureau of Labor StatisPopulation Survey (CPS), March 2002, 2003, and 2004, unp

Table 370. Unemployment rate of persons 16 years old and over, by age, sex, race/ethnicity, and educational attainment: 2002, 2003, and 2004

Sex, race/ethnicity, and educational attainment

Unemployment rate, 20021 Unemployment rate, 20031

16- to 24-year-olds225 years

old and over

16- to 24-year-olds225 years

old and overTotal 16 to 19 years 20 to 24 years Total 16 to 19 years 20 to 24 years

1 2 3 4 5 6 7 8 9

All personsAll education levels ............................... 12.0 (0.16) 16.5 (0.31) 9.7 (0.18) 4.6 (0.04) 12.4 (0.30) 17.4 (0.52) 10.0 (0.37) 4.8 (0.09) 11.9

Less than high school completion ..... 18.4 (0.36) 19.0 (0.44) 17.0 (0.61) 8.4 (0.18) 19.1 (0.58) 19.6 (0.65) 18.2 (1.25) 8.8 (0.29) 18.8High school completion, no college... 12.6 (0.29) 15.9 (0.58) 11.1 (0.33) 5.3 (0.08) 13.4 (0.62) 17.4 (1.23) 12.0 (0.72) 5.5 (0.16) 12.4Some college, no degree .................. 7.7 (0.24) 9.2 (0.60) 7.3 (0.27) 4.8 (0.11) 7.8 (0.48) 10.3 (1.15) 7.3 (0.53) 5.2 (0.22) 7.8Associate’s degree ............................ 7.2 (0.59) ‡ (†) 7.1 (0.59) 4.0 (0.13) 6.8 (1.25) ‡ (†) 6.6 (1.26) 4.0 (0.28) 6.1Bachelor’s or higher degree .............. 5.8 (0.39) ‡ (†) 5.8 (0.39) 2.9 (0.06) 6.1 (0.84) ‡ (†) 6.1 (0.84) 3.1 (0.13) 5.6

MaleAll education levels ............................... 12.8 (0.23) 18.1 (0.45) 10.2 (0.25) 4.7 (0.06) 13.4 (0.43) 19.3 (0.75) 10.6 (0.53) 5.0 (0.13) 12.6

Less than high school completion ..... 18.7 (0.47) 20.8 (0.62) 15.1 (0.72) 7.8 (0.22) 19.3 (0.78) 21.1 (0.91) 16.3 (1.57) 8.2 (0.40) 18.8High school completion, no college... 12.7 (0.39) 16.4 (0.82) 11.3 (0.44) 5.4 (0.12) 14.0 (0.86) 19.6 (1.81) 12.1 (0.97) 5.7 (0.24) 12.7Some college, no degree .................. 8.1 (0.37) 9.8 (0.95) 7.8 (0.39) 4.7 (0.15) 8.3 (0.72) 11.0 (1.79) 7.7 (0.78) 5.4 (0.32) 8.7Associate’s degree ............................ 8.0 (0.88) ‡ (†) 7.6 (0.87) 4.3 (0.20) 7.8 (1.99) ‡ (†) 7.6 (2.01) 4.4 (0.43) 5.7Bachelor’s or higher degree .............. 6.9 (0.67) ‡ (†) 7.0 (0.67) 3.0 (0.09) 6.7 (1.36) ‡ (†) 6.8 (1.37) 3.2 (0.19) 5.9

FemaleAll education levels ............................... 11.1 (0.22) 14.9 (0.43) 9.1 (0.25) 4.6 (0.06) 11.4 (0.39) 15.6 (0.67) 9.3 (0.48) 4.6 (0.11) 11.0

Less than high school completion ..... 17.9 (0.54) 17.0 (0.62) 20.7 (1.12) 9.5 (0.31) 18.9 (0.80) 17.9 (0.87) 22.1 (1.93) 9.8 (0.41) 18.9High school completion, no college... 12.3 (0.43) 15.4 (0.83) 10.9 (0.50) 5.1 (0.12) 12.7 (0.84) 15.1 (1.55) 11.7 (1.00) 5.2 (0.20) 12.1Some college, no degree .................. 7.3 (0.33) 8.8 (0.77) 6.8 (0.36) 5.0 (0.15) 7.5 (0.61) 9.8 (1.42) 6.8 (0.67) 4.9 (0.28) 7.1Associate’s degree ............................ 6.7 (0.79) ‡ (†) 6.6 (0.80) 3.7 (0.17) 6.1 (1.49) ‡ (†) 5.9 (1.49) 3.7 (0.33) 6.3Bachelor’s or higher degree .............. 5.1 (0.48) ‡ (†) 5.0 (0.48) 2.8 (0.09) 5.5 (0.99) ‡ (†) 5.6 (0.99) 2.9 (0.17) 5.3

White, non-HispanicAll education levels ............................... 9.8 (0.18) 13.5 (0.34) 7.7 (0.20) 3.9 (0.05) 10.2 (0.35) 14.4 (0.60) 8.0 (0.42) 4.0 (0.09) 9.8

Less than high school completion ..... 15.6 (0.43) 15.4 (0.48) 16.4 (0.97) 7.5 (0.26) 16.7 (0.73) 16.4 (0.78) 18.1 (2.06) 7.6 (0.39) 16.2High school completion, no college... 10.5 (0.33) 13.2 (0.65) 9.2 (0.38) 4.5 (0.09) 10.9 (0.73) 13.8 (1.39) 9.7 (0.85) 4.6 (0.17) 10.6Some college, no degree .................. 6.3 (0.26) 8.0 (0.65) 5.8 (0.28) 4.2 (0.12) 6.7 (0.54) 8.9 (1.29) 6.2 (0.60) 4.3 (0.23) 6.7Associate’s degree ............................ 6.0 (0.63) ‡ (†) 5.6 (0.62) 3.5 (0.14) 5.1 (1.29) ‡ (†) 4.8 (1.29) 3.5 (0.29) 4.9Bachelor’s or higher degree .............. 5.3 (0.43) ‡ (†) 5.2 (0.42) 2.7 (0.07) 5.5 (0.91) ‡ (†) 5.5 (0.92) 2.8 (0.14) 5.0

Black, non-HispanicAll education levels ............................... 22.7 (0.59) 30.1 (1.16) 19.3 (0.68) 7.7 (0.17) 23.8 (1.10) 33.2 (1.78) 19.9 (1.41) 8.3 (0.35) 22.4

Less than high school completion ..... 35.0 (1.30) 34.9 (1.62) 35.2 (2.15) 13.6 (0.63) 36.8 (1.88) 35.9 (2.12) 38.2 (4.07) 13.9 (1.02) 37.1High school completion, no college... 22.6 (0.97) 28.0 (2.00) 20.7 (1.10) 8.8 (0.30) 24.7 (2.11) 34.0 (4.38) 22.0 (2.39) 9.4 (0.63) 21.9Some college, no degree .................. 14.6 (0.97) 15.7 (2.62) 14.4 (1.04) 6.9 (0.34) 14.6 (1.90) 21.1 (4.95) 13.5 (2.05) 8.6 (0.81) 14.2Associate’s degree ............................ 13.3 (2.42) ‡ (†) 13.6 (2.46) 6.0 (0.49) 13.6 (5.71) ‡ (†) 12.8 (5.68) 6.1 (1.09) 6.9Bachelor’s or higher degree .............. 4.9 (1.43) ‡ (†) 5.0 (1.46) 4.2 (0.28) 6.8 (3.46) ‡ (†) 6.8 (3.47) 4.3 (0.62) 8.8

Hispanic origin3

All education levels ............................... 12.9 (0.40) 20.0 (0.88) 9.9 (0.42) 6.1 (0.15) 12.8 (0.78) 20.0 (1.44) 10.2 (0.93) 6.4 (0.30) 12.3Less than high school completion ..... 16.7 (0.68) 22.9 (1.19) 12.2 (0.78) 7.7 (0.27) 16.1 (1.19) 23.0 (1.75) 11.5 (1.66) 8.2 (0.52) 16.2High school completion, no college... 11.4 (0.66) 17.3 (1.59) 9.5 (0.70) 5.9 (0.27) 12.4 (1.50) 18.3 (3.47) 10.8 (1.64) 5.9 (0.55) 11.6Some college, no degree .................. 8.6 (0.75) 11.9 (2.04) 7.9 (0.80) 5.7 (0.37) 7.7 (1.48) 9.7 (3.57) 7.3 (1.62) 5.8 (0.81) 8.0Associate’s degree ............................ 7.5 (1.85) ‡ (†) 6.9 (1.84) 5.0 (0.54) 10.0 (4.49) ‡ (†) 10.2 (4.58) 5.3 (1.18) 8.0Bachelor’s or higher degree .............. 8.4 (1.85) ‡ (†) 8.5 (1.87) 3.4 (0.30) 11.1 (4.86) ‡ (†) 11.1 (4.87) 4.1 (0.71) 5.0

616 CHAPTER 5: Outcomes of EducationEducational Characteristics of the Workforce

_

#Rounds to zero.1Socioeconomic status (SES) was measured by a composite score of parental educationand occupations, and family income.NOTE: Detail may not sum to totals because of rounding.

SOURCE: U.S. Department of Education, National Center for Education Statistics, “TheNational Education Longitudinal Study of 1988 (NELS:88/92), “Second Follow-up, StudentSurvey, 1992.” (This table was prepared August 1995.)

Table 371. Employment characteristics of 12th-graders, by selected student and school characteristics: 1992

Employment characteristic Total

Sex Race/ethnicity Socioeconomic status1 Location of school attended

Male Female White Black Hispanic

Asian/Pacific

IslanderAmerican

Indian LowMiddle

lowMiddle

high High Urban Suburban Rural

1 2 3 4 5 6 7 8 9 10 11 12 13 14 15 16

Percentage distribution

Average hours worked per week during senior year

Total ............................. 100.0 100.0 100.0 100.0 100.0 100.0 100.0 100.0 100.0 100.0 100.0 100.0 100.0 100.0 100.0Did not work during year .......... 31.8 33.0 30.7 27.6 47.4 38.9 43.3 45.0 38.2 29.8 28.2 32.5 35.6 29.4 31.61 to 5 hours.............................. 6.8 6.0 7.6 7.0 4.9 6.0 9.5 8.5 5.2 5.5 5.8 10.1 6.7 6.6 7.26 to 10 hours............................ 9.8 8.9 10.7 11.2 6.5 5.3 6.7 5.6 6.7 8.3 10.6 12.6 9.4 9.6 10.611 to 15 hours.......................... 12.7 11.1 14.4 14.1 7.2 11.3 9.3 6.2 9.5 11.9 13.7 15.0 12.2 13.6 12.116 to 20 hours.......................... 16.1 15.0 17.2 17.3 11.9 13.3 13.5 12.5 13.4 18.6 18.4 14.0 14.3 18.3 14.9More than 20 hours.................. 22.7 26.0 19.5 22.8 22.1 25.2 17.7 22.3 27.1 25.9 23.3 15.8 21.7 22.5 23.7

21 to 25 hours ...................... 9.8 10.2 9.5 10.0 8.8 10.7 8.1 12.0 10.2 10.9 10.8 8.0 9.5 10.6 9.126 to 30 hours ...................... 5.6 6.5 4.8 5.5 6.4 6.6 4.4 3.8 6.8 6.4 5.9 3.4 5.3 5.7 5.831 to 35 hours ...................... 2.5 3.1 1.9 2.6 2.4 2.4 0.8 5.0 3.6 3.2 2.4 1.3 2.3 2.5 2.736 to 40 hours ...................... 3.3 4.2 2.4 3.3 2.9 4.1 3.7 0.9 4.3 4.2 2.7 2.1 3.3 2.4 4.3More than 40 hours.............. 1.5 2.0 1.0 1.5 1.7 1.4 0.8 0.7 2.2 1.4 1.6 1.0 1.3 1.4 1.8

Most recent type of work for employed students

Total ............................. 100.0 100.0 100.0 100.0 100.0 100.0 100.0 100.0 100.0 100.0 100.0 100.0 100.0 100.0 100.0Lawn work or odd jobs ............. 2.2 4.2 0.3 2.5 0.8 0.9 1.7 5.3 2.3 2.0 2.1 2.5 1.3 2.2 2.9Food service ............................ 24.0 22.2 25.7 22.8 34.8 24.8 22.9 24.6 28.0 26.6 25.1 18.6 23.6 23.1 25.4Delivery person........................ 1.6 2.5 0.6 1.5 1.9 1.1 3.2 1.3 0.8 1.7 1.3 2.1 1.5 1.7 1.5Babysitter or child care ............ 4.3 0.6 7.9 4.8 2.4 2.2 5.0 1.1 3.2 3.9 4.5 5.4 4.9 4.4 3.9Camp counselor/lifeguard ........ 0.7 0.8 0.7 0.9 # 0.5 0.6 # 0.2 0.3 0.9 1.3 0.8 0.9 0.5Farm worker............................. 2.2 4.4 0.1 2.7 # 1.1 # # 3.7 3.3 1.6 1.1 0.2 1.1 5.5Mechanic ................................. 1.4 2.8 # 1.5 0.7 1.5 1.0 1.4 2.0 1.8 1.5 0.6 1.0 1.3 1.9Grocery clerk or cashier .......... 14.5 12.5 16.4 14.8 15.9 11.6 8.5 25.7 15.5 16.6 14.5 12.3 14.2 13.4 16.4Beautician ................................ 0.2 0.1 0.3 0.1 1.1 0.3 # # 0.6 0.2 0.2 0.1 0.2 0.2 0.3House cleaning ........................ 0.9 0.7 1.1 0.8 0.8 2.0 0.6 # 1.5 0.6 1.2 0.6 0.7 0.6 1.4Construction............................. 2.0 4.0 0.1 2.1 1.0 1.9 0.9 2.0 2.6 2.3 1.9 1.4 1.4 1.8 2.7Office or clerical ....................... 6.9 2.9 10.7 6.3 9.2 8.7 12.1 5.8 6.3 6.0 7.2 8.0 9.0 6.8 5.4Health services ........................ 1.6 0.9 2.3 1.6 2.1 1.1 1.0 4.5 2.5 2.0 1.4 0.9 1.5 1.6 1.7Salesperson............................. 11.8 9.8 13.7 12.0 8.7 11.9 15.0 7.9 7.2 8.8 12.5 15.8 13.4 14.1 7.3Warehouse worker ................... 2.1 3.9 0.4 2.2 1.3 1.7 2.0 2.3 1.7 2.5 1.9 2.1 2.0 2.3 1.9Other ........................................ 23.5 27.7 19.6 23.5 19.3 28.8 25.4 18.3 22.0 21.4 22.3 27.4 24.4 24.6 21.3

Most recent hourly wage for employed students

Total ............................. 100.0 100.0 100.0 100.0 100.0 100.0 100.0 100.0 100.0 100.0 100.0 100.0 100.0 100.0 100.0Less than $4.25 per hour ......... 9.9 7.2 12.4 10.3 8.3 8.8 7.9 5.8 12.2 11.4 9.0 8.0 7.9 7.5 14.8$4.25 to $6.00 per hour ........... 77.5 75.6 79.2 76.7 80.9 81.1 77.0 79.3 79.0 76.8 80.0 74.8 80.1 77.0 75.8$6.01 to $8.00 per hour ........... 7.7 10.3 5.3 8.0 5.8 6.1 10.7 6.7 5.3 8.3 6.8 9.3 7.3 9.2 6.1

$8.01 or more per hour ............ 5.0 6.9 3.2 5.1 5.0 4.0 4.5 8.3 3.5 3.5 4.1 7.9 4.8 6.3 3.4

DIGEST OF EDUCATION STATISTICS 2005

CH

AP

TE

R 5: O

utcomes of E

ducation617

Recent H

igh School and C

ollege Graduates

DIG

ES

T O

F E

DU

CAT

ION

STAT

IST

ICS

2005

4

Not in labor force(in thousands)

Unemployed

Number(in thousands) Unemployment rate

9 10 11

228 (25.4) 14.2 (1.51) 1,193 (36.5)100 (16.9) 12.0 (1.93) 582 (35.1)129 (19.0) 16.6 (2.19) 610 (33.6)150 (20.6) 11.6 (1.54) 931 (30.5)62 (13.0) 30.3 (5.83) 182 (20.8)48 (11.6) 22.2 (5.15) 129 (18.6)98 (17.0) 11.8 (1.94) 996 (34.5)38 (10.6) 9.9 (2.60) 492 (33.2)60 (13.2) 13.4 (2.65) 503 (31.7)45 (11.6) 12.8 (3.09) 254 (19.4)53 (12.5) 11.1 (2.49) 742 (31.0)79 (15.3) 11.1 (2.04) 958 (34.0)19 (7.5) 16.3 (5.89) 38 (7.7)71 (14.4) 10.2 (2.00) 795 (29.3)22 (8.0) 25.4 (8.52) 141 (19.1)10 (5.4) 10.7 (5.88) 93 (16.3)

131 (19.5) 16.9 (2.33) 197 (17.2)61 (13.3) 13.8 (2.80) 90 (15.9)69 (14.1) 21.0 (3.68) 107 (16.5)80 (15.3) 13.1 (2.37) 136 (14.3)40 (10.6) 33.9 (7.88) 41 (11.3)38 (10.4) 30.6 (7.52) 36 (10.6)

280 (28.0) 19.0 (1.78) 1,208 (36.7)157 (20.9) 20.9 (2.54) 558 (34.6)123 (18.6) 16.9 (2.29) 650 (34.3)161 (21.4) 13.7 (1.74) 925 (32.2)83 (14.6) 51.0 (7.11) 170 (19.9)27 (8.8) 16.6 (5.30) 152 (19.5)82 (15.5) 11.5 (2.07) 998 (34.6)45 (11.5) 13.3 (3.15) 459 (32.4)36 (10.3) 9.5 (2.49) 539 (32.5)21 (7.9) 6.3 (2.32) 243 (19.0)61 (13.4) 16.0 (3.26) 756 (31.2)72 (14.6) 11.4 (2.19) 949 (34.0)10 (5.5) 12.5 (6.38) 49 (8.8)60 (13.3) 10.2 (2.17) 782 (30.6)13 (6.2) — (†) 139 (18.7)

7 (4.6) — (†) 117 (17.7)198 (23.8) 26.2 (2.77) 209 (17.7)111 (17.8) 27.2 (3.77) 98 (16.5)87 (15.8) 25.1 (3.81) 111 (16.8)

101 (17.1) 16.9 (2.66) 143 (14.7)70 (13.6) 65.1 (8.33) 30 (9.7)20 (7.6) 21.1 (7.59) 35 (10.4)

_

Table 372. College enrollment and labor force status of 2002, 2003, and 2004 high school completers, by sex and race/ethnicity: 2002, 2003, and 200

Selected characteristic

Civilian noninstitutional population Civilian labor force1

Number(in thousands) Percent

Percent of highschool completers

Number(in thousands)

Labor forceparticipation rate

Employed

Number(in thousands) Percent of population

1 2 3 4 5 6 7 8

2002 high school completers2

Total .......................................... 2,796 (36.9) 100.0 (†) 100.0 (†) 1,604 (39.1) 57.3 (1.18) 1,375 (37.9) 49.2 (1.19)Male ...................................................... 1,412 (36.7) 50.5 (1.62) 50.5 (1.62) 829 (38.3) 58.7 (2.24) 730 (37.3) 51.7 (2.28)Female .................................................. 1,384 (32.6) 49.5 (1.55) 49.5 (1.55) 774 (35.4) 55.9 (2.19) 645 (34.0) 46.6 (2.20)White3 ................................................... 2,231 (19.8) 79.8 (0.96) 79.8 (0.96) 1,300 (31.5) 58.3 (1.31) 1,150 (31.4) 51.5 (1.33)Black3.................................................... 387 (22.7) 13.8 (1.19) 13.8 (1.19) 205 (21.5) 53.0 (4.61) 143 (19.2) 36.9 (4.45)Hispanic origin4..................................... 344 (23.7) 12.3 (1.13) 12.3 (1.13) 215 (22.0) 62.6 (4.74) 167 (20.4) 48.7 (4.89)Enrolled in college, 2002....................... 1,824 (39.8) 100.0 (†) 65.2 (1.13) 829 (32.3) 45.4 (1.47) 731 (30.8) 40.1 (1.45)

Male .................................................. 877 (38.6) 48.1 (2.00) 31.4 (1.50) 385 (30.3) 43.9 (2.87) 347 (29.1) 39.5 (2.82)Female .............................................. 947 (36.1) 51.9 (1.92) 33.9 (1.47) 444 (30.4) 46.9 (2.66) 384 (28.8) 40.6 (2.62)2-year ................................................ 605 (28.6) 33.2 (1.39) 21.6 (0.98) 351 (22.5) 58.0 (2.53) 306 (21.2) 50.6 (2.56)4-year ................................................ 1,220 (36.7) 66.9 (1.39) 43.6 (1.18) 478 (25.8) 39.2 (1.76) 425 (24.6) 34.8 (1.72)Full-time students.............................. 1,668 (39.4) 91.4 (0.82) 59.7 (1.17) 711 (30.5) 42.6 (1.52) 632 (29.1) 37.9 (1.50)Part-time students ............................. 156 (15.4) 8.6 (0.82) 5.6 (0.55) 118 (13.5) 75.7 (4.32) 99 (12.4) 63.4 (4.86)White3 ............................................... 1,488 (31.0) 81.6 (1.14) 53.2 (1.19) 693 (28.2) 46.6 (1.63) 622 (27.2) 41.8 (1.61)Black3................................................ 227 (22.0) 12.4 (1.40) 8.1 (0.94) 86 (15.7) 37.9 (5.85) 64 (13.8) 28.3 (5.43)Hispanic origin4................................. 184 (21.0) 10.1 (1.28) 6.6 (0.85) 91 (16.1) 49.4 (6.69) 81 (15.3) 44.1 (6.65)

Not enrolled in college, 2002 ................ 972 (34.2) 100.0 (†) 34.8 (1.13) 775 (31.5) 79.7 (1.62) 644 (29.3) 66.3 (1.91)Male .................................................. 535 (34.1) 55.0 (2.73) 19.1 (1.27) 444 (32.0) 83.1 (2.77) 383 (30.3) 71.7 (3.33)Female .............................................. 437 (30.2) 45.0 (2.62) 15.6 (1.13) 330 (27.2) 75.6 (3.37) 261 (24.7) 59.7 (3.85)White3 ............................................... 743 (28.8) 76.4 (1.71) 26.6 (1.05) 607 (27.0) 81.7 (1.79) 528 (25.7) 71.0 (2.10)Black3................................................ 160 (19.9) 16.5 (2.16) 5.7 (0.80) 119 (17.9) 74.5 (6.26) 79 (15.1) 49.3 (7.18)Hispanic origin4................................. 160 (20.1) 16.5 (2.16) 5.7 (0.80) 124 (18.3) 77.7 (5.97) 86 (15.7) 54.0 (7.15)

2003 high school completers5

Total .......................................... 2,677 (38.1) 100.0 (†) 100.0 (†) 1,470 (38.6) 54.8 (1.21) 1,190 (36.5) 44.5 (1.21)Male ...................................................... 1,306 (37.8) 48.8 (1.65) 48.8 (1.65) 748 (37.5) 57.3 (2.34) 591 (35.2) 45.3 (2.36)Female .................................................. 1,372 (33.7) 51.3 (1.59) 51.3 (1.59) 722 (35.1) 52.6 (2.21) 599 (33.5) 43.7 (2.20)White3 ................................................... 2,106 (33.5) 78.7 (1.00) 78.7 (1.00) 1,181 (34.3) 56.1 (1.36) 1,020 (33.1) 48.4 (1.37)Black3.................................................... 333 (21.6) 12.4 (1.16) 12.4 (1.16) 163 (19.6) 48.9 (4.97) 80 (15.1) 24.0 (4.25)Hispanic origin4..................................... 314 (22.9) 11.7 (1.13) 11.7 (1.13) 162 (20.0) 51.7 (5.12) 135 (18.7) 43.2 (5.08)Enrolled in college, 2003....................... 1,711 (39.6) 100.0 (†) 63.9 (1.17) 713 (30.5) 41.7 (1.50) 631 (29.1) 36.9 (1.47)

Male .................................................. 799 (38.0) 46.7 (2.06) 29.8 (1.51) 339 (28.8) 42.4 (2.99) 294 (27.2) 36.7 (2.92)Female .............................................. 913 (36.4) 53.4 (1.98) 34.1 (1.50) 374 (28.6) 41.0 (2.67) 338 (27.5) 37.1 (2.62)2-year ................................................ 574 (28.0) 33.5 (1.44) 21.4 (1.00) 332 (22.0) 57.8 (2.60) 311 (21.3) 54.2 (2.62)4-year ................................................ 1,137 (36.0) 66.5 (1.44) 42.5 (1.20) 381 (23.4) 33.5 (1.76) 320 (21.6) 28.1 (1.68)Full-time students.............................. 1,580 (39.1) 92.3 (0.81) 59.0 (1.20) 631 (29.1) 39.9 (1.55) 559 (27.7) 35.4 (1.51)Part-time students ............................. 131 (14.2) 7.7 (0.81) 4.9 (0.53) 81 (11.2) 61.9 (5.34) 72 (10.6) 54.9 (5.48)White3 ............................................... 1,368 (35.1) 80.0 (1.22) 51.1 (1.22) 586 (27.5) 42.8 (1.68) 525 (26.4) 38.4 (1.66)Black3................................................ 194 (20.6) 11.3 (1.39) 7.2 (0.91) 55 (12.8) 28.4 (5.87) 42 (11.3) 21.7 (5.38)Hispanic origin4................................. 184 (20.8) 10.8 (1.36) 6.9 (0.89) 67 (14.1) 36.3 (6.44) 60 (13.4) 32.7 (6.28)

Not enrolled in college, 2003 ................ 966 (34.2) 100.0 (†) 36.1 (1.17) 757 (31.3) 78.4 (1.67) 558 (27.6) 57.8 (2.00)Male .................................................. 507 (33.5) 52.5 (2.75) 18.9 (1.30) 409 (31.0) 80.8 (2.99) 297 (27.3) 58.7 (3.74)Female .............................................. 459 (30.8) 47.5 (2.64) 17.1 (1.20) 348 (27.8) 75.9 (3.28) 261 (24.7) 56.9 (3.79)White3 ............................................... 738 (30.0) 76.4 (1.72) 27.6 (1.09) 595 (27.7) 80.6 (1.83) 494 (25.7) 66.8 (2.18)Black3................................................ 139 (18.7) 14.4 (2.05) 5.2 (0.78) 108 (17.0) 77.8 (6.40) 38 (10.8) 27.2 (6.86)Hispanic origin4................................. 130 (18.5) 13.5 (1.99) 4.9 (0.75) 95 (16.3) 73.3 (7.05) 75 (14.8) 57.9 (7.86)

See notes at end of table.

618C

HA

PT

ER

5: Outcom

es of Education

Recent H

igh School and C

ollege GraduatesD

IGE

ST

OF

ED

UC

ATIO

N S

TATIS

TIC

S 2005

are based upon sample surveys of the civilian noninstitutional0 or greater. Even though the standard errors are large, smaller in various ways. Detail for the above race and Hispanic-origin groups are not presented and Hispanics are included in both theeen revised from previous years. Detail may not sum to totals.tics, College Enrollment and Work Activity of High School Gradu-mber 2005.)

251 (26.6) 16.4 (1.64) 1,219 (36.8)

119 (18.4) 15.6 (2.24) 562 (34.8)132 (19.2) 17.2 (2.23) 657 (34.1)

174 (22.2) 14.4 (1.75) 900 (32.1)51 (11.8) 25.1 (5.51) 213 (20.6)23 (8.2) 15.3 (5.29) 133 (18.7)

109 (17.9) 13.3 (2.05) 1,013 (34.7)54 (12.6) 15.6 (3.33) 468 (32.7)55 (12.7) 11.6 (2.41) 545 (32.4)57 (13.0) 15.0 (3.18) 240 (18.9)52 (12.4) 11.8 (2.66) 773 (31.5)95 (16.7) 13.3 (2.19) 991 (34.5)14 (6.5) 13.5 (5.87) 22 (5.9)84 (15.7) 12.2 (2.16) 759 (30.4)19 (7.4) 21.3 (7.79) 163 (19.3)

7 (4.6) — (†) 103 (16.9)142 (20.3) 20.0 (2.60) 206 (17.6)65 (13.8) 15.6 (3.03) 94 (16.2)77 (14.9) 26.2 (4.21) 112 (16.9)91 (16.3) 17.3 (2.86) 141 (14.6)32 (9.5) 28.2 (7.72) 49 (12.1)16 (6.8) 20.4 (8.22) 31 (9.9)

4—Continued

Not in labor force(in thousands)

Unemployed

Number(in thousands) Unemployment rate

9 10 11

—Not available.†Not applicable.1The labor force includes all employed persons plus those seeking employment. The labor force participation rate is the per-centage of persons either employed or seeking employment.2Includes 16- to 24-year-olds who completed high school between January and October 2002.3Includes persons of Hispanic origin.4Persons of Hispanic origin may be of any race.5Includes 16- to 24-year-olds who completed high school between January and October 2003.6Includes 16- to 24-year-olds who completed high school between January and October 2004.

NOTE: Enrollment data are for October of given year. Datapopulation. Percents are only shown when the base is 75,00estimates are shown to permit users to combine categoriesgroups will not sum to totals because data for the other racialWhite and Black population groups. Standard errors have bbecause of rounding. Standard errors appear in parenthesesSOURCE: U.S. Department of Labor, Bureau of Labor Statisates, 2002, 2003, and 2004. (This table was prepared Septe

2004 high school completers6

Total .......................................... 2,752 (37.5) 100.0 (†) 100.0 (†) 1,533 (38.9) 55.7 (1.19) 1,282 (37.3) 46.6 (1.20)

Male ...................................................... 1,327 (38.3) 48.2 (1.63) 48.2 (1.63) 764 (37.9) 57.6 (2.32) 645 (36.3) 48.6 (2.35)Female .................................................. 1,425 (31.6) 51.8 (1.56) 51.8 (1.56) 768 (35.3) 53.9 (2.17) 636 (33.9) 44.6 (2.16)

White3 ................................................... 2,111 (34.1) 76.7 (1.01) 76.7 (1.01) 1,211 (34.7) 57.4 (1.36) 1,037 (33.4) 49.1 (1.37)Black3.................................................... 416 (17.5) 15.1 (1.24) 15.1 (1.24) 204 (20.4) 48.9 (4.45) 152 (18.9) 36.6 (4.29)Hispanic origin4..................................... 286 (23.0) 10.4 (1.06) 10.4 (1.06) 153 (19.7) 53.5 (5.35) 129 (18.5) 45.3 (5.34)Enrolled in college, 2004....................... 1,835 (39.9) 100.0 (†) 66.7 (1.13) 821 (32.2) 44.8 (1.46) 712 (30.5) 38.8 (1.43)

Male .................................................. 815 (38.4) 44.4 (1.98) 29.6 (1.49) 347 (29.2) 42.6 (2.96) 293 (27.2) 35.9 (2.87)Female .............................................. 1,020 (35.9) 55.6 (1.90) 37.1 (1.51) 475 (31.0) 46.6 (2.56) 420 (29.7) 41.1 (2.53)2-year ................................................ 618 (28.8) 33.7 (1.39) 22.5 (1.00) 378 (23.3) 61.1 (2.47) 321 (21.7) 51.9 (2.53)4-year ................................................ 1,217 (36.8) 66.3 (1.39) 44.2 (1.19) 444 (25.0) 36.5 (1.74) 392 (23.7) 32.2 (1.69)Full-time students.............................. 1,711 (39.6) 93.2 (0.74) 62.2 (1.16) 720 (30.6) 42.1 (1.50) 624 (28.9) 36.5 (1.47)Part-time students ............................. 124 (13.8) 6.8 (0.74) 4.5 (0.50) 102 (12.6) 82.4 (4.31) 88 (11.7) 71.3 (5.12)White3 ............................................... 1,444 (35.6) 78.7 (1.20) 52.5 (1.20) 685 (29.3) 47.5 (1.66) 602 (27.9) 41.7 (1.63)Black3................................................ 254 (21.0) 13.8 (1.46) 9.2 (1.00) 91 (15.8) 35.9 (5.47) 72 (14.3) 28.2 (5.13)Hispanic origin4................................. 177 (20.6) 9.6 (1.25) 6.4 (0.85) 74 (14.7) 41.8 (6.73) 67 (14.1) 37.8 (6.62)

Not enrolled in college, 2004 ................ 918 (33.6) 100.0 (†) 33.4 (1.13) 711 (30.5) 77.5 (1.74) 569 (27.9) 62.1 (2.02)Male .................................................. 512 (33.7) 55.8 (2.80) 18.6 (1.27) 418 (31.4) 81.6 (2.93) 353 (29.4) 68.9 (3.50)Female .............................................. 406 (29.4) 44.2 (2.69) 14.8 (1.11) 294 (25.9) 72.4 (3.64) 217 (22.8) 53.5 (4.06)White3 ............................................... 667 (29.0) 72.7 (1.85) 24.2 (1.03) 526 (26.4) 78.8 (1.99) 435 (24.4) 65.2 (2.32)Black3................................................ 162 (19.3) 17.6 (2.28) 5.9 (0.81) 112 (17.1) 69.4 (6.57) 81 (15.1) 49.8 (7.13)Hispanic origin4................................. 109 (17.3) 11.9 (1.94) 4.0 (0.67) 79 (15.1) 72.1 (7.80) 63 (13.7) 57.3 (8.60)

Table 372. College enrollment and labor force status of 2002, 2003, and 2004 high school completers, by sex and race/ethnicity: 2002, 2003, and 200

Selected characteristic

Civilian noninstitutional population Civilian labor force1

Number(in thousands) Percent

Percent of highschool completers

Number(in thousands)

Labor forceparticipation rate

Employed

Number(in thousands) Percent of population

1 2 3 4 5 6 7 8

CHAPTER 5: Outcomes of Education 619Recent High School and College Graduates

cent H

_

†Not applicable.‡Reporting standards not met.1The labor force includes all employed persons plus those seeking employment. The laborforce participation rate is the percentage of persons either employed or seeking employ-ment. The unemployment rate is the percent of persons in the labor force who are seekingemployment.2Persons 16 to 24 years old who dropped out of school in the 12-month period ending inOctober of years shown.3Includes persons of Hispanic origin.4Persons of Hispanic origin may be of any race.

NOTE: Data are based upon sample surveys of the civilian noninstitutional population.Includes dropouts from any grade, including a small number from elementary and middleschools. Even though the standard errors are large, smaller estimates are shown to permitusers to combine categories in various ways. Detail for the above race and Hispanic-origingroups will not sum to totals because data for the other racial groups are not presented andHispanics are included in both the White and Black population groups. Some data havebeen revised from previously published figures. Detail may not sum to totals because ofrounding. Standard errors appear in parentheses.SOURCE: U.S. Department of Labor, Bureau of Labor Statistics, College Enrollment andWork Activity of High School Graduates, selected years, 1980 through 2004 and unpub-lished tabulations. (This table was prepared October 2005.)

ReTable 373. Labor force status of high school dropouts, by sex and race/ethnicity: Selected years, 1980 through 2004

Year, sex, and race or ethnicity

Dropouts Dropouts in civilian labor force1 Dropouts not in labor force

Number(in thousands) Percent of total

Number(in thousands)

Labor forceparticipation rate

Unemployed

Number(in thousands)

Percentof population

Number(in thousands)

Unemploymentrate

1 2 3 4 5 6 7 8 9

All dropouts2

1980............................................... 739 (33.5) 100.0 (†) 471 (26.7) 63.7 (2.18) 149 (20.7) 31.6 (2.64) 268 (20.2) 36.3 (2.18)1985............................................... 612 (30.5) 100.0 (†) 413 (25.1) 67.5 (2.34) 147 (20.6) 35.6 (2.91) 199 (17.4) 32.5 (2.34)1990............................................... 405 (25.7) 100.0 (†) 280 (21.4) 69.0 (2.94) 90 (16.7) 32.3 (3.57) 125 (14.3) 31.0 (2.94)1995............................................... 604 (31.4) 100.0 (†) 409 (25.8) 67.7 (2.43) 121 (19.3) 29.6 (2.88) 195 (17.8) 32.3 (2.43)2000............................................... 515 (39.1) 100.0 (†) 350 (32.3) 68.0 (3.55) 99 (17.1) 28.1 (4.15) 165 (22.2) 32.0 (3.55)2001............................................... 506 (28.3) 100.0 (†) 324 (22.7) 64.0 (2.69) 116 (18.7) 35.9 (3.36) 182 (17.0) 36.0 (2.69)2002............................................... 401 (25.2) 100.0 (†) 271 (20.7) 67.7 (2.94) 81 (15.6) 29.8 (3.50) 129 (14.3) 32.3 (2.94)2003............................................... 457 (26.9) 100.0 (†) 271 (20.7) 59.3 (2.89) 84 (15.9) 30.8 (3.53) 186 (17.2) 40.7 (2.89)2004............................................... 496 (28.0) 100.0 (†) 267 (20.6) 53.7 (2.82) 106 (17.8) 39.9 (3.77) 229 (19.0) 46.3 (2.82)

Male1980............................................... 422 (32.5) 57.1 (3.82) 305 (27.7) 72.3 (3.46) 93 (15.3) 30.5 (4.18) 117 (17.1) 27.7 (3.46)1985............................................... 321 (30.0) 52.5 (4.67) 261 (27.0) 81.3 (3.65) 98 (16.6) 37.5 (5.02) 60 (13.0) 18.7 (3.65)1990............................................... 215 (25.4) 53.1 (5.91) 173 (22.8) 80.2 (4.72) 63 (13.8) 36.2 (6.34) 42 (11.2) 19.8 (4.72)1995............................................... 339 (31.9) 56.1 (4.68) 251 (27.5) 74.0 (4.13) 72 (14.7) 28.7 (4.96) 88 (16.3) 26.0 (4.13)2000............................................... 295 (28.5) 57.3 (4.79) 220 (24.6) 74.4 (4.23) 54 (12.2) 24.5 (4.82) 76 (14.5) 25.6 (4.23)2001............................................... 298 (29.5) 58.9 (4.88) 198 (24.0) 66.5 (4.68) 68 (14.1) 34.2 (5.77) 100 (17.1) 33.5 (4.68)2002............................................... 214 (25.0) 53.4 (5.83) 149 (20.9) 69.5 (5.38) 35 (10.1) 23.4 (5.93) 65 (13.8) 30.5 (5.38)2003............................................... 242 (26.6) 53.0 (5.49) 159 (21.6) 65.6 (6.45) 53 (12.5) 33.2 (6.39) 83 (15.6) 34.4 (5.22)2004............................................... 278 (28.5) 56.0 (5.09) 166 (22.0) 59.9 (6.51) 67 (14.0) 40.4 (6.51) 112 (18.1) 40.1 (5.03)

Female1980............................................... 317 (27.0) 42.9 (4.23) 166 (19.6) 52.4 (4.27) 56 (11.4) 33.7 (5.58) 151 (18.7) 47.6 (4.27)1985............................................... 291 (27.4) 47.5 (4.71) 152 (19.8) 52.2 (4.71) 49 (11.3) 32.2 (6.10) 139 (18.9) 47.8 (4.71)1990............................................... 190 (22.9) 46.9 (6.03) 107 (17.2) 56.3 (5.99) 28 (8.8) 26.1 (7.07) 83 (15.2) 43.7 (5.99)1995............................................... 265 (27.1) 43.9 (5.08) 157 (20.8) 59.5 (5.02) 49 (11.7) 30.9 (6.14) 107 (17.2) 40.5 (5.02)2000............................................... 220 (23.6) 42.7 (5.30) 131 (18.2) 59.4 (5.27) 45 (10.7) 34.2 (6.59) 90 (15.1) 40.6 (5.27)2001............................................... 207 (23.6) 40.9 (5.61) 126 (18.4) 60.6 (5.57) 48 (11.4) 38.6 (7.12) 82 (14.9) 39.4 (5.57)2002............................................... 187 (22.4) 46.6 (5.99) 122 (18.1) 65.6 (5.70) 46 (11.1) 37.6 (7.20) 64 (13.1) 34.4 (5.70)2003............................................... 215 (24.0) 47.0 (5.59) 112 (17.4) 52.1 (5.59) 31 (9.1) 27.6 (6.93) 103 (16.6) 47.9 (5.59)2004............................................... 218 (24.2) 44.0 (5.52) 100 (16.4) 45.9 (5.54) 39 (10.2) 38.9 (8.00) 118 (17.8) 54.1 (5.54)

White3

1980............................................... 580 (29.7) 78.5 (2.11) 392 (24.4) 67.6 (2.40) 106 (17.5) 27.0 (2.77) 188 (16.9) 32.4 (2.40)1985............................................... 458 (26.4) 74.8 (2.50) 330 (22.4) 72.1 (2.59) 116 (18.3) 35.2 (3.24) 128 (14.0) 27.9 (2.59)1990............................................... 303 (22.2) 74.8 (3.19) 211 (18.6) 69.8 (3.37) 56 (13.2) 26.3 (3.88) 92 (12.3) 30.2 (3.37)1995............................................... 448 (27.0) 74.2 (2.64) 312 (22.6) 69.8 (2.77) 85 (16.2) 27.2 (3.22) 135 (14.8) 30.2 (2.77)2000............................................... 384 (33.8) 74.6 (3.84) 280 (28.9) 73.0 (3.91) 70 (14.4) 24.9 (4.46) 104 (17.6) 27.0 (3.91)2001............................................... 401 (25.2) 79.2 (2.55) 273 (20.8) 68.1 (2.93) 89 (16.3) 32.4 (3.57) 128 (14.2) 31.9 (2.93)2002............................................... 281 (21.1) 70.1 (3.44) 188 (17.3) 67.0 (3.53) 48 (12.0) 25.6 (4.01) 93 (12.1) 33.0 (3.53)2003............................................... 336 (23.1) 73.5 (3.03) 215 (18.5) 64.0 (3.30) 58 (13.2) 27.1 (3.82) 121 (13.8) 36.0 (3.30)2004............................................... 370 (24.2) 74.6 (2.85) 196 (17.6) 53.0 (3.27) 56 (13.0) 28.8 (4.07) 174 (16.6) 47.0 (3.27)

Black3

1980............................................... 146 (20.3) 19.8 (5.55) 73 (14.4) 50.0 (6.97) 40 (10.6) ‡ (†) 73 (14.4) 50.0 (6.97)1985............................................... 132 (20.4) 21.6 (6.37) 69 (14.7) 52.3 (7.73) 30 (9.7) ‡ (†) 63 (14.1) 47.7 (7.73)1990............................................... 86 (17.0) 21.2 (8.13) 56 (13.8) 65.3 (9.46) 30 (10.1) ‡ (†) 30 (10.1) 34.7 (9.46)1995............................................... 109 (19.2) 18.0 (6.79) 66 (14.9) 61.0 (8.61) 27 (9.6) ‡ (†) 42 (11.9) 39.0 (8.61)2000............................................... 111 (18.6) 21.5 (6.90) 58 (13.5) 51.9 (8.40) 27 (9.2) ‡ (†) 53 (12.9) 48.1 (8.40)2001............................................... 85 (15.8) 16.8 (6.96) 42 (11.1) 49.9 (9.31) 21 (7.9) ‡ (†) 43 (11.2) 50.1 (9.31)2002............................................... 79 (16.1) 19.7 (8.12) 55 (13.4) 69.8 (9.38) 27 (9.4) ‡ (†) 24 (8.9) 30.2 (9.38)2003............................................... 88 (17.0) 19.3 (7.63) 42 (11.8) 47.8 (9.67) 19 (7.9) ‡ (†) 46 (12.3) 52.2 (9.67)2004............................................... 91 (17.3) 18.3 (7.37) 50 (12.8) 54.4 (9.48) 39 (11.3) ‡ (†) 42 (11.8) 45.6 (9.48)

Hispanic4

1980............................................... 91 (18.9) 12.3 (6.85) 60 (15.4) 65.9 (9.88) 17 (8.2) ‡ (†) 31 (11.1) 34.1 (9.88)1985............................................... 106 (18.3) 17.3 (6.54) 73 (15.2) 68.9 (8.00) 33 (10.2) ‡ (†) 33 (10.2) 31.1 (8.00)1990............................................... 67 (15.1) 16.5 (8.36) 32 (10.4) ‡ (†) 10 (5.8) ‡ (†) 35 (10.9) ‡ (†)1995............................................... 174 (24.2) 28.8 (6.33) 119 (20.0) 68.6 (6.48) 35 (10.9) 29.3 (7.69) 55 (13.6) 31.4 (6.48)2000............................................... 101 (19.8) 19.6 (7.80) 62 (15.5) 61.1 (9.58) 22 (8.9) ‡ (†) 39 (12.3) 38.9 (9.58)2001............................................... 119 (21.5) 23.5 (7.67) 84 (18.1) 70.6 (8.24) 27 (10.2) 32.6 (10.10) 35 (11.7) 29.4 (8.24)2002............................................... 94 (17.6) 23.4 (7.93) 62 (14.3) 66.5 (8.84) 23 (8.7) ‡ (†) 31 (10.1) 33.5 (8.84)2003............................................... 124 (20.1) 27.1 (7.25) 68 (14.9) 54.5 (8.12) 17 (7.5) ‡ (†) 57 (13.7) 45.5 (8.12)2004............................................... 154 (22.4) 31.0 (6.77) 87 (16.9) 56.8 (7.25) 27 (9.4) 30.7 (8.98) 67 (14.8) 43.2 (7.25)

DIGEST OF EDUCATION STATISTICS 2005

620 CHAPTER 5: Outcomes of EducationRecent High School and College Graduates

_

—Not available.†Not applicable.1Includes those who have not finished all requirements for teaching certification or werepreviously qualified to teach.2Includes computer sciences.NOTE: Data are from sample surveys of recent college graduates. Notes on methodologyare included in the Guide to Sources. Data exclude bachelor’s recipients from U.S. Service

Schools, deceased graduates, and graduates living at foreign addresses at the time of thesurvey. Standard errors appear in parentheses.SOURCE: U.S. Department of Education, National Center for Education Statistics, “RecentCollege Graduates” surveys, 1976 through 1991; and 2000/01 Baccalaureate and BeyondLongitudinal Study (B&B:2000/01). (This table was prepared September 2003.)

Table 374. Full-time employment status of bachelor’s degree recipients 1 year after graduation, by field of study: Selected years, 1976 to 2001

Field of study

Percent employed full time Percent employed full time in a job closely related to field of study

1974–75graduates

in May1976

1979–80graduates

in May1981

1983–84graduates

in June1985

1985–86graduates

in June1987

1989–90graduates

in June1991

1999–2000graduates

in July2001

1974–75graduates

in May1976

1979–80graduates

in May1981

1983–84graduates

in June1985

1985–86graduates

in June1987

1989–90graduates

in June1991

1999–2000graduates

in July2001

1 2 3 4 5 6 7 8 9 10 11 12 13

Total ................................................................. 67 71 73 74 74 84 (0.6) 35 38 38 38 39 52 (0.8)

Professional/technical fields ........................................ 77 80 82 81 80 88 (0.8) 51 51 47 47 48 63 (1.3)

Arts and sciences fields............................................... 56 56 56 62 64 77 (1.1) 18 17 15 25 26 39 (1.3)

Other............................................................................ 65 74 75 74 73 88 (1.2) 36 43 47 36 38 45 (2.2)

Newly qualified to teach............................................... 66 75 73 68 74 82 (1.0) 43 56 54 47 58 44 (1.3)

Not newly qualified to teach......................................... 67 71 73 74 73 86 (0.7) 33 36 36 37 36 56 (1.1)Professional/technical fields..................................... 80 81 82 82 83 89 (0.9) 52 49 47 47 48 66 (1.5)

Engineering.......................................................... 79 84 84 83 84 87 (2.3) 57 55 53 46 50 71 (3.3)Business and management ................................. 84 83 85 85 83 93 (1.2) 49 44 41 40 42 62 (2.3)Health................................................................... 75 77 75 76 86 84 (1.7) 71 66 70 65 83 81 (2.3)Education1 ........................................................... 66 67 63 73 67 81 (6.9) 22 29 24 57 39 30 (9.2)Public affairs and services ................................... — 77 74 72 66 87 (2.8) — 46 31 37 49 58 (4.6)

Arts and sciences fields........................................... 57 56 56 63 64 77 (1.5) 17 16 15 25 23 42 (1.8)Biological sciences............................................... 56 45 43 42 50 66 (3.9) 26 18 17 15 26 47 (5.0)Physical sciences and mathematics2................... 50 58 51 76 72 89 (2.3) 19 29 20 48 48 66 (3.4)Psychology........................................................... 61 56 57 66 59 80 (3.2) 22 17 12 22 22 37 (4.5)Social sciences .................................................... 59 61 61 61 68 76 (2.8) 12 10 13 12 16 25 (3.1)Humanities ........................................................... 56 55 59 59 59 72 (3.5) 12 14 17 19 11 41 (3.9)

Other ........................................................................ 68 75 77 75 73 89 (1.5) 36 43 42 36 37 48 (2.8)Communications .................................................. — 71 76 77 75 — (†) — 31 31 33 29 — (†)Miscellaneous ...................................................... 66 76 77 74 73 — (†) 35 46 46 38 38 — (†)

DIGEST OF EDUCATION STATISTICS 2005

CH

AP

TE

R 5: O

utcomes of E

ducation621

Recent H

igh School and C

ollege Graduates

DIG

ES

T O

F E

DU

CAT

ION

STAT

IST

ICS

2005

an $500,000 were excluded.ndard errors appear in parentheses.r Education Statistics, 2000/01 Baccalaureate and Beyond Lon-tember 2003.)

t status, employment status, occupational area,

s and sciences

History Humanities Psychology Other fields

11 12 13 14

100.0 (†) 100.0 (†) 100.0 (†) 100.0 (†)

42.5 (4.42) 38.1 (2.07) 42.8 (2.37) 31.3 (1.55)18.3 (2.95) 20.2 (1.50) 18.4 (1.86) 26.3 (1.38)7.4 (1.14) 11.6 (1.14) 8.5 (1.14) 11.2 (1.14)

12.3 (2.74) 15.4 (1.55) 14.0 (1.78) 14.3 (1.40)19.5 (3.47) 14.8 (1.45) 16.4 (1.92) 17.0 (1.45)

16.7 (2.48) 14.7 (1.24) 23.3 (2.02) 11.1 (0.97)12.2 (3.20) 6.5 (0.94) 7.7 (1.15) 5.0 (0.72)71.1 (3.67) 78.9 (1.53) 69.0 (2.13) 83.9 (1.18)

88.7 (2.27) 85.2 (1.49) 80.8 (1.97) 87.0 (1.02)76.8 (2.99) 67.5 (1.83) 64.0 (2.50) 78.6 (1.27)11.9 (2.11) 17.7 (1.55) 16.8 (1.92) 8.4 (0.86)

5.5 (1.80) 8.1 (1.07) 9.8 (1.58) 7.8 (0.78)5.8 (1.47) 6.7 (0.93) 9.5 (1.38) 5.2 (0.74)

7.2 (2.06) 4.9 (1.02) 3.9 (0.92) 3.9 (0.69)100.0 (†) 100.0 (†) 100.0 (†) 100.0 (†)

22.5 (4.14) 18.1 (1.65) 19.8 (2.24) 22.9 (1.51)24.0 (3.90) 24.5 (1.72) 21.9 (2.36) 14.2 (1.26)

# (†) 0.5 (0.37) # (†) 3.9 (0.76)2.0 (1.97) 1.5 (0.42) 7.9 (1.28) 3.6 (0.67)9.1 (2.34) 10.8 (1.28) 21.2 (2.09) 14.7 (1.19)1.8 (0.97) 5.4 (0.99) 2.1 (0.73) 4.8 (0.94)7.6 (2.15) 8.6 (1.05) 5.9 (1.39) 5.1 (0.73)8.3 (2.47) 4.7 (0.85) 2.0 (1.01) 4.8 (0.75)

11.1 (2.44) 6.8 (1.07) 4.3 (0.93) 12.3 (1.13)12.2 (2.84) 18.5 (1.60) 11.3 (1.74) 10.7 (1.15)1.5 (0.88) 0.6 (0.29) 3.5 (1.02) 2.9 (0.64)

58.9 (4.08) 61.7 (1.98) 56.6 (2.84) 68.1 (1.62)24.8 (3.78) 41.3 (1.95) 35.8 (2.82) 47.0 (2.14)

3.3 (2.14) 1.8 (0.42) 5.5 (1.48) 1.3 (0.45)2.0 (0.85) 5.4 (0.98) 4.1 (1.24) 3.0 (0.60)8.1 (3.02) 9.1 (1.10) 7.8 (1.85) 7.4 (1.01)

11.2 (2.63) 14.7 (1.43) 18.9 (1.99) 15.0 (1.36)47.2 (4.85) 43.3 (2.25) 41.1 (3.12) 37.3 (2.03)26.9 (4.48) 20.2 (1.86) 16.1 (2.38) 24.4 (1.73)1.3 (1.08) 4.9 (1.05) 4.8 (1.22) 9.5 (1.25)

# (†) 0.7 (0.32) 1.8 (1.13) 2.2 (0.60)

9,984 (1,053.2) $30,102 (846.5) $28,835 (905.7) $32,780 (627.5)

_

†Not applicable.#Rounds to zero.1Percent of all persons (including those not in the labor force) who are not working, but are looking for work.2Percent not working and not looking for work.3Percent of persons in the labor force (excluding those not in the labor force) who are not working, but are looking for work.4All other professional occupations excluding business, teaching, engineering, and health.

5Salaries for those employed full time.6Respondents reporting salaries less than $1,000 or more thNOTE: Detail may not sum to totals because of rounding. StaSOURCE: U.S. Department of Education, National Center fogitudinal Study (B&B:2000/01). (This table was prepared Sep

Table 375. Percentage distribution of 1999–2000 bachelor’s degree recipients 1 year after graduation, by field of study, time to completion, enrollmenjob characteristics, and annual salaries: 2001

Status All fieldsof study

Professional/technical fields Art

Business andmanagement Education Engineering

Healthprofessions

Publicaffairs and social

servicesBiologicalsciences

Mathematicsand physical

sciences Social sciences

1 2 3 4 5 6 7 8 9 10

Total 1999–2000 graduates ........... 100.0 (†) 100.0 (†) 100.0 (†) 100.0 (†) 100.0 (†) 100.0 (†) 100.0 (†) 100.0 (†) 100.0 (†)

Time between high school graduation and degree completion

4 years or less .......................................... 32.7 (0.79) 28.2 (1.72) 25.6 (1.80) 23.0 (2.26) 26.2 (2.05) 27.6 (2.58) 44.5 (2.40) 32.5 (2.42) 44.7 (2.37)More than 4, up to 5 years ....................... 22.9 (0.59) 19.7 (1.40) 25.8 (1.67) 32.4 (2.49) 21.5 (1.75) 23.1 (2.70) 24.6 (2.27) 22.2 (2.00) 22.1 (1.98)More than 5, up to 6 years ....................... 10.8 (0.48) 10.0 (1.14) 14.2 (1.14) 15.3 (1.14) 11.1 (1.14) 9.1 (1.14) 6.5 (1.14) 11.8 (1.14) 9.5 (1.14)More than 6, up to 10 years ..................... 14.8 (0.56) 15.3 (1.49) 15.7 (1.66) 15.4 (2.13) 14.9 (1.59) 15.7 (2.93) 16.6 (2.18) 15.0 (2.06) 11.5 (1.43)More than 10 years .................................. 18.9 (0.62) 26.8 (1.78) 18.6 (1.79) 13.9 (1.81) 26.3 (1.77) 24.6 (2.71) 7.8 (1.44) 18.4 (2.13) 12.2 (1.52)

Enrollment status Enrolled full-time....................................... 14.2 (0.49) 7.0 (0.91) 6.8 (1.00) 9.7 (1.47) 16.4 (1.35) 11.5 (1.86) 41.5 (2.79) 17.2 (2.00) 23.9 (2.00)Enrolled part-time..................................... 6.5 (0.31) 5.4 (0.80) 11.2 (1.15) 8.9 (1.55) 5.6 (1.00) 7.6 (1.76) 4.0 (0.92) 7.2 (1.40) 4.7 (0.90)Not enrolled .............................................. 79.4 (0.54) 87.6 (1.09) 82.0 (1.45) 81.4 (2.03) 78.1 (1.62) 80.9 (2.34) 54.6 (2.73) 75.6 (2.38) 71.5 (2.14)

Employment statusEmployed.................................................. 87.4 (0.44) 91.8 (1.05) 93.9 (0.91) 93.0 (1.39) 88.5 (1.25) 90.9 (1.90) 70.2 (2.49) 88.4 (1.59) 81.2 (1.70)

Full time................................................ 76.5 (0.54) 85.5 (1.29) 84.0 (1.44) 86.0 (1.78) 74.8 (1.67) 85.1 (2.21) 52.6 (2.78) 80.7 (2.02) 66.0 (2.18)Part time............................................... 10.9 (0.42) 6.2 (0.90) 9.8 (1.15) 6.9 (1.23) 13.7 (1.29) 5.8 (1.23) 17.6 (1.88) 7.7 (1.23) 15.2 (1.71)

Unemployed1............................................ 6.2 (0.33) 5.4 (0.90) 2.2 (0.49) 4.4 (1.06) 4.9 (0.90) 4.9 (1.32) 6.7 (1.31) 4.4 (1.06) 7.8 (1.08)Not in labor force2 .................................... 6.4 (0.32) 2.9 (0.59) 4.0 (0.74) 2.7 (0.83) 6.6 (0.89) 4.2 (1.04) 23.2 (2.26) 7.3 (1.26) 11.0 (1.40)

Unemployment rate3.................................... 4.0 (0.33) 2.9 (0.65) 2.6 (1.38) 2.9 (0.86) 3.1 (0.78) 3.5 (1.01) 8.6 (2.08) 2.8 (1.09) 6.1 (1.25)Total employed ............................... 100.0 (†) 100.0 (†) 100.0 (†) 100.0 (†) 100.0 (†) 100.0 (†) 100.0 (†) 100.0 (†) 100.0 (†)

OccupationBusiness management............................. 25.3 (0.57) 55.4 (1.78) 4.2 (0.83) 11.1 (1.85) 10.8 (1.37) 19.0 (2.68) 15.2 (2.12) 14.6 (2.17) 33.7 (2.07)Education ................................................. 18.1 (0.56) 3.2 (0.65) 81.9 (1.67) 3.0 (1.01) 7.6 (1.08) 11.0 (2.69) 12.6 (1.91) 11.7 (1.90) 13.5 (1.69)Engineering .............................................. 4.8 (0.31) 1.2 (0.33) # (†) 53.0 (3.11) # (†) 0.7 (0.47) 1.2 (0.81) 9.2 (1.40) 0.5 (0.24)Health professions.................................... 7.8 (0.38) 1.0 (0.36) 1.6 (0.51) 0.4 (0.30) 61.8 (2.27) 4.3 (1.15) 15.6 (1.96) 2.0 (0.77) 3.4 (0.96)Other profession4 ..................................... 11.2 (0.42) 2.3 (0.51) 1.5 (0.37) 13.5 (2.08) 5.7 (1.06) 26.7 (2.78) 32.7 (2.82) 16.7 (1.82) 15.2 (1.78)Computer science/programming .............. 6.8 (0.37) 9.0 (1.05) 1.2 (0.41) 10.1 (1.93) 0.8 (0.33) 2.3 (1.00) 2.3 (0.70) 35.9 (2.42) 4.9 (1.22)Administrative/clerical/support ................. 5.4 (0.33) 5.7 (0.91) 3.5 (0.74) 1.6 (0.60) 2.8 (0.70) 5.1 (1.30) 5.0 (1.40) 3.0 (0.82) 8.8 (1.27)Mechanic/operator/laborer ....................... 3.3 (0.27) 3.8 (0.78) 1.1 (0.41) 3.6 (1.08) 2.0 (0.74) 2.0 (0.96) 6.1 (1.72) 1.8 (0.68) 1.2 (0.57)Sales ........................................................ 6.8 (0.38) 12.2 (1.21) 1.0 (0.45) 1.3 (0.53) 2.9 (0.69) 2.2 (0.79) 3.3 (1.08) 2.0 (0.96) 4.0 (0.91)Service ..................................................... 8.1 (0.41) 5.1 (0.83) 3.3 (0.86) 1.7 (0.57) 4.4 (1.05) 5.4 (1.61) 5.0 (1.09) 1.5 (0.54) 11.1 (1.75)Military/protective service......................... 2.4 (0.24) 1.2 (0.41) 0.8 (0.47) 0.6 (0.36) 1.2 (0.47) 21.5 (2.89) 1.0 (0.47) 1.7 (0.62) 3.6 (0.81)

Job characteristics Job is start of career................................. 71.4 (0.67) 75.7 (1.60) 86.6 (1.41) 89.1 (1.61) 73.4 (1.88) 75.8 (2.62) 60.0 (3.28) 76.3 (2.37) 62.4 (2.54)Job closely related to bachelor's degree .. 54.0 (0.72) 55.8 (1.66) 82.7 (1.48) 69.3 (2.85) 74.6 (1.95) 59.3 (2.93) 47.1 (3.06) 66.3 (2.62) 29.0 (2.09)

Annual salaries5

Less than $10,000.................................... 1.4 (0.16) 0.4 (0.20) 1.8 (0.57) 0.8 (0.74) 0.6 (0.22) 1.1 (0.58) 1.8 (0.69) 0.8 (0.64) 2.2 (0.70)$10,000 to $14,999 .................................. 2.6 (0.24) 1.0 (0.41) 1.6 (0.42) 0.5 (0.37) 1.3 (0.50) 2.7 (1.44) 4.7 (1.43) 0.7 (0.33) 2.9 (0.79)$15,000 to $19,999 .................................. 5.4 (0.34) 1.8 (0.57) 7.3 (1.14) 1.4 (0.58) 2.8 (0.76) 8.0 (2.16) 9.7 (2.04) 4.2 (1.06) 4.3 (1.03)$20,000 to $24,999 .................................. 11.2 (0.47) 5.7 (0.92) 16.4 (1.76) 1.5 (0.64) 6.4 (1.20) 18.2 (2.74) 13.7 (2.24) 6.6 (1.41) 13.6 (1.79)$25,000 to $34,999 .................................. 36.4 (0.81) 29.3 (1.96) 62.0 (2.18) 5.7 (1.54) 30.2 (2.07) 46.2 (3.38) 37.1 (3.43) 24.7 (2.87) 39.0 (2.77)$35,000 to $49,999 .................................. 28.0 (0.77) 41.1 (2.01) 9.5 (1.24) 44.0 (3.20) 40.3 (2.23) 16.3 (2.39) 25.5 (3.27) 28.3 (2.83) 26.7 (2.41)$50,000 to $74,999 .................................. 12.3 (0.54) 15.9 (1.48) 1.4 (0.59) 43.1 (3.19) 14.7 (1.73) 4.5 (1.38) 5.8 (1.73) 29.5 (2.94) 8.4 (1.58)$75,000 or more ....................................... 2.9 (0.29) 4.9 (0.90) # (†) 3.0 (0.93) 3.8 (0.99) 2.9 (1.44) 1.7 (1.10) 5.2 (1.13) 2.8 (0.86)

Average annual salary6 ................................ $35,408 (316.0) $41,008 (941.2) $27,634 (345.7) $47,931 (790.0) $39,441 (1,089.6) $30,400 (1,054.7) $30,749 (978.4) $42,755 (981.0) $33,892 (916.0) $2

622 CHAPTER 5: Outcomes of EducationRecent High School and College Graduates

_

1Includes enrollment at any level in a degree or nondegree program.NOTE: Data are from a sample survey of recent college graduates. Notes on methodologyare included in the Guide to Sources.

SOURCE: U.S. Department of Education, National Center for Education Statistics,1993/97 Baccalaureate and Beyond Longitudinal Study (B&B:93/97). (This table wasprepared April 2001.)

Table 376. Postsecondary enrollment status of 1992–93 bachelor’s degree recipients, by undergraduate major: 1997

Undergraduate major field of study and educational attainmentEver enrolled

since graduation

Enrolled in April 19971

Enrolled full time Enrolled part timeEnrolled

and employedEnrolled

and not employed

1 2 3 4 5 6

Percent

All graduates ............................................................................................................................ 29.8 8.5 9.2 13.0 4.7

Professional fields.............................................................................................................................. 25.8 5.0 9.4 12.0 2.4Engineering.................................................................................................................................... 33.9 6.6 11.1 14.1 3.6Business and management ........................................................................................................... 16.3 3.7 5.7 7.5 1.9Health professions ......................................................................................................................... 26.6 7.6 6.5 9.9 4.2Education....................................................................................................................................... 38.0 5.5 16.9 20.1 2.3Public affairs and social services ................................................................................................... 26.4 4.1 9.0 12.3 0.8

Arts and sciences fields..................................................................................................................... 38.5 15.1 9.3 15.2 9.2Biological sciences ........................................................................................................................ 52.1 33.9 8.2 16.6 25.5Mathematics and other sciences ................................................................................................... 39.2 12.6 8.3 13.1 7.8Psychology..................................................................................................................................... 42.0 18.8 7.7 18.2 8.3Social sciences .............................................................................................................................. 35.9 10.9 11.9 16.7 6.1History............................................................................................................................................ 40.8 13.8 9.2 11.8 11.2Humanities..................................................................................................................................... 31.7 10.5 8.3 13.6 5.2

Other.................................................................................................................................................. 24.0 6.3 8.1 11.9 2.5

DIGEST OF EDUCATION STATISTICS 2005

CH

AP

TE

R 5: O

utcomes of E

ducation623

Recent H

igh School and C

ollege Graduates

DIG

ES

T O

F E

DU

CAT

ION

STAT

IST

ICS

2005

e Schools, deceased graduates, and graduates living at foreignon the Consumer Price Index, prepared by the Bureau of Labor in parentheses. for Education Statistics, “Recent College Graduates” surveys,d Beyond Longitudinal Study (B&B:93/94) and (B&B:2000/01).

through 2001

ary1

3 ients 94 Average salary1 of

1999–2000 degreerecipients in 2001 (in

constant 2004 dollars)

Percentchange in

constantdollars,1976 to

2001

Percentchange in

constantdollars,1991 to

2001Constant

04 dollars

13 14 15 16

$30,800 $37,800 (337.1) 49.7 15.4

39,400 51,100 (842.6) 26.2 19.3

34,500 43,700 (1,003.9) 29.2 27.5

39,900 42,100 (1,162.2) 47.3 -3.6

24,600 29,500 (368.8) 40.9 11.2

28,100 32,400 (1,125.0) — 12.4

29,000 32,800 (1,043.5) 52.0 12.3

32,400 45,600 (1,046.3) 96.2 21.1

24,800 30,800 (966.0) — 15.8

28,100 36,200 (977.0) 62.5 17.3

26,800 32,000 (1,123.4) — —

27,200 32,100 (902.9) 66.7 21.5

— — (†) — —

27,600 35,000 (669.3) 54.9 21.4

_

—Not available.†Not applicable.1Reported salaries of full-time workers under $2,600 in 1976, $4,200 in 1981, $5,000 in 1985, and $1,000 in 1994 and 2001were excluded from the tabulations. Also, those with salaries over $500,000 in 1994 and 2001 were excluded.2Most educators work 9- to 10-month contracts.

NOTE: Data exclude bachelor’s recipients from U.S. Servicaddresses at the time of the survey. Constant dollars based Statistics, U.S. Department of Labor. Standard errors appearSOURCE: U.S. Department of Education, National Center1976 though 1991; and 1993/94, 2000/01 Baccalaureate an(This table was prepared February 2006.)

Table 377. Average annual salary of bachelor’s degree recipients employed full time 1 year after graduation, by field of study: Selected years, 1976

Field of study

Average salary1

of 1974–75 degree recipients in February 1976

Average salary1

of 1979–80 degree recipients

in May 1981

Average salary1

of 1983–84 degree recipients

in June 1985

Average salary of 1985–86

degree recipientsin June 1987

Average salary of 1989–90

degree recipientsin June 1991

Average salof 1992–9

degree recipin April 19

Currentdollars

Constant2004 dollars

Currentdollars

Constant2004 dollars

Currentdollars

Constant2004 dollars

Currentdollars

Constant2004 dollars

Currentdollars

Constant2004 dollars

Currentdollars 20

1 2 3 4 5 6 7 8 9 10 11 12

Total .................................................. $7,600 $25,200 $15,200 $31,600 $17,700 $31,100 $20,400 $33,800 $23,600 $32,700 $24,200

Engineering .............................................. 12,200 40,500 22,400 46,500 24,100 42,300 26,600 44,200 30,900 42,900 30,900

Business and management ...................... 10,200 33,900 16,300 33,900 18,700 32,800 21,100 35,100 24,700 34,300 27,100

Health professions .................................... 8,600 28,600 17,300 36,000 20,800 36,500 22,600 37,500 31,500 43,600 31,300

Education2 ................................................ 6,300 20,900 11,500 23,900 13,800 24,200 15,800 26,200 19,100 26,500 19,300

Public affairs and social services.............. — — 13,700 28,500 15,100 26,500 17,700 29,400 20,800 28,800 22,000

Biological sciences ................................... 6,500 21,600 14,500 30,100 15,100 26,500 16,400 27,200 21,100 29,200 22,800

Mathematics and other sciences .............. 7,000 23,200 16,300 33,900 17,500 30,700 22,500 37,400 27,200 37,700 25,400

Psychology ............................................... — — 12,500 26,000 14,600 25,600 17,300 28,800 19,200 26,600 19,500

Social sciences......................................... 6,700 22,200 14,000 29,100 15,800 27,700 20,300 33,800 22,200 30,800 22,100

History ...................................................... — — — — — — — — — — 21,000

Humanities................................................ 5,800 19,300 12,600 26,200 14,000 24,600 16,200 27,000 19,100 26,400 21,300

Communications....................................... — — — — 16,200 28,400 — — — — —

Miscellaneous........................................... 6,800 22,600 15,100 31,400 18,600 32,700 17,600 29,300 20,800 28,800 21,600

624C

HA

PT

ER

5: Outcom

es of Education

Recent H

igh School and C

ollege GraduatesD

IGE

ST

OF

ED

UC

ATIO

N S

TATIS

TIC

S 2005

rough 2004

Bachelor’s or higher degree5

e6 Master’s degree4Professional

degree4 Doctor’s degree4

9 10 11 12

) — (†) — (†) — (†)) $49,734 (—) $73,996 (—) $57,187 (—)

4) 49,973 (—) 76,220 (—) 57,418 (—)6) 51,867 (—) 80,549 (—) 63,149 (—)3) 53,500 (854) 75,009 (3,040) 61,921 (1,619)0) 55,216 (973) 79,667 (2,582) 65,336 (2,188)8) 60,508 (945) 85,963 (3,317) 71,227 (3,362)1) 61,690 (771) 85,011 (4,253) 76,234 (3,611)9) 62,244 (847) 94,737 (12,105) 75,078 (2,507)2) 66,243 (690) 100,000 (37,836) 81,687 (3,953)3) 68,322 (1,506) 99,411 (20,832) 80,250 (2,446)5) 70,899 (687) 100,000 (†) 86,965 (3,013)5) 67,281 (1,294) 100,000 (†) 83,305 (2,076)5) 70,640 (562) 100,000 (†) 87,131 (2,528)3) 71,530 (490) 100,000 (†) 82,401 (2,423)

) — (†) — (†) — (†)) 34,949 (—) 46,742 (—) 43,303 (—)

4) 36,037 (—) 46,257 (—) 45,790 (—)0) 38,612 (—) 50,211 (—) 47,248 (—)4) 39,457 (606) 50,615 (2,154) 51,119 (2,888)3) 40,263 (556) 50,000 (2,532) 48,141 (2,373)7) 41,901 (564) 57,624 (3,635) 56,267 (3,300)5) 44,949 (837) 61,051 (4,737) 53,038 (3,626)5) 45,283 (760) 57,565 (1,705) 57,796 (1,881)4) 48,097 (862) 59,904 (4,479) 60,079 (3,130)4) 50,139 (735) 58,957 (3,552) 57,081 (2,999)1) 50,669 (328) 61,748 (3,976) 62,123 (2,228)3) 48,890 (595) 57,018 (2,421) 65,715 (2,268)4) 50,163 (454) 66,491 (3,469) 67,214 (2,462)2) 51,316 (263) 75,036 (2,436) 68,875 (2,450)

) — (†) — (†) — (†)) $68,978 (—) $102,627 (—) $79,314 (—)

9) 67,284 (—) 102,623 (—) 77,308 (—)1) 67,804 (—) 105,299 (—) 82,553 (—)7) 68,193 (1,089) 95,609 (3,875) 78,926 (2,064)2) 68,440 (1,206) 98,747 (3,200) 80,984 (2,712)1) 72,849 (1,138) 103,495 (3,994) 85,754 (4,048)2) 72,606 (907) 100,053 (5,006) 89,723 (4,250)4) 72,134 (982) 109,790 (14,028) 87,008 (2,905)9) 75,110 (782) 113,385 (42,900) 92,621 (4,482)9) 74,948 (1,652) 109,052 (22,852) 88,033 (2,683)7) 75,623 (733) 106,663 (†) 92,759 (3,214)4) 70,647 (1,359) 105,003 (†) 87,473 (2,180)5) 72,521 (577) 102,663 (†) 89,451 (2,595)3) 71,530 (490) 100,000 (†) 82,401 (2,423)

) — (†) — (†) — (†)) 48,472 (—) 64,828 (—) 60,058 (—)

Table 378. Median annual income of year-round, full-time workers 25 years old and over, by highest level of educational attainment and sex: 1990 th

Sex and year Total

Elementary/secondary College

Less than 9thgrade

Some high school,no completion1

High schoolcompletion

(includesequivalency)2

Some college, nodegree3

Associate’sdegree4 Total Bachelor’s degre

1 2 3 4 5 6 7 8

Current dollarsMales

1990........................................... $30,733 (—) $17,394 (—) $20,902 (—) $26,653 (—) $31,734 (—) — (†) $42,671 (—) $39,238 (—1991........................................... 31,613 (—) 17,623 (—) 21,402 (—) 26,779 (—) 31,663 (—) $33,817 (—) 45,138 (—) 40,906 (—1992........................................... 32,057 (120) 17,294 (—) 21,274 (—) 27,280 (175) 32,103 (—) 33,433 (—) 45,802 (—) 41,355 (301993........................................... 32,359 (124) 16,863 (—) 21,752 (—) 27,370 (204) 32,077 (—) 33,690 (—) 47,740 (—) 42,757 (531994........................................... 33,440 (246) 17,532 (453) 22,048 (319) 28,037 (322) 32,279 (300) 35,794 (430) 49,228 (707) 43,663 (631995........................................... 34,551 (275) 18,354 (545) 22,185 (342) 29,510 (358) 33,883 (517) 35,201 (535) 50,481 (312) 45,266 (511996........................................... 35,622 (150) 17,962 (594) 22,717 (414) 30,709 (184) 34,845 (456) 37,131 (435) 51,436 (303) 45,846 (451997........................................... 36,678 (149) 19,291 (629) 24,726 (466) 31,215 (171) 35,945 (293) 38,022 (774) 53,450 (755) 48,616 (851998........................................... 37,906 (291) 19,380 (600) 23,958 (547) 31,477 (169) 36,934 (291) 40,274 (539) 56,524 (421) 51,405 (341999........................................... 40,333 (144) 20,429 (444) 25,035 (535) 33,184 (388) 39,221 (581) 41,638 (459) 60,201 (439) 52,985 (722000........................................... 41,059 (156) 20,789 (376) 25,095 (436) 34,303 (457) 40,337 (312) 41,952 (460) 61,868 (303) 56,334 (572001........................................... 41,617 (104) 21,361 (235) 26,209 (251) 34,723 (299) 41,045 (214) 42,776 (561) 62,223 (279) 55,929 (332002........................................... 41,152 (100) 20,919 (213) 25,903 (207) 33,206 (311) 40,851 (195) 42,856 (673) 61,700 (201) 56,077 (382003........................................... 41,939 (90) 21,217 (227) 26,468 (280) 35,412 (168) 41,348 (182) 42,871 (719) 62,075 (187) 56,502 (362004........................................... 42,085 (89) 21,659 (191) 26,277 (234) 35,725 (148) 41,895 (175) 44,404 (931) 62,797 (798) 57,220 (39

Females1990........................................... 21,372 (—) 12,251 (—) 14,429 (—) 18,319 (—) 22,227 (—) — (†) 30,377 (—) 28,017 (—1991........................................... 22,043 (—) 12,066 (—) 14,455 (—) 18,836 (—) 22,143 (—) 25,000 (—) 31,310 (—) 29,079 (—1992........................................... 23,139 (159) 12,958 (—) 14,559 (—) 19,427 (176) 23,157 (—) 25,624 (—) 32,304 (—) 30,326 (291993........................................... 23,629 (166) 12,415 (—) 15,386 (—) 19,963 (173) 23,056 (—) 25,883 (—) 34,307 (—) 31,197 (311994........................................... 24,399 (165) 12,430 (427) 15,133 (328) 20,373 (158) 23,514 (327) 25,940 (295) 35,378 (280) 31,741 (311995........................................... 24,875 (160) 13,577 (490) 15,825 (293) 20,463 (162) 23,997 (274) 27,311 (428) 35,259 (313) 32,051 (271996........................................... 25,808 (131) 14,414 (559) 16,953 (333) 21,175 (143) 25,167 (267) 28,083 (526) 36,461 (296) 33,525 (431997........................................... 26,974 (134) 14,161 (492) 16,697 (335) 22,067 (148) 26,335 (291) 28,812 (660) 38,038 (481) 35,379 (291998........................................... 27,956 (199) 14,467 (429) 16,482 (322) 22,780 (254) 27,420 (271) 29,924 (513) 39,786 (408) 36,559 (301999........................................... 28,844 (216) 15,098 (492) 17,015 (298) 23,061 (279) 27,757 (369) 30,919 (318) 41,747 (275) 37,993 (612000........................................... 30,327 (138) 15,798 (327) 17,919 (434) 24,970 (236) 28,697 (364) 31,071 (307) 42,706 (439) 40,415 (282001........................................... 31,356 (91) 16,691 (255) 19,156 (359) 25,303 (132) 30,418 (186) 32,153 (231) 44,776 (367) 40,994 (232002........................................... 31,010 (83) 16,510 (297) 19,307 (360) 25,182 (121) 29,400 (299) 31,625 (211) 43,245 (568) 40,853 (172003........................................... 31,565 (85) 16,907 (256) 18,938 (327) 26,074 (118) 30,142 (176) 32,253 (241) 45,116 (291) 41,327 (202004........................................... 31,990 (80) 17,023 (241) 19,162 (319) 26,029 (116) 30,816 (135) 33,481 (489) 45,911 (229) 41,681 (17

Constant 2004 dollars7

Males1990........................................... $44,418 (—) $25,139 (—) $30,210 (—) $38,521 (—) $45,865 (—) — (†) $61,672 (—) $56,710 (—1991........................................... 43,845 (—) 24,442 (—) 29,683 (—) 37,141 (—) 43,914 (—) $46,902 (—) 62,603 (—) 56,734 (—1992........................................... 43,162 (162) 23,285 (—) 28,643 (—) 36,730 (236) 43,223 (—) 45,014 (—) 61,668 (—) 55,680 (401993........................................... 42,302 (162) 22,044 (—) 28,436 (—) 35,780 (267) 41,933 (—) 44,042 (—) 62,409 (—) 55,895 (701994........................................... 42,624 (314) 22,347 (577) 28,103 (407) 35,737 (410) 41,144 (382) 45,624 (548) 62,747 (901) 55,654 (801995........................................... 42,826 (341) 22,750 (676) 27,498 (424) 36,578 (444) 41,998 (641) 43,632 (663) 62,571 (387) 56,107 (631996........................................... 42,887 (181) 21,625 (715) 27,350 (498) 36,972 (222) 41,952 (549) 44,704 (524) 61,926 (365) 55,196 (551997........................................... 43,168 (175) 22,704 (740) 29,101 (548) 36,738 (201) 42,305 (345) 44,750 (911) 62,908 (889) 57,218 (1,001998........................................... 43,929 (337) 22,459 (695) 27,765 (634) 36,479 (196) 42,803 (337) 46,673 (625) 65,505 (488) 59,573 (401999........................................... 45,732 (163) 23,163 (503) 28,386 (607) 37,626 (440) 44,471 (659) 47,211 (520) 68,259 (498) 60,077 (812000........................................... 45,041 (171) 22,805 (412) 27,529 (478) 37,630 (501) 44,249 (342) 46,021 (505) 67,868 (332) 61,797 (622001........................................... 44,390 (111) 22,784 (251) 27,955 (268) 37,037 (319) 43,780 (228) 45,626 (598) 66,369 (298) 59,655 (352002........................................... 43,211 (105) 21,966 (224) 27,199 (217) 34,867 (327) 42,895 (205) 45,000 (707) 64,787 (211) 58,882 (402003........................................... 43,056 (92) 21,782 (233) 27,173 (287) 36,355 (172) 42,449 (187) 44,013 (738) 63,728 (192) 58,007 (372004........................................... 42,085 (89) 21,659 (191) 26,277 (234) 35,725 (148) 41,895 (175) 44,404 (931) 62,797 (798) 57,220 (39

Females1990........................................... 30,889 (—) 17,706 (—) 20,854 (—) 26,476 (—) 32,125 (—) — (†) 43,904 (—) 40,493 (—1991........................................... 30,572 (—) 16,735 (—) 20,048 (—) 26,124 (—) 30,711 (—) 34,673 (—) 43,425 (—) 40,331 (—

See notes at end of table.

CH

AP

TE

R 5: O

utcomes of E

ducation625

Recent H

igh School and C

ollege Graduates

DIG

ES

T O

F E

DU

CAT

ION

STAT

IST

ICS

2005

counts; prior years are based on 1980 counts. Total standard errorsd 1993 from the source document. Detail may not sum to totals

urrent Population Reports, Series P-60, Money Income of House-overty, and Valuation of Noncash Benefits, selected years, 1990, selected years, 1995 through 2002; and Detailed Income Tabula-005, from http://www.census.gov/hhes/www/income/dinctabs.html.

6) 48,520 (—) 62,280 (—) 61,652 (—)5) 50,476 (—) 65,639 (—) 61,766 (—)0) 50,293 (772) 64,515 (2,746) 65,158 (3,681)8) 49,906 (689) 61,975 (3,138) 59,671 (2,941)6) 50,447 (679) 69,377 (4,376) 67,743 (3,973)7) 52,903 (985) 71,854 (5,575) 62,423 (4,268)3) 52,478 (881) 66,712 (1,976) 66,980 (2,180)6) 54,535 (977) 67,922 (5,079) 68,121 (3,549)2) 55,001 (806) 64,675 (3,896) 62,617 (3,290)6) 54,045 (350) 65,862 (4,241) 66,262 (2,376)2) 51,336 (625) 59,870 (2,542) 69,003 (2,381)9) 51,499 (466) 68,262 (3,561) 69,004 (2,528)2) 51,316 (263) 75,036 (2,436) 68,875 (2,450)

.6) — (†) — (†) — (†)

.7) 3,073 (86.1) 1,147 (53.0) 674 (40.7)

.7) 3,178 (87.5) 1,295 (56.3) 745 (42.8)

.1) 3,131 (86.8) 1,231 (54.9) 808 (44.5)

.4) 3,225 (88.1) 1,258 (55.4) 868 (46.1)

.7) 3,395 (94.3) 1,208 (56.5) 853 (47.5)

.3) 3,272 (96.3) 1,277 (60.4) 893 (50.5)

.9) 3,228 (95.6) 1,321 (61.4) 966 (52.5)

.3) 3,414 (98.3) 1,264 (60.1) 998 (53.4)

.9) 3,725 (102.6) 1,267 (60.1) 1,008 (53.7)

.8) 3,680 (102.0) 1,274 (60.3) 1,038 (54.5)

.4) 3,961 (105.8) 1,298 (60.9) 1,041 (54.5)

.5) 4,065 (69.4) 1,308 (39.6) 1,065 (35.8)

.6) 4,124 (69.9) 1,348 (40.2) 1,037 (35.3)

.9) 4,243 (70.9) 1,305 (39.6) 1,088 (36.1)

.8) — (†) — (†) — (†)

.6) 2,025 (70.1) 312 (27.7) 206 (22.5)

.0) 2,192 (72.9) 334 (28.7) 225 (23.5)

.3) 2,166 (72.5) 323 (28.2) 260 (25.3)

.9) 2,174 (72.6) 398 (31.3) 283 (26.4)

.1) 2,268 (77.2) 421 (33.4) 283 (27.4)

.7) 2,213 (79.3) 413 (34.4) 322 (30.4)

.5) 2,448 (83.4) 488 (37.4) 318 (30.2)

.6) 2,639 (86.6) 468 (36.6) 329 (30.7)

.6) 2,818 (89.4) 470 (36.7) 346 (31.5)

.2) 2,823 (89.5) 509 (38.2) 353 (31.8)

.5) 3,089 (93.6) 531 (39.0) 392 (33.5)

.9) 3,281 (62.5) 572 (26.2) 402 (22.0)

.5) 3,376 (63.4) 567 (26.1) 462 (23.6)

.4) 3,451 (64.0) 564 (26.0) 452 (23.3)

rough 2004—Continued

Bachelor’s or higher degree5

e6 Master’s degree4Professional

degree4 Doctor’s degree4

9 10 11 12

—Not available.†Not applicable.1Includes 1 to 3 years of high school for 1990.2Includes 4 years of high school for 1990.3Includes 1 to 3 years of college and associate’s degrees for 1990.4Not reported separately for 1990.5Includes 4 or more years of college for 1990.6Includes 4 years of college for 1990.7Constant dollars based on the Consumer Price Index, prepared by the Bureau of Labor Statistics, U.S. Department of Labor.

NOTE: Data for 1992 and later years are based on 1990 censusfor bachelor’s or higher degrees are not available for 1992 anbecause of rounding. Standard errors appear in parentheses.SOURCE: U.S. Department of Commerce, Census Bureau, Cholds, Families, and Persons in the United States, Income, Pthrough 1994; Series P-60, Money Income in the United Statestions from the CPS, 2003 through 2005. Retrieved May 17, 2(This table was prepared October 2005.)

1992........................................... 31,154 (214) 17,447 (—) 19,602 (—) 26,157 (237) 31,179 (—) 34,500 (—) 43,494 (—) 40,831 (391993........................................... 30,889 (217) 16,230 (—) 20,114 (—) 26,097 (226) 30,140 (—) 33,836 (—) 44,848 (—) 40,783 (401994........................................... 31,100 (210) 15,844 (544) 19,289 (418) 25,968 (201) 29,972 (417) 33,064 (376) 45,094 (357) 40,458 (401995........................................... 30,833 (198) 16,829 (607) 19,615 (363) 25,364 (201) 29,744 (340) 33,852 (531) 43,704 (388) 39,727 (331996........................................... 31,072 (158) 17,354 (673) 20,411 (401) 25,494 (172) 30,300 (321) 33,811 (633) 43,897 (356) 40,362 (521997........................................... 31,747 (158) 16,667 (579) 19,651 (394) 25,972 (174) 30,995 (342) 33,910 (777) 44,769 (566) 41,639 (341998........................................... 32,398 (231) 16,766 (497) 19,101 (373) 26,400 (294) 31,777 (314) 34,679 (595) 46,108 (473) 42,368 (351999........................................... 32,705 (245) 17,119 (558) 19,293 (338) 26,148 (316) 31,472 (418) 35,058 (361) 47,335 (312) 43,078 (692000........................................... 33,268 (151) 17,330 (359) 19,657 (476) 27,392 (259) 31,480 (399) 34,084 (337) 46,848 (482) 44,334 (312001........................................... 33,445 (97) 17,803 (272) 20,432 (383) 26,989 (141) 32,445 (198) 34,295 (246) 47,759 (391) 43,725 (242002........................................... 32,561 (87) 17,336 (312) 20,273 (378) 26,442 (127) 30,871 (314) 33,207 (222) 45,408 (596) 42,897 (182003........................................... 32,406 (87) 17,357 (263) 19,442 (336) 26,768 (121) 30,945 (181) 33,112 (247) 46,317 (299) 42,428 (202004........................................... 31,990 (80) 17,023 (241) 19,162 (319) 26,029 (116) 30,816 (135) 33,481 (489) 45,911 (229) 41,681 (17

Number of persons with income (in thousands)Males

1990........................................... 44,406 (268.6) 2,250 (73.9) 3,315 (89.3) 16,394 (188.0) 9,113 (144.6) — (†) 13,334 (171.8) 7,569 (1321991........................................... 44,199 (268.3) 1,807 (66.3) 3,083 (86.2) 15,025 (181.1) 8,034 (136.4) 2,899 (83.6) 13,350 (171.9) 8,456 (1391992........................................... 44,752 (269.1) 1,815 (66.5) 3,009 (85.2) 14,722 (179.5) 8,067 (136.6) 3,203 (87.8) 13,937 (175.2) 8,719 (1411993........................................... 45,873 (270.6) 1,790 (66.0) 3,083 (86.2) 14,604 (178.9) 8,493 (140.0) 3,557 (92.4) 14,346 (177.5) 9,178 (1451994........................................... 47,566 (272.8) 1,895 (67.9) 3,057 (85.8) 15,109 (181.5) 8,783 (142.2) 3,735 (94.6) 14,987 (180.9) 9,636 (1481995........................................... 48,500 (324.3) 1,946 (71.6) 3,335 (93.5) 15,331 (195.8) 8,908 (151.1) 3,926 (101.3) 15,054 (194.1) 9,597 (1561996........................................... 49,764 (339.9) 2,041 (76.2) 3,441 (98.7) 15,840 (206.6) 9,173 (159.3) 3,931 (105.4) 15,339 (203.5) 9,898 (1651997........................................... 50,807 (342.6) 1,914 (73.8) 3,548 (100.2) 16,225 (208.9) 9,170 (159.3) 4,086 (107.4) 15,864 (206.7) 10,349 (1681998........................................... 52,381 (346.6) 1,870 (73.0) 3,613 (101.1) 16,442 (210.2) 9,375 (161.0) 4,347 (110.7) 16,733 (212.0) 11,058 (1741999........................................... 53,062 (348.2) 1,993 (75.3) 3,295 (96.6) 16,589 (211.1) 9,684 (163.6) 4,359 (110.9) 17,142 (214.4) 11,142 (1742000........................................... 54,065 (350.7) 1,968 (74.9) 3,354 (97.5) 16,834 (212.6) 9,792 (164.4) 4,729 (115.4) 17,387 (215.8) 11,395 (1762001........................................... 54,013 (350.5) 2,207 (79.2) 3,503 (99.6) 16,314 (209.5) 9,494 (162.0) 4,714 (115.2) 17,780 (218.0) 11,479 (1772002........................................... 54,108 (225.0) 2,154 (50.7) 3,680 (66.1) 16,005 (134.2) 9,603 (105.5) 4,399 (72.2) 18,267 (142.7) 11,829 (1162003........................................... 54,253 (225.2) 2,209 (51.4) 3,369 (63.3) 16,285 (135.3) 9,340 (104.1) 4,696 (74.5) 18,354 (143.0) 11,846 (1162004........................................... 55,469 (227.0) 2,427 (53.8) 3,468 (64.2) 17,067 (138.3) 9,257 (103.6) 4,913 (76.2) 18,338 (142.9) 11,701 (115

Females1990........................................... 28,636 (234.7) 847 (45.6) 1,861 (67.3) 11,810 (162.8) 6,462 (123.1) — (†) 7,655 (133.3) 4,704 (1051991........................................... 29,474 (237.1) 733 (42.4) 1,819 (66.5) 10,959 (157.4) 5,633 (115.3) 2,523 (78.1) 7,807 (134.6) 5,263 (1111992........................................... 30,346 (239.6) 734 (42.4) 1,659 (63.6) 11,039 (157.9) 5,904 (117.9) 2,655 (80.1) 8,355 (138.9) 5,604 (1151993........................................... 30,683 (240.5) 765 (43.3) 1,576 (62.0) 10,513 (154.4) 6,279 (121.4) 3,067 (86.0) 8,483 (139.9) 5,735 (1161994........................................... 31,379 (242.4) 696 (41.3) 1,675 (63.9) 10,785 (156.2) 6,256 (121.2) 3,210 (87.9) 8,756 (142.0) 5,901 (1171995........................................... 32,673 (275.7) 774 (45.2) 1,763 (68.2) 11,064 (167.7) 6,329 (128.0) 3,336 (93.5) 9,406 (155.1) 6,434 (1291996........................................... 33,549 (289.6) 750 (46.3) 1,751 (70.6) 11,363 (176.6) 6,582 (135.7) 3,468 (99.1) 9,636 (163.2) 6,689 (1361997........................................... 34,624 (293.5) 791 (47.6) 1,765 (70.9) 11,475 (177.4) 6,628 (136.1) 3,538 (100.1) 10,427 (169.5) 7,173 (1411998........................................... 35,628 (297.1) 814 (48.3) 1,878 (73.1) 11,613 (178.4) 7,070 (140.5) 3,527 (99.9) 10,725 (171.8) 7,288 (1421999........................................... 37,091 (302.1) 886 (50.3) 1,883 (73.2) 11,824 (180.0) 7,453 (144.1) 3,804 (103.7) 11,242 (175.7) 7,607 (1452000........................................... 37,762 (304.4) 930 (51.6) 1,950 (74.5) 11,789 (179.7) 7,391 (143.5) 4,118 (107.8) 11,584 (178.2) 7,899 (1482001........................................... 38,228 (305.9) 927 (51.5) 1,869 (73.0) 11,690 (179.0) 7,283 (142.5) 4,190 (108.8) 12,269 (183.2) 8,257 (1512002........................................... 38,510 (197.6) 858 (32.1) 1,841 (46.9) 11,687 (115.8) 7,354 (92.7) 4,285 (71.2) 12,484 (119.5) 8,229 (972003........................................... 38,681 (197.9) 882 (32.6) 1,739 (45.6) 11,587 (115.3) 7,341 (92.6) 4,397 (72.2) 12,735 (120.6) 8,330 (982004........................................... 39,072 (198.7) 917 (33.2) 1,797 (46.4) 11,392 (114.4) 7,330 (92.6) 4,505 (73.0) 13,131 (122.4) 8,664 (100

Table 378. Median annual income of year-round, full-time workers 25 years old and over, by highest level of educational attainment and sex: 1990 th

Sex and year Total

Elementary/secondary College

Less than 9thgrade

Some high school,no completion1

High schoolcompletion

(includesequivalency)2

Some college, nodegree3

Associate’sdegree4 Total Bachelor’s degre

1 2 3 4 5 6 7 8

626C

HA

PT

ER

5: Outcom

es of Education

Recent H

igh School and C

ollege GraduatesD

IGE

ST

OF

ED

UC

ATIO

N S

TATIS

TIC

S 2005

Bachelor’s or higher degree

r’see

Master’sdegree

Professionaldegree

Doctor’sdegree

9 10 11 12

.0) 12,816 (122.6) 2,925 (60.0) 2,343 (53.8)

.7) 10,307 (110.6) 2,352 (53.9) 1,967 (49.3)

(†) 100.0 (†) 100.0 (†) 100.0 (†)

6) 4.1 (1.08) 3.1 (2.27) 3.4 (2.48)7) 3.5 (1.08) 1.7 (2.29) 1.5 (2.50)6) 3.1 (1.08) 2.1 (2.28) 2.6 (2.49)

6) 3.0 (1.08) 1.8 (2.28) 1.6 (2.50)6) 3.4 (1.08) 3.1 (2.27) 1.7 (2.50)6) 3.5 (1.08) 2.6 (2.27) 2.4 (2.49)

5) 5.6 (1.07) 2.8 (2.27) 3.5 (2.48)5) 5.7 (1.07) 3.3 (2.27) 4.0 (2.47)3) 13.3 (1.02) 8.7 (2.20) 8.4 (2.41)

0) 26.3 (0.95) 14.9 (2.13) 23.7 (2.20)5) 13.2 (1.03) 13.2 (2.15) 17.1 (2.29)4) 15.3 (1.01) 42.7 (1.74) 30.4 (2.10)

1) $51,733 (197) $81,319 (977) $71,196 (866)

.2) 6,123 (86.2) 1,894 (48.4) 1,584 (44.3)

.1) 5,107 (78.9) 1,566 (44.1) 1,331 (40.6)

(†) 100.0 (†) 100.0 (†) 100.0 (†)3) 2.8 (1.54) 2.7 (2.79) 3.1 (3.02)

3) 2.3 (1.55) 0.6 (2.82) 1.1 (3.05)3) 2.8 (1.54) 1.7 (2.80) 2.3 (3.03)3) 2.6 (1.54) 1.8 (2.80) 1.6 (3.04)

2) 2.7 (1.54) 2.1 (2.79) 1.5 (3.04)2) 2.4 (1.54) 2.1 (2.79) 1.7 (3.04)1) 3.4 (1.54) 2.0 (2.80) 3.0 (3.02)

1) 4.0 (1.53) 2.3 (2.79) 3.5 (3.01)8) 10.2 (1.48) 7.0 (2.72) 6.1 (2.97)2) 24.3 (1.36) 13.5 (2.63) 22.6 (2.69)

8) 17.6 (1.42) 12.9 (2.64) 17.3 (2.79)6) 24.9 (1.36) 51.3 (1.97) 36.6 (2.44)

0) $65,452 (1,169) $100,000 (†) $77,187 (1,997)

Table 379. Distribution of income and median income of persons 25 years old and over, by highest level of educational attainment and sex: 2004

Sex and income TotalLess than9th grade

Somehigh school

(no completion)

High schoolcompletion

(includesequivalency)

College

Some college,no degree

Associate’sdegree Total

Bachelodegr

1 2 3 4 5 6 7 8

Males and females, 25 years old and over (in thousands)

Total ................................... 189,362 (146.2) 11,938 (118.6) 16,104 (136.2) 60,917 (232.0) 31,798 (183.4) 16,303 (137.0) 52,302 (221.2) 34,219 (189

With income ................ 129,853 (247.0) 4,873 (77.1) 8,074 (98.5) 39,217 (199.4) 23,087 (160.1) 12,848 (122.7) 41,753 (204.2) 27,127 (171

Percentage distribution of males and females with income

Total annual income ............... 100.0 (†) 100.0 (†) 100.0 (†) 100.0 (†) 100.0 (†) 100.0 (†) 100.0 (†) 100.0

$1 to $4,999 or loss............ 6.6 (0.30) 9.3 (1.52) 10.9 (1.17) 7.2 (0.54) 7.4 (0.71) 5.4 (0.96) 4.9 (0.53) 5.4 (0.6$5,000 to $9,999 ................ 5.8 (0.30) 11.6 (1.50) 11.1 (1.17) 6.9 (0.54) 5.9 (0.71) 4.8 (0.96) 3.4 (0.54) 3.7 (0.6$10,000 to $14,999 ............ 7.7 (0.30) 18.8 (1.44) 15.3 (1.14) 9.7 (0.54) 7.0 (0.71) 6.4 (0.95) 3.8 (0.54) 4.3 (0.6

$15,000 to $19,999 ............ 8.3 (0.30) 18.4 (1.45) 15.1 (1.15) 10.9 (0.53) 8.4 (0.70) 7.5 (0.95) 3.6 (0.54) 4.2 (0.6$20,000 to $24,999 ............ 9.4 (0.30) 15.7 (1.47) 13.8 (1.15) 12.0 (0.53) 10.2 (0.70) 9.4 (0.94) 4.9 (0.53) 5.9 (0.6$25,000 to $29,999 ............ 8.3 (0.30) 8.4 (1.53) 9.5 (1.18) 10.4 (0.53) 9.2 (0.70) 9.5 (0.94) 5.1 (0.53) 6.2 (0.6

$30,000 to $34,999 ............ 8.6 (0.30) 5.8 (1.55) 6.8 (1.20) 10.0 (0.54) 10.0 (0.70) 10.3 (0.93) 6.8 (0.53) 7.8 (0.6$35,000 to $39,999 ............ 7.0 (0.30) 4.1 (1.57) 4.9 (1.21) 7.5 (0.54) 7.6 (0.71) 8.1 (0.95) 6.7 (0.53) 7.5 (0.6$40,000 to $49,999 ............ 11.3 (0.29) 4.1 (1.57) 5.4 (1.21) 10.7 (0.53) 12.4 (0.69) 13.0 (0.92) 12.7 (0.51) 13.2 (0.6

$50,000 to $74,999 ............ 15.3 (0.29) 2.9 (1.58) 5.7 (1.21) 10.6 (0.53) 14.7 (0.68) 18.3 (0.89) 22.6 (0.48) 21.7 (0.6$75,000 to $99,999 ............ 5.6 (0.30) 0.4 (1.60) 0.8 (1.24) 2.4 (0.56) 4.3 (0.72) 4.7 (0.96) 11.1 (0.52) 9.6 (0.6$100,000 or more............... 6.0 (0.30) 0.4 (1.60) 0.7 (1.24) 1.6 (0.56) 2.9 (0.72) 2.7 (0.97) 14.4 (0.51) 10.4 (0.6

Median income....................... $31,455 (59) $17,017 (158) $18,874 (285) $26,104 (96) $30,610 (119) $32,383 (205) $47,317 (181) $42,087 (14

Males, 25 years old and over (in thousands)

Total ................................... 90,896 (252.9) 5,912 (84.7) 7,789 (96.8) 29,173 (177.0) 14,869 (131.3) 6,925 (91.4) 26,228 (169.2) 16,628 (138

With income ................ 69,324 (240.3) 3,250 (63.2) 4,872 (77.1) 21,572 (155.4) 11,669 (117.3) 5,875 (84.4) 22,087 (157.0) 14,082 (128

Percentage distribution of males with income

Total annual income ............... 100.0 (†) 100.0 (†) 100.0 (†) 100.0 (†) 100.0 (†) 100.0 (†) 100.0 (†) 100.0$1 to $4,999 or loss............ 4.5 (0.41) 6.3 (1.90) 7.1 (1.54) 5.3 (0.74) 4.4 (1.01) 3.0 (1.44) 3.3 (0.74) 3.5 (0.9

$5,000 to $9,999 ................ 3.8 (0.42) 7.8 (1.88) 8.0 (1.54) 4.4 (0.74) 3.6 (1.02) 2.8 (1.44) 2.1 (0.74) 2.2 (0.9$10,000 to $14,999 ............ 5.7 (0.41) 16.7 (1.79) 11.8 (1.50) 6.4 (0.74) 4.8 (1.01) 3.6 (1.43) 3.0 (0.74) 3.2 (0.9$15,000 to $19,999 ............ 7.0 (0.41) 18.7 (1.77) 14.0 (1.49) 8.9 (0.73) 6.4 (1.00) 5.1 (1.42) 2.6 (0.74) 2.9 (0.9

$20,000 to $24,999 ............ 8.2 (0.41) 17.9 (1.78) 14.6 (1.48) 10.2 (0.72) 8.0 (0.99) 7.4 (1.40) 3.7 (0.74) 4.5 (0.9$25,000 to $29,999 ............ 7.3 (0.41) 9.5 (1.86) 11.5 (1.51) 9.4 (0.72) 7.7 (0.99) 7.8 (1.40) 3.7 (0.74) 4.5 (0.9$30,000 to $34,999 ............ 8.2 (0.41) 6.7 (1.89) 8.1 (1.53) 10.8 (0.72) 8.9 (0.99) 9.6 (1.39) 5.3 (0.73) 6.6 (0.9

$35,000 to $39,999 ............ 7.2 (0.41) 5.6 (1.90) 6.9 (1.55) 8.7 (0.73) 8.0 (0.99) 8.2 (1.40) 5.4 (0.73) 6.4 (0.9$40,000 to $49,999 ............ 12.5 (0.40) 5.8 (1.90) 7.9 (1.54) 14.1 (0.71) 15.1 (0.95) 15.3 (1.34) 10.9 (0.71) 12.0 (0.8$50,000 to $74,999 ............ 18.9 (0.38) 3.8 (1.92) 8.1 (1.54) 15.8 (0.70) 21.5 (0.92) 24.6 (1.27) 23.6 (0.66) 24.6 (0.8

$75,000 to $99,999 ............ 7.6 (0.41) 0.5 (1.96) 1.1 (1.59) 3.6 (0.75) 6.6 (1.00) 7.9 (1.40) 14.4 (0.70) 13.2 (0.8$100,000 or more............... 9.1 (0.40) 0.6 (1.95) 1.0 (1.59) 2.4 (0.75) 5.1 (1.01) 4.7 (1.42) 22.0 (0.66) 16.4 (0.8

Median income....................... $37,669 (234) $20,100 (247) $22,255 (197) $31,624 (114) $38,186 (519) $40,879 (262) $58,382 (900) $51,876 (21

See notes at end of table.

CH

AP

TE

R 5: O

utcomes of E

ducation627

Recent H

igh School and C

ollege Graduates

DIG

ES

T O

F E

DU

CAT

ION

STAT

IST

ICS

2005

Current Population Survey, March 2004. Retrieved October 21,c.htm. (This table was prepared October 2005.)

.8) 6,693 (89.9) 1,031 (35.8) 759 (30.7)

.6) 5,200 (79.6) 786 (31.3) 635 (28.1)

(†) 100.0 (†) 100.0 (†) 100.0 (†)

4) 5.4 (1.51) 3.8 (3.91) 3.9 (4.35)

5) 4.6 (1.51) 3.7 (3.91) 2.4 (4.38)

5) 3.4 (1.52) 3.1 (3.92) 3.3 (4.36)

5) 3.4 (1.52) 1.9 (3.95) 1.6 (4.40)

4) 4.2 (1.52) 5.0 (3.89) 2.2 (4.39)

4) 4.5 (1.51) 3.6 (3.91) 3.9 (4.35)

3) 7.7 (1.49) 4.3 (3.90) 4.4 (4.34)

3) 7.3 (1.49) 5.3 (3.88) 5.2 (4.32)

0) 16.3 (1.42) 12.1 (3.74) 13.4 (4.13)

8) 28.2 (1.31) 17.8 (3.61) 26.0 (3.82)

5) 8.9 (1.48) 13.7 (3.70) 16.7 (4.05)

6) 6.0 (1.50) 25.6 (3.44) 17.3 (4.03)

1) $45,149 (563) $57,315 (4,191) $56,795 (2,750)

ontinued

Bachelor’s or higher degree

r’see

Master’sdegree

Professionaldegree

Doctor’sdegree

9 10 11 12

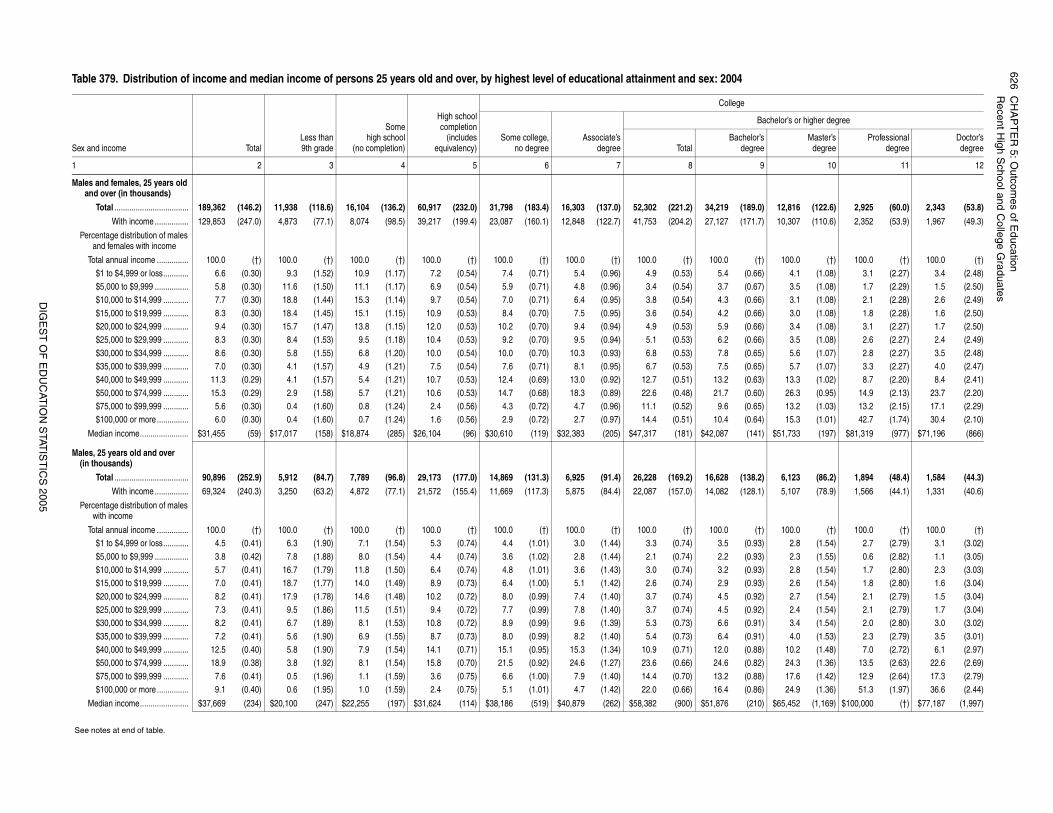
†Not applicable.NOTE: Includes money income from all sources, including earnings, pensions, social security, investments, and public assis-tance. Excludes noncash benefits. Detail may not sum to totals because of rounding. Standard errors appear in parentheses.

SOURCE: U.S. Department of Commerce, Census Bureau,2005, from http://pubdb3.census.gov/macro/032005/perinc/to

Females, 25 years old and over(in thousands)

Total ................................... 98,465 (254.6) 6,026 (85.5) 8,314 (99.8) 31,743 (183.3) 16,929 (139.4) 9,379 (105.8) 26,074 (168.8) 17,591 (141

With income ................ 60,528 (231.6) 1,624 (44.9) 3,202 (62.8) 17,646 (142.0) 11,418 (116.1) 6,973 (91.7) 19,666 (149.1) 13,045 (123

Percentage distribution of females with income

Total annual income ............... 100.0 (†) 100.0 (†) 100.0 (†) 100.0 (†) 100.0 (†) 100.0 (†) 100.0 (†) 100.0

$1 to $4,999 or loss............ 9.1 (0.43) 15.3 (2.55) 16.8 (1.80) 9.6 (0.80) 10.4 (0.99) 7.4 (1.29) 6.6 (0.77) 7.4 (0.9

$5,000 to $9,999 ................ 8.2 (0.44) 19.4 (2.49) 15.7 (1.81) 10.0 (0.80) 8.3 (1.00) 6.5 (1.29) 5.0 (0.78) 5.4 (0.9

$10,000 to $14,999 ............ 10.0 (0.43) 23.0 (2.43) 20.7 (1.76) 13.8 (0.78) 9.2 (1.00) 8.7 (1.28) 4.8 (0.78) 5.5 (0.9

$15,000 to $19,999 ............ 9.8 (0.43) 17.7 (2.52) 16.9 (1.80) 13.2 (0.78) 10.5 (0.99) 9.5 (1.27) 4.7 (0.78) 5.6 (0.9

$20,000 to $24,999 ............ 10.8 (0.43) 11.2 (2.61) 12.6 (1.85) 14.4 (0.78) 12.4 (0.98) 11.1 (1.26) 6.3 (0.77) 7.4 (0.9

$25,000 to $29,999 ............ 9.4 (0.43) 6.0 (2.69) 6.4 (1.91) 11.7 (0.79) 10.8 (0.99) 11.0 (1.26) 6.7 (0.77) 7.9 (0.9

$30,000 to $34,999 ............ 9.1 (0.43) 3.8 (2.72) 4.6 (1.93) 9.0 (0.80) 11.1 (0.99) 10.9 (1.26) 8.5 (0.76) 9.2 (0.9

$35,000 to $39,999 ............ 6.8 (0.44) 1.0 (2.76) 1.9 (1.96) 6.1 (0.82) 7.1 (1.01) 8.0 (1.28) 8.1 (0.76) 8.7 (0.9

$40,000 to $49,999 ............ 9.9 (0.43) 0.9 (2.76) 1.7 (1.96) 6.5 (0.81) 9.6 (0.99) 11.0 (1.26) 14.8 (0.74) 14.5 (0.9

$50,000 to $74,999 ............ 11.3 (0.43) 1.2 (2.76) 2.0 (1.96) 4.2 (0.82) 7.8 (1.00) 13.0 (1.25) 21.4 (0.71) 18.6 (0.8

$75,000 to $99,999 ............ 3.3 (0.45) 0.2 (2.77) 0.3 (1.97) 0.9 (0.84) 1.9 (1.04) 2.0 (1.32) 7.3 (0.77) 5.8 (0.9

$100,000 or more............... 2.3 (0.45) 0.1 (2.77) 0.2 (1.97) 0.6 (0.84) 0.8 (1.04) 1.0 (1.33) 5.8 (0.77) 4.0 (0.9

Median income....................... $25,809 (88) $12,541 (342) $13,951 (318) $20,928 (113) $24,586 (271) $27,396 (291) $39,330 (388) $35,663 (20

Table 379. Distribution of income and median income of persons 25 years old and over, by highest level of educational attainment and sex: 2004—C

Sex and income TotalLess than9th grade

Somehigh school

(no completion)

High schoolcompletion

(includesequivalency)

College

Some college,no degree

Associate’sdegree Total

Bachelodegr

1 2 3 4 5 6 7 8

628 CHAPTER 5: Outcomes of EducationRecent High School and College Graduates

—Not available.†Not applicable.NOTE: Standard errors appear in parentheses.

SOURCE: U.S. Department of Education, National Center for Education Statistics, Comingof Age in the 1990's: The Eighth-Grade Class of 1988 12 Years Later, The National Educa-tion Longitudinal Study of 1988 (NELS:88/2000), “Fourth Follow-up, 2000.” (This table wasprepared April 2005.)

Table 380. Percentage of 1988 8th-graders who volunteered in various capacities in a 12-month period ending in 2000, by selected young adult characteristics: 2000

Young adult characteristic

Percent participating in voluntary or community service activity

Volunteered in ayouth organization

Volunteered in acivic or community organization

Participated in apolitical campaign

1 2 3 4

Total ............................................................................................................................................ 19.0 (0.67) 21.5 (0.99) 3.9 (0.43)

SexMale ................................................................................................................................................ 17.4 (0.95) 20.2 (1.68) 3.8 (0.45)Female ............................................................................................................................................ 20.7 (0.93) 22.9 (1.09) 4.0 (0.71)

Race/ethnicityWhite, non-Hispanic........................................................................................................................ 18.8 (0.70) 21.2 (0.73) 3.7 (0.38)Black, non-Hispanic ........................................................................................................................ 19.5 (2.72) 25.9 (6.09) 2.4 (0.90)Hispanic .......................................................................................................................................... 20.4 (2.48) 19.0 (3.02) 6.7 (2.68)Asian/Pacific Islander...................................................................................................................... 19.4 (2.73) 19.7 (2.62) 3.5 (1.09)American Indian/Alaska Native ....................................................................................................... 20.5 (5.89) 18.1 (7.85) 2.9 (1.43)

8th-grade socioeconomic status Lowest quartile................................................................................................................................ 14.5 (1.19) 12.7 (1.04) 2.4 (0.42)Middle two quartiles ........................................................................................................................ 18.8 (1.00) 22.4 (1.76) 4.0 (0.79)Highest quartile............................................................................................................................... 23.6 (1.29) 27.8 (1.21) 5.0 (0.52)

Mathematics achievement in 8th gradeLow ................................................................................................................................................. 16.1 (1.58) 21.0 (3.66) 2.4 (0.42)Middle two quartiles ........................................................................................................................ 18.8 (0.89) 18.5 (0.84) 3.5 (0.44)High ................................................................................................................................................ 23.3 (1.26) 28.0 (1.24) 4.2 (0.55)

Method of high school completion by 2000High school diploma ....................................................................................................................... 20.6 (0.75) 23.7 (1.11) 4.1 (0.49)GED certificate ............................................................................................................................... 14.9 (2.27) 12.3 (1.76) 4.1 (1.39)Certificate of attendance................................................................................................................. — (†) — (†) — (†)No diploma or equivalent ................................................................................................................ 7.9 (1.47) 9.5 (1.80) 1.8 (0.88)

Postsecondary attainment by 2000None ............................................................................................................................................... 12.4 (1.29) 12.0 (1.26) 2.3 (0.62)Less than bachelor’s degree........................................................................................................... 18.7 (1.07) 21.3 (1.87) 4.1 (0.77)Bachelor’s degree ........................................................................................................................... 24.6 (1.11) 29.3 (1.16) 5.1 (0.68)Master’s or higher degree ............................................................................................................... 27.2 (3.48) 32.2 (3.69) 3.5 (1.02)

DIGEST OF EDUCATION STATISTICS 2005

CH

AP

TE

R 5: O

utcomes of E

ducation629

Recent H

igh School and C

ollege Graduates

DIG

ES

T O

F E

DU

CAT

ION

STAT

IST

ICS

2005

task rated 326 to 375 requires the performance of multiple-featureion. A level 5 task rated 376 to 500 requires the reader to search

ake high-level text-based inferences. Adults at each performance at their own level.s in everyday life. A level 1 task rated 0 to 225 requires the reader to task rated 226 to 275 requires the reader to perform a single opera-ocated in the material. A level 3 task rated 276 to 325 requires thel 4 task rated 326 to 375 requires the reader to perform two or mores are found in different types of displays. A level 5 task rated 376 tolly. They must extract the features of the problem from text or rely ons needed. Adults at each performance level can perform the tasks

ducation Statistics, National Adult Literacy Survey, Adult Literacy in

Quantitative literacy3

ageore

Percent of adults with proficiency at level

1 2 3 4 5

14 15 16 17 18 19

0.7) 22 (0.5) 25 (0.6) 31 (0.6) 17 (0.3) 4 (0.2)

0.9) 21 (0.7) 23 (0.5) 31 (0.6) 20 (0.4) 5 (0.3)0.9) 23 (0.5) 28 (0.9) 31 (1.0) 15 (0.6) 3 (0.3)

1.8) 20 (1.7) 35 (2.6) 33 (1.9) 12 (1.5) 1 (0.5)1.6) 16 (1.1) 28 (1.4) 37 (1.4) 16 (1.0) 2 (0.5)0.9) 17 (0.6) 23 (0.7) 33 (0.6) 21 (0.6) 5 (0.4)1.7) 16 (0.9) 22 (1.0) 33 (1.1) 23 (1.1) 6 (0.4)2.0) 25 (1.3) 30 (1.9) 30 (1.0) 13 (1.2) 2 (0.5)2.5) 45 (1.6) 26 (1.2) 20 (1.2) 7 (0.7) 2 (0.4)

0.8) 14 (0.5) 24 (0.6) 35 (0.7) 21 (0.4) 5 (0.2)1.4) 46 (1.0) 34 (1.1) 17 (1.0) 3 (0.4) # (†)6.7) 30 (3.9) 23 (3.4) 27 (3.0) 16 (2.4) 4 (1.7).1)! 33 (5.6)! 32 (6.1)! 28 (5.9)! 7 (2.9)! 1 (1.0)!

3.6) 54 (1.7) 25 (2.0) 17 (2.0) 4 (0.8) # (†)2.9) 46 (6.4) 20 (6.1) 25 (5.2) 6 (5.6) 3 (2.5)7.2) 51 (3.3) 28 (4.8) 17 (3.2) 3 (1.3) 1 (0.4)5.7) 53 (3.7) 25 (4.1) 18 (2.8) 4 (1.5) # (†)6.9) 31 (3.0) 25 (4.6) 31 (3.1) 11 (4.7) 1 (0.7)

2.2) 19 (1.7) 35 (3.0) 32 (2.3) 12 (2.0) 1 (0.9)3.1) 76 (2.0) 18 (1.8) 5 (1.1) 1 (0.3) # (†)1.7) 45 (1.6) 34 (1.6) 17 (1.3) 3 (0.6) # (†)2.7) 16 (2.0) 38 (2.5) 35 (2.5) 10 (1.4) 1 (0.5)1.1) 18 (0.8) 33 (1.1) 37 (1.1) 12 (0.5) 1 (0.2)1.4) 8 (0.6) 23 (1.2) 42 (1.4) 23 (1.3) 4 (0.4)2.8) 4 (0.8) 19 (2.0) 43 (2.0) 29 (2.7) 5 (1.3)1.2) 4 (0.5) 12 (1.0) 35 (1.4) 38 (1.4) 12 (1.1)1.3) 2 (0.5) 9 (0.8) 30 (1.4) 42 (1.7) 17 (1.4)

1.2) 24 (0.8) 25 (0.8) 31 (0.8) 16 (0.6) 4 (0.4)1.7) 17 (1.0) 26 (1.5) 34 (1.4) 19 (0.9) 4 (0.3)2.0) 25 (1.0) 27 (1.0) 29 (1.1) 15 (0.8) 4 (0.3)1.8) 20 (1.0) 22 (0.9) 32 (1.0) 20 (1.0) 5 (0.4)(—) 40 (—) 32 (—) 22 (—) 6 (—) 1 (—)

_

—Not available.†Not applicable.#Rounds to zero.!Interpret data with caution.1Prose literacy is the ability to understand and use information contained in various kinds of textual material. A level 1 task rated 0 to225 requires the reader to locate a single piece of information in a short text. A level 2 task rated 226 to 275 requires the reader tolocate a single piece of information in the text with several distractors or to make low-level inferences. A level 3 task rated 276 to 325requires the reader to make literal or synonymous matches between the text and information given in the task, or to make low-levelinferences. A level 4 task rated 326 to 375 requires the reader to perform multiple-feature matches and to integrate or synthesizeinformation from complex passages. A level 5 task rated 376 to 500 requires the reader to search for information in dense text whichcontains a number of distractors. Adults at each performance level can perform the tasks below their level, but not all the tasks attheir own level.2Document literacy reflects the knowledge and skills used to process information from documents. A level 1 task rated 0 to 225requires the reader to locate pieces of information based on a literal match. A level 2 task rated 226 to 275 requires the reader tomatch a single piece of information among several distractors. A level 3 task rated 276 to 325 requires the reader to integrate multiple

pieces of information from one or more documents. A level 4 matches, cycling through documents, and integrating informatthrough complex displays that contain multiple distractors, to mlevel can perform the tasks below their level, but not all the tasks3Quantitative literacy is the ability to perform numerical operationperform a single, relatively simple, arithmetic operation. A level 2tion using numbers that are either stated in the task or easily lreader to use two or more numbers to solve the problem. A levesequential operations or a single operation in which the quantitie500 requires the reader to perform multiple operations sequentiabackground knowledge to determine the quantities or operationbelow their level, but not all the tasks at their own level.NOTE: Detail may not sum to totals because of rounding.SOURCE: U.S. Department of Education, National Center for EAmerica, 1992. (This table was prepared July 2005.)

Table 381. Literacy skills of adults, 16 years old and over, by type of literacy, proficiency levels, and selected characteristics: 1992

Selected characteristic

Prose literacy1 Document literacy2

Averagescore

Percent of adults with proficiency at levelAverage

score

Percent of adults with proficiency at levelAver

sc1 2 3 4 5 1 2 3 4 5

1 2 3 4 5 6 7 8 9 10 11 12 13

Total ................................................... 273 (0.6) 20 (0.4) 27 (0.6) 32 (0.7) 17 (0.4) 3 (0.2) 267 (0.7) 23 (0.4) 28 (0.5) 31 (0.5) 15 (0.4) 3 (0.2) 271 (Sex

Male ....................................................... 272 (0.9) 22 (0.6) 26 (0.9) 31 (1.2) 18 (0.5) 4 (0.3) 269 (0.9) 23 (0.6) 27 (0.5) 31 (0.8) 17 (0.5) 3 (0.2) 277 (Female ................................................... 273 (0.8) 20 (0.5) 28 (0.7) 33 (0.7) 17 (0.5) 3 (0.2) 265 (0.9) 23 (0.6) 30 (0.7) 31 (0.6) 14 (0.5) 2 (0.2) 266 (

Age16 to 18 years old .................................. 271 (1.8) 16 (1.3) 35 (1.9) 38 (2.4) 11 (1.7) 1 (0.4) 274 (1.8) 15 (1.4) 34 (2.2) 38 (2.5) 12 (1.9) 1 (0.5) 268 (19 to 24 years old .................................. 280 (1.3) 14 (1.1) 29 (1.7) 37 (1.3) 18 (1.3) 2 (0.4) 280 (1.3) 14 (1.0) 29 (1.4) 37 (1.5) 18 (1.1) 2 (0.4) 277 (25 to 39 years old .................................. 284 (0.9) 15 (0.5) 24 (0.7) 34 (0.5) 22 (0.8) 5 (0.4) 282 (1.0) 18 (0.6) 25 (0.7) 35 (0.6) 21 (0.8) 4 (0.4) 283 (40 to 54 years old .................................. 286 (1.4) 15 (0.7) 23 (1.0) 34 (1.4) 22 (0.9) 5 (0.4) 278 (1.3) 17 (0.8) 27 (0.9) 33 (1.0) 19 (1.0) 3 (0.5) 286 (55 to 64 years old .................................. 260 (1.9) 26 (1.5) 31 (1.3) 30 (1.5) 12 (1.1) 1 (0.3) 249 (1.9) 34 (1.4) 34 (1.4) 26 (1.3) 8 (0.8) 1 (0.3) 261 (65 years old and older ........................... 230 (2.1) 44 (1.6) 32 (1.8) 19 (1.3) 5 (0.9) 1 (0.3) 217 (2.1) 53 (1.5) 32 (1.2) 13 (1.0) 2 (0.5) # (†) 227 (

Race/ethnicityWhite, non-Hispanic............................... 286 (0.7) 14 (0.4) 25 (0.6) 36 (0.8) 21 (0.5) 4 (0.3) 280 (0.8) 16 (0.5) 27 (0.6) 34 (0.7) 19 (0.5) 3 (0.2) 287 (Black, non-Hispanic ............................... 237 (1.4) 38 (1.1) 37 (1.3) 21 (1.0) 4 (0.5) # (†) 230 (1.2) 42 (1.0) 36 (1.2) 18 (0.9) 3 (0.4) # (†) 224 (Asian/Pacific Islander............................. 242 (6.7) 36 (4.4) 25 (3.8) 25 (3.1) 12 (1.9) 2 (0.7) 245 (5.6) 34 (3.5) 25 (3.6) 28 (3.7) 12 (2.3) 2 (0.9) 256 (American Indian/Alaska Native .............. 254 (4.1)! 25 (5.9)! 39 (7.1)! 28 (7.3)! 7 (2.9)! 1 (1.5)! 254 (4.9)! 27 (4.1)! 37 (5.0!) 29 (5.7)! 7 (3.3)! # (†) 250 (5Hispanic, Mexican.................................. 206 (3.3) 54 (1.9) 25 (1.6) 16 (1.3) 5 (0.8) # (†) 205 (3.5) 54 (2.1) 25 (1.9) 16 (1.6) 4 (0.8) # (†) 205 (Hispanic, Cuban..................................... 211 (8.7) 53 (6.7) 24 (7.0) 17 (4.2) 6 (4.7) 1 (2.1) 212 (11.3) 48 (8.1) 30 (6.2) 16 (4.3) 4 (3.9) 2 (1.2) 223 (1Hispanic, Puerto Rican .......................... 218 (6.1) 47 (5.0) 32 (5.5) 17 (3.6) 3 (1.7) # (†) 215 (6.6) 49 (3.8) 29 (5.1) 18 (2.6) 3 (1.1) # (†) 212 (Hispanic, Central/South American ......... 207 (5.8) 56 (3.8) 22 (3.4) 17 (3.9) 4 (1.5) # (†) 206 (5.5) 53 (3.9) 25 (3.8) 16 (3.6) 4 (1.5) # (†) 203 (Hispanic, other ....................................... 260 (5.3) 25 (3.2) 27 (5.9) 33 (5.2) 13 (3.4) 2 (1.6) 254 (5.3) 28 (3.0) 26 (3.6) 32 (4.4) 12 (4.4) 2 (1.8) 246 (

Highest level of educationStill in high school .................................. 271 (2.0) 16 (1.8) 36 (2.2) 37 (2.6) 11 (1.9) # (†) 274 (1.9) 15 (1.5) 35 (2.3) 38 (2.6) 12 (1.5) 1 (0.6) 269 (0 to 8 years, not enrolled ....................... 176 (2.7) 75 (1.7) 21 (1.3) 4 (0.9) # (†) # (†) 169 (2.4) 79 (1.7) 18 (1.6) 3 (0.8) # (†) # (†) 169 (9 to 12 years, not enrolled ..................... 231 (1.5) 42 (1.4) 39 (1.1) 17 (1.0) 2 (0.4) # (†) 227 (1.6) 46 (1.6) 37 (1.6) 15 (1.3) 2 (0.4) # (†) 227 (GED ....................................................... 268 (1.8) 14 (1.6) 40 (2.5) 39 (2.8) 7 (1.2) # (†) 264 (2.2) 17 (2.0) 42 (2.7) 34 (2.3) 7 (1.1) # (†) 268 (High school diploma .............................. 270 (1.1) 16 (0.8) 36 (1.3) 37 (1.7) 10 (0.9) 1 (0.2) 264 (1.1) 20 (0.8) 38 (1.0) 33 (1.1) 9 (0.6) 1 (0.2) 270 (Some college ......................................... 294 (1.0) 8 (0.5) 23 (0.8) 45 (0.9) 22 (0.8) 3 (0.3) 290 (0.9) 9 (0.4) 27 (0.8) 42 (1.0) 20 (0.8) 2 (0.4) 295 (Associate’s degree................................. 308 (2.4) 4 (1.1) 19 (2.3) 41 (2.9) 32 (2.5) 4 (0.9) 299 (2.6) 6 (1.4) 23 (2.0) 43 (2.6) 25 (2.7) 3 (0.9) 307 (Bachelor’s degree .................................. 322 (1.6) 4 (0.7) 11 (1.2) 35 (2.0) 40 (1.5) 10 (1.3) 314 (1.4) 4 (0.5) 15 (1.3) 37 (1.5) 36 (1.2) 8 (1.2) 322 (Graduate studies/degree ....................... 336 (1.4) 2 (0.4) 7 (1.0) 28 (1.4) 47 (1.8) 16 (1.1) 326 (1.8) 3 (0.6) 10 (0.9) 34 (1.8) 41 (1.9) 12 (1.1) 334 (

RegionNortheast ............................................... 270 (1.1) 22 (0.8) 28 (1.5) 31 (1.1) 16 (0.7) 3 (0.3) 264 (1.2) 24 (0.9) 29 (1.1) 30 (1.1) 14 (1.0) 2 (0.3) 267 (Midwest.................................................. 279 (1.1) 16 (0.8) 28 (1.0) 35 (1.2) 18 (0.7) 3 (0.3) 274 (1.3) 19 (0.8) 30 (1.1) 33 (1.3) 16 (0.9) 2 (0.3) 280 (South ..................................................... 267 (1.9) 23 (1.1) 28 (1.1) 30 (0.9) 15 (1.1) 3 (0.3) 262 (1.9) 26 (1.2) 29 (0.8) 29 (1.0) 14 (0.7) 2 (0.3) 265 (West....................................................... 276 (1.8) 20 (1.2) 23 (1.5) 33 (1.5) 21 (1.1) 4 (0.5) 271 (1.6) 22 (1.0) 24 (1.3) 32 (1.2) 18 (1.1) 3 (0.4) 276 (

Prison population....................................... 246 (—) 31 (—) 37 (—) 26 (—) 6 (—) # (—) 240 (—) 33 (—) 38 (—) 25 (—) 4 (—) # (—) 236

630 CHAPTER 5: Outcomes of EducationRecent High School and College Graduates

_

—Not available.†Not applicable.1Includes use of other drugs not shown separately.NOTE: Marijuana includes hashish usage for 1996 and later years. Some estimates from1982 have been revised and may differ from previously published figures. Data for 1999through 2001 were gathered using Computer Assisted Interviewing (CAI) and may not be

directly comparable to previous years. Data for 1999 have been revised from previouslypublished figures. Standard errors appear in parentheses.SOURCE: U.S. Department of Health and Human Services, Substance Abuse and MentalHealth Services Administration, National Household Survey on Drug Abuse: Main Findings,various years. National Survey on Drug Use and Health, 2003. (This table was preparedAugust 2005.)

_

—Not available.†Not applicable.1In 2004 the question was “Importance of helping others in the community.”NOTE: Standard errors appear in parentheses.SOURCE: U.S. Department of Education, National Center for Education Statistics, NationalLongitudinal Study of the High School Class of 1972, “Base Year” (NLS:72), “Second Fol-

low-up” (NLS:72/74), and “Third Follow-up” (NLS:72/76); The National Education Longitu-dinal Study of 1988, “Second Follow-up, Student Survey, 1992” (NELS:88/92) and “ThirdFollow-up, 1994” (NELS:88/94); and Education Longitudinal Study of 2002, “First Follow-up” (ELS:02/04). (This table was prepared November 2005.)

Table 382. Percentage of 18- to 25-year-olds reporting drug use during the past 30 days and during the past year: Selected years, 1982 to 2003

Year

Percent reporting drug use during past 30 days Percent reporting drug use during past year

Illicit drug use

Alcohol Cigarettes

Illicit drug use

Alcohol CigarettesAny1 Marijuana Cocaine Any1 Marijuana Cocaine

1 2 3 4 5 6 7 8 9 10 11

1982.................................... — (†) 27.2 (—) 7.0 (—) 66.6 (—) — (†) — (†) 37.4 (—) 15.9 (—) 80.6 (—) — (†)1985.................................... 25.3 (—) 21.7 (—) 8.1 (—) 70.1 (—) 47.4 (—) 37.4 (—) 34.0 (—) 13.6 (—) 84.2 (—) 49.9 (—)1988.................................... 17.9 (—) 15.3 (—) 4.8 (—) 64.7 (—) 45.6 (—) 29.1 (—) 26.1 (—) 10.5 (—) 79.6 (—) 50.9 (—)1990.................................... 15.0 (—) 12.7 (—) 2.3 (—) 62.8 (—) 40.9 (—) 26.1 (—) 23.0 (—) 6.5 (—) 78.1 (—) 45.1 (—)1991.................................... 15.4 (—) 12.9 (—) 2.2 (—) 63.1 (—) 41.7 (—) 26.6 (—) 22.9 (—) 6.7 (—) 80.7 (—) 46.9 (—)

1992................................... 13.1 (—) 10.9 (—) 2.0 (—) 58.6 (—) 41.5 (—) 24.1 (—) 21.2 (—) 5.5 (—) 75.6 (—) 46.8 (—)1993.................................... 13.6 (—) 11.1 (—) 1.6 (—) 58.7 (—) 37.9 (—) 24.2 (—) 21.4 (—) 4.4 (—) 76.9 (—) 43.7 (—)1994.................................... 13.3 (—) 12.1 (—) 1.2 (—) 63.1 (—) 34.6 (—) 24.6 (—) 21.8 (—) 3.6 (—) 78.5 (—) 41.1 (—)1995.................................... 14.2 (—) 12.0 (—) 1.3 (—) 61.3 (—) 35.3 (—) 25.5 (—) 21.8 (—) 4.3 (—) 76.5 (—) 42.5 (—)1996.................................... 15.6 (—) 13.2 (—) 2.0 (—) 60.0 (—) 38.3 (—) 26.8 (—) 23.8 (—) 4.7 (—) 75.3 (—) 44.7 (—)

1997................................... 14.7 (—) 12.8 (—) 1.2 (—) 58.4 (—) 40.6 (—) 25.3 (—) 22.3 (—) 3.9 (—) 75.1 (—) 45.9 (—)1998.................................... 16.1 (—) 13.8 (—) 2.0 (—) 60.0 (—) 41.6 (—) 27.4 (—) 24.1 (—) 4.7 (—) 74.2 (—) 47.1 (—)1999.................................... 16.4 (0.40) 14.2 (0.38) 1.7 (0.12) 57.2 (0.54) 39.7 (0.47) 29.1 (0.48) 24.5 (0.46) 5.2 (0.21) 74.8 (0.48) 47.5 (0.52)2000.................................... 15.9 (0.36) 13.6 (0.34) 1.4 (0.11) 56.8 (0.51) 38.3 (0.48) 27.9 (0.46) 23.7 (0.43) 4.4 (0.18) 74.5 (0.46) 45.8 (0.49)2001.................................... 18.8 (0.41) 16.0 (0.39) 1.9 (0.13) 58.8 (0.50) 39.1 (0.47) 31.9 (0.48) 26.7 (0.48) 5.7 (0.23) 75.4 (0.41) 46.8 (0.48)

2002................................... 20.2 (0.37) 17.3 (0.36) 2.0 (0.12) 60.5 (0.53) 40.8 (0.48) 35.5 (0.46) 29.8 (0.43) 6.7 (0.24) 77.9 (0.41) 49.0 (0.50)2003.................................... 20.3 (0.40) 17.0 (0.37) 2.2 (0.13) 61.4 (0.50) 40.2 (0.47) 34.6 (0.48) 28.5 (0.46) 6.6 (0.23) 78.1 (0.41) 47.6 (0.46)

Table 383. Percentage of 1972 high school seniors, 1992 high school seniors, and 2004 high school seniors who felt that certain life values were “very important,” by sex: Selected years, 1972 through 2004

Life value

Percent of 1972 seniors Percent of 1992 seniors

Percent of 2004 seniors1972

1974(2 years after high school)

1976(4 years after high school) 1992

1994 (2 years after high school)

Male Female Male Female Male Female Male Female Total Male Female Total Male Female

1 2 3 4 5 6 7 8 9 10 11 12 13 14 15

Being successful in work ......................... 86.5 83.0 81.2 74.9 80.3 69.7 89.0 89.6 90.1 89.9 90.3 91.3 (0.33) 89.7 (0.49) 92.9 (0.40)

Finding steady work................................. 82.3 73.7 74.7 59.9 79.3 62.1 87.1 88.6 89.7 88.7 90.7 87.3 (0.40) 85.6 (0.55) 89.0 (0.49)

Having lots of money ............................... 26.0 9.8 17.8 9.1 17.7 9.4 45.3 29.4 35.2 39.5 30.9 35.1 (0.58) 42.7 (0.80) 27.6 (0.69)

Being a leader in the community1............ 14.9 8.0 8.5 4.4 9.2 4.2 — — — — — 41.7 (0.57) 35.2 (0.77) 48.1 (0.74)

Correcting inequalities ............................. 22.5 31.1 16.6 18.2 16.2 17.1 17.0 23.6 — — — 19.7 (0.46) 18.1 (0.60) 21.2 (0.67)

Having children........................................ — — — — — — 39.0 49.2 — — — 49.3 (0.55) 45.4 (0.75) 53.2 (0.78)

Having a happy family life ........................ 78.6 85.7 83.1 86.7 84.2 86.4 — — — — — 81.0 (0.46) 80.1 (0.63) 81.9 (0.64)

Providing better opportunities for my children .............................................. 66.6 66.2 59.5 61.6 59.8 58.8 74.5 76.5 90.5 90.3 90.8 82.5 (0.45) 82.1 (0.64) 82.9 (0.58)

Living closer to parents or relatives ......... 6.8 8.2 8.3 12.4 7.7 11.9 15.2 18.7 — — — — (†) — (†) — (†)

Moving from area..................................... 14.3 14.6 8.3 7.4 6.7 6.4 20.7 20.1 — — — — (†) — (†) — (†)

Having strong friendships ........................ 81.2 78.7 76.5 74.7 76.1 72.1 79.8 80.0 87.6 88.1 87.0 85.5 (0.41) 84.9 (0.56) 86.1 (0.57)

Having leisure time .................................. — — 60.9 55.1 65.4 60.1 65.3 62.0 — — — 69.0 (0.55) 70.2 (0.69) 67.8 (0.74)

DIGEST OF EDUCATION STATISTICS 2005

CHAPTER 5: Outcomes of Education 631Recent High School and College Graduates

_

NOTE: Standard errors appear in parentheses.SOURCE: U.S. Department of Education, National Center for Education Statistics,Coming of Age in the 1990's: The Eighth-Grade Class of 1988 12 Years Later, National

Education Longitudinal Study of 1988 (NELS:88/2000), “Fourth Follow-up, 2000.” (Thistable was prepared April 2005.)

Table 384. Percentage of employed 1988 8th-graders satisfied with various aspects of their job, by educational attainment: 2000

Educational attainment

Percentage who were satisfied with

Fringe benefits Further trainingUse of past

trainingPromotion

opportunity Job security Work importance Pay Job overall

1 2 3 4 5 6 7 8 9

Method of high school completion by 2000High school diploma ..................................... 79.2 (0.84) 79.0 (0.89) 80.3 (1.24) 71.5 (1.19) 89.9 (0.59) 83.7 (0.78) 73.0 (0.95) 86.8 (0.69)GED certificate ............................................. 69.1 (4.47) 74.4 (4.22) 74.9 (4.46) 73.1 (4.35) 90.3 (2.48) 80.4 (4.26) 75.6 (4.13) 83.7 (4.01)No diploma or equivalent .............................. 48.2 (6.61) 68.9 (6.38) 72.5 (6.29) 62.5 (6.68) 72.8 (6.21) 85.3 (5.14) 65.0 (6.90) 74.0 (6.44)

Postsecondary attainment by 2000None ............................................................. 69.4 (2.80) 71.7 (2.73) 77.1 (2.68) 69.1 (2.65) 85.6 (2.18) 84.0 (2.48) 74.5 (2.45) 83.3 (2.53)Less than bachelor’s degree......................... 74.7 (1.62) 77.0 (1.36) 76.0 (2.06) 68.1 (1.98) 89.3 (0.93) 81.2 (1.18) 71.3 (1.65) 84.0 (1.19)Bachelor’s degree ......................................... 83.0 (1.15) 83.2 (1.18) 84.7 (1.02) 75.8 (1.21) 90.2 (0.99) 85.9 (1.00) 73.0 (1.30) 89.3 (0.91)Master’s or higher degree ............................. 87.0 (2.19) 89.3 (1.91) 92.8 (1.32) 82.1 (2.31) 92.0 (1.70) 93.1 (1.38) 75.1 (3.64) 94.5 (1.18)

DIGEST OF EDUCATION STATISTICS 2005


Recommended