26
Chapter 5 Uncertainty and Consumer Behavior
| Date post: | 18-Dec-2015 |
| Category: |
Documents |
| Upload: | osborne-carr |
| View: | 226 times |
| Download: | 2 times |

Chapter 5
Uncertainty and Consumer Behavior
CHAPTER 5 OUTLINE
5.1 Describing Risk
5.2 Preferences Toward Risk
5.3 Reducing Risk
5.4 The Demand for Risky Assets
5.5 Behavioral Economics
Uncertainty and Consumer Behavior
1. In order to compare the riskiness of alternative choices, we need to quantify risk.
2. We will examine people’s preferences toward risk.
3. We will see how people can sometimes reduce or eliminate risk.
4. In some situations, people must choose the amount of risk they wish to bear.
To examine the ways that people can compare and choose among risky alternatives, we will take the following steps:
DESCRIBING RISKProbability
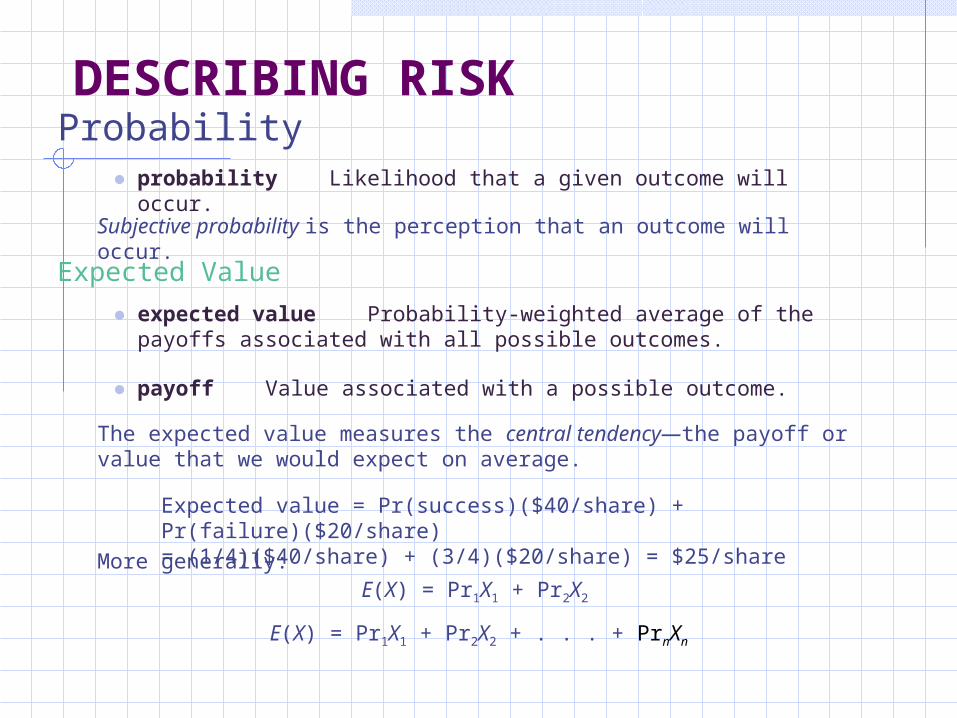
● probability Likelihood that a given outcome will occur.
Subjective probability is the perception that an outcome will occur.
● expected value Probability-weighted average of the payoffs associated with all possible outcomes.
Expected Value
● payoff Value associated with a possible outcome.
The expected value measures the central tendency—the payoff or value that we would expect on average.
Expected value = Pr(success)($40/share) + Pr(failure)($20/share)= (1/4)($40/share) + (3/4)($20/share) = $25/share
E(X) = Pr1X1 + Pr2X2
E(X) = Pr1X1 + Pr2X2 + . . . + PrnXn
More generally:
DESCRIBING RISKVariability
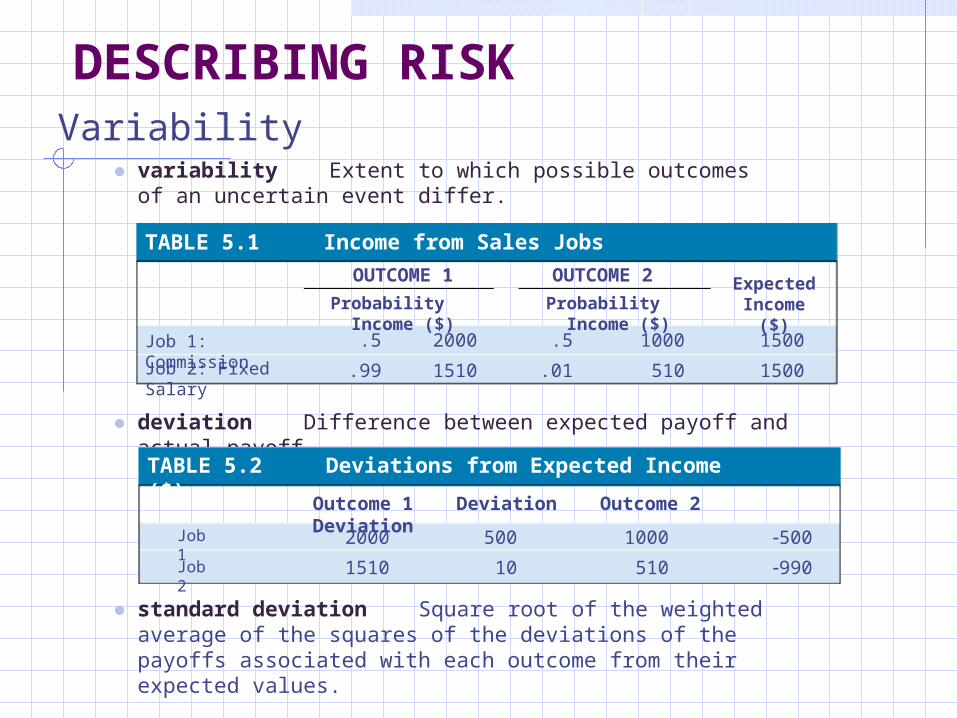
● variability Extent to which possible outcomes of an uncertain event differ.
● deviation Difference between expected payoff and actual payoff.
OUTCOME 1 OUTCOME 2
Probability Income ($) Probability Income ($)ExpectedIncome ($)
Job 1: Commission
Job 2: Fixed Salary
.5
.99
2000
1510
1000
510
.5
.01
1500
1500
TABLE 5.1 Income from Sales Jobs
TABLE 5.2 Deviations from Expected Income ($)
Outcome 1 Deviation Outcome 2 Deviation
Job 1
Job 2
2000
1510
500
10
1000
510
500
990
● standard deviation Square root of the weighted average of the squares of the deviations of the payoffs associated with each outcome from their expected values.
DESCRIBING RISKVariability
Outcome 1DeviationSquared
DeviationSquaredOutcome 2
DeviationSquared
Weighted AverageStandardDeviation
Job 1
Job 2
2000
1510
250,000
100
1000
510
250,000
980,100
250,000
9900
500
99.50
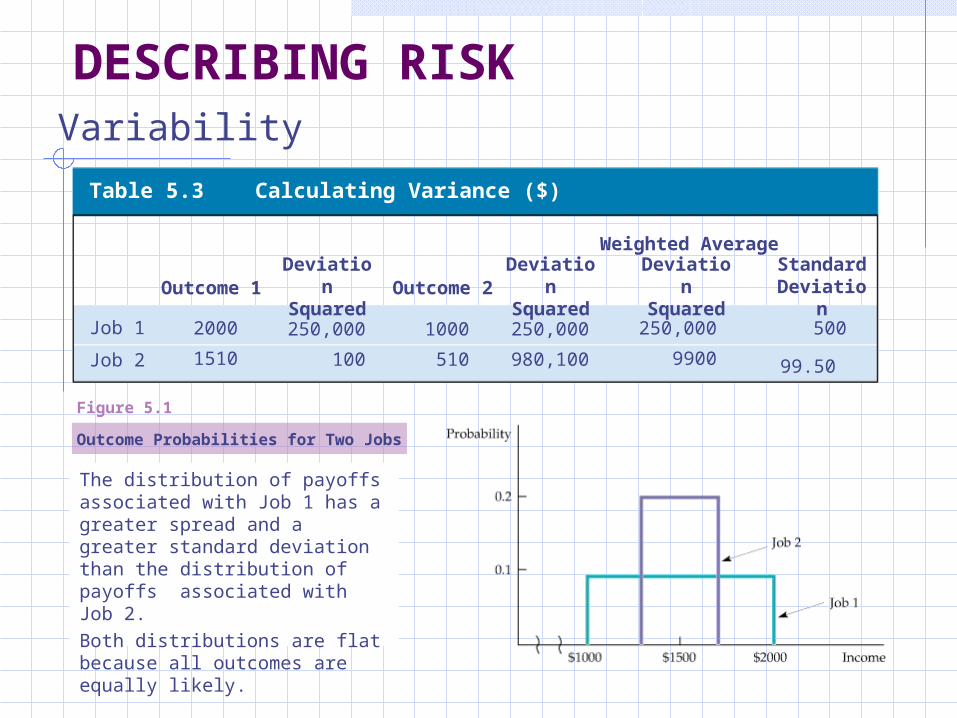
Table 5.3 Calculating Variance ($)
Outcome Probabilities for Two Jobs
The distribution of payoffs associated with Job 1 has a greater spread and a greater standard deviation than the distribution of payoffs associated with Job 2.
Both distributions are flat because all outcomes are equally likely.
Figure 5.1
DESCRIBING RISKVariability
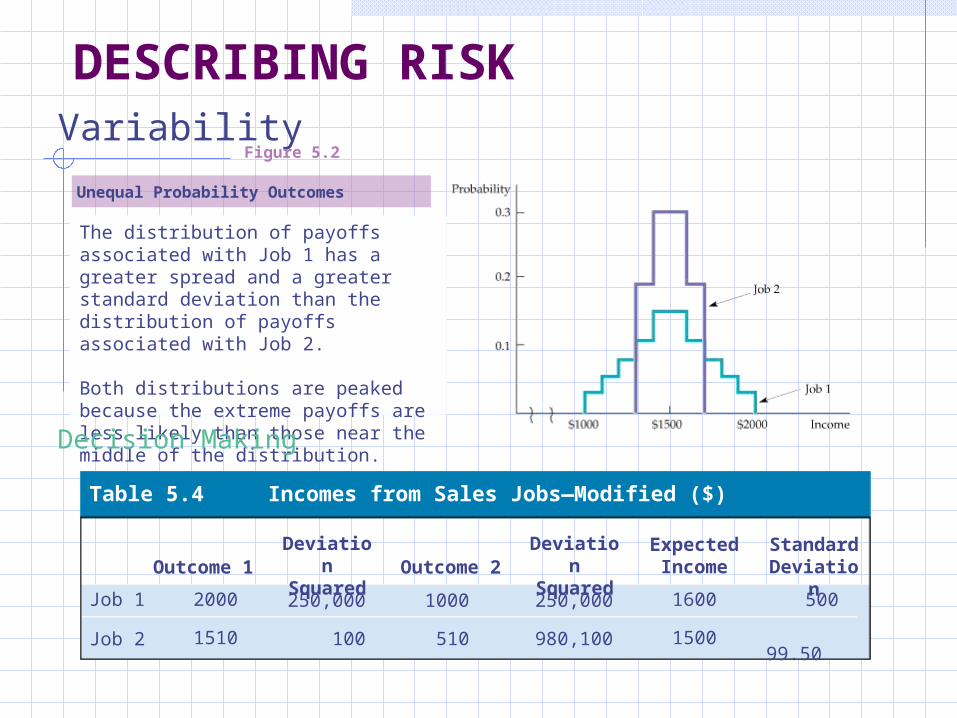
Unequal Probability Outcomes
The distribution of payoffs associated with Job 1 has a greater spread and a greater standard deviation than the distribution of payoffs associated with Job 2.
Both distributions are peaked because the extreme payoffs are less likely than those near the middle of the distribution.
Figure 5.2
Decision Making
Table 5.4 Incomes from Sales Jobs—Modified ($)
Outcome 1DeviationSquared
DeviationSquaredOutcome 2
StandardDeviation
ExpectedIncome
Job 1
Job 2
2000
1510
250,000
100
1000
510
250,000
980,100
500
99.50
1600
1500
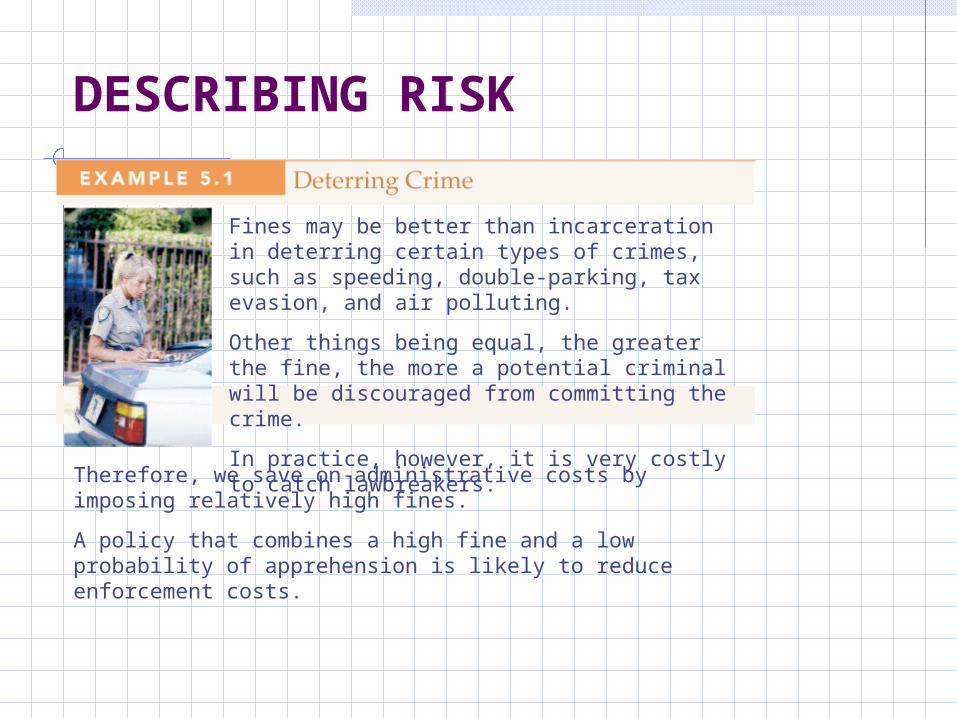
Fines may be better than incarceration in deterring certain types of crimes, such as speeding, double-parking, tax evasion, and air polluting.
Other things being equal, the greater the fine, the more a potential criminal will be discouraged from committing the crime.
In practice, however, it is very costly to catch lawbreakers.
DESCRIBING RISK
Therefore, we save on administrative costs by imposing relatively high fines.
A policy that combines a high fine and a low probability of apprehension is likely to reduce enforcement costs.
PREFERENCES TOWARD RISK
● risk averse Condition of preferring a certain income to a risky income with the same expected value.
● risk neutral Condition of being indifferent between a certain income and an uncertain income with the same expected value.
● risk loving Condition of preferring a risky income to a certain income with the same expected value.
Different Preferences Toward Risk
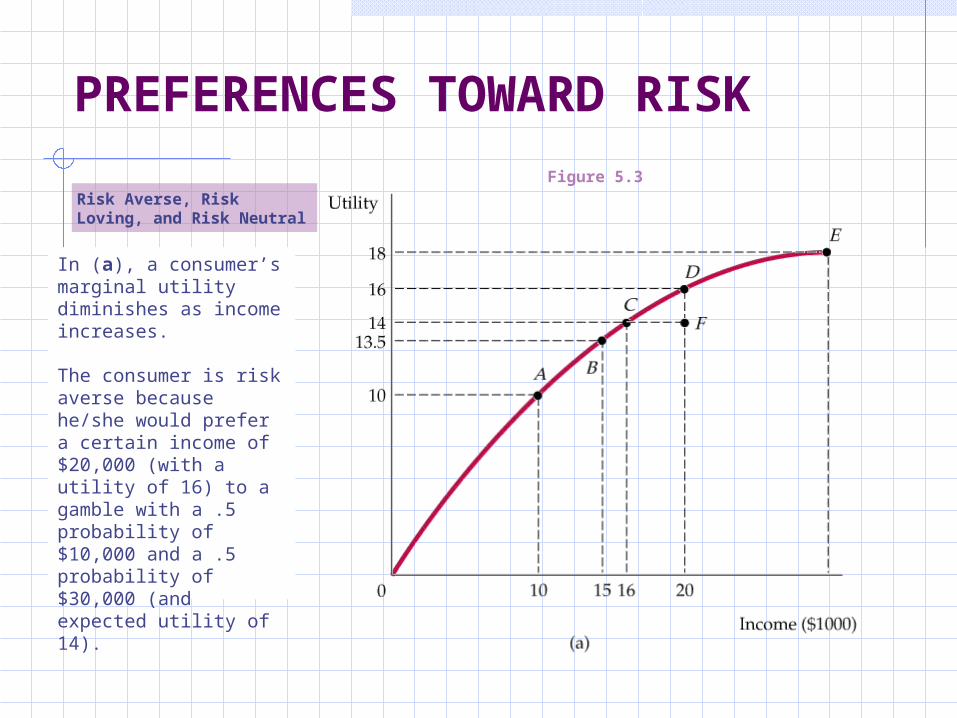
PREFERENCES TOWARD RISKRisk Averse, Risk Loving, and Risk Neutral
In (a), a consumer’s marginal utility diminishes as income increases.
The consumer is risk averse because he/she would prefer a certain income of $20,000 (with a utility of 16) to a gamble with a .5 probability of $10,000 and a .5 probability of $30,000 (and expected utility of 14).
Figure 5.3
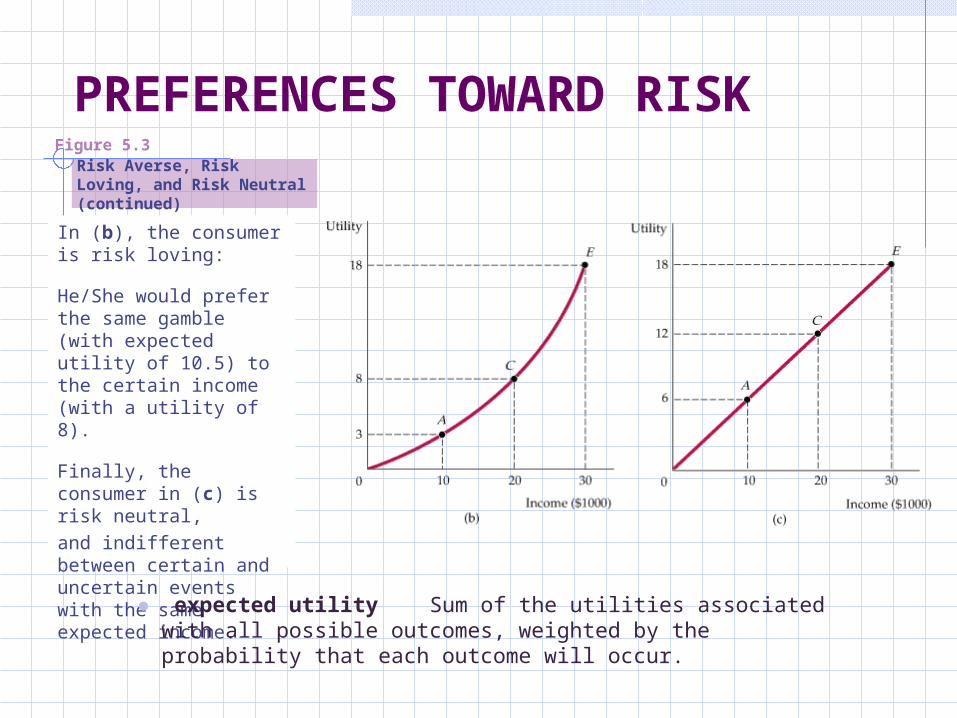
PREFERENCES TOWARD RISKRisk Averse, Risk Loving, and Risk Neutral (continued)
In (b), the consumer is risk loving:
He/She would prefer the same gamble (with expected utility of 10.5) to the certain income (with a utility of 8).
Finally, the consumer in (c) is risk neutral,
and indifferent between certain and uncertain events with the same expected income.
Figure 5.3
● expected utility Sum of the utilities associated with all possible outcomes, weighted by the probability that each outcome will occur.
PREFERENCES TOWARD RISK
Different Preferences Toward RiskRisk Premium
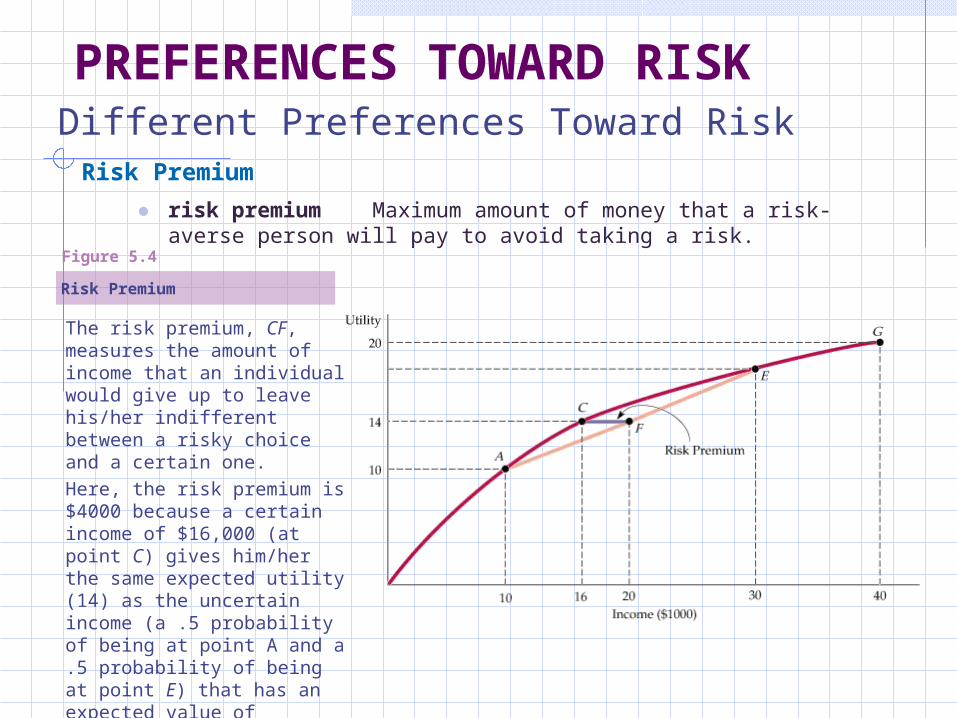
● risk premium Maximum amount of money that a risk-averse person will pay to avoid taking a risk.
Risk Premium
Figure 5.4
The risk premium, CF, measures the amount of income that an individual would give up to leave his/her indifferent between a risky choice and a certain one.
Here, the risk premium is $4000 because a certain income of $16,000 (at point C) gives him/her the same expected utility (14) as the uncertain income (a .5 probability of being at point A and a .5 probability of being at point E) that has an expected value of $20,000.
PREFERENCES TOWARD RISK
Different Preferences Toward Risk Risk Aversion and Income
The extent of an individual’s risk aversion depends on the nature of the risk and on the person’s income.
Other things being equal, risk-averse people prefer a smaller variability of outcomes.
The greater the variability of income, the more the person would be willing to pay to avoid the risky situation.
PREFERENCES TOWARD RISK
Different Preferences Toward Risk
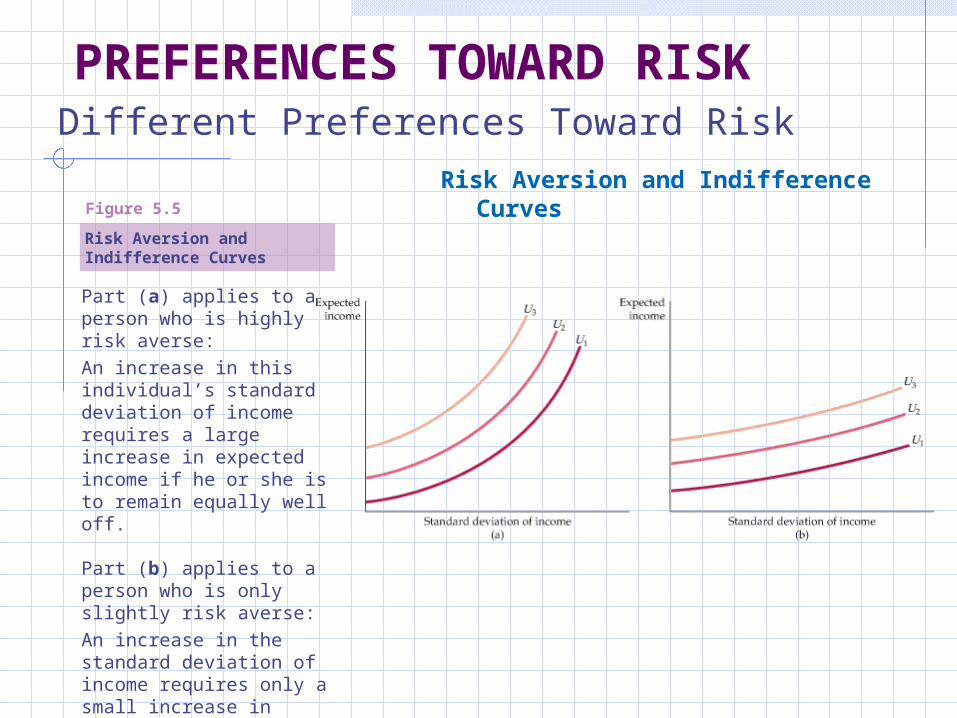
Risk Aversion and Indifference Curves
Figure 5.5
Part (a) applies to a person who is highly risk averse:
An increase in this individual’s standard deviation of income requires a large increase in expected income if he or she is to remain equally well off.
Part (b) applies to a person who is only slightly risk averse:
An increase in the standard deviation of income requires only a small increase in expected income if he or she is to remain equally well off.
Risk Aversion and Indifference Curves
PREFERENCES TOWARD RISK
Are business executives more risk loving than most people?
In one study, 464 executives were asked to respond to a questionnaire describing risky situations that an individual might face as vice president of a hypothetical company.
The payoffs and probabilities were chosen so that each event had the same expected value.
In increasing order of the risk involved, the four events were:1. A lawsuit involving a patent violation 2. A customer threatening to buy from a competitor3. A union dispute4. A joint venture with a competitor
The study found that executives vary substantially in their preferences toward risk.
More importantly, executives typically made efforts to reduce or eliminate risk, usually by delaying decisions and collecting more information.
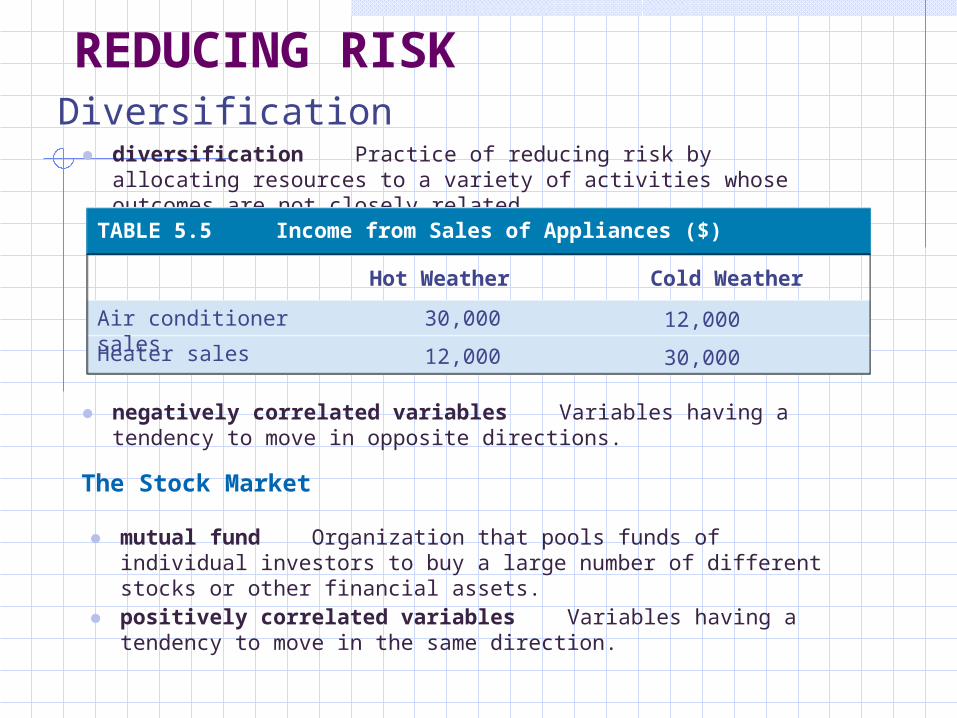
REDUCING RISKDiversification● diversification Practice of reducing risk by allocating resources to a
variety of activities whose outcomes are not closely related.
TABLE 5.5 Income from Sales of Appliances ($)
Hot Weather Cold Weather
Air conditioner sales
Heater sales
30,000
12,000
12,000
30,000
● negatively correlated variables Variables having a tendency to move in opposite directions.
● mutual fund Organization that pools funds of individual investors to buy a large number of different stocks or other financial assets.
● positively correlated variables Variables having a tendency to move in the same direction.
The Stock Market
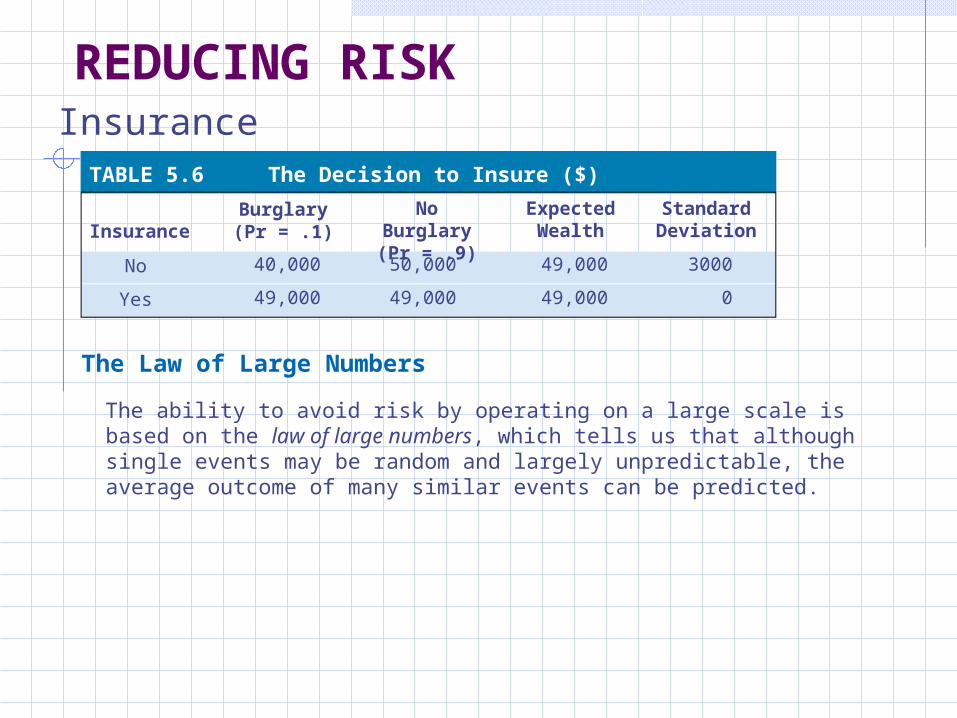
REDUCING RISKInsurance
The ability to avoid risk by operating on a large scale is based on the law of large numbers, which tells us that although single events may be random and largely unpredictable, the average outcome of many similar events can be predicted.
TABLE 5.6 The Decision to Insure ($)
InsuranceBurglary(Pr = .1)
No Burglary(Pr = .9)
ExpectedWealth
StandardDeviation
No
Yes
40,000
49,000
50,000
49,000
49,000
49,000
3000
0
The Law of Large Numbers
REDUCING RISKThe Value of Information
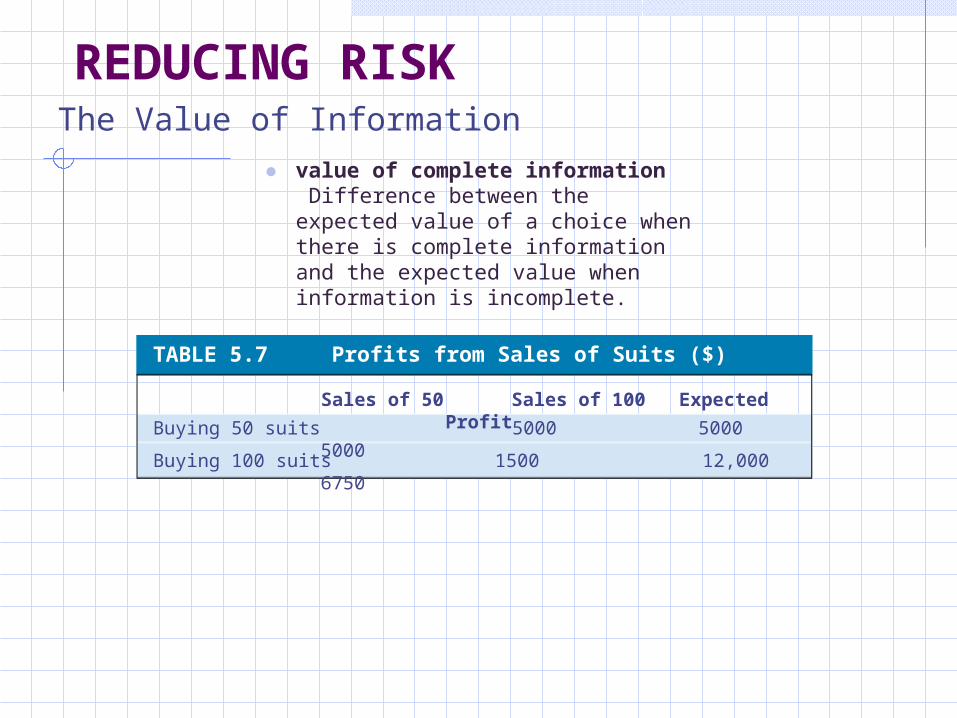
● value of complete information Difference between the expected value of a choice when there is complete information and the expected value when information is incomplete.
TABLE 5.7 Profits from Sales of Suits ($)
Sales of 50 Sales of 100 Expected Profit
Buying 50 suits 5000 5000 5000
Buying 100 suits 1500 12,000 6750
REDUCING RISK
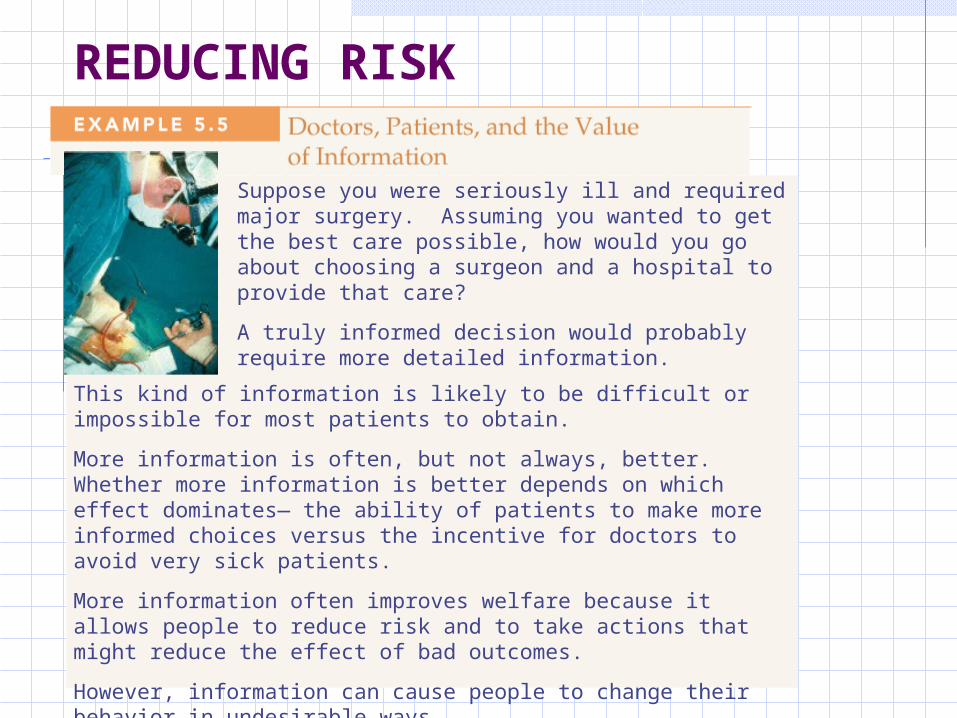
Suppose you were seriously ill and required major surgery. Assuming you wanted to get the best care possible, how would you go about choosing a surgeon and a hospital to provide that care?
A truly informed decision would probably require more detailed information.
This kind of information is likely to be difficult or impossible for most patients to obtain.
More information is often, but not always, better. Whether more information is better depends on which effect dominates— the ability of patients to make more informed choices versus the incentive for doctors to avoid very sick patients.
More information often improves welfare because it allows people to reduce risk and to take actions that might reduce the effect of bad outcomes.
However, information can cause people to change their behavior in undesirable ways.
THE DEMAND FOR RISKY ASSETSAssets
● asset Something that provides a flow of money or services to its owner.
● riskless (or risk-free) asset Asset that provides a flow of money or services that is known with certainty.
An increase in the value of an asset is a capital gain; a decrease is a capital loss.
Risky and Riskless Assets
● risky asset Asset that provides an uncertain flow of money or services to its owner.
THE DEMAND FOR RISKY ASSETS
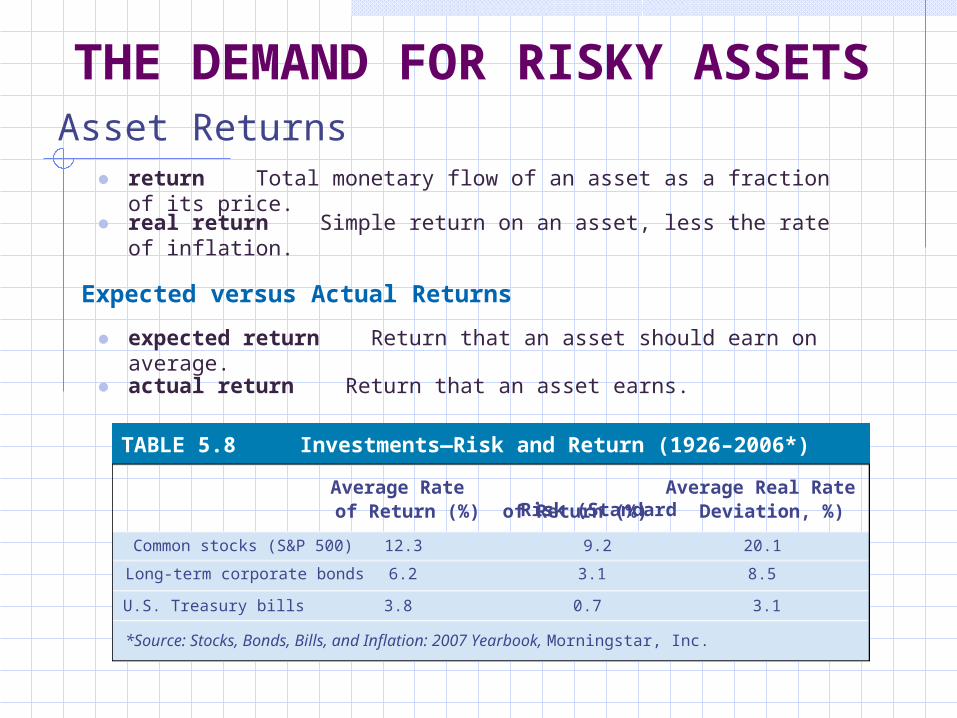
Asset Returns● return Total monetary flow of an asset as a fraction of its price.
● real return Simple return on an asset, less the rate of inflation.
Expected versus Actual Returns
● expected return Return that an asset should earn on average.
● actual return Return that an asset earns.
TABLE 5.8 Investments—Risk and Return (1926–2006*)
Average Rate Average Real Rate Risk (Standard
Common stocks (S&P 500) 12.3 9.2 20.1
of Return (%) of Return (%) Deviation, %)
Long-term corporate bonds 6.2 3.1 8.5
U.S. Treasury bills 3.8 0.7 3.1
*Source: Stocks, Bonds, Bills, and Inflation: 2007 Yearbook, Morningstar, Inc.
BEHAVIORAL ECONOMICS
Recall that the basic theory of consumer demand is based on three assumptions:
(1) consumers have clear preferences for some goods over others;
(2) consumers face budget constraints; and
(3) given their preferences, limited incomes, and the prices of different goods, consumers choose to buy combinations of goods that maximize their satisfaction or utility.
These assumptions, however, are not always realistic.
Perhaps our understanding of consumer demand (as well as the decisions of firms) would be improved if we incorporated more realistic and detailed assumptions regarding human behavior.
This has been the objective of the newly flourishing field of behavioral economics.
BEHAVIORAL ECONOMICS
• There has just been a big snowstorm, so you stop at the hardware store to buy a snow shovel. You had expected to pay $20 for the shovel—the price that the store normally charges. However, you find that the store has suddenly raised the price to $40. Although you would expect a price increase because of the storm, you feel that a doubling of the price is unfair and that the store is trying to take advantage of you. Out of spite, you do not buy the shovel.
• Tired of being snowed in at home you decide to take a vacation in the country. On the way, you stop at a highway restaurant for lunch. Even though you are unlikely to return to that restaurant, you believe that it is fair and appropriate to leave a 15-percent tip in appreciation of the good service that you received.
• You buy this textbook from an Internet bookseller because the price is lower than the price at your local bookstore. However, you ignore the shipping cost when comparing prices.
Some examples of consumer behavior that cannot be easily explained with the basic utility-maximizing assumptions:
BEHAVIORAL ECONOMICSMore Complex Preferences
● reference point The point from which an individual makes a consumption decision.
● endowment effect Tendency of individuals to value an item more when they own it than when they do not.
● loss aversion Tendency for individuals to prefer avoiding losses over acquiring gains.
● anchoring Tendency to rely heavily on one prior (suggested) piece of information when making a decision.
Rules of Thumb and Biases in Decision Making
BEHAVIORAL ECONOMICSProbabilities and Uncertainty
An important part of decision making under uncertainty is the calculation of expected utility, which requires two pieces of information: a utility value for each outcome (from the utility function) and the probability of each outcome.
People are sometimes prone to a bias called the law of small numbers: They tend to overstate the probability that certain events will occur when faced with relatively little information from recent memory.
Forming subjective probabilities is not always an easy task and people are generally prone to several biases in the process.
Summing Up
The basic theory that we learned up to now helps us to understand and evaluate the characteristics of consumer demand and to predict the impact on demand of changes in prices or incomes.
The developing field of behavioral economics tries to explain and to elaborate on those situations that are not well explained by the basic consumer model.
BEHAVIORAL ECONOMICS
A different study, also of New York City cabdrivers who rented their taxis, concluded that the traditional economic model does indeed offer important insights into drivers’ behavior.
The study concluded that daily income had only a small effect on a driver’s decision as to when to quit for the day.
Rather, the decision to stop appears to be based on the cumulative number of hours already worked that day and not on hitting a specific income target.
What can account for these two seemingly contradictory results? The two studies used different techniques in analyzing and interpreting the taxicab trip records.


