CHAPTER-8 ASSET LIABILITY MANAGEMENT IN THE BANKS: AN OVERVIEW. 1. Introduction : The reform measures heralded several epoch making changes in the financial sector to make them more competitive. It includes deregulation of interest rates, reduction of reserve requirements (CRR and SLR), integration of various segment of financial markets, allowing banks to access capital market for augmenting capital base to meet their capital adequacy, fi^eedom in operational matters, greater emphasis on the use of information technology, moving towards capital account convertibility and so on. These measures emphasise on internal consolidation of banks and covers organisational restructuring to match with competitive environment Among the important aspects of such re-engineering are Asset Liability Management (ALM), Risk Management and greater penetration to technology and strategies management. The aim of these strategies is to improve efficiency by managing risk properly so as to improve profitability of banks. The present chapter is devoted to focus on ALM in the bank. It is divided into three sections. The first section deals with conceptual fi-amework of ALM. It covers, need, types, guidelines, Basel Accord and RBI guidelines and techniques of risk management Section two is devoted to identify the necessity of ALM in the domestic banking system and the final section, three, analyses structural changes of variables of banking sector during post reform period and changes of average ranking of PSBs over the years using CRAMEL approach I Intricacies of ALM: ALM envisages the process of managing net interest margin (NIM) within the overall risk. The key objective of ALM is that of sustaining profitability in such a manner as to augment capital resources It calls for an integrated approach towards simultaneous decision making with regard to type and size of financial assets and liabilities (Baker, 1983)'. The success of banks hinges on its ability to match its assets with its liabilities in terms of rate and maturity to optimise the yield. This can be illustrated by the following example :- Suppose, a bank that borrows USD 100 MM at 3.00 pc for a year and lends the same 'Baker, J. V R 19S2. Asset Liability Management. American Bankers Association. Washington. 179
Transcript
CHAPTER-8 ASSET LIABILITY MANAGEMENT IN THE BANKS: AN OVERVIEW.
1. Introduction :
The reform measures heralded several epoch making changes in the financial sector to
make them more competitive. It includes deregulation of interest rates, reduction of
reserve requirements (CRR and SLR), integration of various segment of financial
markets, allowing banks to access capital market for augmenting capital base to meet
their capital adequacy, fi^eedom in operational matters, greater emphasis on the use of
information technology, moving towards capital account convertibility and so on. These
measures emphasise on internal consolidation of banks and covers organisational
restructuring to match with competitive environment Among the important aspects of
such re-engineering are Asset Liability Management (ALM), Risk Management and
greater penetration to technology and strategies management. The aim of these
strategies is to improve efficiency by managing risk properly so as to improve
profitability of banks. The present chapter is devoted to focus on ALM in the bank. It is
divided into three sections. The first section deals with conceptual fi-amework of
ALM. It covers, need, types, guidelines, Basel Accord and RBI guidelines and
techniques of risk management Section two is devoted to identify the necessity of
ALM in the domestic banking system and the final section, three, analyses structural
changes of variables of banking sector during post reform period and changes of
average ranking of PSBs over the years using CRAMEL approach
I
Intricacies of ALM:
ALM envisages the process of managing net interest margin (NIM) within the overall
risk. The key objective of ALM is that of sustaining profitability in such a manner as to
augment capital resources It calls for an integrated approach towards simultaneous
decision making with regard to type and size of financial assets and liabilities (Baker,
1983)'. The success of banks hinges on its ability to match its assets with its liabilities
in terms of rate and maturity to optimise the yield. This can be illustrated by the
following example :-
Suppose, a bank that borrows USD 100 MM at 3.00 pc for a year and lends the same
'Baker, J. V R 19S2. Asset Liability Management. American Bankers Association. Washington.
179
money at 3.20 pc to a highly rated borrower for 5 years. For simplicity, assume interest
rates are annually compounded and all interest accumulates to the maturity of the
respective obligations. The net transaction appears profitable - the bank is earning a 20
basis point spread - but it entails considerable risk. At the end of a year, the bank will
have to find new financing for the loan, which will have 4 more years before it matures.
If interest rates have risen, the bank may have to pay a higher rate of interest on the new
financing than the fixed 3.20 it is earning on its loan.
Suppose, at the end of a year, an applicable 4-years interest rate is 6 00 pc. The bank is
in serious trouble. It is going to be earning 3.20 pc on its loan and paying 6.00 pc on its
financing. Accrual accounting does not recognise the problem. The book value of the
loan (the bank's asset) is :
lOOMM (1.032) = 103.2 MM.
The book value of the financing (the bank's liability) is :
lOOMM (1.030) =103.0M.
Based upon accrual accounting, the bank earned USD 2,00,000 in the first year.
Market value accounting recognises the bank's predicament. The respective market
values of the bank's asset and liability are :
lOOMM (1.032)5 = 92.72MM
(1.060)^
lOOMM (1.030) = 103.0MM.
From a market-value accounting standpoint, the bank has lost USD 10.28MM.
So which result offers a better portrayal of the bank' situation, the accrual accounting
profit or the market-value accounting loss? The bank is in trouble, and the market-value
loss reflects this.
Ultimately, accrual accounting will recognise a similar loss. It will accrue the as-yet
unrecognised loss over the 4 remaining years of the position.
The problem in this example was caused by a mismatch between assets and liabilities.
Prior to the 1970's such mismatches tended not to be a significant problem.
Thus ALM in practical terms involves :
(a) Conscious decisions - making with regard to assets-liability structure in order to
maximise interest earnings within the fi^artie work of perceived risk and.
180
(b) Quantification of risk and evolving of suitable risk management techniques to
minimise probable loss.
It is therefore evident that Asset/Liability Management (ALM) is a tool that enables
bank management to take business decisions in a more informed framework. The
ALM function informs the manager what the current market risk profile of the bank
is, and the impact that various alternate business decisions would have on the future
risk profile. The manager can then choose the best course of action, depending on
his Board's risk appetite (Vasisbth, 1997)^.
2. Objective of ALM :
A Sound ALM system for the bank should encompass :
sr Review of interest rate out-looks.
^ Fixation of interest product pricing of both assets and liabilities.
»• Review of credit portfolio and credit risk management.
HT Review of investment portfolio and risk management.
^ Risk management of forex operations.
^ Management of liquidity risk.
3. Need of Risk Management by Banks :
Banks across the world are considered as financial risk takers as they live with money.
They assume risk because risk is pre-requisite for survival (Sabnani, 2002)'. However,
taking higher risks entail a loss and some times become disastrous for the organisation.
'Eddie Cade''' has aptly documented these fact illustrated as under.
w Merrill Lynch lost $377 million trading mortgage-backed securities in an
innovative form in 1987.
•»• Midland Bank lost a reported pound sterling 116 million by guessing wrong on
interest rate movements in 1989.
"»• Bank of New England made massive bad debt provisions, suffered a run on
deposits and had to be supported by Government to the tune of some $2 billion
in 1991.
^Vasisbth, D. 1997. Asset Liability Management. EBA Bulletin, February. 1997. P - 14-17. ^Sabnani, P. 2002. Risk Management by Banks in India . EBA Bulletin (July) PP-8-9. "Eddie Cade ; Managing Banking Risks, Glenlake Publishing Company Ltd. Chicago, p^ - 1,2.
181
s^ Barclays Bank provided pound sterling 2.5 billion for bad and doubtful debts
and declared the first loss in its history in 1992. Credit Lyonnais succumbed to
similar troubles and registered a net loss of Fr. 6.9 billion in 1993.
^ Barings, London's oldest merchant bank, was brought down by losses of pound
sterling 830 million on a speculative proprietary position in Nikkei 22.5 stock
index futures.
H In their financial year to March 1996, the major Japanese banks wrote off a total
of some Japanese Yen 6000 billion of bad debts accumulated from the preceding
boom years.
4. Risks and its nature :
Risk in general term is defined as possibility of suffering a loss. It is potential for
realisation of unwanted negative consequences of an event. Thus, by defining risk one
can measure the probability and severity of adverse effects (David, 1992)^.
5. Categories of risks :
In the simplest words, risk may be defined as possibility of loss. It may be financial loss
or loss to the reputation/image. It is difficult to think of a commercial organisation,
which does not undertake any risk. Banking is also one of such commercial
organizations. The concept of risk-return trade-off is applicable to all the business.
However, higher risk may also result into higher losses (Salin, 1999)*.
Various risks, to which the banks are exposed (Sehgal, 1999)^, may broadly be
categorized in the following categories :-
A. Credit Risk
B. Interest Rate Risk
C. Liquidity Risk
D. Foreign Exchange Risk
E. Operational Risk
(A). Credit Risk : Banks pool assets and loans, which have a possibility of default, and
yet provide the depositors with the assurance ofredemption at full face value. Credit 'David, S. 1992. Asset Liability Management. In Diana Mcnaushton (ed). Banking Institutions in
Developing Markets; Building Strong Management and Responding to Change. Washington D. C. The World Bank I : 138-142.
*Salin, I. 1999. Risk Management of Financial Sector. Banking Finance. (August) P P - 13,14. ^Sehgal, M. 1999 Asset Liability Management in Indian Banks. Banking Finance (November). PP, 12-13.
182
risk, in terms of possibilities of loss to the bank, due to failure of borrows/counter
parties in meeting their commitments, is likely to hamper the capability of the bank to
meet its commitment to the depositors.
Credit risk is the most significant risk, more so in Indian scenario where the NPA level
of the banking system is significantly high. Its importance may be understood from the
fact that during Asian financial crisis, non-peribrming loans in Indonesia, Malaysia,
South Korea and Thailand soared to over 30 pc of total assets of the financial system.
The management of credit risk is thus a prerequisite, for long term sustainability/
profitability of a bank.
Credit risk depends on both internal and external factors. Some of the important
external factors are state of economy, swings in commodity prices, foreign exchange
rates & interest rates etc. The internal factors may be deficiencies in loan policies and
administration of loan portfolio covering areas like prudential exposure limits to various
category, appraisal of borrower's financial position, excessive dependence on collateral,
mechanism of review and post sanction surveillance etc.
Risk is inherent in any business. As such it can't be avoided but has to be managed by
adopting various risk mitigating methods. In banking business, funds are lent to the
borrowers after due appraisal. However, the appraisal is based on certain assumptions,
variation from which may affect the profitability of borrowing unit and this may
ultimately culminate in the default. In most of the cases, default will not take place
suddenly. An alert banker may smell the warning signals and by his pro-activeness he
may take suitable steps in time either to remedy the situation or to exit from the account.
Key issue in managing credit risk is to apply a consistent evaluation and rating system
of all investment opportunities. Prudential limits need to be laid down on various aspect
of credit. Rating may be single point indicator of diverse risk factors of counter party.
Management of credit delivery and monitoring process :-
(a) Appraisal stage : In addition to following the prescribed guidelines of the bank, the
important point is the appraisal of the man behind the project. For this no rules can
be given. However, the managers may use their own innovativeness and experience
to judge the man. Some of the points that the manager may consider are as under :-
183
»• Whether the branch has its own network for obtaining reHable information about
present and prospective borrowers through some well known sources like local
organizations, lead bank offices, other customers etc.
^ Whether the credit officers keep an eye on local newspapers for keeping track on
some developments in some units / industries etc.
»• Whether marketability of the product is assured beyond reasonable doubt.
» ' Whether while processing the proposals a list of all the important references
made by the borrowers is kept on record,
w Whether a small map of the location of the location of the unit / residence of
borrowers / guarantors is kept on record.
(b) Disbursement stage:
^ Whether the branch ensures creation of assets and whether the disbursement is
made in stages and checked at every stage, wherever possible.
»" Whether the payments are directly made to the dealers.
»• Whether the branch ensures long term availability of the business premises are
on rent,
(c) Review / Renewal:
w Whether the branch considers review as a ritual or uses the opportunity to
review its credit decision,
»• Whether proper follow-up for obtaining financial information is stated in time
and borrowers are properly educated in this regard,
(d) Asset Verification/InspectionA^isits : This is most important aspect of monitoring
of a borrowed account. If done regularly, it gives an opportunity to interact with the
borrowers and must be used to ascertain the problems that the unit is facing / likely
to face. Remedial steps should be initiated at the earliest. If an eye is kept on the
activities of the borrower, there is no reason as to why the account can't be kept
healthy.
(e) Credit Rating : Credit rating is the main tool, which helps in measuring the credit
risk and facilitate pricing the account. It gives vital indications of weaknesses in the
account whenever rating of a particular account has slipped. It also gives triggers for
portfolio management at corporate level.
184
(B) Interest rate risk : Bank fix and change interest rates on deposits and advances
from time to time. Generally, changes in interest rates on advance affect the interest
rates of all the advances account. However, in case of deposits, the change affects rate
of interest of new/renewed accounts only. Hence, changes in interest rates can
significantly impact the Net Interest Income (Nil). The risk of an adverse impact on Nil
due to variations of interest rate may be called interest rate risk.
For measuring interest rate risk in case of trading activity - Value at Risk (VaR) is
presently the standard approach. It attempts to assess the potential loss that could
crystalise on trading portfolio due to variations in market interest rates and prices. In
case of other balance sheet exposure, banks rely on "gap reporting system" for
identifying asymmetry in re-pricing of assets and liabilities - commonly known as gap -
and putting in place a gap reporting system. Supplemented with balance sheet
simulation models to investigate the effect of interest rate variation on reported earnings
over a medium - term horizon.
(C) Foreign exchange risk : Foreign exchange market is volatile. The exchange rates
change from moment to moment. Every bank, which is active in international market,
keeps certain open position in foreign currencies. However, there is inherent risk in
running such open position due to wide variations in exchange rates. Such risks may be
called as foreign exchange risks.
Various limits are key elements of risk management in FOREX trading, as they are all
trading business. Banks with active trading positions are adopting VaR approach to
measure the risk associated with exposure. For the banks that could not develop VaR,
some stress testing is required to evaluate the potential loss associated with changes in
exchange rate. This can be done with small movements as well as for historical
maximum movements.
(D) Liquidity risk : This may arise due to funding of long-term assets (advances) by
short term sources (deposits). If fresh short-term deposits are not available or existing
deposits are not renewed, the bank will be put in liquidity problem.
Several traditional ratios are used for measuring liquidity risks, loan to total assets,
loans to core deposits, large liabilities to earning assets, loan losses to net loans etc.
185
Additionally prudential limits are placed on various liquidity measures like inter-bank
borrowings and core deposits vis-a-vis core assets.
(E) Operational risk : Basel Committee for Banking Supervision has defined the
operational risk as "the risk of loss, resulting from inadequate or failed internal
processes, people and systems or from external events."
The operational loss has mainly three exposure classes viz. People, processes and
systems. The importance of managing operational risk has increased mainly because of
two reasons :-
»• Higher level of automation and
»• Increase in global financial inter-linkages.
Internal control mechanism has to be strengthened for mitigating the operational risk.
For unexpected losses, capital has to be provided for.
In the Indian context, banks should start with an external and independent assessment of
operational risk management in the bank. Based on such assessment they may identify
high-risk areas and draw a phased roadmap towards attaining targeted standards.
6. Basel Accord Regarding Risk :
Basel accord, by suggesting separate capital charges for operational risk has sensitised
the financial world to this area and thereby created a valuable opportunity for banks to
get into a major clean up act (Sharma, 2003)^. The highlights of Basel Capital Accord
are briefly as under :-
Basel n Capital Accord : First Capital Accord proposed by Basel Committee is knovm
as 1988 Basel Capital Accord. Now the accord is under review and new proposal in
under consideration and the same is likely to be implemented in 2005/2006. Original
accord provided for only a capital risk charge. A market risk charge was implemented in
1996. The new accord has proposed operational charge at 12 pc of Minimum
Regulatory Capital.
The new accord will ftinction on a three pillar approach :-
w Maintaining minimum capital requirement
«f Undertaking supervisory renew of bank capital, and
^Sharma, H. S. 2003. Risk Management in Banks - Emerging Issues. Banking Finance. (May). PP -5,6.
186
•s" Effective use of market discipline
Capital charge is proposed to be maintaining against credit risk, market risk and
operational risk through economic capital allocation. Therefore, to enable the banks to
comply with the requirements of the accord, capabilities for better risk management are
to be built up.
The proposed Basel norms suggest that the risk weightage assigned by banks to each
assets should depend on the underlying risk of the counter-party.
Presently, as per Basel Committee, Minimum Regulatory Capital is 8 pc while RBI has
stipulated 9 pc for Indian Bank, There are three approaches to calculate capital
adequacy ratio as per Basel Accord. Out of these three, bank may adopt any method as
suits their portfolio. The approaches are as under :-
^ The revised standardized approach
»• The foundation Internal Rating Based (ERB) approach
t^ The Advanced ERB Approach
(i) The revised standardised approach : It is based on the external credit assessment
institutions (ECAI) ratings for sovereigns, banks and corporates and is more risk
sensitive as compared to existing standardised approach.
(ii) The foundation internal rating based (ERB) approach : It is based on banks'
internal assessment of counter parties and exposures. Three main elements of this
approach are :-
^ Risk components / drivers of potential credit loss,
»• The risk weight function, by which the risk components are converted to risk
weights and
»• Minimum requirements.
(iii) The advanced IRB approach : In IRB foundation approach, estimates of default
risk of the obligor are provided by the bank using internal estimates whereas other
risk drivers are applied as per supervisory norms. However, in the case of IRB
advanced approach, all the drivers would be based on banks' internal
methodologies except for granularity of portfolio (which is determined by the
concentration of bank's exposure to a single borrower or to a group of closely
related borrowers).
187
The highlights of the revised accord are that additional operational risk capital of 20
pc (subsequently revised to 12 pc) of minimum regulatory capital (MRC) is
provided i.e. MRC will be 8 pc + 12 pc of 8 pc i.e. 8.96 pc.
However, the accord is yet in consultative stage and is likely to be finalized shortly.
Under the proposed accord, better risk management will lead to lower capital
requirement will lead to lower capital requirement. But banks will also have to
incur expenditure for acquiring & maintaining necessary technology and equipment
as also training and recruiting specialist staff.
Initiatives of Reserve Bank Oflndia (RBI):
RBI has recognized the need of a proper risk management system in the banks. In the
year 1999, it has issued guidelines regarding assets liability management, management
of credit risk, market risks and operational risks. In October 2002, the RBI has issued
guidance notes on credit risk and market risk management.
Risk Based Supervision : Main concern of regulators is the stability of the financial
system. The ramifications of weaknesses of financial system, of which banking is a part,
are manifold. Recent failures of a few co-operative banks in the country is an example
as to how the public can lose hard - earned money and how the system can lose trust of
the public. Bank regulators are also devising new strategies wherein they can identify
potentially weak banks and focus more on their supervisory efforts on them.
RBI has proposed to switch over to risk based supervision (RBI) of banks by 2003. The
focus of RBI will be on efficacy and soundness of systems and procedures for risk
management in individual banks instead of individual banks will be prepared which will
be the basis of prepared which will be the basis of RES. A high-risk bank will be
subjected to more intensive supervision by way of shorter supervisory cycle and greater
use of supervisory tools like targeted on site inspections, additional oflfsite surveillance,
ad-hoc information requests, structured meetings etc. A low risk bank will be subjected
to a lesser degree of supervisory intervention.
7. The Asset - Liability Management Committee
Once the strategic plan is developed and is in place, the responsibility for day to day
administration of the components that affect the financial performance passes to the
asset liability management committee (ALCO). On the other hand, the planning
188
committee has a long range perspective and meets frequently. ALCOs are primarily
made of staff members headed usually by the chief executive officer. The ALCO is
responsible for developing, implementing and managing the banks's annual budget or
profit plan and its risk management programme (Rajwade, 2002)'.
In managing performances, the committee reviews a variety of reports assessing the
banks' performance relative to its profit plans and risk management objectives. To serve
effectively all members of the ALCO should be knowledgeable about the various facets
of asset - liability management. Members should understand the role and use of
financial measures in evaluating the bank's performance.
Timely and accurate data for analysis and reporting, is a must for the ALCO. The
ALCO should consider acquiring a software programme to enable them in carrying out
their functions in an efficient manner. In choosing the software for supporting the
bank's process the ALCO should clearly define the kinds of information it wants the
software to produce and the amount of time available to work with the software.
The Budget or Profit Plan
A bank's annual budget or profit plan is the tool that keeps the bank on track towards
achieving its strategic financial goals. The ALCO oversees the development of the
budget, recommends its implementation to the board of directors and monitors the
banks performance under the plan. The ALCO also makes recommendations for
modifying the budget when necessary. In developing the annual budget the committee
considers the time covered by the plan, the plan's level of detail, contingencies that
might cause the plan to change, and the action plans, goals and timetables necessary to
see that the plan is effectively implemented.
The Review System
An established system of reviewing the plan and modifying it where necessary
contributes significantly to the plan's success. When the plan is written, the bank
determines the frequency of its review, the types of performance reporting and the
method to use in modifying the plan. Banks depend on effective plans with realistic
targets. These plans enable the managers to take action consistent with the bank's short
and long range goals. 'Rajwade, A. V. 2002. Issues in Asset Liability Management - 1. Economic and Political Weekly.
(February, 2). XXXVII(5); 378-379
189
A Framework for Asset- Liability function
Broadly essential elements in the framework for the asset/liability function are detailed
as under:
Strategic Framework : The ALM function should be proactive and not reactive The
ALM function should assist the line management in product planning and pricing and
help sensitise the operating people to the ALM implications of their decisions. The
ALM function should not be mere analytical function, but a catalyst for the formulation
of business strategies.
Organisational framework : All elements of the organisation, namely the ALM
committee, sub-committees, and the analytical support group should have clearly
defined roles and responsibilities.
The analytical group should be located in the right place of the organisation to promote
effective fiinctioning. The membership and size of each organisational element should
reflect business requirements. The ALM function should have full support of the top
management. This includes proper resource allocation and personal commitment.
Analytical Framework : The various analytical concepts (gap analysis, simulation,
duration, value at risk, etc.) should be used to obtain appropriate insights. In general
heavy emphasis on cash flows, market values, risk adjusted returns and duration.
Technological Framework : This deals with utilisation of top class software, either
purchased or developed in house. The software package should enable one to perform
extensive analysis, planning and measurement of all the facets of the ALM function.
Operational Framework : There should be a well documented policy statement
(approved by the Board of Directors) and a detailed ALM proceeds.
Performance Management Framework : The profitability of the bank comes from
three sources. Assets, Liabilities & ALM. First the bank makes profits on the asset side
making loans at a rate higher than economic cost of return on matched funds. This
reflects the credit spread. A second source of profits arises from the liability side. The
bank accesses fixnds at a rate lower than economic cost of risk matched funds. This
reflects the franchise spread. Third, the bank makes profits through market risk
transformation. For example, SBI borrows for three months and lends for six months.
The performance measurement framework should enable the banks to measure
190
profitability of these three business activities. A system of structured education and
training is necessary so that the top management is sensitised to the developments in
Asset/Liability Management. In a field so volatile and fast changing as ALM, on going
training and updating is critical.
Information Reporting Framework : ALM information should be reported. In such a
manner that each level of management should get information that is relevant to them.
The over riding objective is that the decision-maker is neither burdened with
information overload nor starved of needed information. The information should be
concise and easily understandable. The information should allow the recipient to make
or evaluate decisions.
Regulatory Compliance Framework : The objective is to ensure compliance with the
applicable regulatory requirements such as those containing to risk based capital ratios,
liquidity ratios, capital adequacy directive and the quality of risk management
infi'astructure.
Control Framework : The emphasis should on setting up of a system of checks and
balance to ensure the integrity of data, analysis, reporting and adherence to internal
policies. This should be ensured through regular external/internal reviews of the
function.
8. (a) Management of Risks :
Once the risk have been identified, the million-dollar question is - what to do about the
Risks ? The suitable answer to this question would be to manage the risks in an efficient
and effecfive manner so that the organization incurs minimum loss. The recourse
available to banks could be -
w If the risk is at the prospective stage, then it may be avoided.
w If the risk is likely to occur, and it is unavoidable then it has to be accepted and
retained on it on an economically justified basis.
w Some effective actions to be executed as to reduce or eliminate the loss likely to
be incurred due to happening of the particular risky incident.
»" Diversification is required within a portfolio of risk with a view to shortening
the loss.
191
»• For risky business areas, introduction of prudent exposure norms, in advances,
may help in minimizing the loss.
^ Sound risks measurement procedures and information systems, if put in place in
the right perspective, will help in taking timely decisions for avoidance of risk.
w Hedging the risk artificially i.e. counter balance and neutralize the risk to a
certain degree is requires by use of derivative instruments.
w Monitor various categories of risks on continuous basis and report to appropriate
authority so that risks can be overcome in future.
^ The risk may be liquidated by transferring without recourses to other party.
^ Application of comprehensive internal control and audit systems with a view to
controlling risks in appropriate places is necessary.
The effective Risk Management process in Banks, which does not resuh in getting rid of
risks, will help in minimizing the losses.
8. (b) Risk Management and RBI Guideline :
The history of banking is full of major and minor failures. It is now argued that many of
these failures were due to the fact that the risks were not identified and managed
properly. The Reserve Bank of India has issued elaborate guidelines on Asset Liability
Management and Risk Management to Banks in India. Banks have been making
vigorous efforts in following these guidelines. Some of the important actions taken by
Banks in India. Based on the RBI guidelines are discussed below -
Risk Management Structure
Banks have formulated road maps for implementation of guidelines issued by the
Reserve Bank of India Systems. Investment Policy, Loan Policy, Terms Loan Policy
have been articulated and the progress in implementation of these guidelines is being
reviewed by the Board of Banks, Risk Management Committee has been constituted in
several banks to evaluate the overall risks assumed by the Bank. Risk Management
Committees are verifying adherence to various risk parameters and prudential limits by
the operating departments.
Risk Management - Uncharted Areas
Risk Management is not a destination, but a journey. It is not a one-time exercise but a
lifetime exercise, which needs to be undertaken repeatedly. Over the time, with
192
identification of new risks, there is need to identify new Risk Management practices
also. Although banks, in India, are generally following the guidelines of the Reserve
Bank of India, the following areas need closer attention. Also, some other suggestions,
if put into effect in time, may yield rich dividends for banking industry in India.
Liquidity Risk.
»" Estimating the cash flow profile realistically by tracking the impact of
prepayment of loans and premature closure of deposits.
w Estimating the liquidity profile on a dynamic basis by giving due importance to
seasonality, future growth, etc.
w Estimating properly the liquidity under Bank's specific and market crisis
scenarios.
Interest Rate Risk
w Segmenting the balance sheet into trading and banking books.
»• Laying down policies with regard to volume, maximum maturity, holding
period, duration, stop loss, defeasance period, rating standards. Etc. for
classifying securities in the trading book.
»• Conducting Stress tests to estimate future volatility in values due to outlier
events in the market.
w Assessing the magnitude of basis and embedded option risks,
w Setting up definite timeframe for moving over to Duration Gap Analysis
(defined at the end of the paper).
•»• Adopting Balance Sheet Simulation models (defined at the end of the paper) for
quantifying the market dynamics on asset-liability mixes, future
earnings/economic values, subject to availability of quality data, information
technology and technical expertise.
Market Risk
Middle Office functioning independent of the Treasury Department to be "set up for
tracking the magnitude of market risk on a real time basis
Credit Risk
s^ Setting up prudential limits on (a) various financial parameters (b) single/group
borrowers limits (within the limits prescribed by RBI), (C) substantial exposure
193
er
limits, (d) exposures to industries, sectors especially sensitive sectors, regions,
etc.
Adoption of Risk Adjusted Return on Capital (RAROC) framework for pricing
of loans.
Stipulating - (a) quantitative ceiling on aggregate exposure in specified rating
categories, (b) rating wise distribution of borrowers in various industries,
business segments, etc. (c) exposure to industries, sectors, regions, etc. (d) target
rating-wise volume of loans, probable defaults and provisioning requirements.
Undertaking rapid portfolio reviews, stress tests and scenario analysis (defined
at the end of the paper) when external environment is undergoing rapid changes.
Building adequate data and historical loan loss rates and model variables,
spanning multiple credit cycles, for switching over to credit risk modeling after a
specified period of time.
Estimation the total potential exposure in respect of off-balance sheet items on a
static or dynamic basis.
Internal process and expertise in risk aggregation and capital allocation to be
developed.
Suitable methodologies to be developed for estimating and maintaining
economic capital by bank operating in international market. The principle of
economic capital exists to absorb unexpected loss - to the extent that current
profits fall short of that capacity - and thus to minimize the probability of
insolvency.
Capital to risk to be adjusted to the risk and equity capital to be maintained
according to assessed size of the risk.
Loss of risks to be loaded on cost, as expected loss is a cost to the organization.
Concept of Risk adjusted returns to be implemented.
The risky assets (derivatives etc.) to be marked to the market.
International best practices to be followed in developing the risk management
framework particularly the organizational structure.
194
9. Techniques of Risk Measurement:
Universally there are four principal approaches used to quantify the risk :
A. Gap Method:
The gap approach addresses the rate sensitivity of assess and liabilities. The gap is the
difference between the existing Rate Sensitive Assets (RSA) and Rate Sensitive
Liabilities (RSL) in a particular time period. It ignores the time when in the chosen
period, the assets and liabilities would need to be re-priced and, hence, shorter the
period more sensitive is the model. Interest rate is minimised if the gap is managed to
near zero in each period.
0 Liquidity Gaps :- Liquidity gap are usually derived from the outstanding balance of
assets and liabilities and from their changes over a period of time.
Marginal gaps are calculated as the differences between the changes in assets and
liabilities during a given period.
ii) Interest Rate Gap (IRG): Interest rate gap may be defined as the difference between
fixed rate assets and fixed rate liabilities or as the difference between interest sensitive
assets and interest sensitive liabilities. Fixed rate gap is exactly opposite of variable rate
gap when assets are equal to liabilities. Gaps are calculated as the difference between
outstanding balance on a given date across maturity structure.
B. Simulation : Simulation involves a series of'what' analyses of the impact of interest
rate changes on the income. It requires forecasting the asset-liability picture under
different scenarios, ascribing probabilities to them and choosing the most optimum
model. The method being more dynamic its utility depends upon the accuracy of
forecasts.
C. Duration: method evaluates the impact of interest rate changes on the market value
of assets and liabilities. The duration of an asset or liability is calculated as the weighted
average maturity of the resultant cash flows, the weights being the present value of the
cash flows. Duration expressed in the time period is less than the maturity of coupon
bond. Greater the value of duration gap, higher the interest rate risk exposure of the
assets/liabilities. The method, being too complex, is, however, far more flexible. How
much interest rate risk a bank should assume? However, it depends upon how risk savvy
or risk averse the banks is.
195
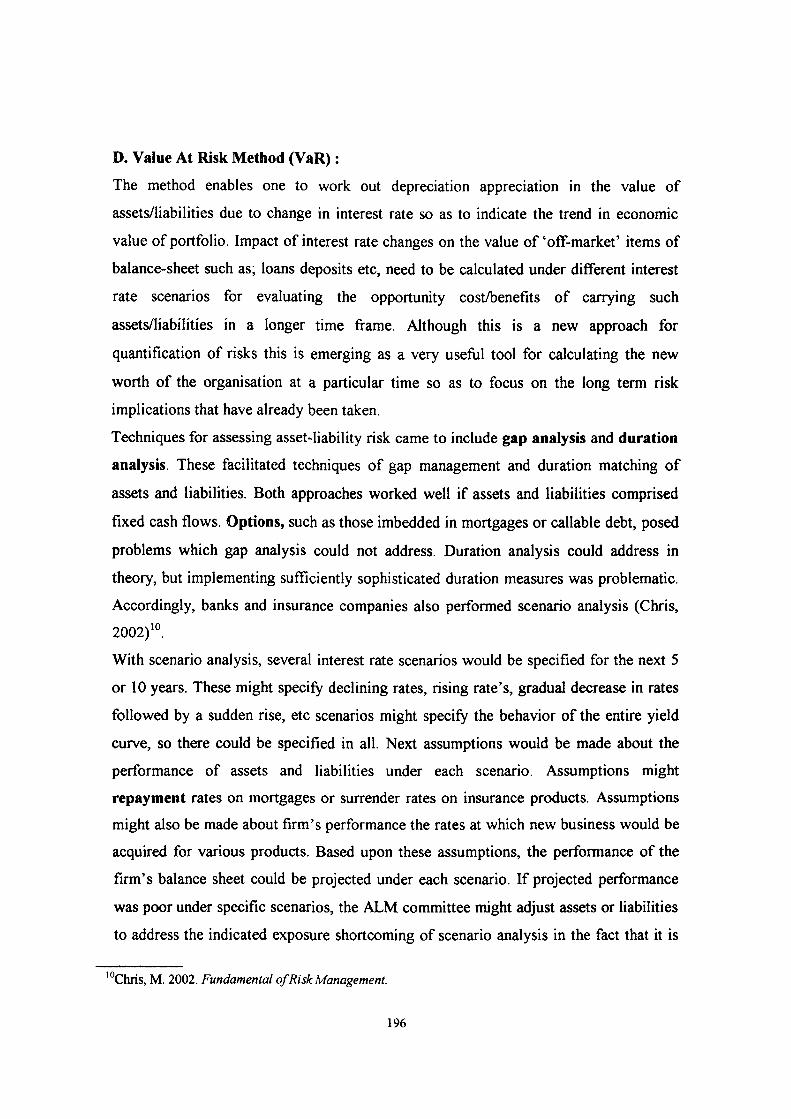
D. Value At Risk Method (VaR):
The method enables one to work out depreciation appreciation in the value of
assets/liabilities due to change in interest rate so as to indicate the trend in economic
value of portfolio. Impact of interest rate changes on the value of'off-market' items of
balance-sheet such as; loans deposits etc, need to be calculated under different interest
rate scenarios for evaluating the opportunity cost^enefits of carrying such
assets/liabilities in a longer time frame. Although this is a new approach for
quantification of risks this is emerging as a very useful tool for calculating the new
worth of the organisation at a particular time so as to focus on the long term risk
implications that have already been taken.
Techniques for assessing asset-liability risk came to include gap analysis and duration
analysis. These facilitated techniques of gap management and duration matching of
assets and liabilities. Both approaches worked well if assets and liabilities comprised
fixed cash flows. Options, such as those imbedded in mortgages or callable debt, posed
problems which gap analysis could not address. Duration analysis could address in
theory, but implementing sufficiently sophisticated duration measures was problematic.
Accordingly, banks and insurance companies also performed scenario analysis (Chris,
2002)'°.
With scenario analysis, several interest rate scenarios would be specified for the next 5
or 10 years. These might specify declining rates, rising rate's, gradual decrease in rates
followed by a sudden rise, etc scenarios might specify the behavior of the entire yield
curve, so there could be specified in all. Next assumptions would be made about the
performance of assets and liabilities under each scenario. Assumptions might
repayment rates on mortgages or surrender rates on insurance products. Assumptions
might also be made about firm's performance the rates at which new business would be
acquired for various products. Based upon these assumptions, the performance of the
firm's balance sheet could be projected under each scenario. If projected performance
was poor under specific scenarios, the ALM committee nnjght adjust assets or liabilities
to address the indicated exposure shortcoming of scenario analysis in the fact that it is
10, Chris, M. 2002. Fundamental of Risk Management.
196
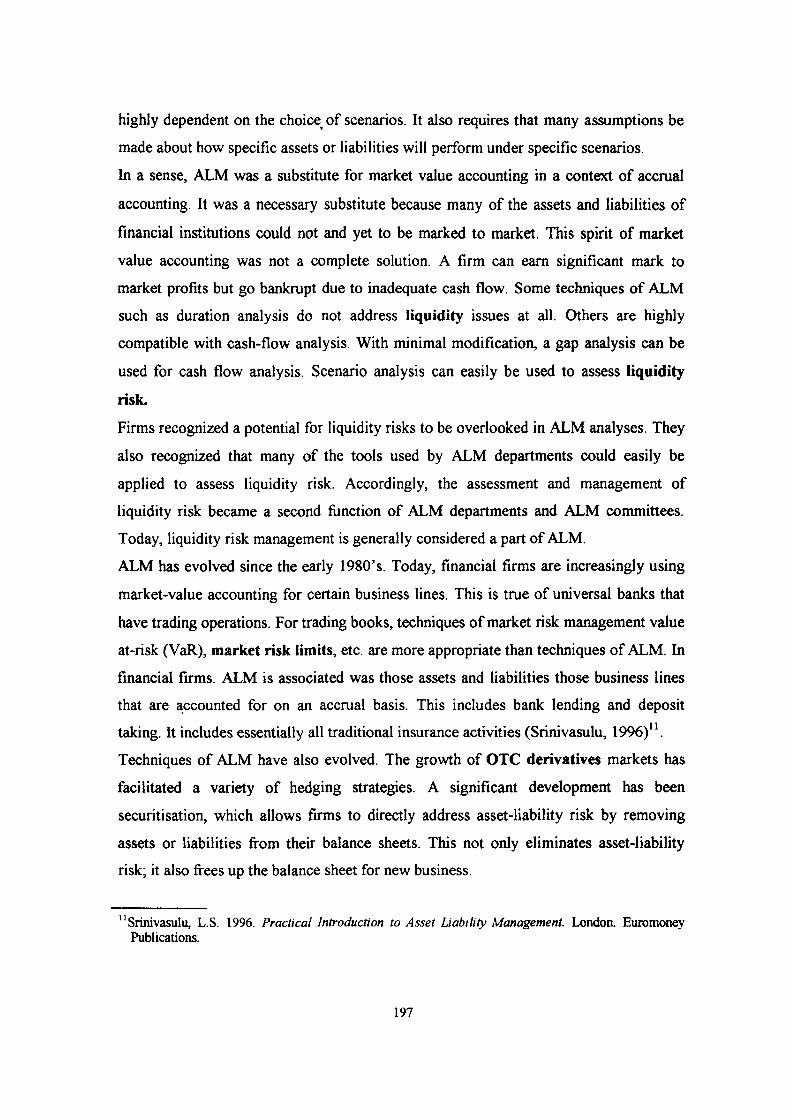
highly dependent on the choice of scenarios. It also requires that many assumptions be
made about how specific assets or liabilities will perform under specific scenarios.
In a sense, ALM was a substitute for market value accounting in a context of accrual
accounting. It was a necessary substitute because many of the assets and liabilities of
financial institutions could not and yet to be marked to market. This spirit of market
value accounting was not a complete solution. A firm can earn significant mark to
market profits but go bankrupt due to inadequate cash flow. Some techniques of ALM
such as duration analysis do not address liquidity issues at all. Others are highly
compatible with cash-flow analysis. With minimal modification, a gap analysis can be
used for cash flow analysis. Scenario analysis can easily be used to assess liquidity
risk.
Firms recognized a potential for liquidity risks to be overlooked in ALM analyses. They
also recognized that many of the tools used by ALM departments could easily be
applied to assess liquidity risk. Accordingly, the assessment and management of
liquidity risk became a second function of ALM departments and ALM committees.
Today, liquidity risk management is generally considered a part of ALM.
ALM has evolved since the early 1980's. Today, financial firms are increasingly using
market-value accounting for certain business lines. This is true of universal banks that
have trading operations. For trading books, techniques of market risk management value
at-risk (VaR), market risk limits, etc. are more appropriate than techniques of ALM. In
financial firms. ALM is associated was those assets and liabilities those business lines
that are accounted for on an accrual basis. This includes bank lending and deposit
tJiking. It includes essentially all traditional insurance activities (Srinivasulu, 1996)".
Techniques of ALM have also evolved. The growth of OTC derivatives markets has
facilitated a variety of hedging strategies. A significant development has been
securitisation, which allows firms to directly address asset-liability risk by removing
assets or liabilities from their balance sheets. This not only eliminates asset-liability
risk; it also fi^ees up the balance sheet for new business.
The scope of ALM activities Jias widened. Today, ALM departments are addressing
(non-trading) foreign exchange risk. They are using related techniques to address
commodity risks. For example, airlines' hedging of fuel prices or manufacturer's
hedging of steel prices generally fall within the domain of ALM.
n 10. Emergence of ALM Process in India
In India, the need for ALM is a recent phenomenon. ALM is needed in the domestic
banking as part of the system Memorandum of Understanding (MoU) by which banks
are required to submit a policy statement on their individual liability management
system. In 1995, while relaxing the interest rate structure of term deposits, the RBI
emphasised on proper use of offering interest rates in various maturities of term
deposits. Further it should be ensured that they do not get locked in excessively long
deposit maturities. A careful review should be undertaken to ensure against overall
asset-liability mismatches. Besides, in the busy season credit policy of October 1997,
RBI highlighted the importance of asset-liability management of banks stating, that the
need for monitoring the maturity and liquidity mismatches, interest rate risks and
maintaining them at acceptable levels could not be over-emphasised and banks should
put in place adequate asset liability management system (Trivedi, 1999)'^.
Need For ALM in India :
In India the movement towards greater use of variable rate pending indicated an
important shift in banking environment. It is no longer the case that banks will be
largely asset-driven and primarily concerned with just adhere to find resources to
finance lending. Banks are improving progressively to the stage of not only adjusting
capabilities in accordance with potential liabilities. More generally there is a growing
realisation of how an increasingly variegated balance sheet at a time of volatile
economic conditions adds to the risks facing banks and takes necessary new techniques
of risk management. This has led to a broad re-assessment of the nature of credit risks
and credit standards, and also reduced banks previous emphasis on balance sheet growth
at any cost. The concept of ALM has become important in India because of the
following :
' Trivedi, A K. 1999. Asset Liability Management. Banking Finance (August). PP- 25,26.
198
w In order to maximise income with acceptable risk, there is need to emphasises on
interest margin/spread, liquidity and capital which are having desired
mai)euverability.
»" Since sources of liquidity are distributed across both the assets and liability sides,
as a prudent banker there is imperative need to manage both the sided and
integrate liquidity management with the overall asset liability management.
•»• In the aftermath of financial sector reforms, interest rates on both deposits and
advances are changing more frequently thereby exposing both assets and
liabilities to volatility risk of interest rate of changes.
^ Gradual dismantling of restrictions with regard to foreign exchange transactions
has exposed Indian banks to the vagaries of fluctuations in Forex market.
^ With the gradual increase in the ratio of current investment to permanent
investment by RBI, banks are showing greater willingness to value major portion
of their investment as "marked to market". While this will expose the investment
portfolio to potential market risks, steps for countering the adverse impact of
interest rate changes or other market risk variables can be initiated through proper
ALM only.
Overall, the ALM exercise at this introductory stage, would involve the following :
w Prudential management of funds with respect to size and duration.
w Minimising undesirable maturity mismatches so as to avoid liquidity problem.
»• Reducing the gap between rate sensitive assets and rate sensitive liabilities within
the given risk taking capacity.
m Structural Changes of Variables in the Post Reform Period :
In November 1991, Narasimham committee presented its report on financial sector
reforms. The report suggested a number of measures to rehabilitate the weak banks, a
majority of which was accepted by the Government. Besides, with the globalisation of
the Indian economy, banking sector has undergone a perceptible change. As a result, the
imperatives of banking have been changing towards the objectives of profitability.
199
efficiency and competitiveness (Das, 1996)''. It is expected that with greater degree of
transparency in balance sheet in accordance with competitive environment, the banking
sector should witness some significant changes in their balance sheet. While a dramatic
change was not possible, a 'slow and solid was expected to take place with the gradual
progress of the reform (Tarapore, 1996)''*. This section reviews the progress of banking
sector with regard to their balance sheet indicators and presents the major trends
observed in recent years. The purpose of this study is to identify empirically and explore
the relationships between asset and liability of PSBs. In this respect we have selected
five assets and liability items expressed as a proportion of total assets to eliminate the
trend components and make them comparable across the years. The accompanying table
summarises the fact.
POSITION OF VARIABLES (AS ON MARCH)
LIABILITIES 1. Capital (Cairital+Reserve) [CAP] 2. Deposits [DEP] 3. Borrowing [BORR] 4. Long Term Deposit [LT.DEP] 5. Short Term deposit. [ST.DEP] 6. Other Liabilities. lOTH. LIA]
ASSETS 1. Cash & Bank [CB] 2. Investment in Govt, securities. [G.SEC] 3. Other Securities (CTH. SECl. 4. Term Loans [T. LOAN] 5. Other Assets [OTR AST.]
1991 2.50
76.00 2.65
49.70 26.30 10.23
19.13 29.60 12.60 16.00 6.35
1995 6.10
78.00 2.40
51.30 26.70
9.80
17.41 33.60 13.40 10.00 7.64
(Proportion to total assets) 2000 5.17
82.78 2.18
52.07 30.71 9.86
15.23 26.63 11.08 14.15 6.48
2001 4.84
83.45 1.95
53.53 29.92
9.76
14.83 28.35
9.92 14.38 5.60
2002 4.97
83.82 1.78
53.18 30.04
9.43
13.06 29.82
9.46 15.25 5.17
In 1991, only 2.5 pc of total assets constituted total capital that significantly increased to
6.1 pc in 1995, declined to 5.17 pc 2000 and further to 4.97 pc in 2002. The variation in
the year wise proportion of capital may be explained by the fact that, during initial years
of reform achieving the target of 8 pc of capital adequacy norms was emphasised. In the
subsequent years government of India recapitalised the PSBs to the tune of Rs. 25,000
crores to achieve the capital adequacy norms at 8 pc and higher.
The deposits on the other hand have picked its momentum in the latter part of
reform period. In 2002, deposits contributed 83.82 pc of total assets, which was about 8
"Das, A 1996. Structural Changes and Asset Liability Mismatch of Scheduled Commercial Banks in IndiaVBl Occasional Paper (Deccember). 17 (4): 312-313.
'''Tarapore, S. S. 1996. Conduct of Monetary Policy : The Indian Experience. RBI Newsletter (February, 15). 22(3).
200
percentage a point higher than ^ that in 1991. As a result a significant differences
observed in both long term and short-term deposits particularly during 2000-2002.
However, borrowing portfolio (short-term borrowings and long term borrowings) of
PSBs showed a significant contraction during post reform period. In came down from
its peak 2.65 pc of total assets in 1991 to 2.18 pc in 2000 further to 1.78 pc in 2002.
Similarly, other liabilities settled on at 9.43 pc of total assets declining from 9.86 pc in
2000.
On the assets side, the cash and bank items show a decline of more than 2 percentage
point in 2002 over 2000. Investment in Govt, securities has increased from 26.63pc of
total assets in 2000 to 29.82 pc in 2002. This has clearly revealed that the PSBs have
adopted a changed investment pattern during post reform period. In contrast to this
proportion of term loan recorded a significant decline from its peak of 16 pc of total
assets in 1991 to 10 pc in 1995 thereafter, it increased to 14.15 pc in 2000 further to
15.25 pc in 2002.
Interrelationship of variables:
The cash and bank items of PSBs are negatively associated with the total deposits(-.96).
CORRELATIONS MARKED CORRELATION ARE SIGNIFICANT AT P < 0.05.
N = 5 (Case wise deletion of missing data) Variables
CAP DEP BORR LT. DEP ST. DEP OTH. LIA
CB -0.49 - 0.96* 0.98*
- 0 . % * - 0.88*
0.66
GSEC 0.14
0.94* -0 .91*
0.84 0.94* -0.26
OTH.SEC -0.08 -0.90* 0.93* -0.87 -0.85 0.30
T. LOAN 0.02
0.89* -0.87 0.78 0.90* -0.18
OTH. AST 0.29
-0.66 0.75
-0.65 -0.61 0.05
Source : Self computed on the basis of earlier table.
The negative 'r' is statistically significant. This is the fact that the cash items in
particular that include statutory reserve with bank should have little correlation with
these variables. The capital on the liability side was associated negatively with cash and
banks and other securities. Further very little correlation was found in other variables. In
case of investment in Govt, securities it has been observed that, the deposit particularly
short-term deposit was significantly associated. It indicates that during the liberalisation
period there is a tendency to invest more short-term deposit with Govt, securities.
Hence, investment pattern in PSBs has undergone a significant change over the years.
201
Interestingly total borrowings are negatively and significantly associated with Govt,
securities. It shows that PSBs have experienced borrowing contraction over the years
and changes in the pattern of investment. On the other hand term loan is highly positive
with deposit particularly with short-term deposit. This reveals that some sort of
mismatches between assets (investment) and deposit (liabilities).
On the whole, the balance sheet items of PSBs show almost proper matching behaviour
in terms of management of maturity structure of assets and liabilities and hedging
activities in the management of risk portfolio. Thus the reform process has made a
significant dent on this aspect. Sizeable part of the capital was invested in the Govt.
securities over the years by the PSBs due to the increase in capital base after the
introduction the capital adequacy norms.
Further, to analyse how the liabilities particularly deposits, borrowings and other
liabilities are hedged, we have obtained linear regression equation taking asset side
variables as dependent and aforesaid liability side variables . individually as
independent variables. The summary of regression results is displayed as under -
Regression Summary
Dependent variables
Cash & Bank
Govt. Securities
Other Securities
Tenu Loans
Other Assets
Intercept
8.059
267.516
24.148
-42.201
294.982
Rvalue ^Independent variables'
Deposit
1.43
0.42
0.28
0.78
-1 .6
Borrowing
2.41
1.13
1.67**
0.37
-1 .5
Other liabilities
- 1.4**
-0.13
0.63**
0.31
-0.72
le
0.930
0.952
0.996
0.924
0.877
F (3^df)
8.88
6.57
29.47
3.91
2.22
P-level
0.1028
0.1359
0.0330
0.2104
0.3250
•* Significant at 1 pc * Si iificant at 5 pc.
It is found that, R is high in each set of regression though 'F' ratio is not statistically
significant except for other securities at 5 pc level of significance. The analysis reveals
the presence of multi collinearity among the variables. Though it can not be avoided
from this type of time series data, but we can draw the inferences about the trend of
matching of assets and liabilities.
The cash and bank balance found to be negatively and statistically significant with other
liabilities. This implies that during the post liberalisation period the PSBs have
202
emphasised on sufficient liquidi ty and became cautious against other liabilities. On the
other hand, the borrowing and other liabilities have positive and significant effect on
other securities. This explains that in the changed environment the PSBs have
emphasised on the interest sensitive securities over the years to strengthen their bottom
lines for achieving competitiveness. Thus it may be argued that, the long-term assets
adequately cover the long-term liabilities during the post reform periods.
CRAMEL Analysis :
In order to examine how far banks have adhered to standard norms of disclosure,a
ranking of PSBs have been made by using the CRAMEL analysis. CRAMEL stands
for Capital Adequacy, Resource Deployed, Asset Quality, Management, Earnings
Quality and Liquidity. An elaborate analysis of balance sheet of individual PSBs, in this
respect, has been made during 1998 and 1999. The nuances of the aforesaid variables
are summarized below:
Capital Adequacy:
Capital adequacy indicates each bank's leverage calculated after assigning different
risks to assets as announced by the Reserve Bank of India (RBI), In October 1998 the
RBI directed banks to raise the minimum CAR from 8 per cent to 10 percent in two
phases ; 1 percent by March 2000 and another 1 per cent by March 2002 to take the
Indian CAR closer to the international standard of more than 12 percent.
Other ratios which have a bearing on the CAR have been calculated as below ;
»" Debt-equity ratio ( D/E): calculated as the proportion of total outside liability to
net worth.
»" Advances-to-assets (ADV/AST) : shows a bank's aggressiveness in improving
its credit-deposit ratio by higher advances, which determine profitability.
•»• G-Sec's-to-investment (G-SEC/INV) : relevant in view of the nil risk for
government securities earlier and the risk weightage that is now being introduced
in a phased manner.
^ G-sec's-to-assets (G-SEC/AST) : also indicates a bank's aggressiveness in
improving its credit-deposit ratio keeping investments lower.
203
The banks position on the basis of aforesaid ratios can be summarised in the following
table.
Bank
State Bank of Saurashtra Oriental Bank of Commerce Bank of Boroda Corporation Bank State Bank of India State Bank of Patitala State Bank of Indorc Slate Bank of Bikaner & Jaipur Central Bank of bidia DenaBank AndhraBank CanaraBank Punjab and Sind Bank Punjab National Bank State Bank of Hydrabad Bank of India Allahabad Bank State Bank of Travana)re State Bank of Mysore Indian Overseas Bank Umon Bank of India Vijaya Bank Bank of Maharastra UCo Bank Umted Bank of India Syndicate Bank Indian Bank
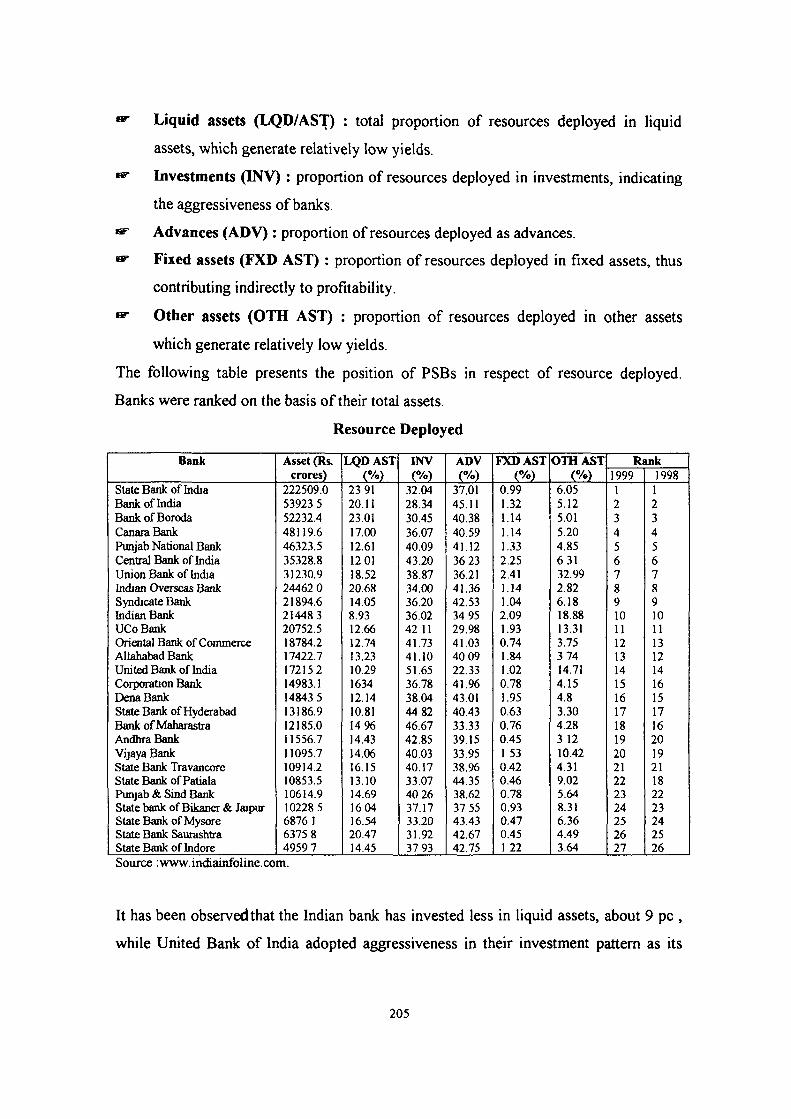
^ Liquid assets (LQD/AST) : total proportion of resources deployed in liquid
assets, which generate relatively low yields.
»' Investments (INV): proportion of resources deployed in investments, indicating
the aggressiveness of banks.
^ Advances (ADV) : proportion of resources deployed as advances.
«»• Fixed assets (FXD AST) : proportion of resources deployed in fixed assets, thus
contributing indirectly to profitability.
w Other assets (OTH AST) : proportion of resources deployed in other assets
which generate relatively low yields.
The following table presents the position of PSBs in respect of resource deployed.
Banks were ranked on the basis of their total assets.
Resource Deployed
Bank
Stale Bank of India Bank of India BankofBoroda CanaraBank Punjab National Bank Central Bank of India Union Bank of India Indian Overseas Bank Syndicate Bank Indian Bank UCoBank Orioital Bank of Commeice Allahabad Bank United Bank of India Corporation Bank DenaBank State Bank of Hyderabad Bank of Maharastra AndhraBank Vijaya Bank State Bank Travancorc State Bank of Patiala Punjab &Sind Bank State bank of Bikancr & Jaipur State Bank of Mysore State Bank Saurashtra State Bank of Indore
comprising fee-based income assets like bank guarantees. The ratio used in total
contingent liabilities to total assets.
^ Advances to assets (ADV/AST) : used to gauge credit disintermediation of a
bank - a higher ratio indicates that the bank is aggressive in its lending operations.
^ Advances growth (ADV GWT): a bank's ambition to grow faster has an impact
on asset quality.
t^ Investments-to-assets (INV AST) : indicates how a bank is leveraging its
resources to credit and investment.
Bank
Corporation Bank AntliraBank State Bank of Saurashtra State Bank of Indore Vijoya Bank State Bank of Mysore Oriental Bank of Commerce Bank of Maharastra Syndicate Bank StaUBankofPatiala State Bank of Bikaner & Jaipur Punjab & Sind Bank State bank of Travancore State Bank of Hydrabad DenaBank United Bank of India UCoBank Indian Overseas Bank AlDiabad Bank Union Bank of India Central Bank of India Canara Bank Bankof Bororda Indian Bank Punjab National Bank Bank of India State Bank of India
isf NPAs-to-net-worth (NPA/NW) : NNPAs as proportion of net worth on balance
sheet date It shows the management attitude to provisioning and effective risk-
taking.
<^ Final score : calculated at the average of all rankings of individual parameters.
The following table depicted the ratios relating to the aforesaid management quality.
207
Management Quality
Bank
State Bank of Hydrabad DenaBank Corporation Bank Oriental Bank of Commerce State Bank of Travancore Stale Bank of Mysore State Bank Bikaner & Jaipur Punjab National Bank State Bank of Patiala Bank of India Punjab & Sind Bank State Bank of Saurastra Allahabad Bank State Bank of Indore Union Bank of India Bank of Boroda State Bank of India Indian Overseas Bank CanaraBank Syndicate Bank AndhraBank State Bank of Mysore Indian Bank Vijaya Bank Central Bank of India United Bank of India UCoBank
Profit after tax (PAT): net profit after tax and provisions.
EPS growth (EPS GWT) : to factor in equity dilution, if any.
Spread : spreads are the operating margin of a bank, the difference between
average yield on advances less average yield on deposits. Higher the spreads
indicates greater earning capacity.
Net profit to total average assets (NP/TAA) : this ratio reflects asset
productivity.
The banks are ranked on the basis of the volume of the PAT. The other ratios indicating
the strength of the earning quality of the banks have been depicted in the following
table.
Earnings Quality
HT
Bank
State Bank of India BankofBororda Punjab National Bank Oriental Bank of Commerce CanataBank Bank of India Corportion Bank Union Bank of India Central Bank of India Syndicate Bank Allafaabad Bank State Bank of Hyderabad DenaBank State Bank of Patiala State Bank of Bikaner & Jaipur AndhraBank Punjab & Sind Bank Indian Overseas Bank Bank of Maharastra State Bank of Travancore State Bank of Mysore State Bank of Indore Vijaya Bank State Bank of Saurashlra United Bank of India UCoBank Indian Bank
performance in respect to the equity dilution of these banks is not satisfactory.
However, low level of spread (yield on advances minus yield on deposits) indicated the
poor operating margin of banks. Further, the ratio of net profit to total average assets in
case of United Bank of India (0.9), United Commercial Bank (0.34), Vijaya Bank (0.29)
indicated their poor asset productivity.
Liquidity:
The banks have been ranked on the basis of proportion of liquid assets to total assets.
The liquidity position of banks may be expressed by the ratio; cash to total asset,
investment in government security to total assets, percent of investment to total assets
and percentage of liquid liability.
Liquidity Position Bank
United Bank of India Bank of Maharastra AndhraBank Union Bank of India State Bank of Travancore State Bank of India State Bank of Hyderabad Central bank of India Punjab and Srnd Bank UCoBank Indian Overseas Bank Oriental Bank of Commerce Allahabad Bank Vijaya Bank Bank of Boroda State Bank of Bikaner & Jaipur Corporation Bank CanaraBank Punjab National Bank State Bank of Saurashtra State Bank of Indore Syndicate Bank DenaBank State Bank of Mysore Bank of India State Bank of Patiala Indian Bank
The final ranking of the banks has been made on the basis of arithmetic mean of the
individual rank of banks for each of the six criteria mentioned above and calculated as
follows -
Sx, X =
where, Xi = ranks of individual bank; on the basis of the parameters
viz, capital adequacy, resource deployed, asset quality,
management, earning quality and liquidity,
n == the number of variables.
The resuh of CRAMEL analysis on the basis of the aforesaid criteria is as follows -
Final Ranking in the CRAMEL Analysis
Bank
Oriental Bank of Commerce State Bank of India Corporation Bank BankofBorada State Bank of Hyderabad AndhraBank Punjab National Bank Union Bank of India Central Bank of India CanaraBank DenaBank Stale Bank of Bikaner and Jaipur State Bank of Mysore State Bank of Travancore F*unjab and Sind Bank Stat£ Bank Sauiashtra Allahabad Bank Bank of India Stale Bank of Patiala Bank of Maharastra Indian Overseas Bank Syndicate Bank State Bank of Indore United Bank of India Vijaya Bank UCoBank Indian Bank