113 CHAPTER 8 KINETIC STUDIES OF cis-Mo(CO) 4 (PPh 3 ) 2 IN THE SOLID STATE 8.1 Introduction The cis-Mo(CO) 4 (L) 2 complex undergoes a cis to trans isomerisation reaction in solution [1] (see scheme below) Mo OC L L OC CO CO trans isomer Mo OC CO CO OC L L cis isomer Scheme 14 [refs 1 and 2] Mechanistic studies on the cis→trans isomerisation process of Mo(CO) 4 (PPh 3 ) 2 have revealed that this reaction involves initial dissociation of the PPh 3 ligand [2]. On the other hand for L = P( n Bu) 3 [3], PEt 3 [4] and PMe 3 [4] isomerisation to a cis/trans mixture occurs, without phosphine dissociation i.e isomerisation proceeds through an intramolecular pathway with the trans isomer being dominant. cis-Mo(CO) 4 (L) 2 complexes are reported to also undergo a ligand substitution reaction of one of the ligands L by carbon monoxide in solution [2, 5]. (See equation 8.1) cis-Mo(CO) 4 (L) 2 + CO → Mo(CO) 5 L + L eq 8.1 This process has been observed to proceed via a dissociative mechanism (see scheme 15) [5]
Transcript
113
CHAPTER 8
KINETIC STUDIES OF cis-Mo(CO)4(PPh3)2 IN THE SOLID STATE
8.1 Introduction
The cis-Mo(CO)4(L)2 complex undergoes a cis to trans isomerisation reaction in solution
[1] (see scheme below)
MoOC L
LOCCO
CO
trans isomer
MoOC CO
COOCL
L
cis isomer
Scheme 14 [refs 1 and 2]
Mechanistic studies on the cis→trans isomerisation process of Mo(CO)4(PPh3)2 have
revealed that this reaction involves initial dissociation of the PPh3 ligand [2]. On the other
hand for L = P(nBu)3 [3], PEt3 [4] and PMe3 [4] isomerisation to a cis/trans mixture
occurs, without phosphine dissociation i.e isomerisation proceeds through an
intramolecular pathway with the trans isomer being dominant.
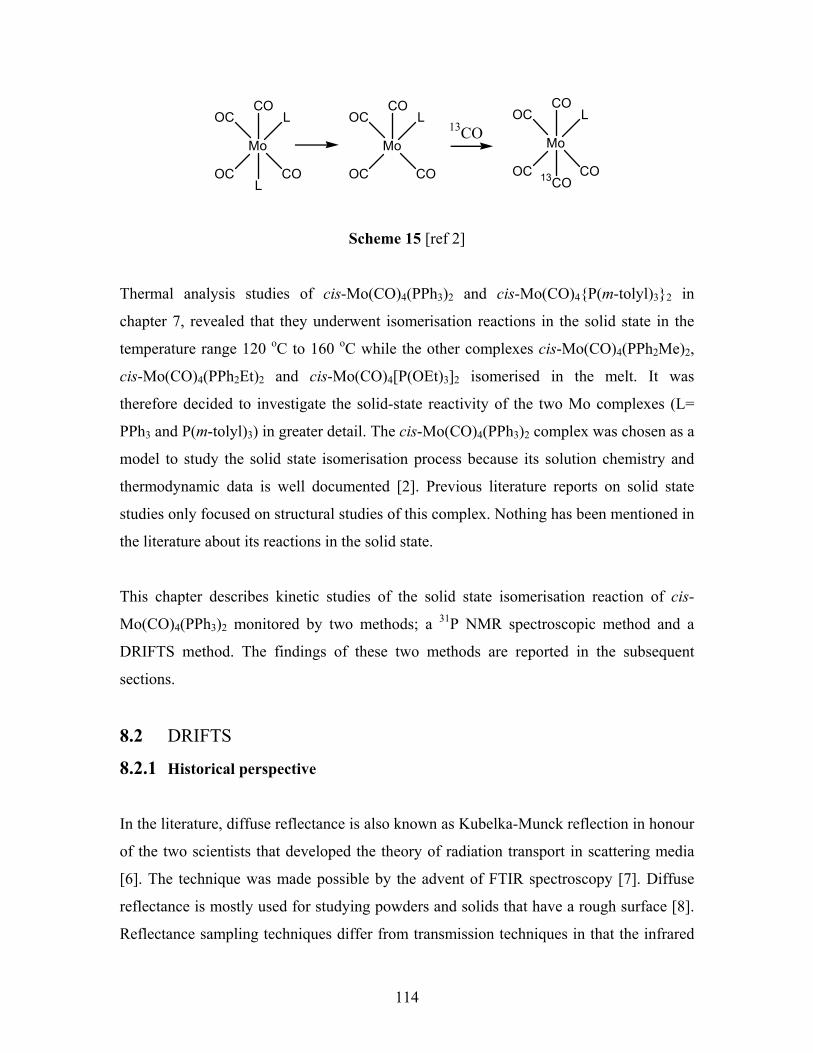
cis-Mo(CO)4(L)2 complexes are reported to also undergo a ligand substitution reaction of
one of the ligands L by carbon monoxide in solution [2, 5]. (See equation 8.1)
cis-Mo(CO)4(L)2 + CO → Mo(CO)5L + L eq 8.1
This process has been observed to proceed via a dissociative mechanism (see scheme 15)
[5]
114
Mo
LOC
OC CO
CO
L
Mo
LOC
OC CO
CO13CO
Mo
LOC
OC CO
CO
13CO
Scheme 15 [ref 2]
Thermal analysis studies of cis-Mo(CO)4(PPh3)2 and cis-Mo(CO)4{P(m-tolyl)3}2 in
chapter 7, revealed that they underwent isomerisation reactions in the solid state in the
temperature range 120 oC to 160 oC while the other complexes cis-Mo(CO)4(PPh2Me)2,
cis-Mo(CO)4(PPh2Et)2 and cis-Mo(CO)4[P(OEt)3]2 isomerised in the melt. It was
therefore decided to investigate the solid-state reactivity of the two Mo complexes (L=
PPh3 and P(m-tolyl)3) in greater detail. The cis-Mo(CO)4(PPh3)2 complex was chosen as a
model to study the solid state isomerisation process because its solution chemistry and
thermodynamic data is well documented [2]. Previous literature reports on solid state
studies only focused on structural studies of this complex. Nothing has been mentioned in
the literature about its reactions in the solid state.
This chapter describes kinetic studies of the solid state isomerisation reaction of cis-
Mo(CO)4(PPh3)2 monitored by two methods; a 31P NMR spectroscopic method and a
DRIFTS method. The findings of these two methods are reported in the subsequent
sections.
8.2 DRIFTS
8.2.1 Historical perspective
In the literature, diffuse reflectance is also known as Kubelka-Munck reflection in honour
of the two scientists that developed the theory of radiation transport in scattering media
[6]. The technique was made possible by the advent of FTIR spectroscopy [7]. Diffuse
reflectance is mostly used for studying powders and solids that have a rough surface [8].
Reflectance sampling techniques differ from transmission techniques in that the infrared
115
beam is bounced off the sample rather than passing through it [9]. Two fractions of
radiation can be distinguished: one fraction is reflected from uneven areas of the rough
surface; the other fraction penetrates the sample and is partially absorbed to be eventually
scattered in the interior and return to the surface. The optical properties of a sample are
then defined by its absorption and scattering coefficients in the Kubelka-Munk equation
shown below
f(R∞) = (1-R∞)2/2 R∞ + K/S
R∞ is the degree of reflection on the sample surface at infinite thickness,
K is the absorption modulus and S the scattering modulus.
DRIFTS spectra are dependent on various sample preparation parameters as well as on
geometric optical effects of the spectral measurement such that spectra of the same
sample differ depending on the accessories used [10]. Parameters that are important in
packing density [14, 15] and reaction mixture homogeneity [16]. It is critical that the
above parameters are kept constant in investigations to obtain experimentally
reproducible results.
The use of DRIFTS negates the need to press pellets such that sample preparation is
simpler [17]. Also DRIFTS can be used to study a wide variety of samples other than
samples dispersed in KBr pellets. The application of DRIFTS is widespread in the
chemical industry. It has been used for the analysis of catalysts [18], in mechanistic
studies [19], and for the characterisation of solid samples [20, 21]. The technique has also
found use in forensic science [22, 23]. Quantitative analysis using DRIFTS has also been
used for some time [24, 25].
8.2.2 DRIFTS in Organometallic chemistry studies
Diffuse Reflectance Infrared spectroscopy (DRIFTS) is an analytical tool that has been
used in this thesis to investigate solventless reactions [26]. Like FTIRS, it was used to
116
detect reagents and products at very low concentrations [27]. The advantages that it has
over FTIRS investigations of solventless reactions are that (i) it requires less sample per
given reaction [28], (ii) the same sample can be used for a full experiment and many data
points are generated per reaction so that it generates more accurate results and less
experimental errors, (iii) there is no need to construct calibration curves, (iv) it takes less
time to conduct an experiment and (v) the ability to work over a wide range of
temperatures.
There are few other organometallic chemistry publications that have reported the use of
this technique in the literature [29]. Examples include the study of the formation of
chromogenic calyx[4]arene derivatives [30], a DRIFTS and NIR Raman investigation of
supported and unsupported allyl-lanthanide complexes [31] and the reaction of
molybdenum hexacarbonyl and benzene under thermal activation [32].
8.3 Experimental
The complex Mo(CO)4(PPh3)2 was prepared as reported in chapter 7.
8.3.1 Kinetic studies by NMR spectroscopy
Kinetic studies were performed at constant temperature (in chosen temperature ranges)
by heating ca. 10 mg of the solid sample in a sealed NMR tube for various time intervals.
The NMR tubes containing the solid samples were evacuated and purged with nitrogen or
CO prior to heating. After heating, the samples were cooled to room temperature and
then dissolved in CDCl3 and taken for 31P NMR measurement. The % ttt isomer versus
time curves for each individual isomerisation process was plotted (see Sections 8.4.1 and
8.4.2)
117
8.3.2 Kinetic studies by DRIFTS
DRIFTS experiments in this study were performed on a BRUCKER TENSOR 27
DRIFTS spectrometer. The instrumentation consists of an FT-IR spectrometer which
houses the light source and the detector and a DRIFTS cell which contains a sample
compartment.
The samples for DRIFTS studies were prepared by mechanical grinding of the complex,
with previously dried KBr (diluent), to a very fine powder using a pestle and mortar. The
materials were ground until a homogeneous mixture was obtained. A finely ground KBr
powder was first loaded into a DRIFTS cell and measured as background. The
homogeneous mixture of the complex in KBr (1 - 2%) was then loaded into the DRIFTS
cell equipped with heating device, air and water inlet/outlets wirings (see figure 8.1). The
initial IR spectrum was recorded (see figure 8.2). The heating control was then adjusted
to the required temperature. The rate of disappearance of the peaks associated with the
cis-isomer was measured by disappearance of the CO absorption peak at 2024 cm-1
(figure 8.3) until an appreciable amount of conversion to the trans isomer (figure 8.4)
was achieved. A kinetic plot of the cis-isomer conversion (measured in terms of Kubelka
Munck units) versus time was plotted (Section 8.4.5). Assuming that the reaction was 1st
order, the Arrhenius plot for each individual isomerisation reaction was constructed.
Samples were run under nitrogen. Kinetic plots were compared with equivalent reactions
monitored by 31P NMR spectroscopy (see above).
118
Figure 8.1: DRIFTS dome cell
119
Figure 8.2: Initial IR spectrum of cis-Mo(CO)4(PPh3)2 in the solid state at room
temperature
Figure 8.3: Disappearance of peaks due to cis-isomer (*) coupled with the appearance of
peak due to the trans-isomer (■) during the reaction at 130 oC
120
Figure 8.4: Resultant spectrum mainly of the trans isomer after heating of the cis isomer
(130 oC).
8.4 Results and discussion
8.4.1 Isomerisation studies monitored by 31P NMR spectroscopy (under nitrogen)
Plots of % cis-isomer versus time and that of lnα versus time at 120 oC were constructed
(Figurews 8.5 and 8.6) for the isomerisation of cis-Mo(CO)4(PPh3)2 to trans-
Mo(CO)4(PPh3)2. Plots of % cis-isomer versus time at 130 oC (figure 8.7) and 140 oC
(figure 8.8) were also constructed. All the plots showed that the cis isomer converted to
the trans- isomer with increasing time. The rate of conversion is also seen to increase
with increasing temperature. The rate of conversion at 120 oC is very slow compared to
the reaction performed at other temperatures. Data from higher temperatures (130 oC and
140 oC) seemed to follow first order kinetics and thus the isomerisation reaction of cis-
121
Mo(CO)4(PPh3)2 was plotted as a first order reaction. However attempts to plot [ln α]
(and other functions of α) versus time graphs yielded complex data which suggested that
the reaction did not occur by first or other order reactions. An example of the [ln α]
versus time plot is shown in figure 8.6. Part of the difficulty with attempting to plot the
data is that in this procedure the generation of data is time consuming and leads to too
few data points (each data point is a separate reaction). The inaccuracies in measurement
overwhelmed the attempts at analysis. Similar studies were carried out on the data
collected at 130 and 140 oC (not shown). Hence this approach to obtaining kinetic data
was discontinued and DRIFTS (section 8.3.2) studies were rather undertaken.
0 50 100 150 200 25075
80
85
90
95
100
% cis
isom
er
Time (minutes)
Figure 8.5: Thermal reaction of cis-Mo(CO)4(PPh3)2 at 120 oC; Plot of % cis-isomer
versus time
122
0 50 100 150 200 250-0.30
-0.25
-0.20
-0.15
-0.10
-0.05
0.00In
[At/A
o]
Time (Minutes)
Figure 8.6: ln α versus time curve for cis-Mo(CO)4(PPh3)2 at 120 oC
0 20 40 60 80 100 120
0
20
40
60
80
100
% c
is is
omer
Time (minutes)
Figure 8.7: Thermal reaction of cis-Mo(CO)4(PPh3)2 at 130 oC
123
0 20 40 60 80 100
0
20
40
60
80
100
% c
cc Is
omer
Time (minutes)
Figure 8.8: Thermal reaction of cis-Mo(CO)4(PPh3)2 at 140 oC
8.4.2 Thermal reaction of cis-Mo(CO)4(PPh3)2 under CO at various
temperatures: analysis by 31P NMR spectroscopy
The reactions were carried out to establish the effect of using CO instead of nitrogen gas
on the reaction. The kinetic plot at 140 oC is shown in figure 8.9. It does show that the
cis-isomer undergoes isomerisation when the heating time is increased. The isomerisation
process is very slow. For example, under nitrogen after 180 minutes 100 % conversion
was observed while under CO only a 48 % conversion was achieved. A 31P NMR
spectrum recorded on the reaction sample at the end of the reaction under CO does not
show the presence of any oxidized phosphine. However, heating under nitrogen beyond
100 minutes gives complete conversion to the trans isomer and a significant amount of
oxidised phosphine
124
.
-20 0 20 40 60 80 100 120 140 160 180 200
40
50
60
70
80
90
100
cis-
isom
er
Time (Minutes)
Figure 8.9: Thermal reaction of cis-Mo(CO)4(PPh3)2 under CO at 140 oC
The kinetic plot at 150 oC is shown in Figure 8.10. The complex undergoes complete
conversion to the trans isomer beyond 50 minutes (not shown). There is also the
appearance of an oxidized phosphine peak in the NMR spectrum after 50 minutes which
implies that the complex started decomposing before this time. Attempts to plot [lnα]
versus time graphs did not yield a straight line implying either that the reaction was not
first order or that the quality of the data collected by this technique are poor e.g. figure
8.11.
125
-5 0 5 10 15 20 25 30 35 4030
40
50
60
70
80
90
100
110
% cis
isom
er
Time (minutes)
Figure 8.10: Thermal reaction of cis-Mo(CO)4(PPh3)2 under CO at 150 oC
-5 0 5 10 15 20 25 30 35 40
-1.0
-0.8
-0.6
-0.4
-0.2
0.0
ln[A
o-At]
Time (minutes)
Figure 8.11: Plot of ln α versus time curve for thermal reaction of cis-Mo(CO)4(PPh3)2
under CO at 150 oC
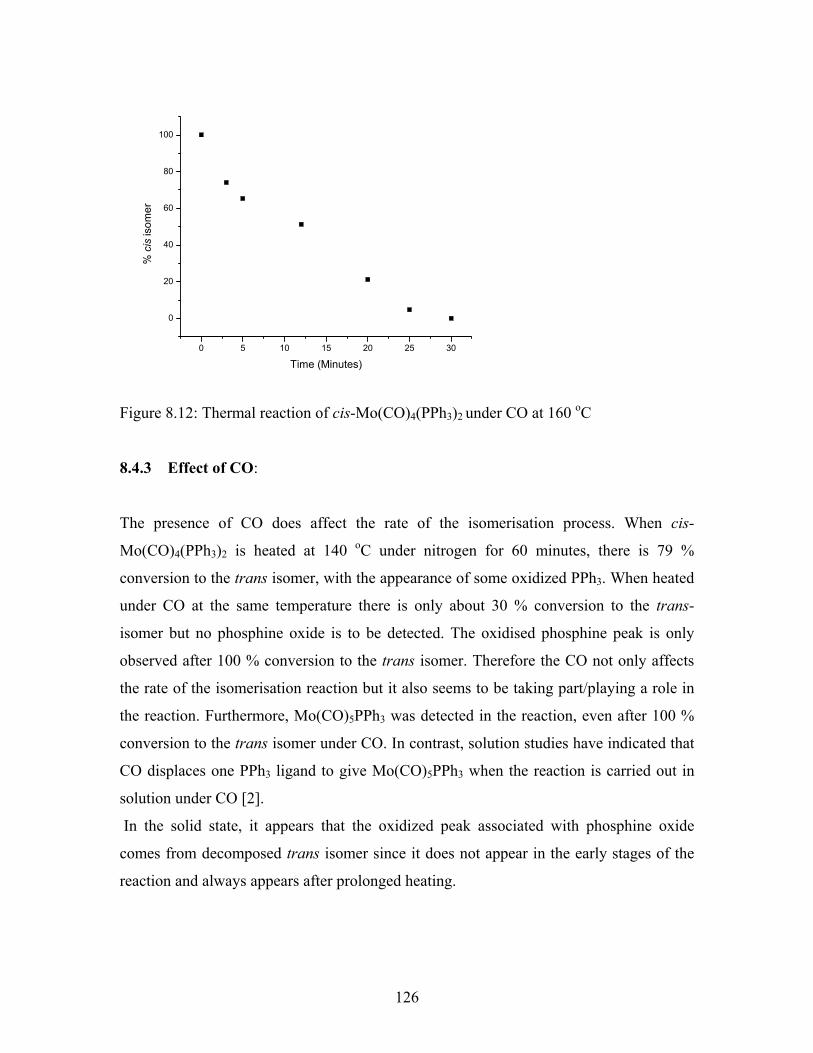
The kinetic plot at 160 oC is shown in figure 8.12. The plot reveals that after 20 minutes
80 % conversion to the trans isomer has occurred but that no phosphine oxide has
appeared. However after 25 minutes (>90 % conversion) phosphine oxide can now be
detected.
126
0 5 10 15 20 25 30
0
20
40
60
80
100%
cis
isom
er
Time (Minutes)
Figure 8.12: Thermal reaction of cis-Mo(CO)4(PPh3)2 under CO at 160 oC
8.4.3 Effect of CO:
The presence of CO does affect the rate of the isomerisation process. When cis-
Mo(CO)4(PPh3)2 is heated at 140 oC under nitrogen for 60 minutes, there is 79 %
conversion to the trans isomer, with the appearance of some oxidized PPh3. When heated
under CO at the same temperature there is only about 30 % conversion to the trans-
isomer but no phosphine oxide is to be detected. The oxidised phosphine peak is only
observed after 100 % conversion to the trans isomer. Therefore the CO not only affects
the rate of the isomerisation reaction but it also seems to be taking part/playing a role in
the reaction. Furthermore, Mo(CO)5PPh3 was detected in the reaction, even after 100 %
conversion to the trans isomer under CO. In contrast, solution studies have indicated that
CO displaces one PPh3 ligand to give Mo(CO)5PPh3 when the reaction is carried out in
solution under CO [2].
In the solid state, it appears that the oxidized peak associated with phosphine oxide
comes from decomposed trans isomer since it does not appear in the early stages of the
reaction and always appears after prolonged heating.
127
8.4.4 Colour changes noted during heating of cis-Mo(CO)4(PPh3)2 under CO
On heating cis-Mo(CO)4(PPh3)2 under CO in a sealed NMR tube , the colour of the
complex gradually changes from dark yellow to pale yellow. The colour changes were
noted by visual inspection. Samples which were heated for a long time gradually changed
from pale yellow to orange and finally to dark green to a near black colour (for samples
heated for a long time). The heated samples (black materials) were dissolved in
chloroform after shaking for a long time. Samples heated beyond 40 minutes at 160 oC
gave dark green solutions.
Dissolution of the samples obtained from heating experiments done at 140 and 150 oC
under CO, showed the presence of PPh3 (less than 1 %). This peak is detected in the early
stages of the reaction and might arise when a minor amount of PPh3 (not detected by IR
spectroscopy) is displaced by CO. The PPh3 was not observed for reactions done under
nitrogen.
At 160 oC, no PPh3 peak was detected but oxidised PPh3 was observed towards
completion of the reaction. This was also noted for reactions carried out at 140 and 150 oC. This suggests that the oxidized PPh3 is a decomposition product obtained from the
trans isomer. This peak was also observed after heating experiments under nitrogen. The
question is: How does the PPh3 get oxidised? There are two possible explanations; (i) it
might be a decomposition product (ii) it might be obtained from a solution reaction
occurring whilst collecting the NMR spectra of the samples.
Samples of both the cis and trans isomer were dissolved in chloroform to establish
whether dissociation of the PPh3 ligand occurred. It was observed that PPh3 was detected
whilst in solution i.e the oxidised phosphine ligand might have arisen from oxidation of
the dissociated PPh3 in solution during analysis of the samples.
128
8.4.5 DRIFTS studies of cis-Mo(CO)4(PPh3)2 under nitrogen
DRIFTS studies were undertaken to evaluate the isomerisation reaction of cis-
Mo(CO)4(PPh3)2 under nitrogen. The following advantages have been observed when
using DRIFTS compared to the NMR method discussed previously;
• DRIFTS allows for in situ measurements. In the NMR technique, one has to
prepare different samples to obtain various points for a single kinetic plot, and
hence a lot of sample is wasted whereas in DRIFTS only one sample is used and
many points required for a single set of kinetic plot are obtained. Also, with the
NMR technique, a lot of time is wasted in preparing the samples for heating and
in measurement. Uniformity of the samples used for data points also brings in
many complexities when measuring the kinetics of the reaction. With DRIFTS
only one sample is used for all the data points and there is no problem with the
uniformity of the samples.
• The reactions can be monitored in the solid state, whereas with the NMR
technique, the samples have to be dissolved in solvents. Therefore, solvent effects
might affect the kinetics of the reaction. Also the use of deuterated solvents and
the use of many NMR tubes (for heating at various time intervals) is more
expensive. Hence, DRIFTS is a cheaper technique than the procedure of
monitoring the reaction by 31P NMR spectroscopy.
• The ability to work in temperature range of 25 to 500 oC and to work under inert
atmospheres
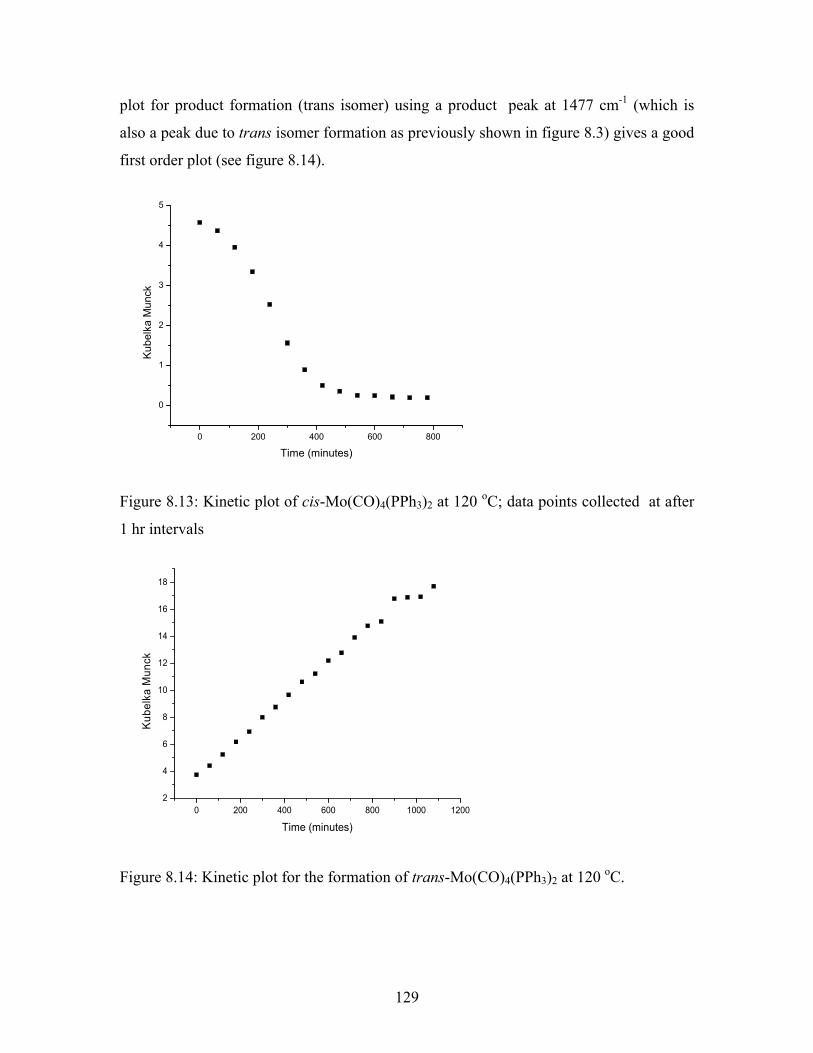
Data for the isomerisation reaction at 120 oC are shown in Figure 8.13. The isomerisation
reaction appears to occur in three steps. The first step entails a slow reaction that occurs
in less than 100 minutes. This reaction is likely to be described as an initiation step e.g.
reaction occurring at a surface. This is followed by a rapid reaction between 100 and 300
minutes (propagation step), and a final slow reaction at 300 minutes and beyond (reaction
approaching completion). This last reaction is very slow when compared to the first and
second reaction rates. The data between 0 and beyond 800 minutes were re-plotted
assuming that the reaction obeyed first order kinetics. In this time interval the kinetic
129
plot for product formation (trans isomer) using a product peak at 1477 cm-1 (which is
also a peak due to trans isomer formation as previously shown in figure 8.3) gives a good
first order plot (see figure 8.14).
0 200 400 600 800
0
1
2
3
4
5
Kube
lka
Mun
ck
Time (minutes)
Figure 8.13: Kinetic plot of cis-Mo(CO)4(PPh3)2 at 120 oC; data points collected at after
1 hr intervals
0 200 400 600 800 1000 12002
4
6
8
10
12
14
16
18
Kube
lka
Mun
ck
Time (minutes)
Figure 8.14: Kinetic plot for the formation of trans-Mo(CO)4(PPh3)2 at 120 oC.
130
Reactions were also attempted at three other temperatures. At 130 and 140 oC (figures
8.15 to 8.18) the reaction is reasonably well behaved appearing to follow first order
kinetics in the early stages of the reaction (first 100 minutes).
-20 0 20 40 60 80 100 120 140 160 180 200
1.5
2.0
2.5
3.0
3.5
4.0
4.5
5.0
5.5
6.0
Kube
lka
Mun
ck
Time (minutes)
Figure 8.15: Kinetic plot of cis-Mo(CO)4(PPh3)2 at 130 oC; data points collected after 5
minute intervals
-20 0 20 40 60 80 100 120 140 160 180 200
-1.2
-1.0
-0.8
-0.6
-0.4
-0.2
0.0
ln[A
t/Ao]
Time (minutes)
Figure 8.16: ln α versus time curve for the cis-Mo(CO)4(PPh3)2 at 130 oC
131
0 20 40 60 80 100 1200.6
0.8
1.0
1.2
1.4
1.6
1.8
2.0
2.2
2.4
Kub
elka
Mun
ck
Time(minutes)
Figure 8.17: Absorbance versus time plot of cis-Mo(CO)4(PPh3)2 at 140 oC; data points
collected at 5 minute intervals.
0 10 20 30 40 50 60-1.0
-0.8
-0.6
-0.4
-0.2
0.0
ln[A
t/A0]
Time (minutes)
Figure 8.18: ln α versus time curve for the cis-Mo(CO)4(PPh3)2 at 140 oC
The kinetic plots at 150 and 160 oC (figure 8.19 to 8.23) could also be replotted to fit a
first order plot.
132
-10 0 10 20 30 40 50 60 70
4
6
8
10
12
14
Kub
elka
Mun
ck
Time (minutes)
Figure 8.19: Thermal reaction of cis-Mo(CO)4(PPh3)2 at 150 oC; data points collected at 4
minute intervals.
0 10 20 30 40 50
-0.8
-0.6
-0.4
-0.2
0.0
ln[A
t/Ao]
Time (minutes)
Figure 8.20: ln α versus time for the cis-Mo(CO)4(PPh3)2 at 150 oC
133
0 5 10 15 20 251.5
2.0
2.5
3.0
3.5
4.0
4.5
Kube
lka
Mun
ck
Time (minutes)
Figure 8.21 : Absorbance (Kubelka Munck) versus time plot of cis-Mo(CO)4(PPh3)2 at
160 oC, data points collected at 1 minute intervals.
-1 0 1 2 3 4 5 6 7 8-0.30
-0.25
-0.20
-0.15
-0.10
-0.05
0.00
ln[A
t/A0]
Time (Minutes)
Figure 8.23: ln α versus time for the cis-Mo(CO)4(PPh3)2 at 160 oC
Rate constants were obtained from the various temperature studies and the data are
shown in Table 8.1.
134
Table 8.1: Rate constants for isomerisation of the cis-Mo(CO)4(PPh3)2 comlex at