8-1 2011 v1.0 CHAPTER 8 DENSITY TESTING The Virginia Department of Transportation (VDOT) requires that the Contractor perform density testing on the surface, intermediate and base courses of asphalt mats in order to determine if the specifications can be met by the job-mix used. Virginia Test Method -76 (VTM-76) is the procedure used by VDOT and it’s Contractors to; 1) determine the compaction required for the mix with the Roller Pattern, 2) determine the density achieved by the roller pattern with the Control Strip, 3) and then divide the rest of the project into Test Sections for acceptance testing. Testing shall be performed by an individual who is Asphalt Field certified whether using a nuclear density gauge or extracting sawn plugs/cores. Note: The nuclear density gauge must be provided by the Contractor. Performing the Standard Count Using a 4640 B Nuclear Density Gauge The gauge comes equipped with a reference block and an air gap spacer to perform the standard count procedure. A standard count is taken daily to check the gauge operation and naturally occurring background radiation. It also allows the gauge to compensate for natural source decay. Procedure: • Establish an area at least 10 feet from any structure, and 33 feet from other radioactive sources, such as another gauge, to take standard counts. Select a location that is flat, either concrete or asphalt with a minimum density of 100 lb/ft 3 . Do not use truck beds, tailgates or tabletops. • Place the air gap spacer on the reference block. • Then place the gauge on the air gap spacer. The gauge must be in the “safe” position. The air gap spacer has three legs, two on one end and one on the other. For stability, set the handle side of the gauge on the two-legged side of the air gap spacer. A stable gauge is critical for obtaining accurate readings.
Transcript
8-12011 v1.0
CHAPTER 8DENSITY TESTING
The Virginia Department of Transportation (VDOT) requires that the Contractor perform density testing on the surface, intermediate and base courses of asphalt mats in order to determine if the specifications can be met by the job-mix used. Virginia Test Method -76 (VTM-76) is the procedure used by VDOT and it’s Contractors to; 1) determine the compaction required for the mix with the Roller Pattern, 2) determine the density achieved by the roller pattern with the Control Strip, 3) and then divide the rest of the project into Test Sections for acceptance testing.
Testing shall be performed by an individual who is Asphalt Field certified whether using a nuclear density gauge or extracting sawn plugs/cores.
Note: The nuclear density gauge must be provided by the Contractor.
Performing the Standard Count Using a 4640 B Nuclear Density Gauge
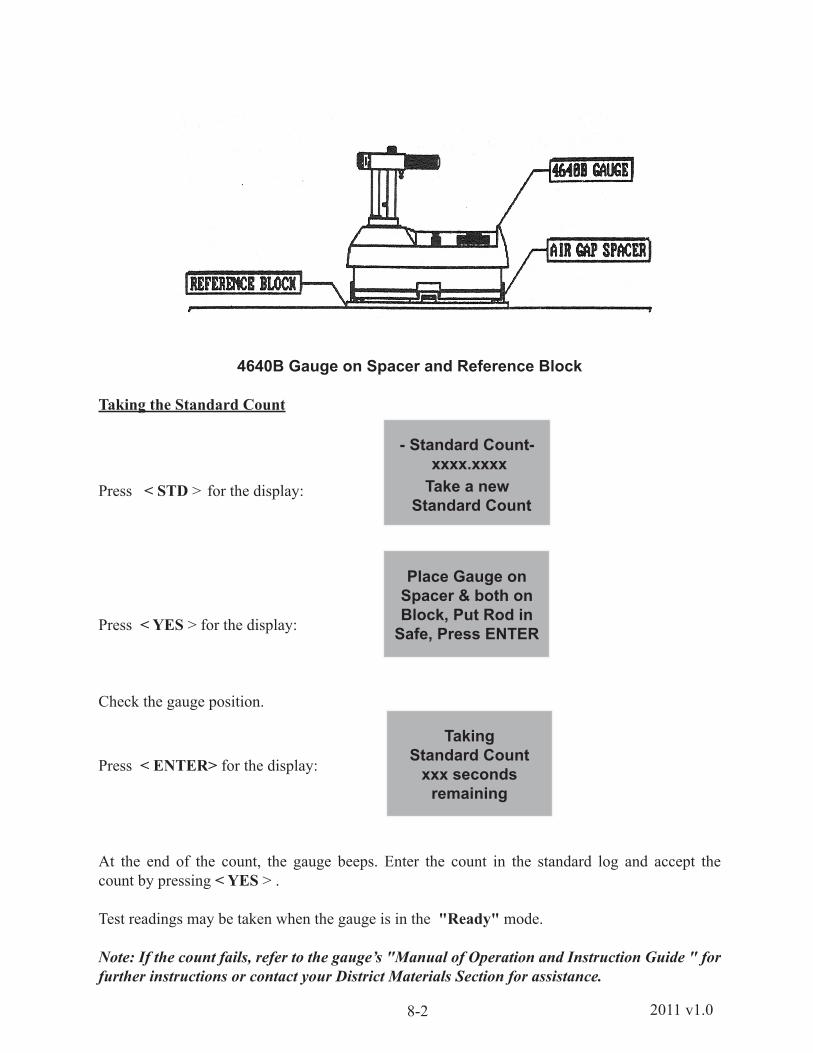
The gauge comes equipped with a reference block and an air gap spacer to perform the standard count procedure. A standard count is taken daily to check the gauge operation and naturally occurring background radiation. It also allows the gauge to compensate for natural source decay.
Procedure:
• Establish an area at least 10 feet from any structure, and 33 feet from other radioactive sources, such as another gauge, to take standard counts. Select a location that is flat, either concrete or asphalt with a minimum density of 100 lb/ft3. Do not use truck beds, tailgates or tabletops.
• Place the air gap spacer on the reference block.
• Then place the gauge on the air gap spacer. The gauge must be in the “safe” position. The air gap spacer has three legs, two on one end and one on the other. For stability, set the handle side of the gauge on the two-legged side of the air gap spacer. A stable gauge is critical for obtaining accurate readings.
8-2 2011 v1.0
4640B Gauge on Spacer and Reference Block
Taking the Standard Count
Press < STD > for the display:
Press < YES > for the display:
Check the gauge position. Taking
Standard Countxxx seconds
remaining
Press < ENTER> for the display:
At the end of the count, the gauge beeps. Enter the count in the standard log and accept the count by pressing < YES > .
Test readings may be taken when the gauge is in the "Ready" mode.
Note: If the count fails, refer to the gauge’s "Manual of Operation and Instruction Guide " for further instructions or contact your District Materials Section for assistance.
- Standard Count- xxxx.xxxxTake a new
Standard Count
Place Gauge onSpacer & both onBlock, Put Rod in
Safe, Press ENTER
8-32011 v1.0
The Roller Pattern
The roller pattern determines the number of roller passes required to achieve maximum density for a given asphalt mix.
Roller Pattern Construction (VTM-76)
The following items are needed before beginning the Roller Pattern/Control Strip: - Approved Mix Design - Approved paving equipment - Nuclear gauge template and white or other approved spray paint - Thin-lift nuclear density gauge with printer, meeting requirements of VTM-81 - Magnesium nuclear gauge calibration block - A rolling measuring device that will measure from 1 to 1000 linear feet or any other device approved by the Engineer - Rotary saw or coring machine for sawing core/ or plug. - Equipment to weigh cores or plugs (VTM-6) - The Maximum Theoretical Specific Gravity of the mix as determined in VTM-22
This illustration of the roller pattern and control strip shows the way you will usually see them in the field. The material for the roller pattern is placed first, then the material for the control strip.
Initial Paving Prior to Roller Pattern500 - 1000 ft
50 ft
Roller Pattern 75 ft
50 ft Control Strip300 ft
A roller pattern and control strip should only be contructed after a minimum of 500 feet of mix has been placed. Within 500 - 1000 feet of mix placement, a roller pattern and control strip must be constructed. The first 75 feet length will be the roller pattern and the next 300 foot length will be the control strip, regardless of the paver width. This mix should be of the same depth and application rate as called for in the plans and/or contract.
• Place enough asphalt to construct the roller pattern. Allow about 50 feet on either end of the roller pattern section for the roller to maneuver.
• It is recommended that the paving train stop while the roller pattern is being constructed.
8-4 2011 v1.0
• Begin the roller pattern by making (2) two passes of the roller over the 75-foot roller pattern area. Move the roller over and roll the same number of passes on the other section of the paver width. ( One pass is “up”, two passes is “up and back”)
Note: Use judgment and experience to make the maximum number of passes before beginning the nuclear gauge readings. (If a mix has historically taken 6 vibratory passes of the roller to achieve compaction, make 4 vibratory passes before taking the first readings.)
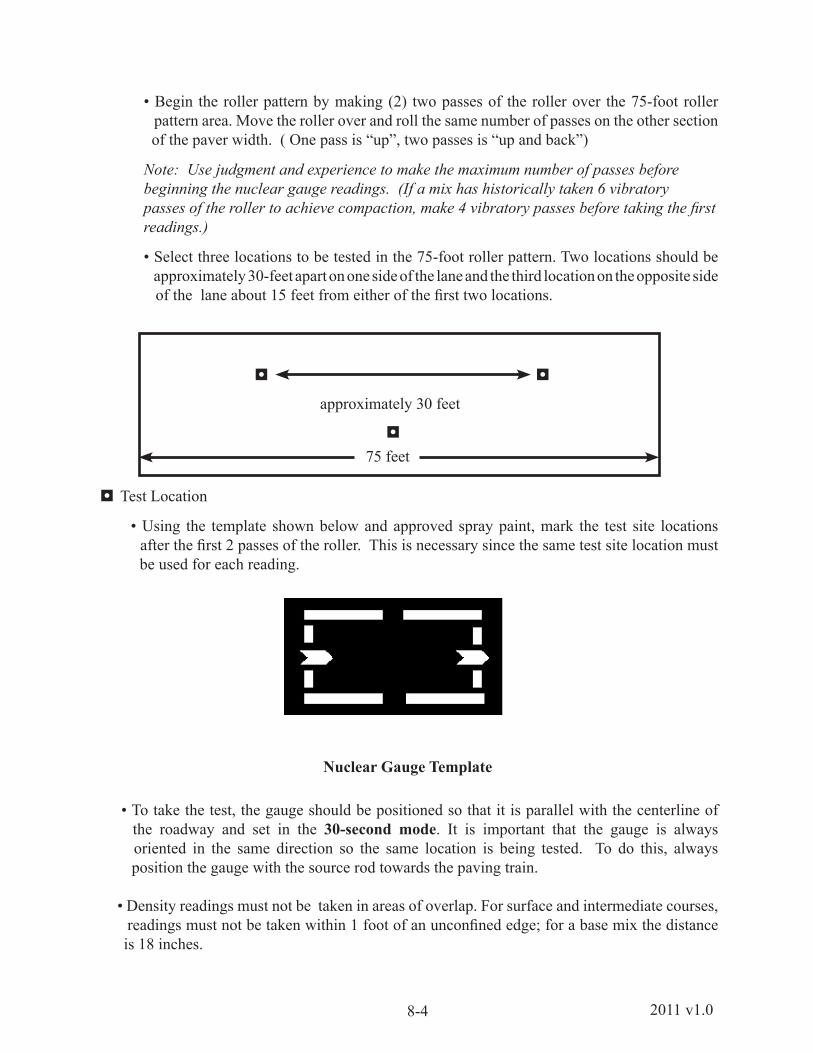
• Select three locations to be tested in the 75-foot roller pattern. Two locations should be approximately 30-feet apart on one side of the lane and the third location on the opposite side of the lane about 15 feet from either of the first two locations.
◘ Test Location
• Using the template shown below and approved spray paint, mark the test site locations after the first 2 passes of the roller. This is necessary since the same test site location must be used for each reading.
Nuclear Gauge Template
• To take the test, the gauge should be positioned so that it is parallel with the centerline of the roadway and set in the 30-second mode. It is important that the gauge is always oriented in the same direction so the same location is being tested. To do this, always position the gauge with the source rod towards the paving train.
• Density readings must not be taken in areas of overlap. For surface and intermediate courses, readings must not be taken within 1 foot of an unconfined edge; for a base mix the distance is 18 inches.
◘ ◘ approximately 30 feet ◘
75 feet
8-52011 v1.0
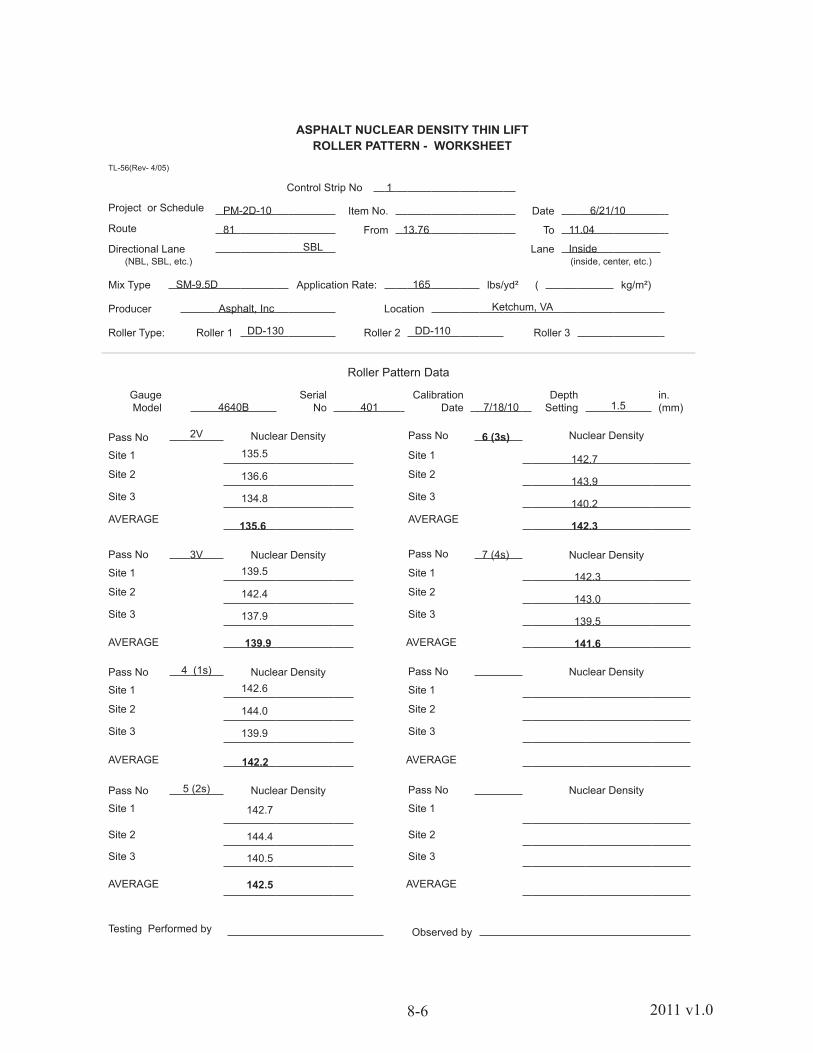
• Test the 3 locations after the first two passes of the roller. Record the readings on the Asphalt Nuclear Density Thin-Lift Roller Pattern Worksheet TL-56 . Calculate the average density of the 3 locations and plot the average density in pounds per cubic foot versus the number of roller passes on the Asphalt Nuclear Density Thin-Lift Roller Pattern Graph on the TL-57 form. ( See pages 8-6 and 8-7 for TL forms)
• Continue this procedure - rolling and testing of the section until the roller pattern reaches its maximum density. To achieve maximum density, the mat shall be rolled until the average density decreases. This is observed by a “break” in the plotted curve. At this point, additional passes may cause the mat to decompact, or lose density.
• After the first decrease in density, make one additional pass, in the static mode, over the entire width of the mat to ensure that there is not a *false break. If the mat decreases in density again, then the maximum density will be the density achieved one roller pass before the initial decrease in density.
• At this point the roller pattern is complete, maximum density has been attained. You can begin laying the asphalt for the Control Strip.
* A false break occurs when the density increases after a decrease in density. If this happens, continue to make passes with the roller in the static mode until the density decreases a second time. Then make one additional pass to verify the break. The maximum density will be the greatest density achieved at the least number of passes.
Note: Typically a decrease of 0.5 lb/ft3 will indicate maximum density has been achieved.
8-6 2011 v1.0
ASPHALT NUCLEAR DENSITY THIN LIFTROLLER PATTERN - WORKSHEET
TL-56(Rev- 4/05)
Control Strip No 1
Project or Schedule PM-2D-10 Item No. Date 6/21/10
Route 81 From 13.76 To 11.04
Directional Lane SBL Lane Inside(NBL, SBL, etc.) (inside, center, etc.)
Mix Type SM-9.5D Application Rate: 165 lbs/yd² ( kg/m²)
Pass No 2V Nuclear Density Pass No Nuclear Density6 (3s)Site 1 135.5 Site 1 142.7Site 2 136.6 Site 2
143.9Site 3 134.8 Site 3
140.2AVERAGE 135.6 AVERAGE 142.3
Pass No 3V Nuclear Density Pass No 7 (4s) Nuclear Density
Site 1 139.5 Site 1 142.3Site 2 142.4 Site 2
143.0Site 3 137.9 Site 3
139.5
AVERAGE 139.9
AVERAGE 141.6
Pass No 4 (1s) Nuclear Density Pass No
Nuclear Density
Site 1 142.6 Site 1
Site 2 144.0 Site 2
Site 3 139.9 Site 3
AVERAGE 142.2
AVERAGE
Pass No 5 (2s) Nuclear Density Pass No
Nuclear Density
Site 1 142.7 Site 1
Site 2 144.4 Site 2
Site 3 140.5 Site 3
AVERAGE 142.5
AVERAGE
Testing Performed by Observed by
8-72011 v1.0
TL-57 (Rev. 4/05)
ASPHALT NUCLEAR DENSITY THIN LIFTROLLER PATTERN -GRAPH
Control Strip No 1
Project or Schedule PM-2D-10 Item No Date 6/21/10
Route From 13.76 To 11.04
Directional Lane SBL Lane Inside(NBL, SBL, etc) (Inside, Center, etc.)
Mix Type SM-9.5D Application Rate 165 lbs/yd² ( kg/m²)
Producer Asphalt, Inc Location Ketchum, VA
Gauge Model 4640B
SerialNo 401
Calibration Date 4/24/10
DepthSetting 1.5 in. (mm)
144
143
142
141
DENSITY 140 lbs/ft3 (kg/m3)
139
138
137
136
135
2 3 4 5 6 7 8 9 10
NUMBER OF ROLLER PASSES
Optimum Density 142.5 lbs/ft³ (kg/m³)(from peak of roller pattern curve)
Optimum Number of Passes: 5Number of Roller Passes Roller 1 3 V Roller 2 2 S Roller 3
Testing Performed By Observed ByVDOT Inspector
●
●
●●
●●
8-8 2011 v1.0
The Control Strip
The Control Strip is built by following the the procedure established in the roller pattern section to determine if the density can be achieved. VDOT specifications require that one control strip be constructed at the beginning of work on each roadway and shoulder course and on each lift of each course. An additional control strip is required when:
▪ A change is made in the type or source of materials ▪ Whenever a significant change occurs in the composition of the material being placed from the same source ▪ When there is a failing control strip.
During the evaluation of the initial control strip, paving operations may continue. However, paving and production shall be discontinued during construction and evaluation of additional control strips. In the event that two consecutive control strips fail, subsequent paving operations shall cease until corrective action(s) has been made with the approval of the Engineer. If it is determined with the Engineer’s approval that the density cannot be obtained because of the condition of the existing pavement structure, the target control strip density shall be determined from the roller pattern that achieves the optimum density and shall be used on the remainder of the roadway that exhibits similar pavement conditions.
Either the Department or Contractor may initiate an additional control strip at any time.
Determining Density Testing Locations
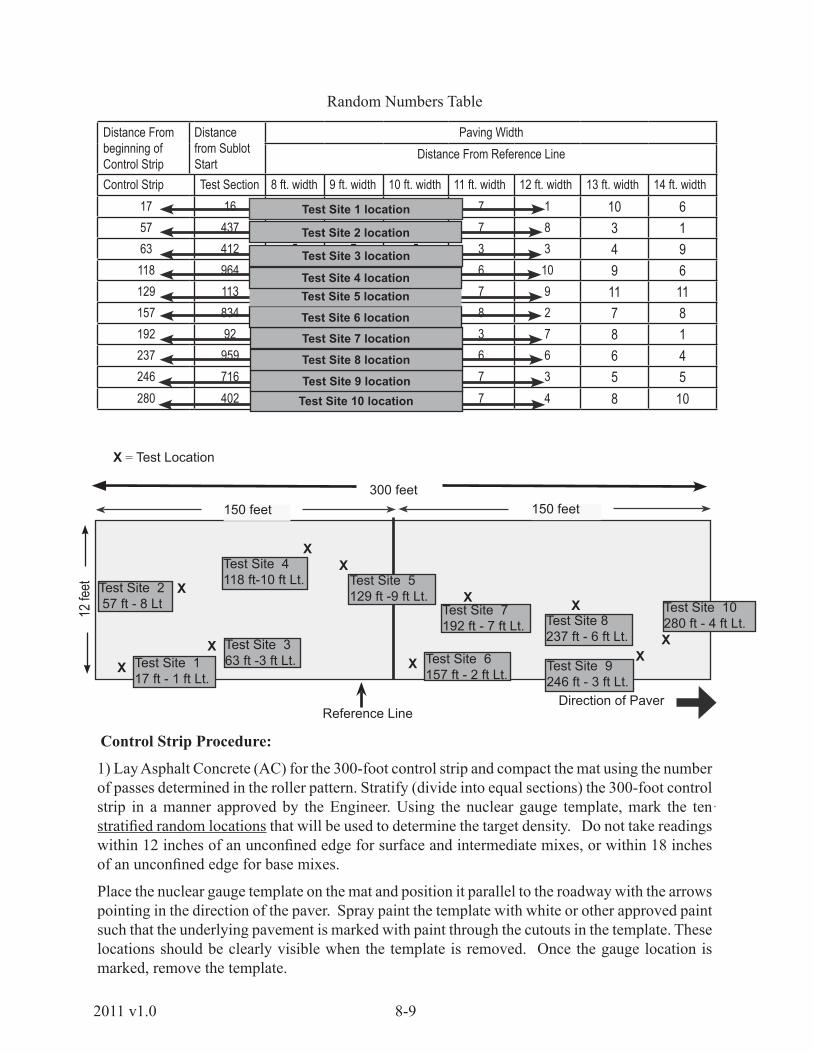
The stratified random sampling method is used to determine the locations for density testing in the contol strip. Stratified random sampling is “sampling from equal portions of a lot at locations that have been selected solely by chance”. Any statistically acceptable method of randomization may be used to determine the location of the stratified random sample to be taken; however, the method must be approved by the Engineer prior to beginning testing. All random locations shall be determined for each test site prior to the beginning of the paving operation. This manual shows one of several acceptable methods of stratified random sampling for a control strip.
Selecting Random Numbers
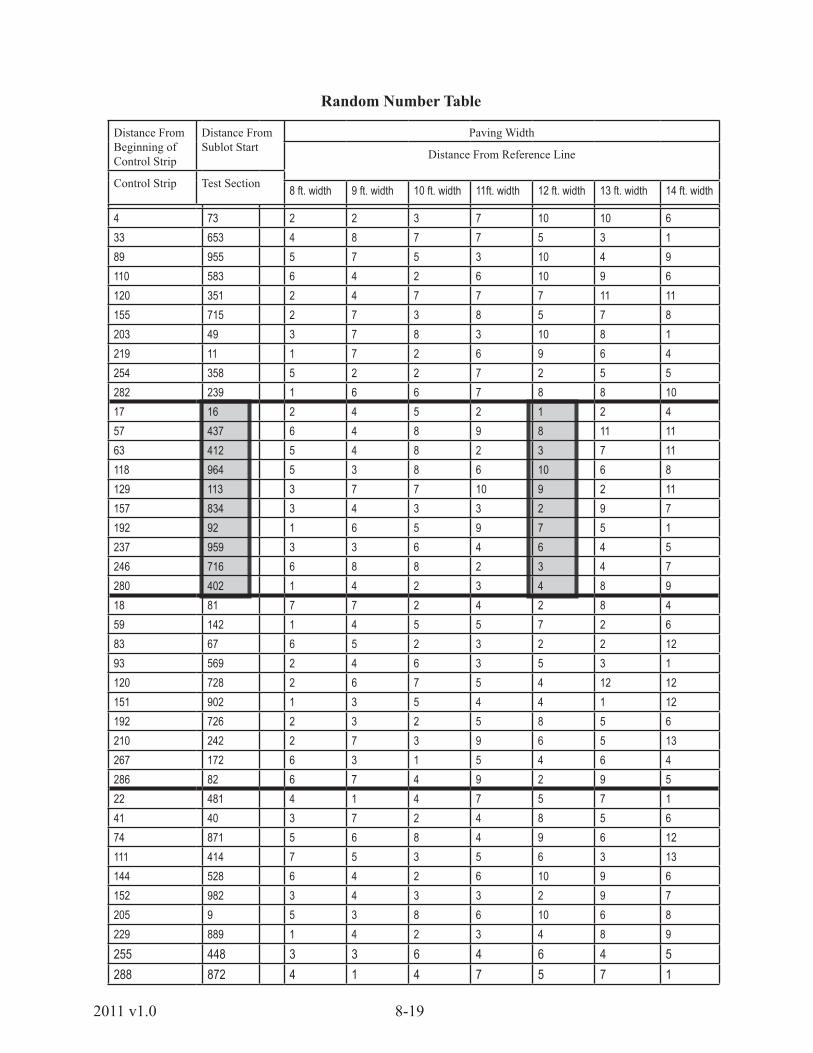
To determine test site locations, select ten numbers from the Random Numbers Table (see next page) under “Distance from beginning of Control Strip” and the corresponding numbers under “Paving Width - Distance From Reference Line”. Record these coordinates on the TL-58 form (Page 8-10).
For this example, the pavement width is 12 feet and the reference line is on the right. The first test site location will be 17 feet from the start of the control strip and 1 foot from the left of the reference line. The diagram illustrates the test site locations for this control strip.
1) Lay Asphalt Concrete (AC) for the 300-foot control strip and compact the mat using the number of passes determined in the roller pattern. Stratify (divide into equal sections) the 300-foot control strip in a manner approved by the Engineer. Using the nuclear gauge template, mark the ten stratified random locations that will be used to determine the target density. Do not take readings within 12 inches of an unconfined edge for surface and intermediate mixes, or within 18 inches of an unconfined edge for base mixes.
Place the nuclear gauge template on the mat and position it parallel to the roadway with the arrows pointing in the direction of the paver. Spray paint the template with white or other approved paint such that the underlying pavement is marked with paint through the cutouts in the template. These locations should be clearly visible when the template is removed. Once the gauge location is marked, remove the template.
Test Site 10 locationTest Site 9 location
Test Site 8 location
Test Site 7 location
Test Site 6 location
Test Site 5 locationTest Site 4 location
Test Site 3 location
Test Site 2 location
Test Site 1 location
12 fe
etDirection of Paver
300 feet150 feet150 feet
12 fe
et
X Test Site 117 ft - 1 ft Lt.
XTest Site 4118 ft-10 ft Lt.
X Test Site 363 ft -3 ft Lt.
Test Site 2 57 ft - 8 Lt
X
X Test Site 6157 ft - 2 ft Lt.
XTest Site 7192 ft - 7 ft Lt.
XTest Site 8237 ft - 6 ft Lt.
XTest Site 9246 ft - 3 ft Lt.
X
Test Site 10280 ft - 4 ft Lt.
Test Site 5129 ft -9 ft Lt.
X
8-10 2011 v1.0
TL-58 (Rev. 4/05)
VIRGINIA DEPARTMENT OF TRANSPORTATIONASPHALT NUCLEAR DENSITY THIN LIFT WORKSHEET
CONTROL STRIP TARGET DENSITY
Control Strip Number 1Project or Schedule PM-2D-10 Item Number Date 6/21/10
Route 81 From 8.23 To 16.25
Directional Lane SBL Lane Inside
Mix Type(NBL, SBL, etc)
SM-9.5D Application Rate 165 lbs/yd²(Inside, Center, etc.)( kg/m²)
Producer Asphalt, Inc Location Ketchum, VA
CONTROL STRIP TARGET DENSITY DETERMINATION
GaugeModel 4640B
Serial Number 401
Calibration Date 4/24/10
DepthSetting 1.5 in (mm)
TEST SITE
DISTANCE OFFSET ENTER GAUGE READING
Site 1 17 ft. 1 ft. Lt 141.1 lb/ft³ ( kg/m³)Site 2 57 ft. 8 ft. Lt 137.4 lb/ft³ ( kg/m³)Site 3 63 ft. 3 ft. Lt 141.9 lb/ft³ ( kg/m³)Site 4 118 ft. 10 ft. Lt 144.1 lb/ft³ ( kg/m³)Site 5 129 ft. 9 ft. Lt 142.8 lb/ft³ ( kg/m³)Site 6 157 ft. 2 ft. Lt 143.8 lb/ft³ ( kg/m³)Site 7 192 ft. 7 ft. Lt 143.0 lb/ft³ ( kg/m³)Site 8 237 ft. 6 ft. Lt 138.0 lb/ft³ ( kg/m³)Site 9 246 ft. 3 ft. Lt 144.1 lb/ft³ ( kg/m³)Site 10 280 ft. 4 ft. Lt 137.9 lb/ft³ ( kg/m³)
Total 1414.1 lb/ft³ ( kg/m³)Average 141.4 lb/ft³ ( kg/m³)
Remarks:
Testing Performed by Observed byVDOT Inspector
Numbers selected from the Random Numbers Table
The density for acceptance of the rest of the project (Test Sections) is measured against this “Target Density”.
8-112011 v1.0
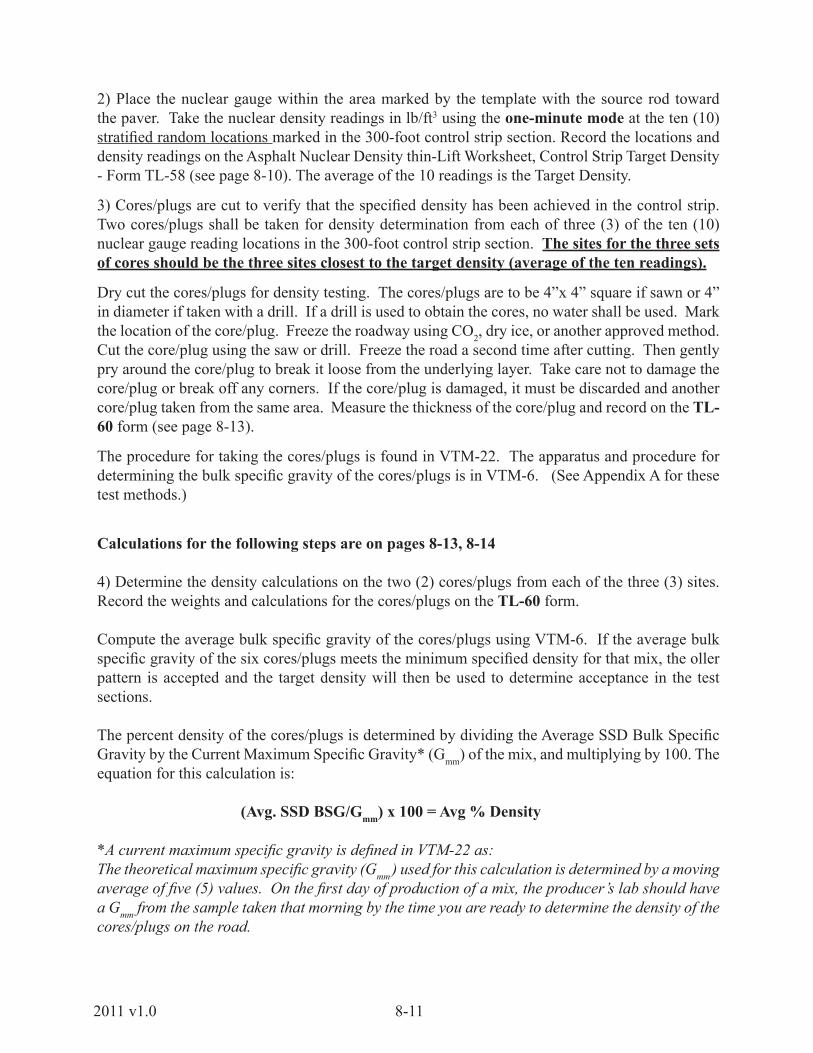
2) Place the nuclear gauge within the area marked by the template with the source rod toward the paver. Take the nuclear density readings in lb/ft3 using the one-minute mode at the ten (10) stratified random locations marked in the 300-foot control strip section. Record the locations and density readings on the Asphalt Nuclear Density thin-Lift Worksheet, Control Strip Target Density - Form TL-58 (see page 8-10). The average of the 10 readings is the Target Density.
3) Cores/plugs are cut to verify that the specified density has been achieved in the control strip. Two cores/plugs shall be taken for density determination from each of three (3) of the ten (10) nuclear gauge reading locations in the 300-foot control strip section. The sites for the three sets of cores should be the three sites closest to the target density (average of the ten readings).
Dry cut the cores/plugs for density testing. The cores/plugs are to be 4”x 4” square if sawn or 4” in diameter if taken with a drill. If a drill is used to obtain the cores, no water shall be used. Mark the location of the core/plug. Freeze the roadway using CO2, dry ice, or another approved method. Cut the core/plug using the saw or drill. Freeze the road a second time after cutting. Then gently pry around the core/plug to break it loose from the underlying layer. Take care not to damage the core/plug or break off any corners. If the core/plug is damaged, it must be discarded and another core/plug taken from the same area. Measure the thickness of the core/plug and record on the TL-60 form (see page 8-13).
The procedure for taking the cores/plugs is found in VTM-22. The apparatus and procedure for determining the bulk specific gravity of the cores/plugs is in VTM-6. (See Appendix A for these test methods.)
Calculations for the following steps are on pages 8-13, 8-14
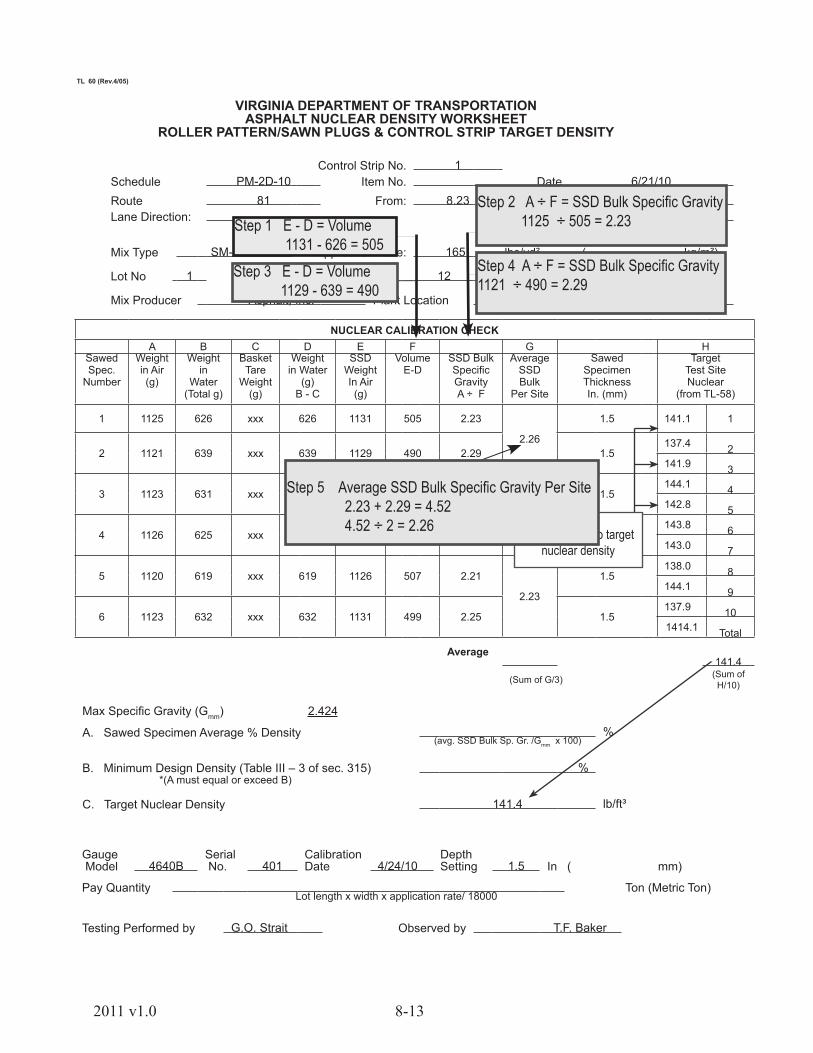
4) Determine the density calculations on the two (2) cores/plugs from each of the three (3) sites. Record the weights and calculations for the cores/plugs on the TL-60 form. Compute the average bulk specific gravity of the cores/plugs using VTM-6. If the average bulk specific gravity of the six cores/plugs meets the minimum specified density for that mix, the oller pattern is accepted and the target density will then be used to determine acceptance in the test sections.
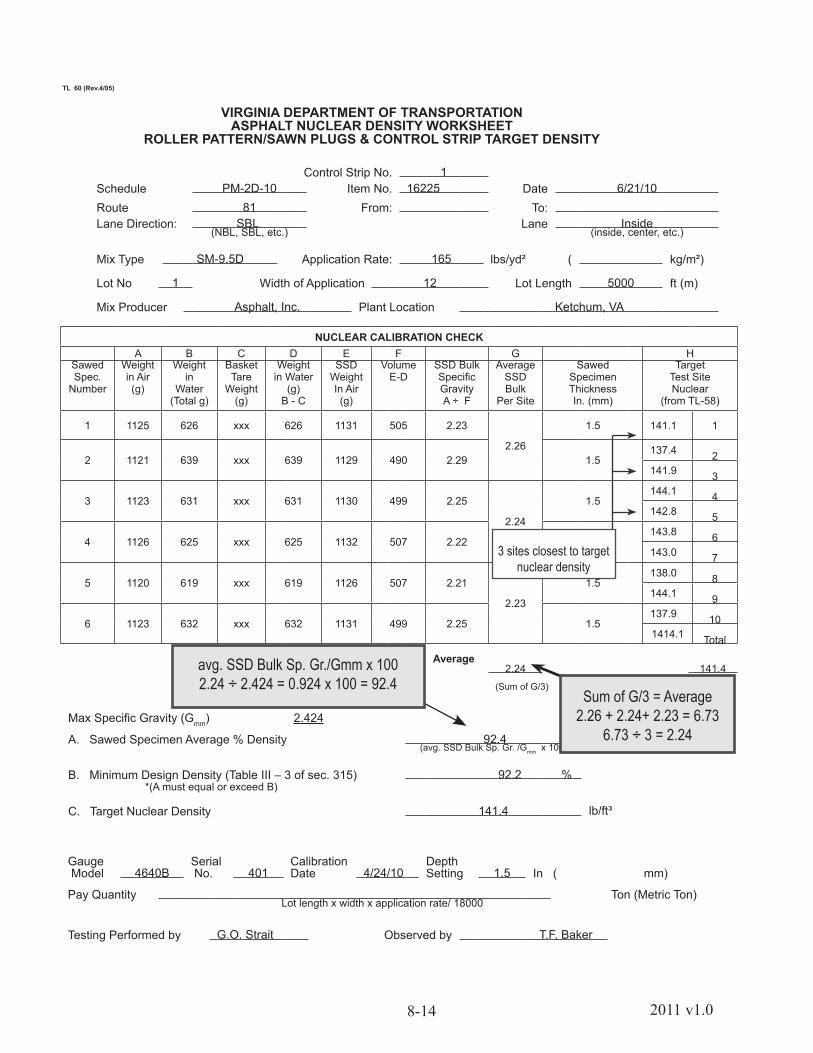
The percent density of the cores/plugs is determined by dividing the Average SSD Bulk Specific Gravity by the Current Maximum Specific Gravity* (Gmm) of the mix, and multiplying by 100. The equation for this calculation is: (Avg. SSD BSG/Gmm) x 100 = Avg % Density
*A current maximum specific gravity is defined in VTM-22 as:The theoretical maximum specific gravity (Gmm ) used for this calculation is determined by a moving average of five (5) values. On the first day of production of a mix, the producer’s lab should have a Gmm from the sample taken that morning by the time you are ready to determine the density of the cores/plugs on the road.
8-12 2011 v1.0
The average percent density is then compared to the Minimum Control Strip Density listed in the Road and Bridge Specifications - Section 315.05(e)1. Table III-3
After taking the ten readings in the control strip, verifying the density with the cores/plugs, and establishing the target density, divide the rest of the project into Test Sections.
8-132011 v1.0
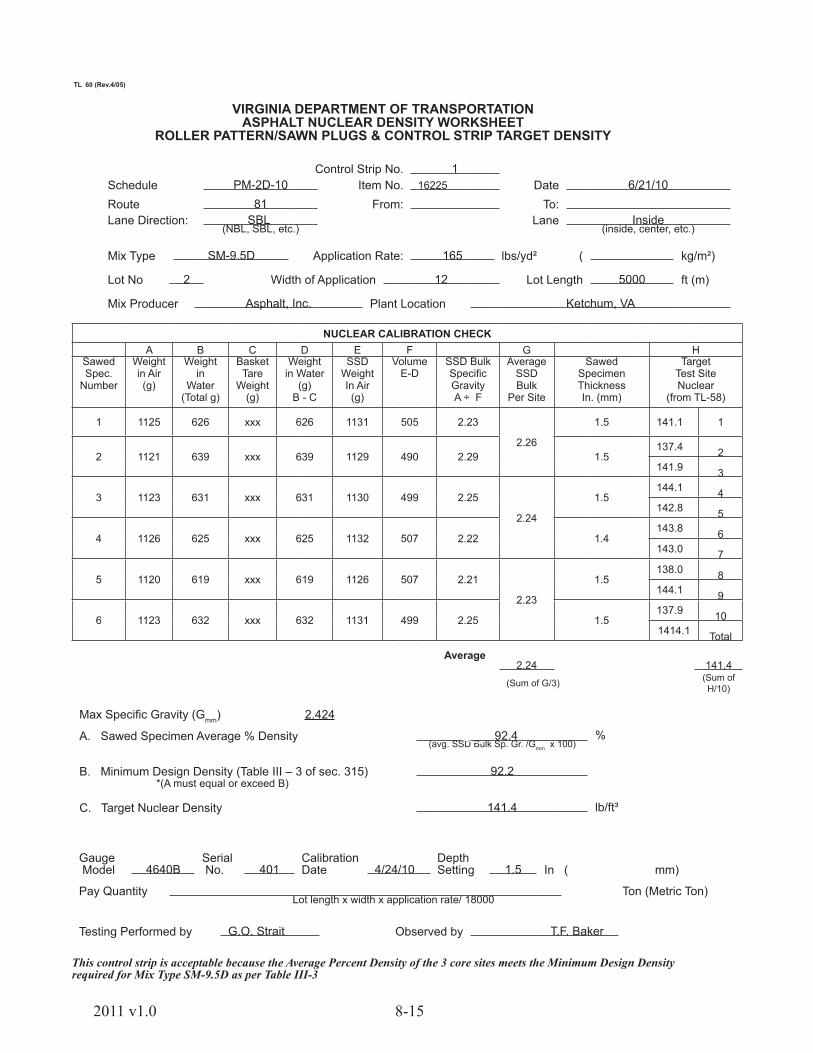
TL 60 (Rev.4/05)
VIRGINIA DEPARTMENT OF TRANSPORTATIONASPHALT NUCLEAR DENSITY WORKSHEET
ROLLER PATTERN/SAWN PLUGS & CONTROL STRIP TARGET DENSITY
Control Strip No. 1Schedule PM-2D-10 Item No. Date 6/21/10Route 81 From: 8.23 To: 16.25Lane Direction: Lane Inside
(inside, center, etc.)
Mix Type SM-9.5D Application Rate: 165 lbs/yd² ( kg/m²)
Lot No 1 Width of Application 12 Lot Length 5000 ft (m)
Mix Producer Asphalt, Inc. Plant Location Ketchum, VA
A. Sawed Specimen Average % Density 92.4 %(avg. SSD Bulk Sp. Gr. /Gmm x 100)
B. Minimum Design Density (Table III – 3 of sec. 315) 92.2 *(A must equal or exceed B)
C. Target Nuclear Density 141.4 lb/ft³
Gauge Model 4640B
Serial No. 401
Calibration Date 4/24/10
Depth Setting 1.5 In (
mm)
Pay Quantity Ton (Metric Ton)Lot length x width x application rate/ 18000
Testing Performed by G.O. Strait Observed by T.F. Baker
This control strip is acceptable because the Average Percent Density of the 3 core sites meets the Minimum Design Density required for Mix Type SM-9.5D as per Table III-3
8-16 2011 v1.0
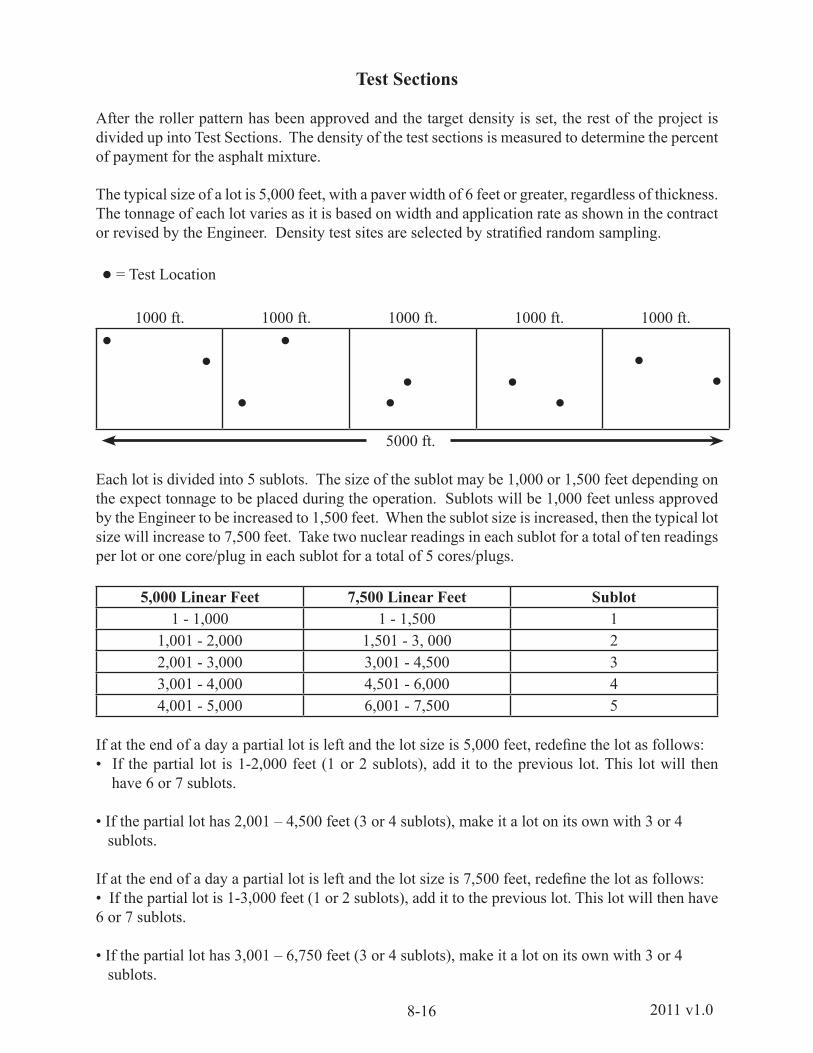
Test Sections
After the roller pattern has been approved and the target density is set, the rest of the project is divided up into Test Sections. The density of the test sections is measured to determine the percent of payment for the asphalt mixture. The typical size of a lot is 5,000 feet, with a paver width of 6 feet or greater, regardless of thickness. The tonnage of each lot varies as it is based on width and application rate as shown in the contract or revised by the Engineer. Density test sites are selected by stratified random sampling.
● = Test Location
1000 ft. 1000 ft. 1000 ft. 1000 ft. 1000 ft.● ●
●
● ● ●
● ●
● ●
5000 ft.
Each lot is divided into 5 sublots. The size of the sublot may be 1,000 or 1,500 feet depending on the expect tonnage to be placed during the operation. Sublots will be 1,000 feet unless approved by the Engineer to be increased to 1,500 feet. When the sublot size is increased, then the typical lot size will increase to 7,500 feet. Take two nuclear readings in each sublot for a total of ten readings per lot or one core/plug in each sublot for a total of 5 cores/plugs.
5,000 Linear Feet 7,500 Linear Feet Sublot1 - 1,000 1 - 1,500 1
If at the end of a day a partial lot is left and the lot size is 5,000 feet, redefine the lot as follows: • If the partial lot is 1-2,000 feet (1 or 2 sublots), add it to the previous lot. This lot will then have 6 or 7 sublots.
• If the partial lot has 2,001 – 4,500 feet (3 or 4 sublots), make it a lot on its own with 3 or 4 sublots.
If at the end of a day a partial lot is left and the lot size is 7,500 feet, redefine the lot as follows: • If the partial lot is 1-3,000 feet (1 or 2 sublots), add it to the previous lot. This lot will then have 6 or 7 sublots.
• If the partial lot has 3,001 – 6,750 feet (3 or 4 sublots), make it a lot on its own with 3 or 4 sublots.
8-172011 v1.0
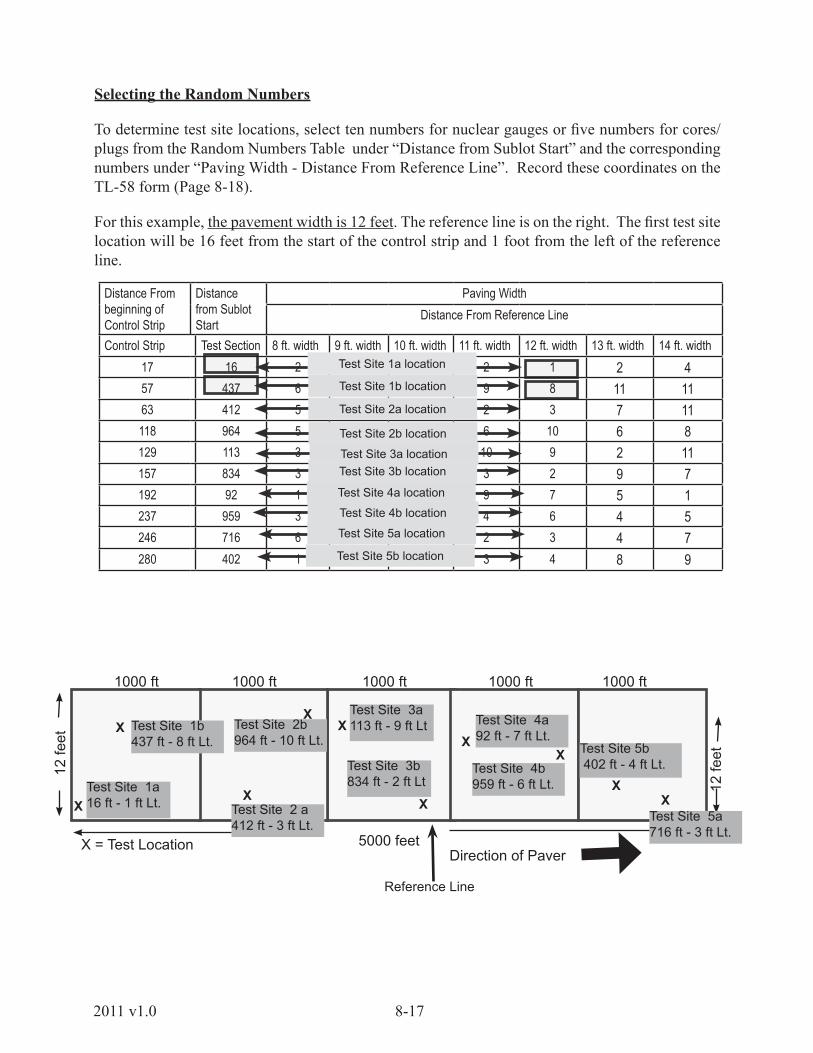
Selecting the Random Numbers
To determine test site locations, select ten numbers for nuclear gauges or five numbers for cores/plugs from the Random Numbers Table under “Distance from Sublot Start” and the corresponding numbers under “Paving Width - Distance From Reference Line”. Record these coordinates on the TL-58 form (Page 8-18).
For this example, the pavement width is 12 feet. The reference line is on the right. The first test site location will be 16 feet from the start of the control strip and 1 foot from the left of the reference line.
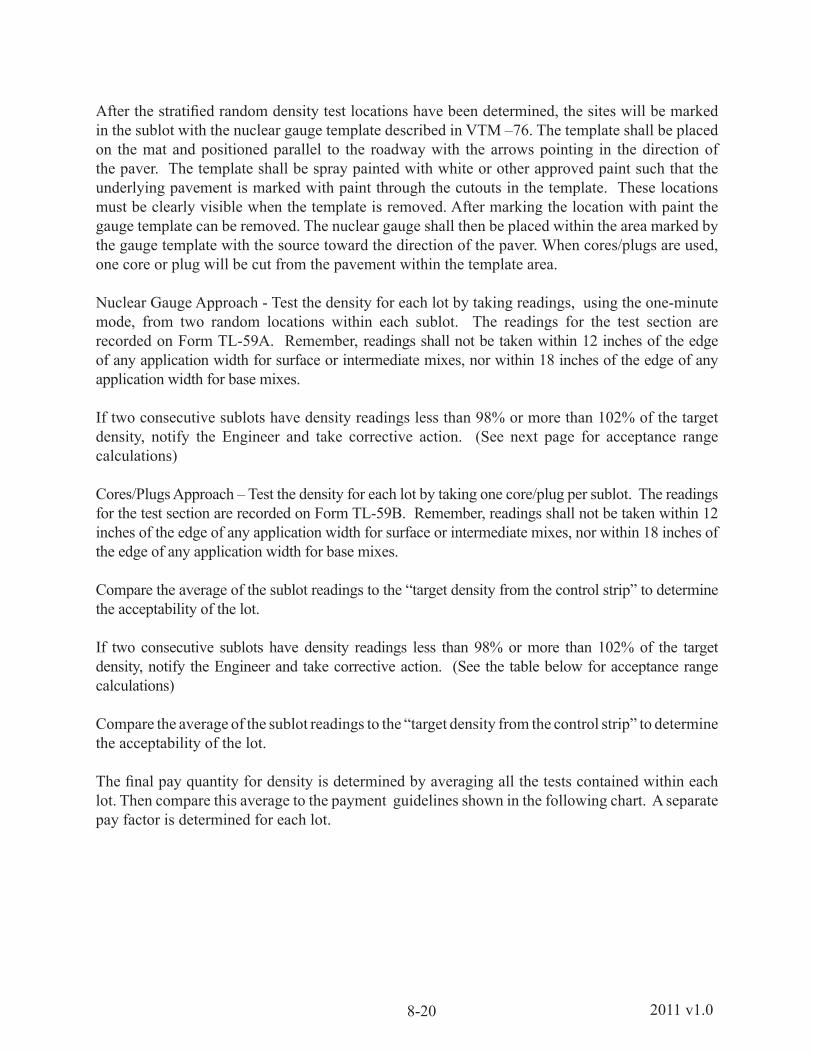
After the stratified random density test locations have been determined, the sites will be marked in the sublot with the nuclear gauge template described in VTM –76. The template shall be placed on the mat and positioned parallel to the roadway with the arrows pointing in the direction of the paver. The template shall be spray painted with white or other approved paint such that the underlying pavement is marked with paint through the cutouts in the template. These locations must be clearly visible when the template is removed. After marking the location with paint the gauge template can be removed. The nuclear gauge shall then be placed within the area marked by the gauge template with the source toward the direction of the paver. When cores/plugs are used, one core or plug will be cut from the pavement within the template area.
Nuclear Gauge Approach - Test the density for each lot by taking readings, using the one-minute mode, from two random locations within each sublot. The readings for the test section are recorded on Form TL-59A. Remember, readings shall not be taken within 12 inches of the edge of any application width for surface or intermediate mixes, nor within 18 inches of the edge of any application width for base mixes.
If two consecutive sublots have density readings less than 98% or more than 102% of the target density, notify the Engineer and take corrective action. (See next page for acceptance range calculations) Cores/Plugs Approach – Test the density for each lot by taking one core/plug per sublot. The readings for the test section are recorded on Form TL-59B. Remember, readings shall not be taken within 12 inches of the edge of any application width for surface or intermediate mixes, nor within 18 inches of the edge of any application width for base mixes.
Compare the average of the sublot readings to the “target density from the control strip” to determine the acceptability of the lot. If two consecutive sublots have density readings less than 98% or more than 102% of the target density, notify the Engineer and take corrective action. (See the table below for acceptance range calculations)
Compare the average of the sublot readings to the “target density from the control strip” to determine the acceptability of the lot. The final pay quantity for density is determined by averaging all the tests contained within each lot. Then compare this average to the payment guidelines shown in the following chart. A separate pay factor is determined for each lot.
8-212011 v1.0
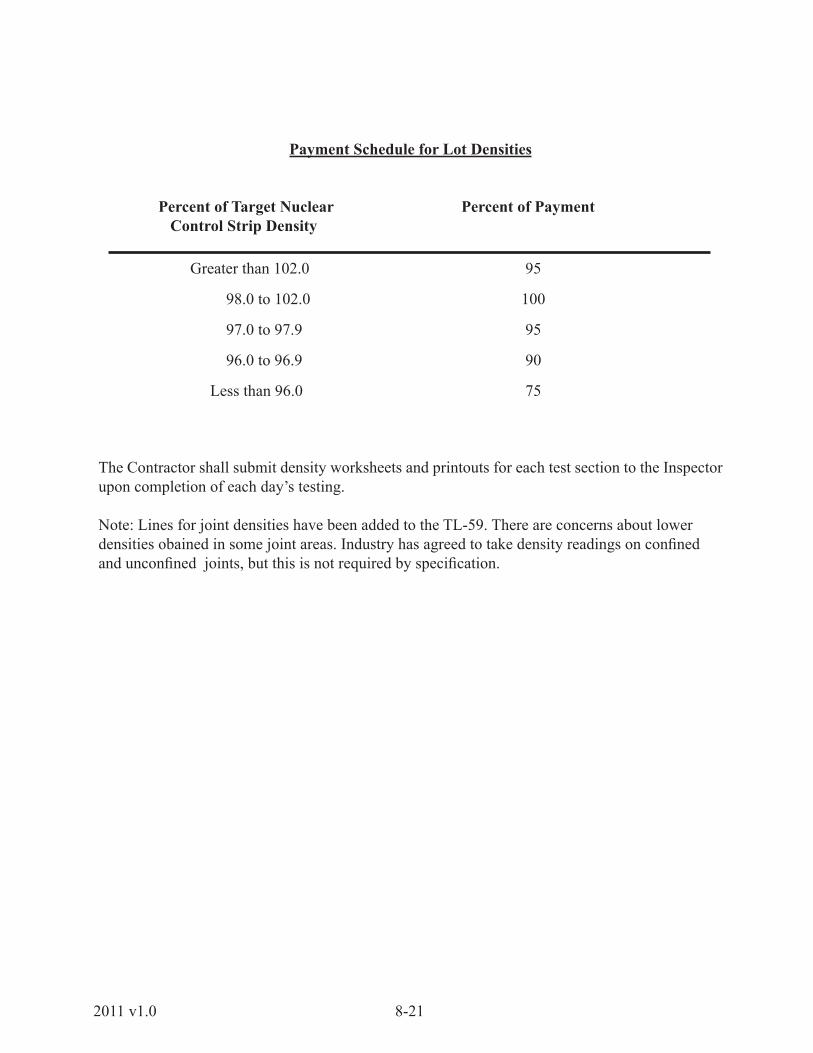
Payment Schedule for Lot Densities
Percent of Target Nuclear Percent of Payment Control Strip Density
Greater than 102.0 95
98.0 to 102.0 100
97.0 to 97.9 95
96.0 to 96.9 90
Less than 96.0 75
The Contractor shall submit density worksheets and printouts for each test section to the Inspector upon completion of each day’s testing.
Note: Lines for joint densities have been added to the TL-59. There are concerns about lower densities obained in some joint areas. Industry has agreed to take density readings on confined and unconfined joints, but this is not required by specification.
8-22 2011 v1.0
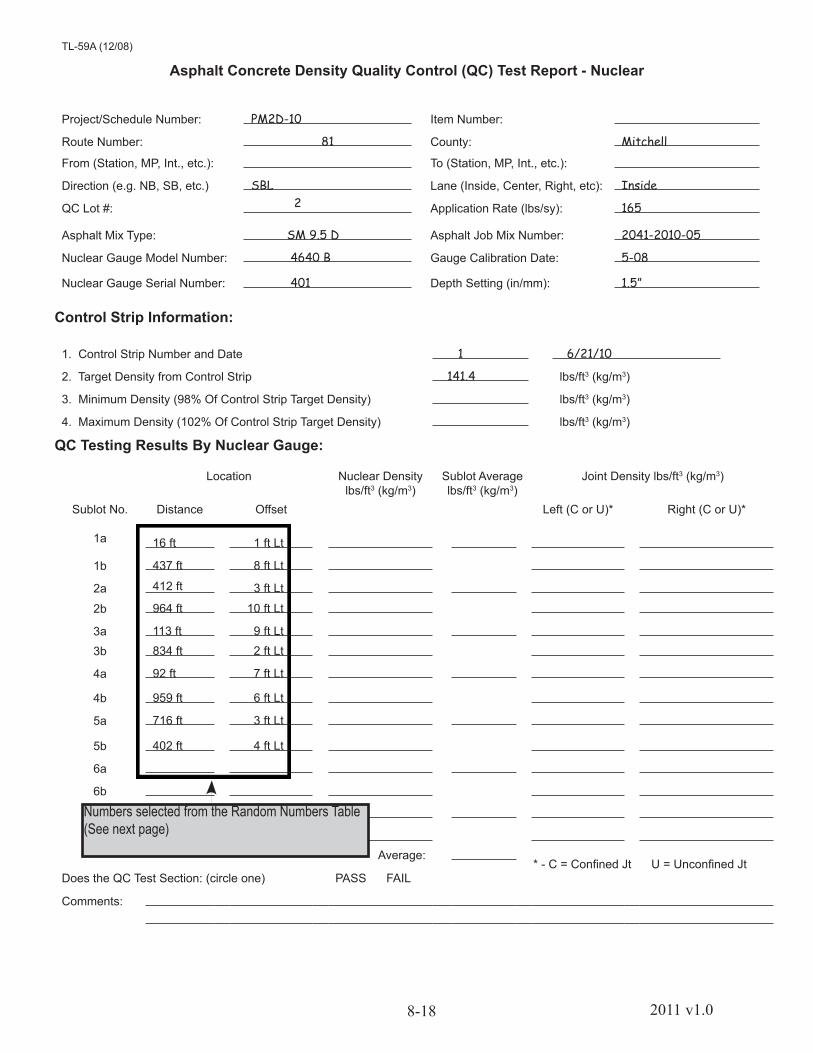
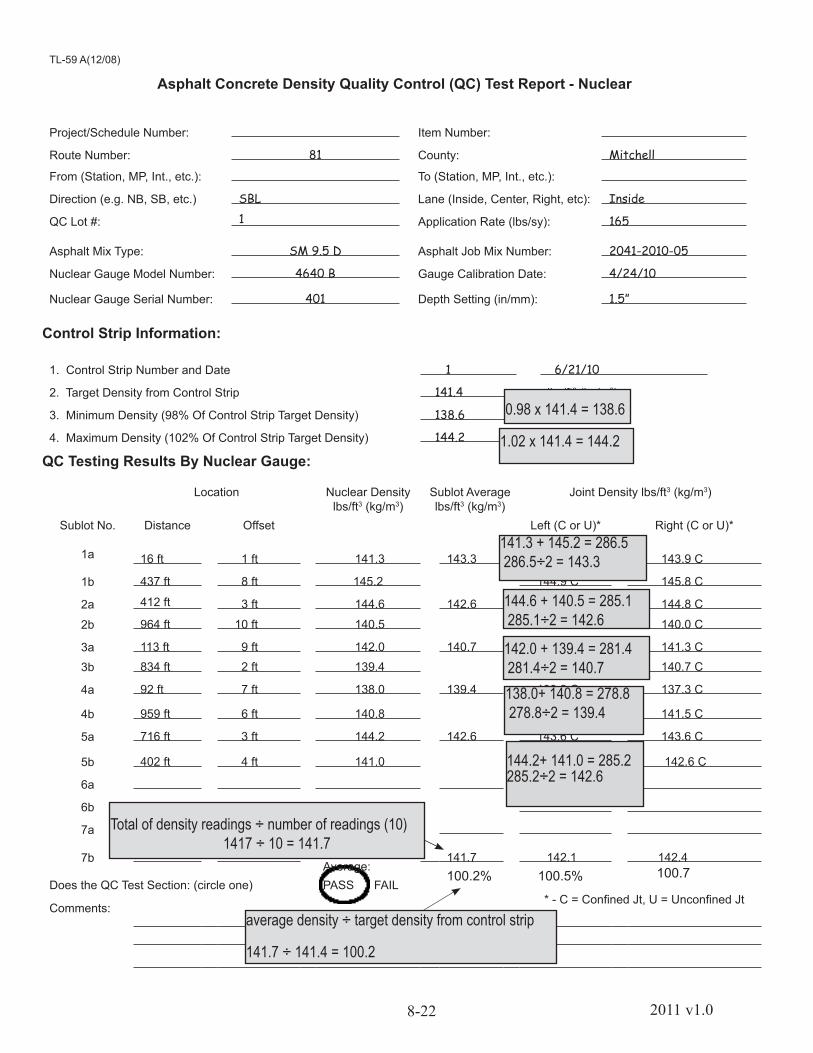
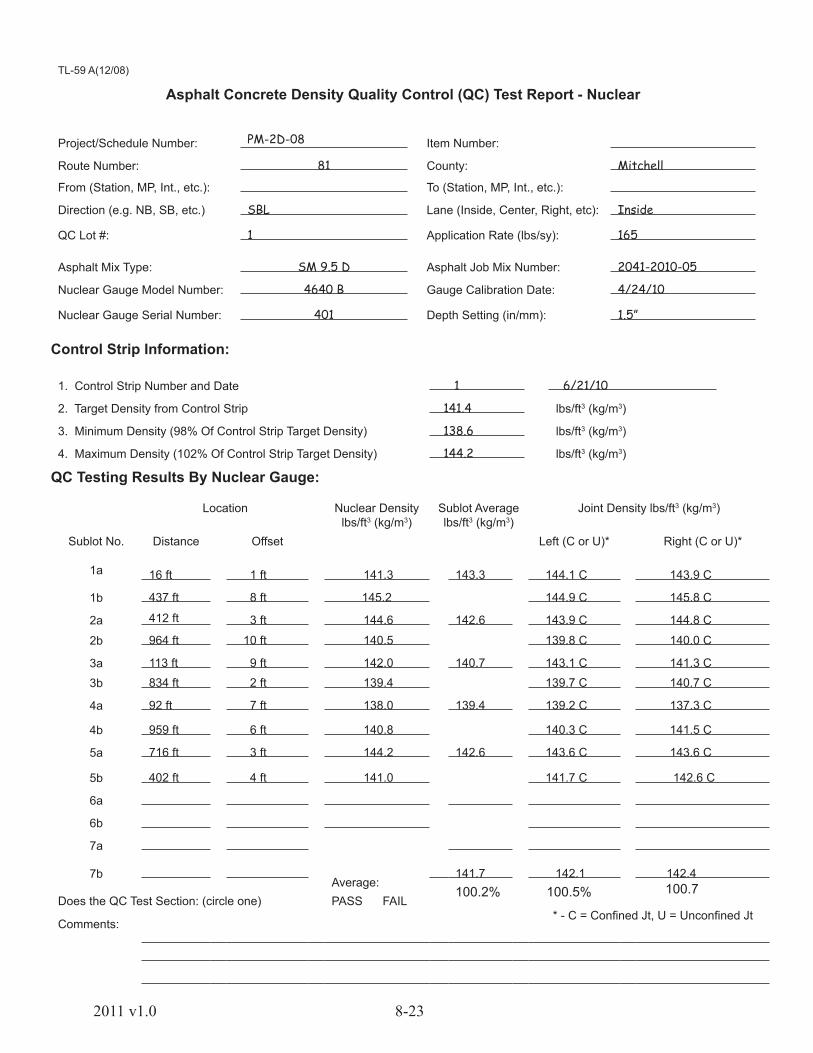
TL-59 A(12/08)
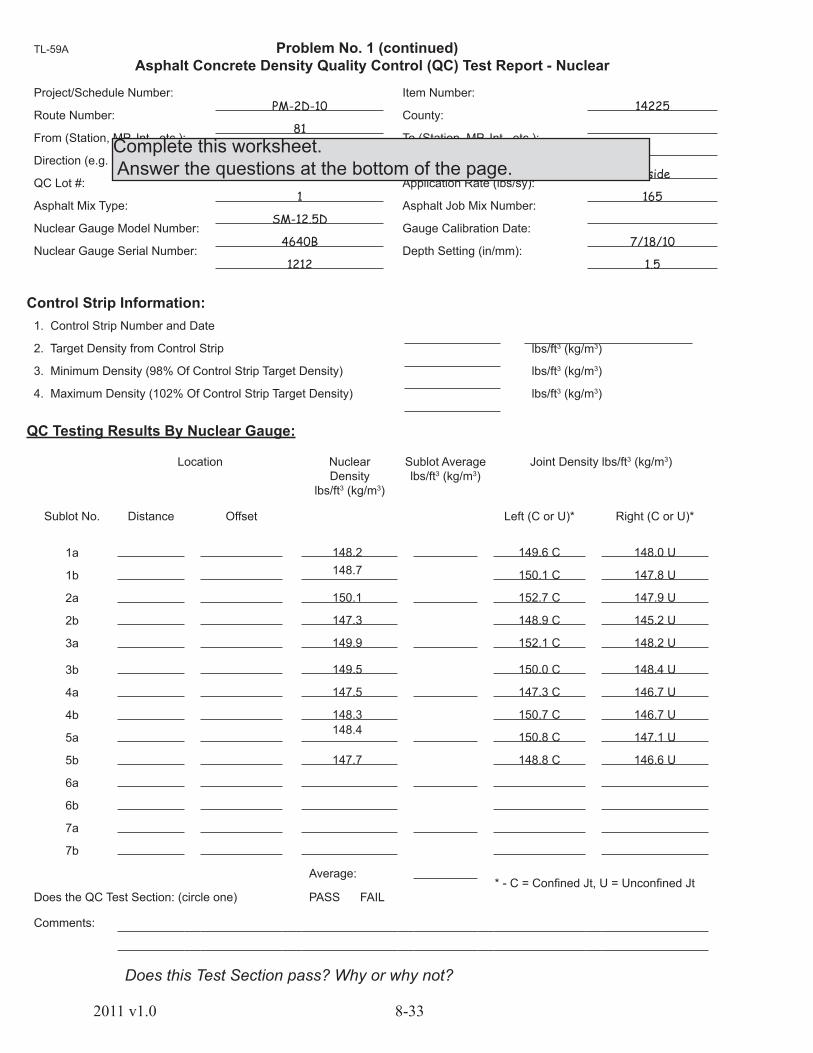
Asphalt Concrete Density Quality Control (QC) Test Report - Nuclear
Project/Schedule Number: Item Number:
Route Number: 81 County: Mitchell
From (Station, MP, Int., etc.): To (Station, MP, Int., etc.):
Direction (e.g. NB, SB, etc.) SBL Lane (Inside, Center, Right, etc): Inside
QC Lot #: 1 Application Rate (lbs/sy): 165
Asphalt Mix Type: SM 9.5 D Asphalt Job Mix Number: 2041-2010-05
Nuclear Gauge Model Number: 4640 B Gauge Calibration Date: 4/24/10
Nuclear Gauge Serial Number: 401 Depth Setting (in/mm): 1.5”
Control Strip Information:
1. Control Strip Number and Date 1 6/21/10
2. Target Density from Control Strip 141.4 lbs/ft3 (kg/m3)
3. Minimum Density (98% Of Control Strip Target Density) 138.6 lbs/ft3 (kg/m3)
4. Maximum Density (102% Of Control Strip Target Density) 144.2 lbs/ft3 (kg/m3)
QC Testing Results By Nuclear Gauge:
Location Nuclear Densitylbs/ft3 (kg/m3)
Sublot Averagelbs/ft3 (kg/m3)
Joint Density lbs/ft3 (kg/m3)
Sublot No. Distance Offset Left (C or U)* Right (C or U)*
1a 16 ft 1 ft 141.3 143.3 144.1 C 143.9 C
1b 437 ft 8 ft 145.2 144.9 C 145.8 C
2a 412 ft 3 ft 144.6 142.6 143.9 C 144.8 C
2b 964 ft 10 ft 140.5 139.8 C 140.0 C
3a 113 ft 9 ft 142.0 140.7 143.1 C 141.3 C
3b 834 ft 2 ft 139.4 139.7 C 140.7 C
4a 92 ft 7 ft 138.0 139.4 139.2 C 137.3 C
4b 959 ft 6 ft 140.8 140.3 C 141.5 C
5a 716 ft 3 ft 144.2 142.6 143.6 C 143.6 C
5b 402 ft 4 ft 141.0 141.7 C 142.6 C
6a
6b
7a
7b 141.7 142.1 142.4 Average:
100.2% 100.5% 100.7Does the QC Test Section: (circle one) PASS FAIL
* - C = Confined Jt, U = Unconfined JtComments:
141.3 + 145.2 = 286.5 286.5÷2 = 143.3
142.0 + 139.4 = 281.4 281.4÷2 = 140.7
144.6 + 140.5 = 285.1 285.1÷2 = 142.6
144.2+ 141.0 = 285.2285.2÷2 = 142.6
138.0+ 140.8 = 278.8 278.8÷2 = 139.4
0.98 x 141.4 = 138.6
1.02 x 141.4 = 144.2
Total of density readings ÷ number of readings (10) 1417 ÷ 10 = 141.7
average density ÷ target density from control strip
141.7 ÷ 141.4 = 100.2
8-232011 v1.0
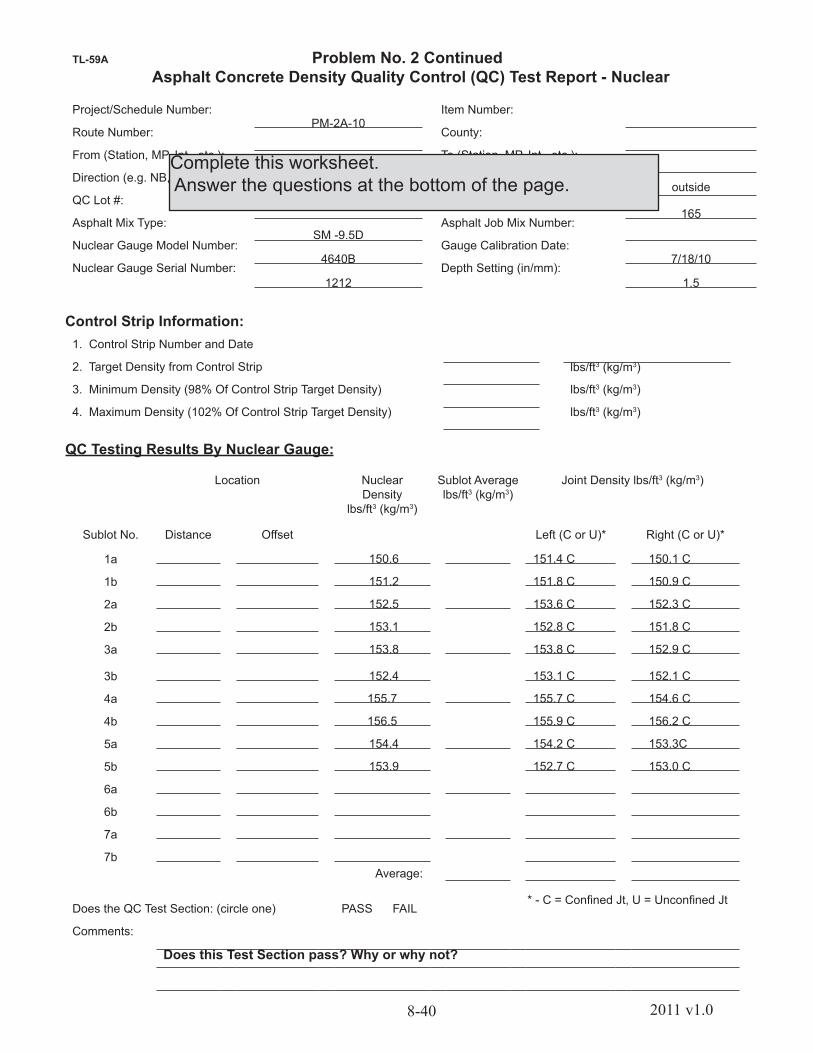
TL-59 A(12/08)
Asphalt Concrete Density Quality Control (QC) Test Report - Nuclear
Project/Schedule Number: PM-2D-08 Item Number:
Route Number: 81 County: Mitchell
From (Station, MP, Int., etc.): To (Station, MP, Int., etc.):
Direction (e.g. NB, SB, etc.) SBL Lane (Inside, Center, Right, etc): Inside
QC Lot #: 1 Application Rate (lbs/sy): 165
Asphalt Mix Type: SM 9.5 D Asphalt Job Mix Number: 2041-2010-05
Nuclear Gauge Model Number: 4640 B Gauge Calibration Date: 4/24/10
Nuclear Gauge Serial Number: 401 Depth Setting (in/mm): 1.5”
Control Strip Information:
1. Control Strip Number and Date 1 6/21/10
2. Target Density from Control Strip 141.4 lbs/ft3 (kg/m3)
3. Minimum Density (98% Of Control Strip Target Density) 138.6 lbs/ft3 (kg/m3)
4. Maximum Density (102% Of Control Strip Target Density) 144.2 lbs/ft3 (kg/m3)
QC Testing Results By Nuclear Gauge:
Location Nuclear Densitylbs/ft3 (kg/m3)
Sublot Averagelbs/ft3 (kg/m3)
Joint Density lbs/ft3 (kg/m3)
Sublot No. Distance Offset Left (C or U)* Right (C or U)*
1a 16 ft 1 ft 141.3 143.3 144.1 C 143.9 C
1b 437 ft 8 ft 145.2 144.9 C 145.8 C
2a 412 ft 3 ft 144.6 142.6 143.9 C 144.8 C
2b 964 ft 10 ft 140.5 139.8 C 140.0 C
3a 113 ft 9 ft 142.0 140.7 143.1 C 141.3 C
3b 834 ft 2 ft 139.4 139.7 C 140.7 C
4a 92 ft 7 ft 138.0 139.4 139.2 C 137.3 C
4b 959 ft 6 ft 140.8 140.3 C 141.5 C
5a 716 ft 3 ft 144.2 142.6 143.6 C 143.6 C
5b 402 ft 4 ft 141.0 141.7 C 142.6 C
6a
6b
7a
7b 141.7 142.1 142.4 Average:
100.2% 100.5% 100.7Does the QC Test Section: (circle one) PASS FAIL
* - C = Confined Jt, U = Unconfined JtComments:
8-24 2011 v1.0
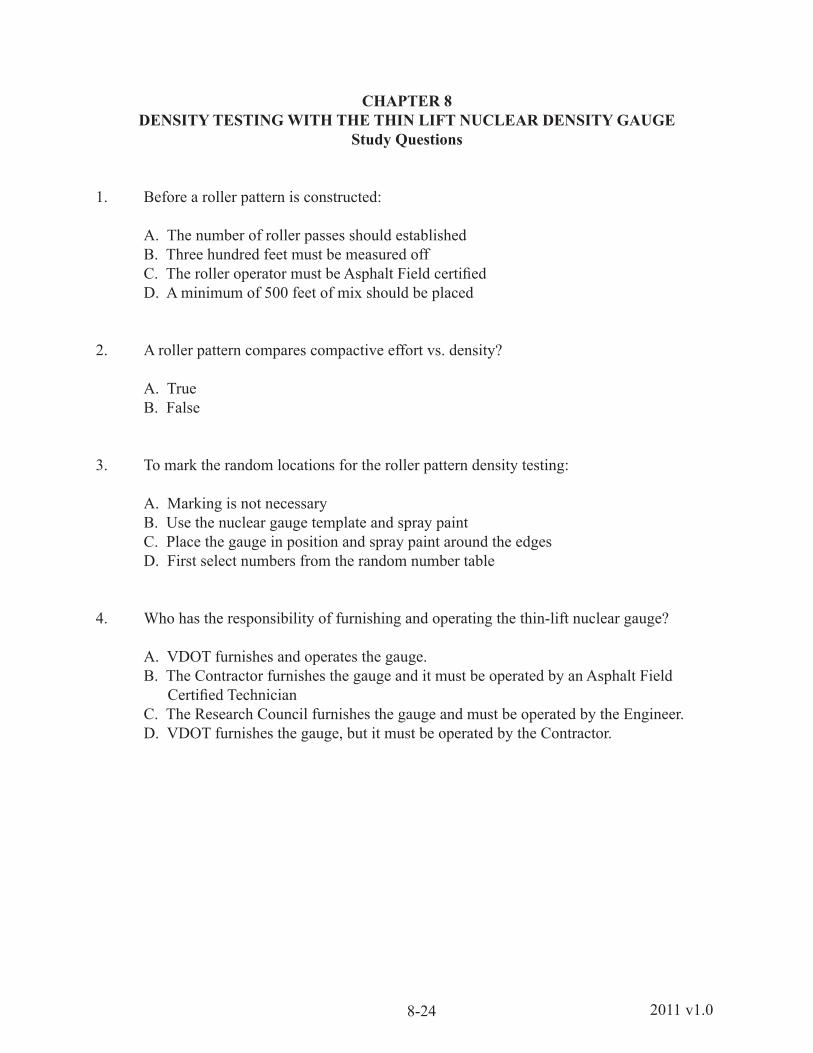
CHAPTER 8DENSITY TESTING WITH THE THIN LIFT NUCLEAR DENSITY GAUGE
Study Questions
1. Before a roller pattern is constructed: A. The number of roller passes should established B. Three hundred feet must be measured off C. The roller operator must be Asphalt Field certified D. A minimum of 500 feet of mix should be placed
2. A roller pattern compares compactive effort vs. density? A. True B. False
3. To mark the random locations for the roller pattern density testing: A. Marking is not necessary B. Use the nuclear gauge template and spray paint C. Place the gauge in position and spray paint around the edges D. First select numbers from the random number table
4. Who has the responsibility of furnishing and operating the thin-lift nuclear gauge? A. VDOT furnishes and operates the gauge. B. The Contractor furnishes the gauge and it must be operated by an Asphalt Field Certified Technician C. The Research Council furnishes the gauge and must be operated by the Engineer. D. VDOT furnishes the gauge, but it must be operated by the Contractor.
8-252011 v1.0
CHAPTER 8DENSITY TESTING WITH THE THIN LIFT NUCLEAR DENSITY GAUGE
Study Questions
5. What determines whether the control strip passes? A. The average of the ten readings in the control strip meets or exceeds the minimum density requirement B. The average of 6 plugs/cores meets or exceeds the minimum density requirement C. One plug/core meets or exceeds the minimum density requirement D. The average of the ten readings in the control strip is between 98% and 102% of the job-mix density
6. Readings for the ten locations selected in the control strip are to be taken with the thin-lift nuclear gauge in the:
A. 15 second mode B. 30 second mode C. 1 minute mode D. 2 minute mode
7. The density value to be entered in the thin lift gauge for the test sections must come from:
A. The average of 10 readings in the control strip B. The average density of 3 plugs/cores from the control strip C. 92.5% of maximum theoretical density from the job mix D. The maximum density obtained in the roller pattern
8. How should the stratified reading locations be selected to determine the target nuclear control strip density? A. Daily B. Visually C. Professionally D. Randomly
8-26 2011 v1.0
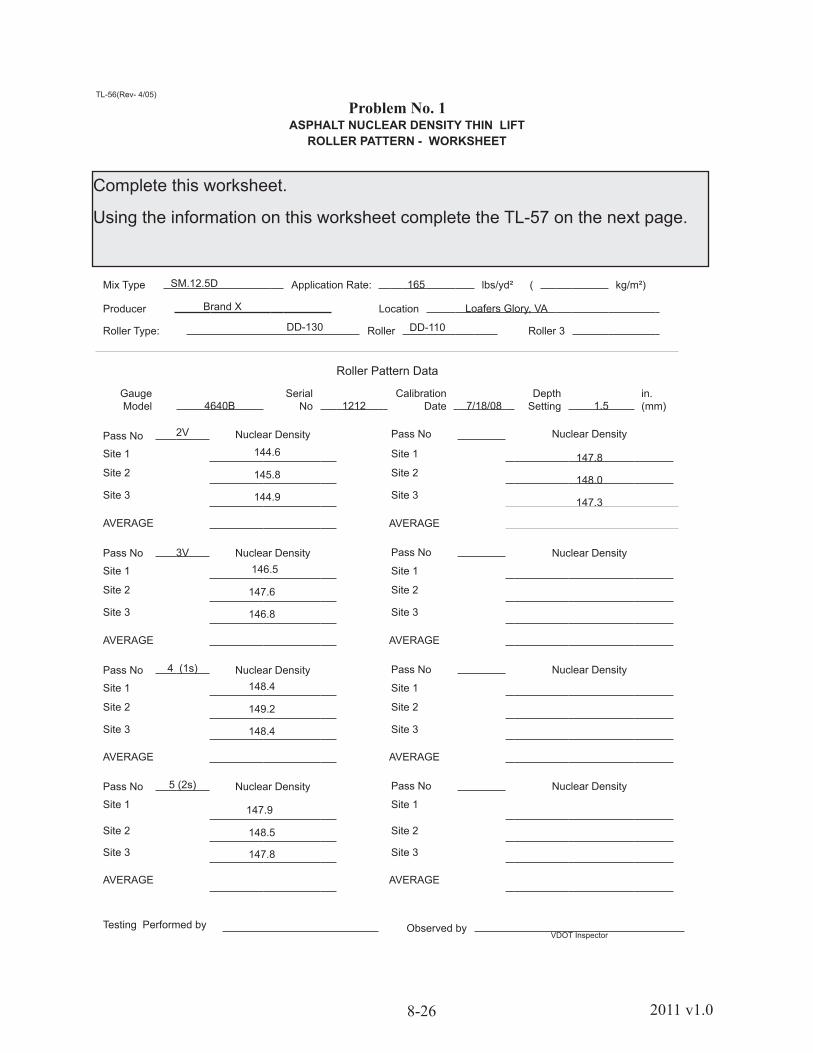
TL-56(Rev- 4/05)
Problem No. 1
ASPHALT NUCLEAR DENSITY THIN LIFTROLLER PATTERN - WORKSHEET
Control Strip No 1
Project or Schedule Item No. Date 9/15/08
Route From To 37
Directional Lane Lane Inside(NBL, SBL, etc.) NBL (inside, center, etc.)
Mix Type SM.12.5D Application Rate: 165 lbs/yd² ( kg/m²)
Producer Brand X Location Loafers Glory, VA
Roller Type: DD-130 Roller DD-110 Roller 3
Roller Pattern Data
Gauge Model 4640B
Serial No 1212
Calibration Date 7/18/08
Depth Setting 1.5
in. (mm)
Pass No 2V Nuclear Density Pass No Nuclear Density
Site 1 144.6 Site 1 147.8Site 2 145.8 Site 2
148.0Site 3 144.9 Site 3
147.3
AVERAGE
AVERAGE
Pass No 3V Nuclear Density Pass No Nuclear Density
Site 1 146.5 Site 1
Site 2 147.6 Site 2
Site 3 146.8 Site 3
AVERAGE
AVERAGE
Pass No 4 (1s) Nuclear Density Pass No
Nuclear Density
Site 1 148.4 Site 1
Site 2 149.2 Site 2
Site 3 148.4 Site 3
AVERAGE
AVERAGE
Pass No 5 (2s) Nuclear Density Pass No
Nuclear Density
Site 1 147.9 Site 1
Site 2 148.5 Site 2
Site 3 147.8 Site 3
AVERAGE
AVERAGE
Testing Performed by Observed by
VDOT Inspector
Complete this worksheet.
Using the information on this worksheet complete the TL-57 on the next page.
8-272011 v1.0
TL-57 (Rev. 4/05)
Problem No. 1 (continued)ASPHALT NUCLEAR DENSITY THIN LIFT
ROLLER PATTERN -GRAPH
Control Strip No 1
Project or Schedule PM-2D-05 Item No Date 9/15/08
Route 72 From To 37
Directional Lane NBL Lane Inside(NBL, SBL, etc) (Inside, Center, etc.)
Mix Type SM-12.5D Application Rate 165 lbs/yd² ( kg/m²)
Producer Brand X LocationLLoafers Glory, VA
Gauge Model 4640B
SerialNo 1212
Calibration Date 7/18/10
DepthSetting 1.5 in. (mm)
DENSITY lbs/ft3 (kg/m3)
NUMBER OF ROLLER PASSES
Optimum Density lbs/ft³ (kg/m³)(from peak of roller pattern curve)
Optimum Number of Passes:
Number of Roller Passes Roller 1 V Roller 2 S Roller 3
Testing Performed By Observed ByVDOT Inspector
Why did you select this for optimum (maximum) density?
After completing this worksheet, answer the question at the bottom of the page.
8-28 2011 v1.0
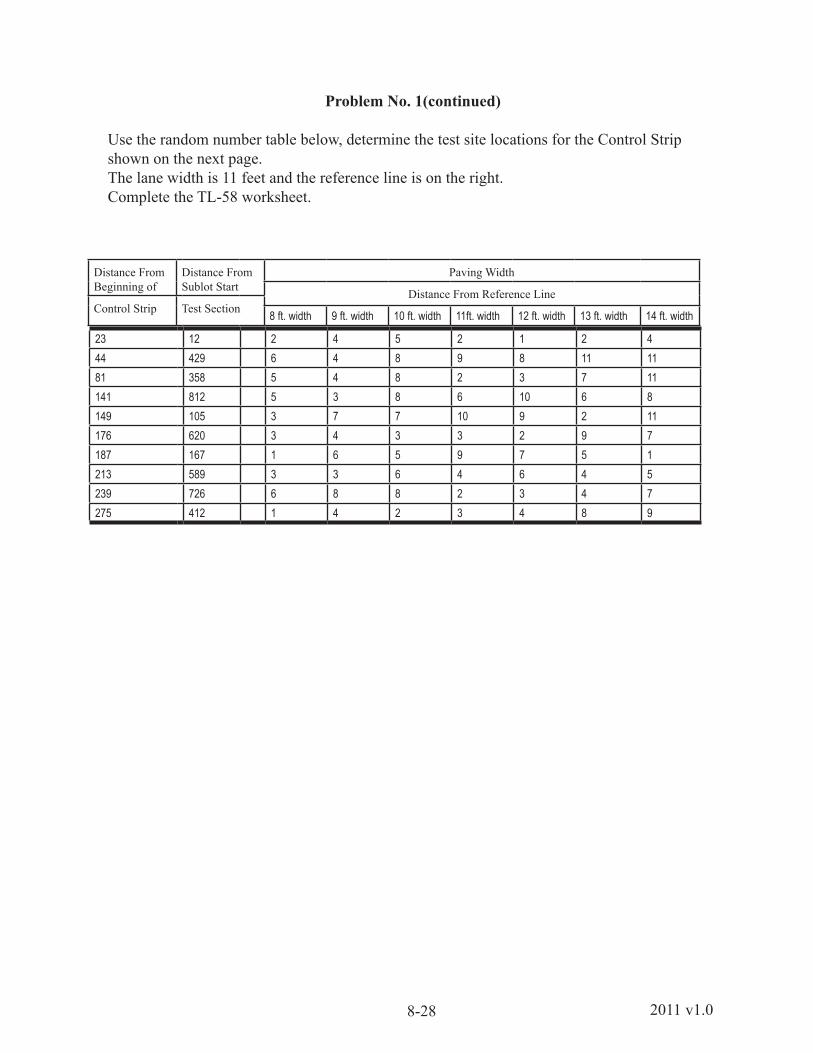
Distance From Beginning of
Distance From Sublot Start
Paving Width
Distance From Reference LineControl Strip Test Section 8 ft. width 9 ft. width 10 ft. width 11ft. width 12 ft. width 13 ft. width 14 ft. width
Use the random number table below, determine the test site locations for the Control Strip shown on the next page. The lane width is 11 feet and the reference line is on the right. Complete the TL-58 worksheet.
8-292011 v1.0
TL-58 (Rev. 4/05)
Problem No.1 (continued) VIRGINIA DEPARTMENT OF TRANSPORTATION
ASPHALT NUCLEAR DENSITY THIN LIFT WORKSHEETCONTROL STRIP TARGET DENSITY
Control Strip Number 1Project or Schedule PM-2D-10 Item Number Date 9/15/10Route 81 From ToDirectional Lane NBL Lane Inside
Mix Type SM-12.5D(NBL, SBL, etc)
Application Rate 165 lbs/yd²(Inside, Center, etc.)( kg/m²)
Problem No. 1 (continued) VIRGINIA DEPARTMENT OF TRANSPORTATION
ASPHALT NUCLEAR DENSITY WORKSHEETROLLER PATTERN/SAWN PLUGS & CONTROL STRIP TARGET DENSITY
Control Strip No. 1Schedule PM-2D-05 Item No. Date 9/15/10Route 81 From: To:Lane Direction: NBL Lane Inside
(NBL, SBL, etc.) (inside, center, etc.)
Mix Type SM -12.5D Application Rate: 165 lbs/yd² ( kg/m²)
Lot No 1 Width of Application 11 Lot Length 5000 ft (m)
Mix Producer Brand X Plant Location Loafers Glory, VA
NUCLEAR CALIBRATION CHECK
A B C D E F G HSawedSpec.
Number
Weightin Air(g)
Weightin
Water(Total
g)
BasketTare
Weight
Weight in Water
(g)B - C
SSDWeightIn Air(g)
VolumeE-D
SSD Bulk
SpecificGravityA ÷ F
AverageSSDBulk
Per Site
SawedSpecimenThicknessIn. (mm)
TargetTest SiteNuclear
(from TL-58)
1 1215 730 xxx 730 1224 1.5 1
2 1218 732 xxx 732 1227 1.5 2
3
3 1223 734 xxx 734 1232 1.6 4
5
4 1220 728 xxx 728 1228 1.6 6
7
5 1210 728 xxx 728 1222 1.5 8
9
6 1214 729 xxx 729 1225 1.5 10
TotalAverage
(Sum of G/3) (Sum ofH/10)
Max Specific Gravity (GMM) 2.644
A. Sawed Specimen Average % Density %(avg. SSD Bulk Sp. Gr. /GMM x 100)
B. Minimum Design Density (Table III – 3 of sec. 315) %*(A must equal or exceed B)
C. Target Nuclear Density lb/ft³
Gauge Model 4640B
Serial No. 1212
Calibration Date 7/18/10
Depth Setting 1.5 In (
mm)
Pay Quantity Ton (Metric Ton)Lot length x width x application rate/ 18000
Testing Performed by Observed by
What three sites would you core? Is this control strip acceptable? Why or why not?
Complete this worksheet. Answer the questions at the bottom of the page.
8-312011 v1.0
This page intentionally left blank.
8-32 2011 v1.0
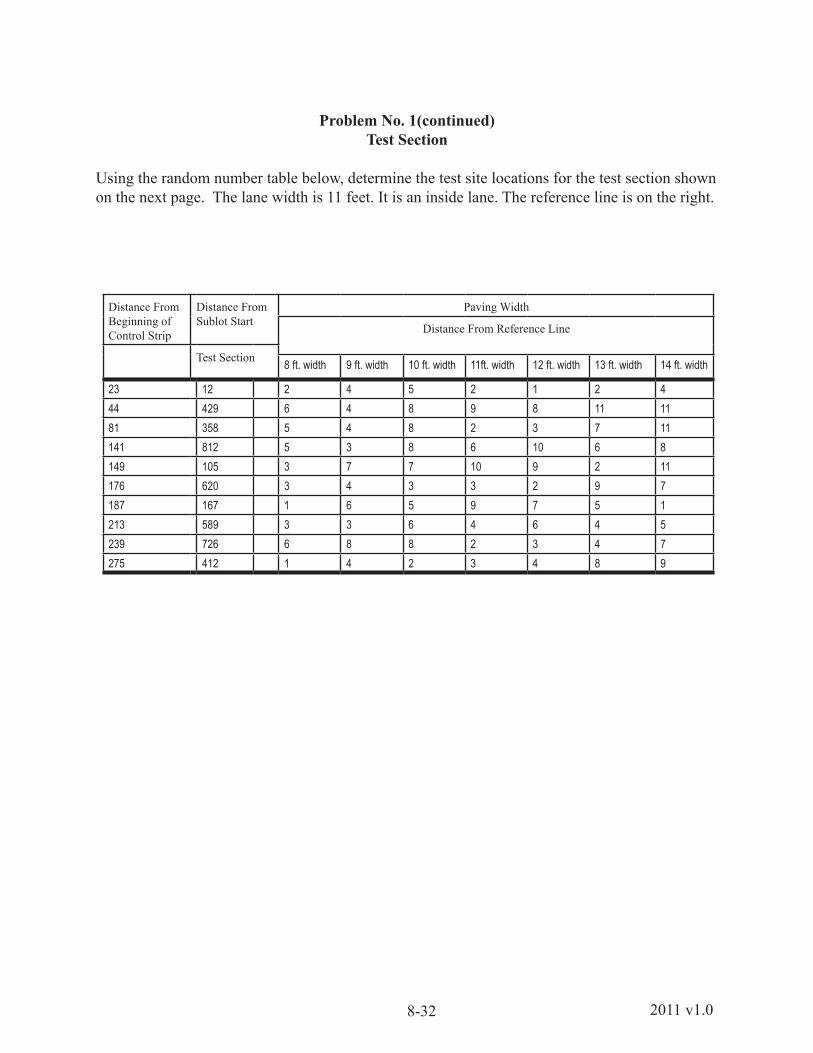
Problem No. 1(continued)Test Section
Using the random number table below, determine the test site locations for the test section shown on the next page. The lane width is 11 feet. It is an inside lane. The reference line is on the right.
Distance From Beginning of Control Strip
Distance From Sublot Start
Paving Width
Distance From Reference Line
Test Section 8 ft. width 9 ft. width 10 ft. width 11ft. width 12 ft. width 13 ft. width 14 ft. width
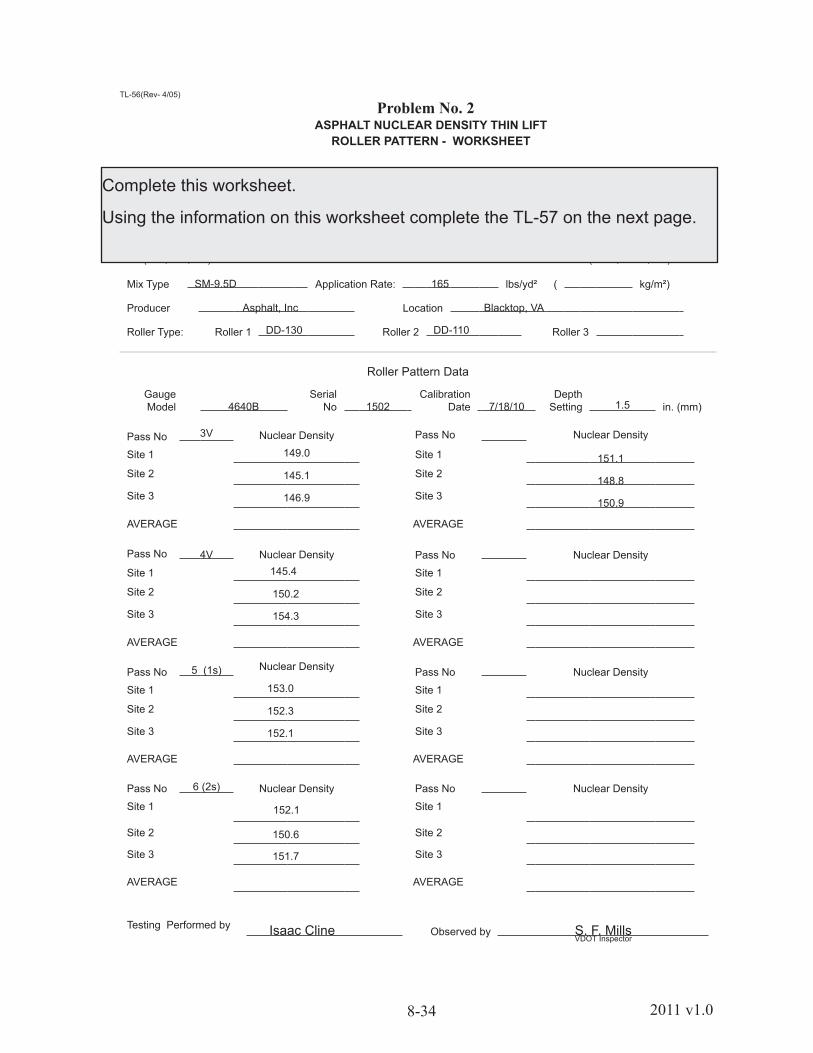
Pass No 3V Nuclear Density Pass No Nuclear Density
Site 1 149.0 Site 1 151.1Site 2 145.1 Site 2
148.8Site 3 146.9 Site 3
150.9
AVERAGE
AVERAGE
Pass No 4V Nuclear Density Pass No Nuclear Density
Site 1 145.4 Site 1
Site 2 150.2 Site 2
Site 3 154.3 Site 3
AVERAGE
AVERAGE
Pass No 5 (1s) Nuclear Density Pass No Nuclear Density
Site 1 153.0 Site 1
Site 2 152.3 Site 2
Site 3 152.1 Site 3
AVERAGE
AVERAGE
Pass No 6 (2s) Nuclear Density Pass No Nuclear Density
Site 1 152.1 Site 1
Site 2 150.6 Site 2
Site 3 151.7 Site 3
AVERAGE
AVERAGE
Testing Performed by
Isaac Cline Observed by S. F. MillsVDOT Inspector
Complete this worksheet.
Using the information on this worksheet complete the TL-57 on the next page.
8-352011 v1.0
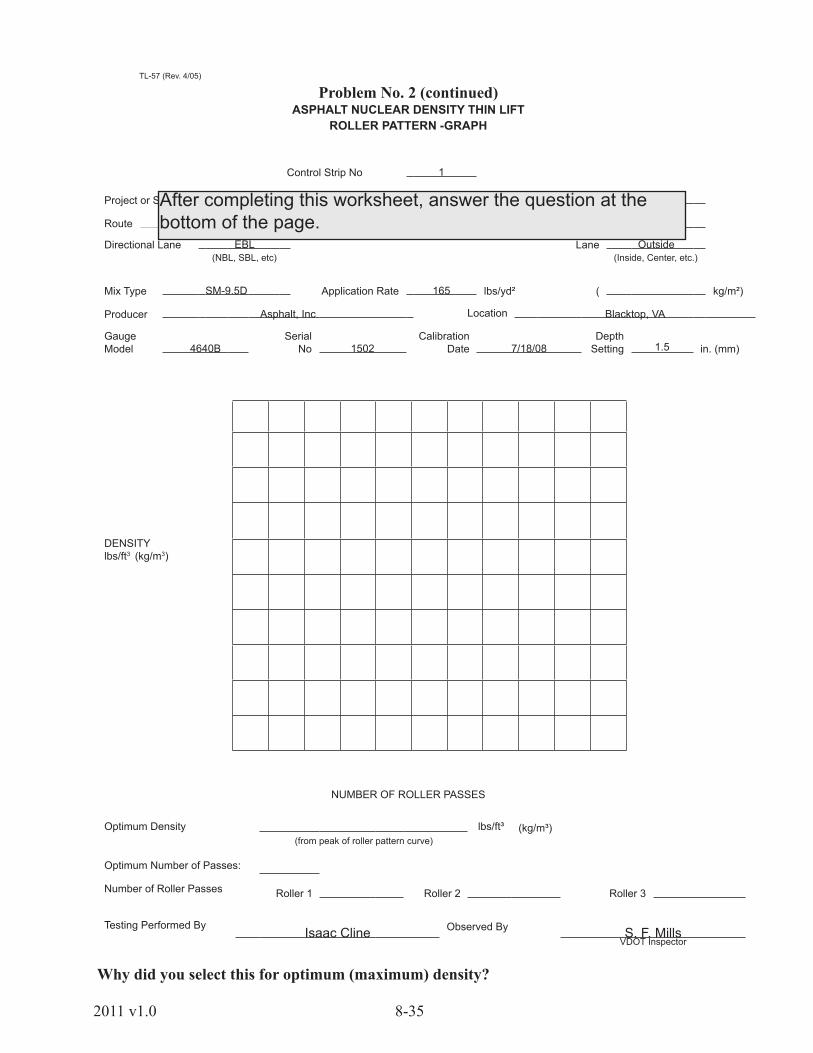
TL-57 (Rev. 4/05)
Problem No. 2 (continued)ASPHALT NUCLEAR DENSITY THIN LIFT
ROLLER PATTERN -GRAPH
Control Strip No 1
Project or Schedule Item No Date 8/21/08
Route 28 From To 16.25
Directional Lane EBL Lane Outside(NBL, SBL, etc) (Inside, Center, etc.)
Mix Type SM-9.5D Application Rate 165 lbs/yd² ( kg/m²)
Producer Asphalt, Inc Location Blacktop, VA
Gauge Model 4640B
SerialNo 1502
Calibration Date 7/18/08
DepthSetting 1.5 in. (mm)
DENSITY lbs/ft3 (kg/m3)
NUMBER OF ROLLER PASSES
Optimum Density lbs/ft³ (kg/m³)(from peak of roller pattern curve)
Optimum Number of Passes:
Number of Roller Passes Roller 1 Roller 2 Roller 3
Testing Performed By Isaac Cline Observed By S. F. MillsVDOT Inspector
Why did you select this for optimum (maximum) density?
After completing this worksheet, answer the question at the bottom of the page.
8-36 2011 v1.0
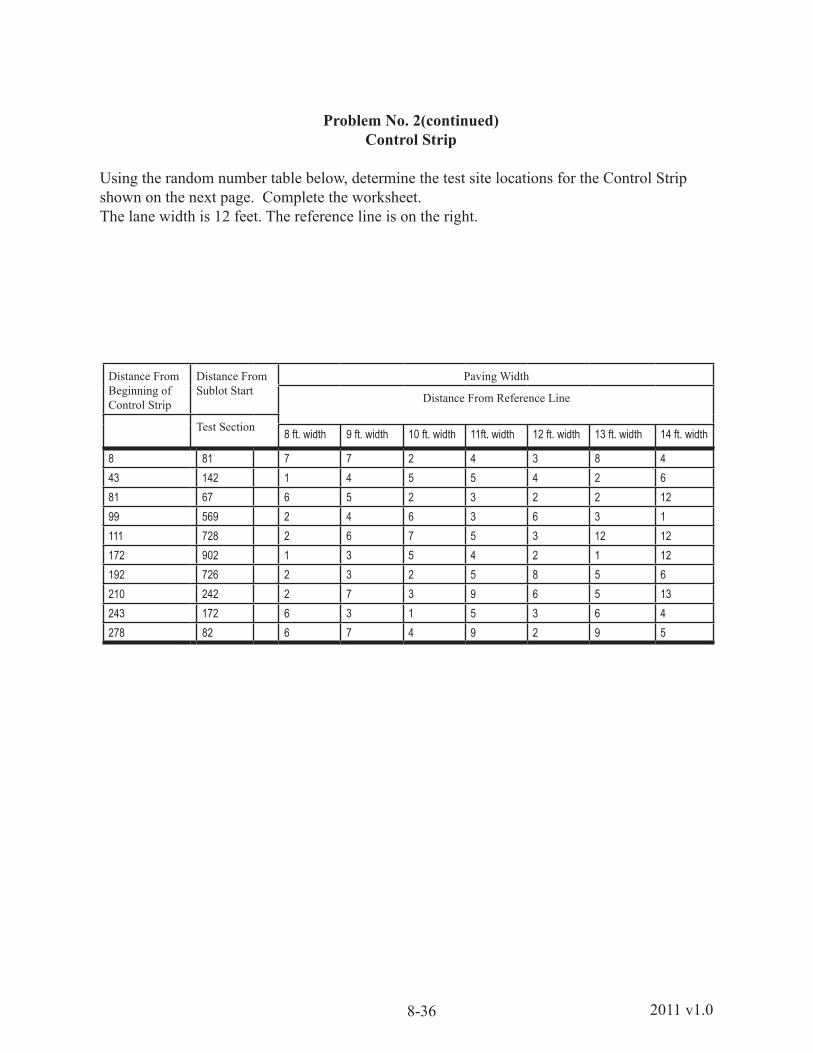
Problem No. 2(continued)Control Strip
Using the random number table below, determine the test site locations for the Control Strip shown on the next page. Complete the worksheet. The lane width is 12 feet. The reference line is on the right.
Distance From Beginning of Control Strip
Distance From Sublot Start
Paving Width
Distance From Reference Line
Test Section 8 ft. width 9 ft. width 10 ft. width 11ft. width 12 ft. width 13 ft. width 14 ft. width
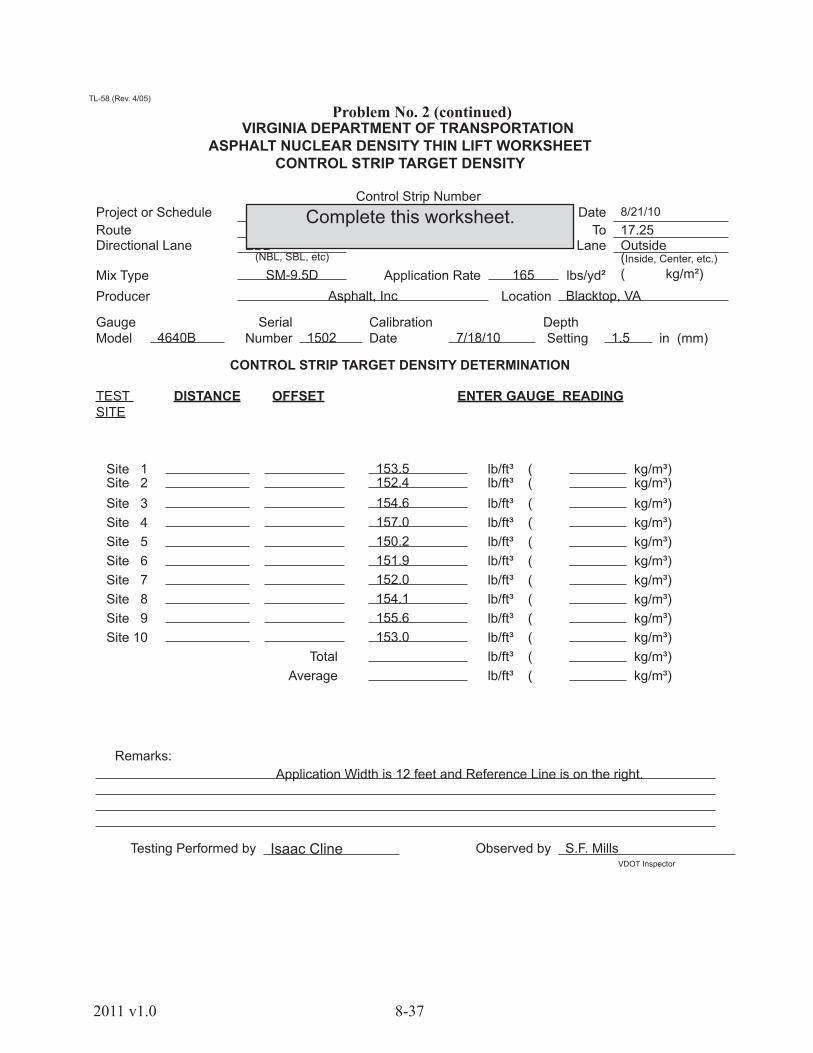
Remarks: Application Width is 12 feet and Reference Line is on the right.
Testing Performed by Isaac Cline Observed by S.F. MillsVDOT Inspector
Complete this worksheet.
8-38 2011 v1.0
TL 60 (Rev.4/05)
Problem No. 2 (continued) VIRGINIA DEPARTMENT OF TRANSPORTATION
ASPHALT NUCLEAR DENSITY WORKSHEETROLLER PATTERN/SAWN PLUGS & CONTROL STRIP TARGET DENSITY
Control Strip No. 1Schedule PM-2A-10 Item No. Date 8/21/10Route From: To: 17.25Lane Direction: EBL Lane Outside
(NBL, SBL, etc.) (inside, center, etc.)
Mix Type SM -9.5D Application Rate: 165 lbs/yd² ( kg/m²)
Lot No 1 Width of Application 12 Lot Length 5000 ft (m)
Mix Producer Asphalt, Inc Plant Location Blacktop, VA
NUCLEAR CALIBRATION CHECK
A B C D E F G HSawedSpec.
Number
Weightin Air(g)
Weightin
Water(Total
g)
BasketTare
Weight
Weight in Water
(g)B - C
SSDWeightIn Air(g)
VolumeE-D
SSD BulkSpecificGravityA ÷ F
AverageSSDBulk
Per Site
SawedSpecimenThicknessIn. (mm)
TargetTest SiteNuclear
(from TL-58)
1 1014 641 xxx 641 1021 1.5 1
2 1024 618 xxx 618 1031 1.5 2
3
3 1158 691 xxx 691 1167 1.6 4
5
4 1082 660 xxx 660 1091 1.5 6
7
5 1190 699 xxx 699 1196 1.5 8
9
6 1099 679 xxx 679 1107 1.5 10
TotalAverage
(Sum of G/3) (Sum ofH/10)
Max Specific Gravity (Gmm) 2.653
A. Sawed Specimen Average % Density %(avg. SSD Bulk Sp. Gr. /Gmm x 100)
B. Minimum Design Density (Table III – 3 of sec. 315) %*(A must equal or exceed B)
C. Target Nuclear Density lb/ft³
Gauge Model 4640B
Serial No. 1212
Calibration Date 7/18/10
Depth Setting 1.5 In (
mm)
Pay Quantity Ton (Metric Ton)Lot length x width x application rate/ 18000
Testing Performed by Isaac Cline Observed by S. F. Mills
Is this control strip acceptable? Why or why not? What three sites would you core?
Complete this worksheet. Answer the questions at the bottom of the page.
8-392011 v1.0
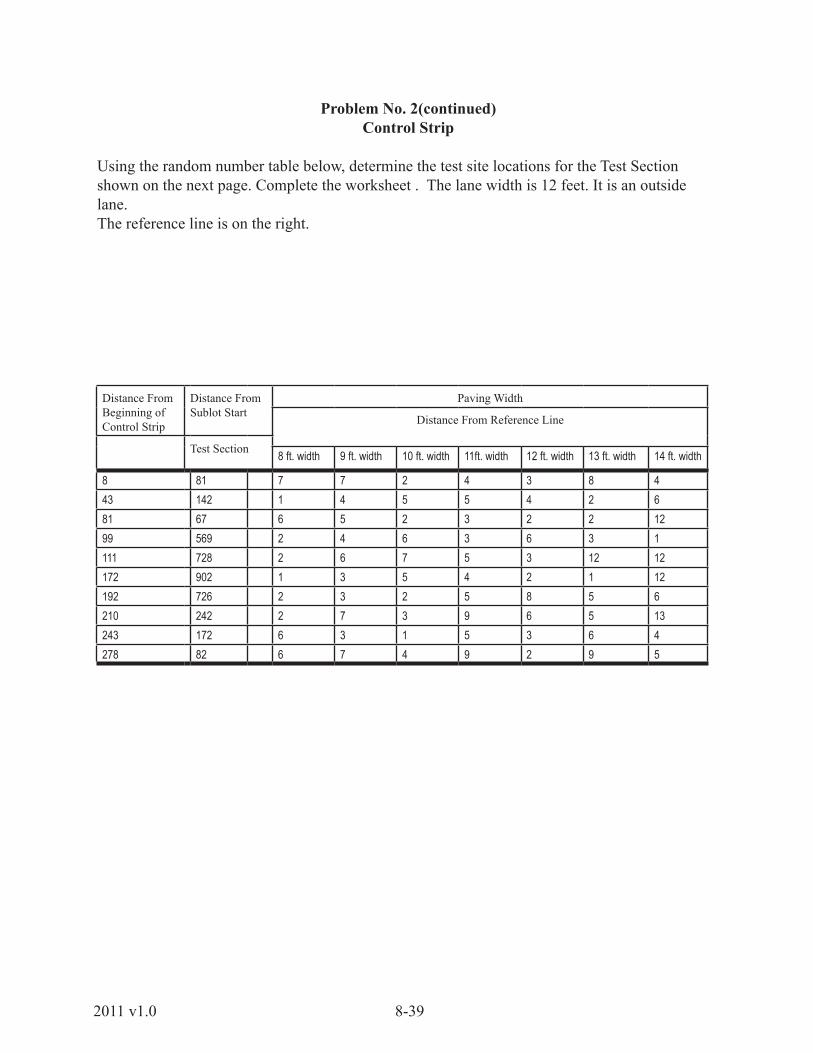
Problem No. 2(continued)Control Strip
Using the random number table below, determine the test site locations for the Test Section shown on the next page. Complete the worksheet . The lane width is 12 feet. It is an outside lane. The reference line is on the right.
Distance From Beginning of Control Strip
Distance From Sublot Start
Paving Width
Distance From Reference Line
Test Section 8 ft. width 9 ft. width 10 ft. width 11ft. width 12 ft. width 13 ft. width 14 ft. width