32
Chapter 8 Homework Numbers 1, 5, 10, and 13
| Date post: | 19-Dec-2015 |
| Category: |
Documents |
| View: | 218 times |
| Download: | 1 times |

Chapter 8 Homework
Numbers 1, 5, 10, and 13

Chapter 8 Appendix
How does all this relate to my other business classes???
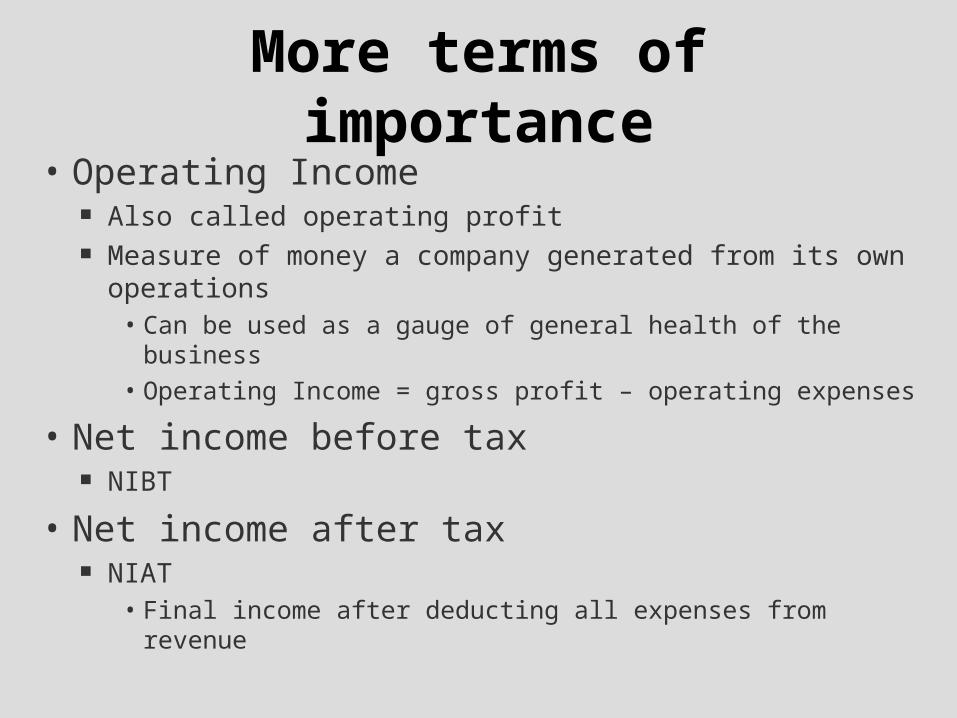
• Operating Income Also called operating profit Measure of money a company generated from its own
operations• Can be used as a gauge of general health of the business
• Operating Income = gross profit – operating expenses
• Net income before tax NIBT
• Net income after tax NIAT
• Final income after deducting all expenses from revenue
More terms of importance

What does the statement do?
• Shows business earnings
• Provides insight to how effectively the firm is being run
How controlled are costs? How much is spent in developing new products?
• Is the firm moving forward or stagnant Can calculate profit and operating margins to compare to
competitors


So what can we do with this?• Gross Profit Margin
Measures the company’s manufacturing and distribution efficiency.
• The higher the percentage the more efficient the firm is running
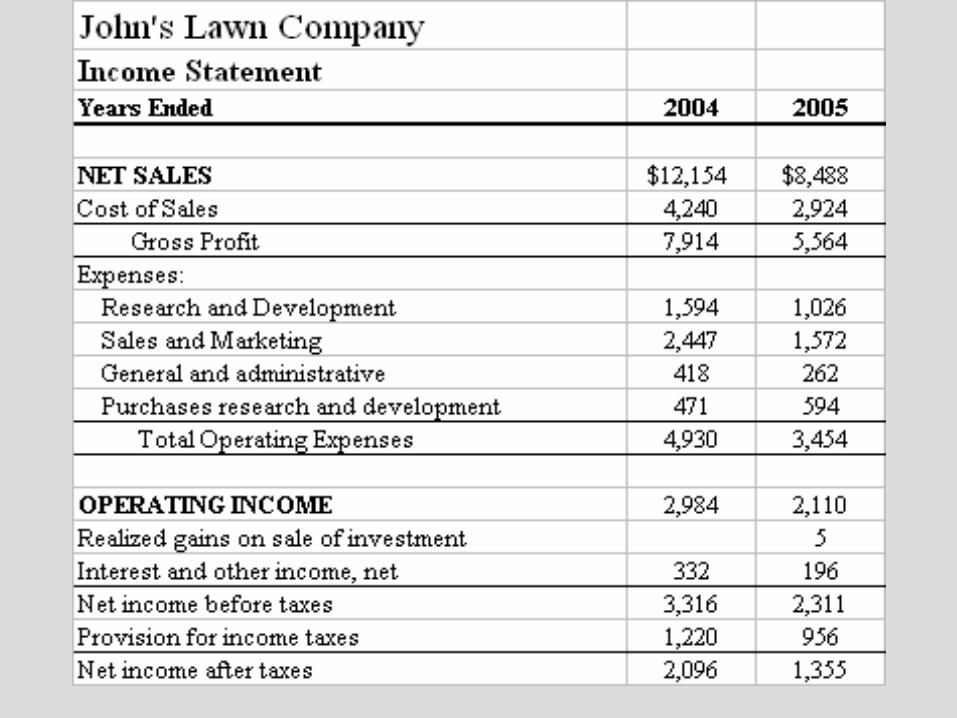
For John in 2004 7914/12154 = 0.65 For John in 2005 5564/8488 = 0.66 Tends to remain relatively stable overtime
• If large swings do occur…fraud or funny business may be to blame
Revenue Total
Profit GrossMarginProfit Gross

Interest Coverage Ratio
• Measurement of a company’s debt burden The lower the ratio the higher the burden
• Measures the number of times a firm could make its interest payments with its earning before interest and taxes
Safety net looks at the short term financial health of the firm
For John in 2004 2984/332 = 8.99 For John in 2005 2110/196 = 10.77
ExpenseInterest
EBITICR

Net Profit Margin
• Shows how much profit a company makes for every $1 it generates in revenue
Higher is better
For John in 2004 2096/12154 = 0.17 For John in 2005 1355/8488 = 0.16
Revenue
safter taxe incomeNet Margin Profit Net

Can we do it?• In 2002, Donna Manufacturing sold 100,000
widgets for $5 each, with a COGS for $2 each. It had $150,000 in operating expenses, and paid $52,500 in taxes. What is the net profit margin?
TR = 100,000*5 = 500,000 TC = 100,000*2 = 200,000 Gross Profit = 500,000-200,000 = 300,000 NIBT = 300,000-150,000 = 150,000 NIAT = 150,000 – 52,500 = 97,500 NPM = 97,500/500,000 = 0.195
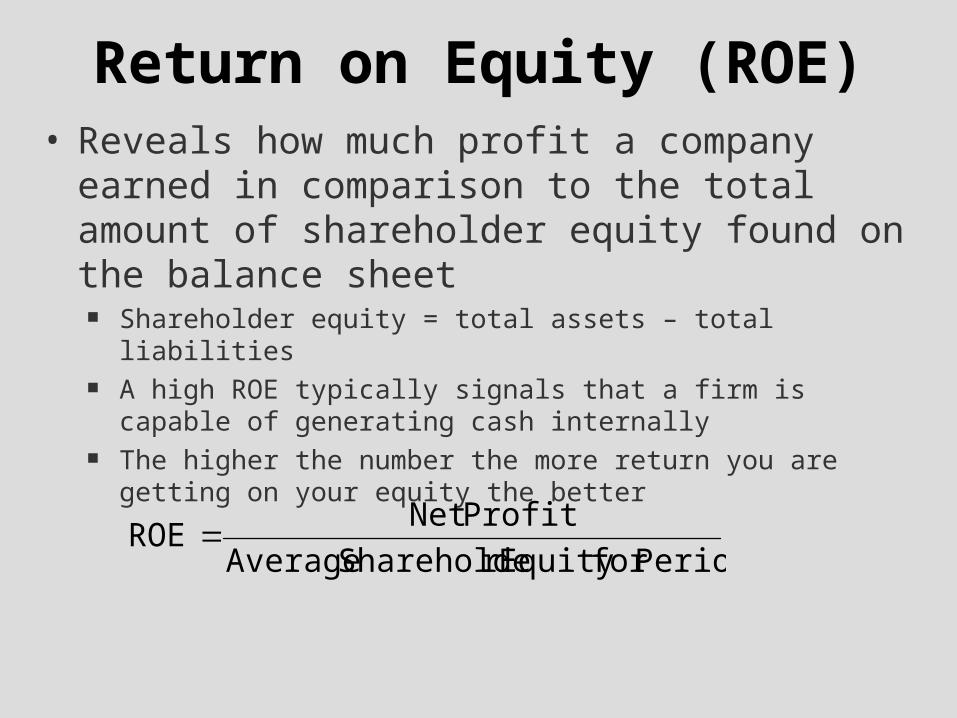
Return on Equity (ROE)• Reveals how much profit a company earned in
comparison to the total amount of shareholder equity found on the balance sheet
Shareholder equity = total assets – total liabilities A high ROE typically signals that a firm is capable of generating cash
internally The higher the number the more return you are getting on your equity the
better
Periodfor Equity r Shareholde Average
ProfitNet ROE

Can we do it??
• Martha Stewart Living reported net earnings for 2004 to be $21,906,000 while shareholder equity for 2004 and 2005 was $222,192,000 and $196,166,000 respectively. What is the ROE?
• Is this good? Management is earning a 10.47% return on shareholder equity Most S&P 500 firms average ROEs of 10 – 15%
1047.0
2000,116,196000,154,222
000,906,21
ROE
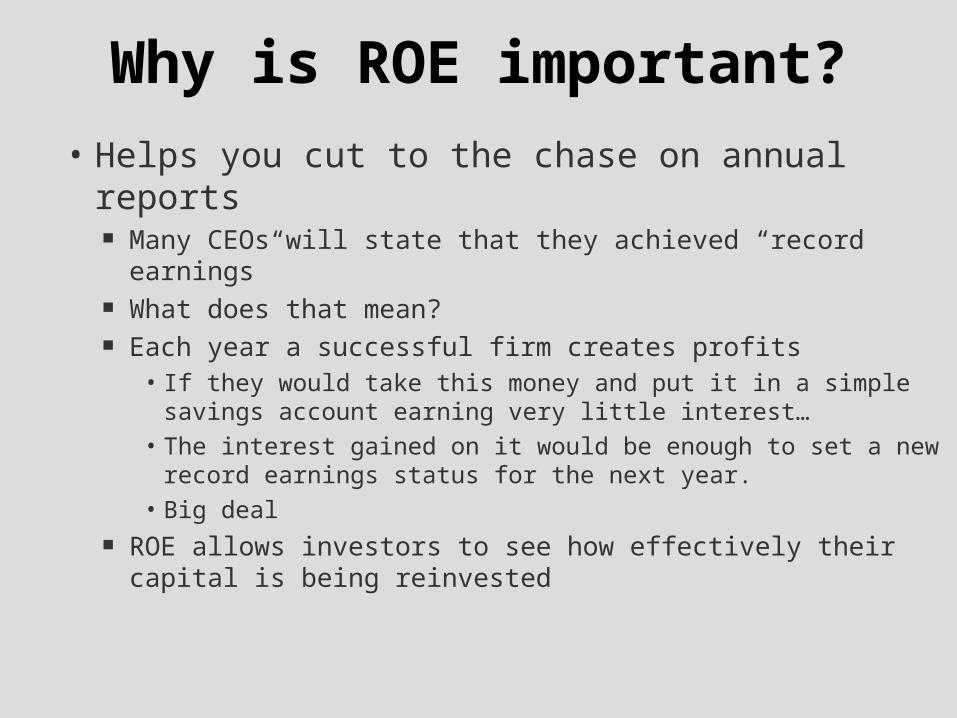
Why is ROE important?
• Helps you cut to the chase on annual reports Many CEOs will state that they achieved “record earnings” What does that mean? Each year a successful firm creates profits
• If they would take this money and put it in a simple savings account earning very little interest…
• The interest gained on it would be enough to set a new record earnings status for the next year.
• Big deal ROE allows investors to see how effectively their capital is
being reinvested
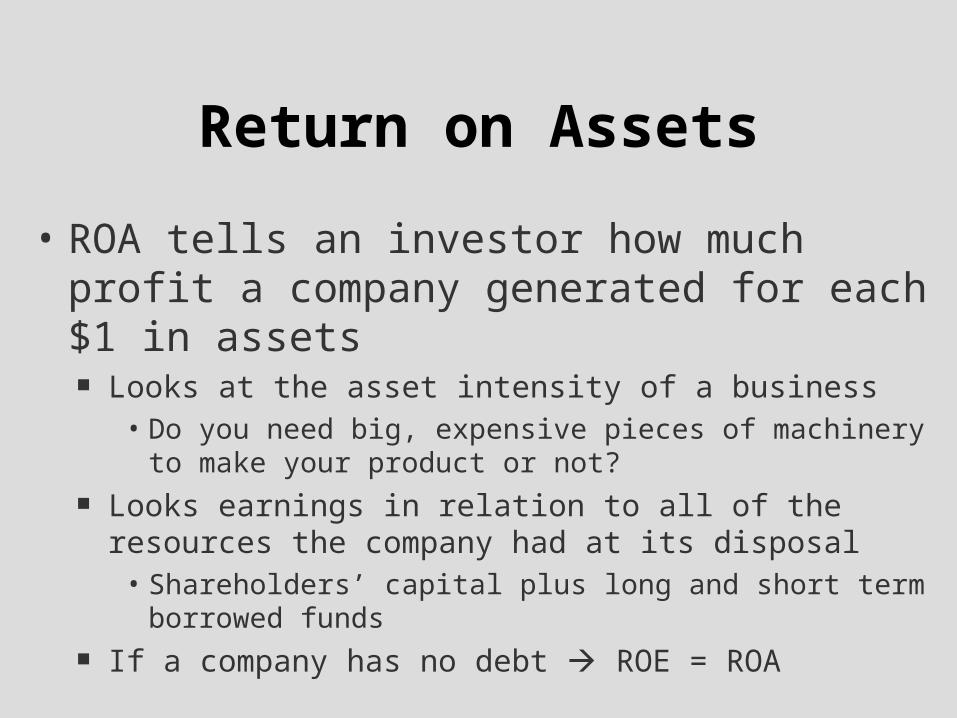
Return on Assets
• ROA tells an investor how much profit a company generated for each $1 in assets
Looks at the asset intensity of a business• Do you need big, expensive pieces of machinery to make your
product or not? Looks earnings in relation to all of the resources the company
had at its disposal• Shareholders’ capital plus long and short term borrowed funds
If a company has no debt ROE = ROA

Two ways to calculate ROA
TurnoverAsset *margin profit Net ROA
or
periodfor assets average
incomenet ROA
Asset turnover measures the total sales [revenue] for every dollar of assets a company owns
TR/average assets

Calculate the ROA for 2001

%75.40475.090.1*25.0
90.1
20009,428,000,0009,911,500,
TR ,00018,427,200 Turnover Asset
025.0,00018,427,200
0469,500,00 Margin Profit Net
orROA
assetsaverage
%85.404859.0
20009,428,000,0009,911,500,
000,500,469or
periodtheofassetsaverage
incomenetROA

Now let’s analyze Abercrombie and Fitch


What do we see??
• Gross Margin in 2005: gross profit /net sales Gross Margin = 558034/1364853 = 41% Gross Margin in 2004 = 509375/1237604 = 41.2% Gross Margin in 2003 = 450383/1030858 = 43.7% Investors will question why is the gross margin falling???
• What has happened in the industry?
• What is happening to competitor’s gross margin??
• Interest coverage ratio: EBIT/total interest expense

• ICR = 276522/5064 = 53.60
The company can afford to make its interest payments 53+ times before having financial issues
Looks financially stable.
• Net Profit Margin = NIAT/TR NPM in 2005 = 168672/1364853 = 12.4% NPM in 2004 = 158133/1237604 = 12.8% NPM in 2003 = 149604/1030858 = 14.5% Must compare to competitors to gain insight on what is a good
number
• ROE in 2005= net profit/average shareholders’ equity
ROE in 2005 = 168672/((595434+422700)/2) = 33%• Management is earning 33% return on retained profits
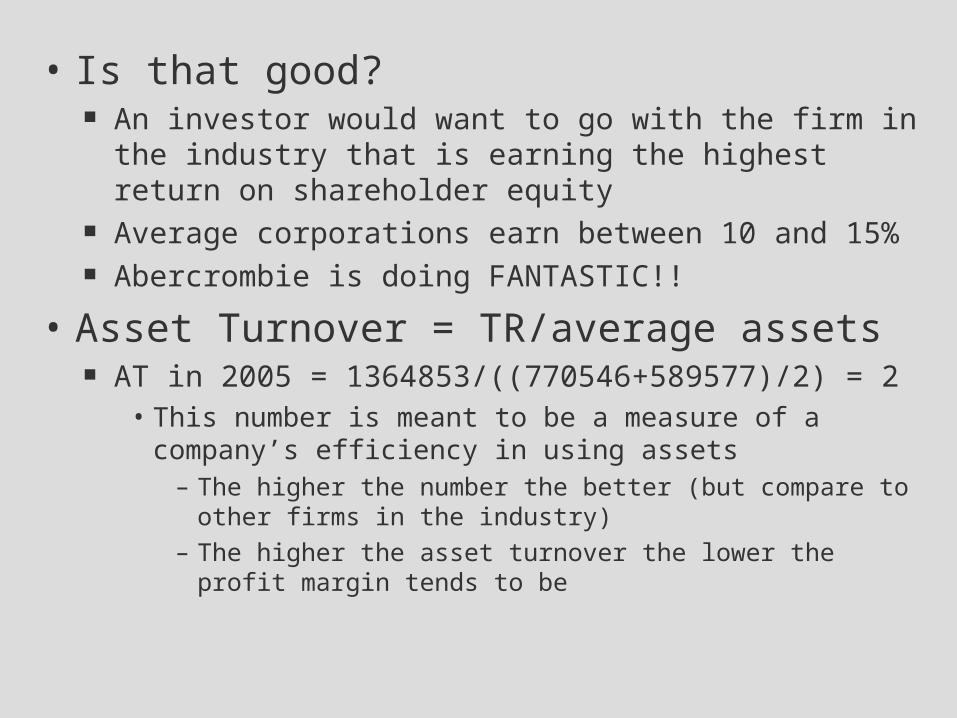
• Is that good?
An investor would want to go with the firm in the industry that is earning the highest return on shareholder equity
Average corporations earn between 10 and 15% Abercrombie is doing FANTASTIC!!
• Asset Turnover = TR/average assets AT in 2005 = 1364853/((770546+589577)/2) = 2
• This number is meant to be a measure of a company’s efficiency in using assets
– The higher the number the better (but compare to other firms in the industry)
– The higher the asset turnover the lower the profit margin tends to be

• ROA = Net profit Margin * Asset Turnover
ROA in 2005 = 0.124*2 = 0.248 or 24.8%
• So is this a good company to invest in?? Sales, gross profit, and operating profit all have been
increasing Gross and profit margins have been decreasing Higher return on shareholders’ equity Looks really good!!

Managerial Economics & Business Strategy
Chapter 9Basic Oligopoly Models

Oligopoly Environment
• Relatively few firms, usually less than 10. Duopoly - two firms Triopoly - three firms
• The products firms offer can be either differentiated or homogeneous.
Role of Strategic Interaction
• Your actions affect the profits of your rivals.
• Your rivals’ actions affect your profits.

An Example
• You and another firm sell differentiated products.
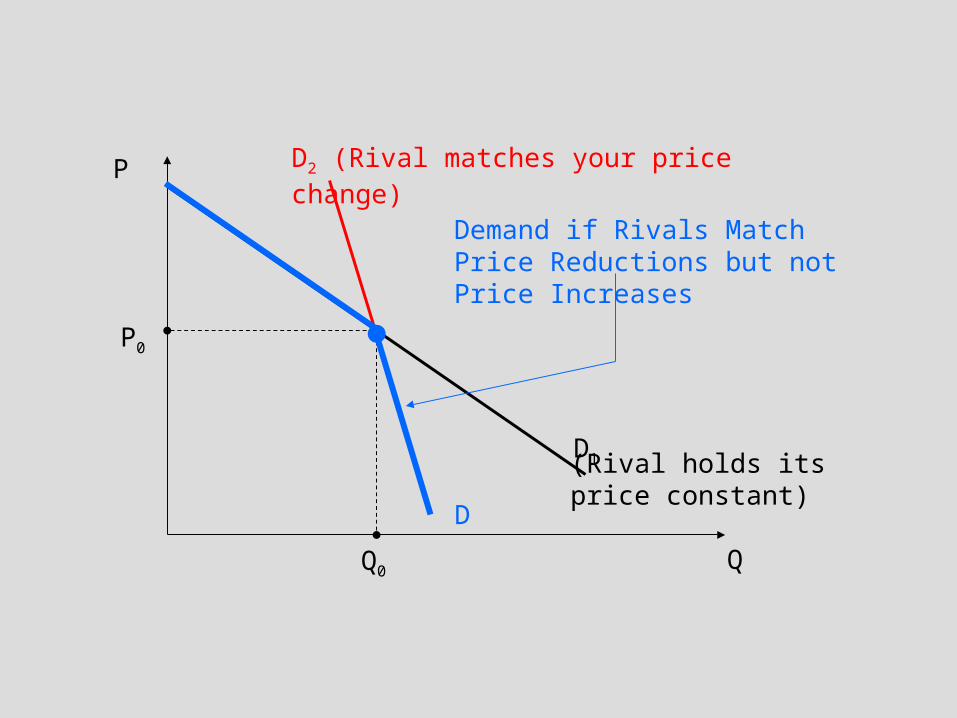
• How does the quantity demanded for your product change when you change your price?
Depends on whether or not your rival changes their price as well Demand will be more inelastic if other firms DO match
• Amount of product bought will change but not by much

P
Q
D1 (Rival holds itsprice constant)
P0
D2 (Rival matches your price change)
Q0

What usually happens
• Rivals will not match price increases
• Rivals will match price decreases
• Why?
• Causes a KINK in the demand curve Sometimes called Kinky Oligopoly Theory
P
Q
D1
P0
Q0
D2 (Rival matches your price change)
(Rival holds itsprice constant)
D
Demand if Rivals Match Price Reductions but not Price Increases

Key Insight
• How much you sell with a price reduction depends upon whether your rivals cut their prices too!
• How much you sell with a price increase depends upon whether your rivals raising their prices too!
• Strategic interdependence You aren’t in complete control of your own destiny!


