75
CHAPTER II FINANCES OF THE STATE

CHAPTER II
FINANCES OF THE STATE
CHAPTER II
FINANCES OF THE STATE

CHAPTER I OVERVIEW

19
CHAPTER II FINANCES OF THE STATE
This Chapter is based on the audit of the Finance Accounts of the State and makes an assessment of the State’s fiscal position as on 31 March 2020. It provides a broad perspective of the finances of the State during 2019-20 and analyses critical changes observed in the major fiscal aggregates in relation to the previous year, keeping in view the overall trend during the last five years period.
2.1 Major changes in Key fiscal aggregates vis-à-vis 2018-19 The major changes in key fiscal aggregates of the State during the year 2019-20, compared to the previous year are given in Table 2.1. Table 2.1: Changes in key fiscal aggregates in 2019-20 compared to 2018-19
Revenue Receipts Revenue receipts of the State decreased by 2.83 per cent Own Tax receipts of the State decreased by 0.63 per cent Own Non-tax receipts increased by 4.09 per cent State’s Share of Union Taxes and Duties decreased by 13.85 per
cent Grants-in-Aid from Government of India decreased by 1.35 per
cent Revenue Expenditure
Revenue expenditure decreased by 5.07 per cent Revenue expenditure on General Services increased by 9.20 per
cent Revenue expenditure on Social Services decreased by 10.90 per
cent Revenue expenditure on Economic Services decreased by 26.43
per cent Expenditure on Grants-in-Aid decreased by 31.86 per cent
Capital Expenditure
Capital expenditure increased by 13.78 per cent Capital expenditure on General Services decreased by 20.48 per
cent Capital expenditure on Social Services decreased by 38.88 per cent Capital expenditure on Economic Services increased by 32.28 per
cent Loans and Advances
Disbursement of Loans and Advances decreased by 47.91 per cent Recoveries of Loans and Advances increased by 39.81 per cent
Public Debt Public Debt Receipts increased by 80.61 per cent Repayment of Public Debt increased by 141.81 per cent
Public Account Public Account Receipts decreased by 3.04 per cent Disbursement of Public Account decreased by 4.77 per cent
Cash Balance Cash balance decreased by ₹192.93 crore (8.75 per cent) during 2019-20 compared to previous year

State Finances Audit Report for the year ended 31 March 2020
20
2.2 Sources and Application of Funds The components of the sources and application of funds of the State during the financial year compared to the previous year is given below in Table 2.2. Table 2.2 : Details of Sources and Application of funds during 2018-19 and 2019-20 (₹ in crore)
Particulars 2018-19 2019-20 Increase/ Decrease in (per cent)
Sources Opening Cash Balance 2733 2203 -19.39 Revenue Receipts 92854 90225 -2.83 Capital Receipts 46 27 -41.30 Recoveries of Loans and Advances
211 295 39.81
Public Debt Receipts (Net) 15250 16406 7.58 Public Account Receipts (Net) 11179 7314 -34.57 Contingency fund 0 0 0 Total 122273 116470
Application Revenue Expenditure 110316 104720 -5.07 Capital Expenditure 7431 8455 13.78 Disbursement of Loans and Advances
2323 1210 -47.91
Closing Cash Balance 2203 2010 -8.76 Contingency fund 0 75 Total 122273 116470
Source: Finance Accounts for 2018-19 and 2019-20
The composition and application of the resources are shown in the Charts 2.1 and 2.2
OB cash, 1.89
GIA, 9.65
Tax Revenue,
43.21
Non-Tax Revenue,
10.53
Central Tax Transfer,
14.08
Recoveries of Loans
and Advances,
0.25
Capital Receipts
, 0.02 Public Debt, 14.09
Public Account,
6.28
Chart 2.1: Composition of Resources ( In per cent)
₹ comes from Grant in aid, 5.21
Economic Services
(Revenue), 7.82
Social Services
(Revenue), 29.23
General Services (Revenue), 47.66
Capital Expenditure,
7.25
Disbursement of Loans and
Advances, 1.04
CB cash, 1.73
Contingency fund,
0.06
Chart 2.2: Application of Resources( In per cent)
₹ goes to

Chapter II – Finances of the State
21
2.3 Resources of the State The resources of the State are described below:
1. Revenue receipts consist of tax revenue, non-tax revenue, State’s share of Union taxes and duties and grants-in-aid from the Government of India (GoI).
2. Capital receipts comprise miscellaneous capital receipts such as proceeds from disinvestments, recoveries of loans and advances, debt receipts from internal sources (market loans, borrowings from financial institutions/commercial banks) and loans and advances from GoI. Both revenue and capital receipts form part of the Consolidated Fund of the State.
3. Net Public Accounts receipts: There are receipts and disbursements in respect of certain transactions such as small savings, provident fund, reserve funds, deposits, suspense, remittances, etc. which do not form part of the Consolidated Fund. These are kept in the Public Account set up under Article 266 (2) of the Constitution and are not subject to vote by the State Legislature. Here, the Government acts as a banker. The balance after disbursements is the fund available with the Government for use.
2.3.1 Receipts of the State The composition of the overall receipts of the Government is given in Chart 2.3 below. Besides, the Capital and Revenue Receipts, funds available in the Public Account (net of disbursement made from it) are also utilised by the Government to finance its deficit.

State Finances Audit Report for the year ended 31 March 2020
22
Chart 2.3 Composition of receipts of the State during 2019-20
2.3.2 State’s Revenue Receipts Statement No.14 of the Finance Accounts details the revevue receipts of the State Government. The State’s Revenue Receipts consist of the State’s own tax and non-tax revenues, share of Central tax transfers and Grants-in-aid from GoI. The trends in total revenue receipts and its components, followed by trends in the receipts bifurcated into receipts from the Central Government and State’s own receipts etc are discussed in the succeeding paragraphs.
Total Receipts (₹114267 crore)
Net Public Account Receipts
(₹7314 crore)
Small savings, PF etc. (₹8274 crore)Reserve funds
(₹ (-)1350 crore)Deposits/ advances
(₹526 crore)Suspense and Misc
(₹(-) 253 crore)Remittances (₹118 crore)
Capital Receipts(₹16728 crore)
Public Debt Receipts
(₹16406 crore)
Internal debt excluding ways and means
advances(₹14439 crore)Net transactions under
ways and means Advances(₹530 crore)Loans and Advances
from GoI(₹1437 crore)
Non Debt Receipts
(₹322 crore)
Recoveries of loans and advances
( ₹295 crore) Miscellaneous capital receipts
(₹27 crore)
Revenue Receipts(₹90225 crore)
GIA from GoI(₹11235 crore)
Share of Union taxes and duties
(₹16401 crore)
Non-Tax Revenue(₹12265 crore)
Own Tax Revenue (₹50323 crore)
State Goods and Services tax (₹20447 crore)Land Revenue(₹332 crore)
Stamps and Registration fees etc(₹3615 crore)State Excise (₹2255 crore)
Taxes on sales , trade etc. (₹ 19650 crore)Taxes on vehicle(₹3721 crore)
other taxes and duties on commodities and services (₹39.31 crore)Others(₹263.39 crore)

Chapter II – Finances of the State
23
2.3.2.1 Trends and growth of Revenue Receipts The trends and growth of Revenue Receipts as well as revenue buoyancy with respect to GSDP over the five-year period 2015-2020 are given in Table 2.3. Further, trends in Revenue Receipts relative to GSDP and composition of revenue receipts are given in Charts 2.4 and 2.5 respectively.
Table 2.3 : Trend in Revenue Receipts
Parameters 2015-16 2016-17 2017-18 2018-19 2019-20 Revenue Receipts (RR) (₹ in crore) 69033 75612 83020 92854 90225
Rate of growth of RR (per cent) 19.13 9.53 9.80 11.85 -2.83 Own Tax Revenue (₹ in crore) 38995 42176 46460 50644 50323 Non-Tax Revenue (₹ in crore) 8425 9700 11200 11783 12265 Rate of growth of Own Revenue (Own Tax and Non-tax Revenue) (per cent)
11.53
9.40
11.15
8.27
0.26
Gross State Domestic Product (₹ in crore) (2011-12 Series) 561994 634886 701577 781653 854689
Rate of growth of GSDP (per cent) 9.64 12.97 10.50 11.41 9.34
RR/GSDP (per cent) 12.28 11.91 11.83 11.87 10.56 Buoyancy Ratios6 Revenue Buoyancy w.r.t GSDP 1.98 0.73 0.93 1.04 -0.30
State’s Own Revenue Buoyancy w.r.t GSDP 1.20 0.72 1.06 0.72 0.03
Source: Finance Accounts
6 Buoyancy ratio indicates the elasticity or degree of responsiveness of a fiscal variable with respect to a
given change in the base variable. For instance, revenue buoyancy with respect to GSDP at 1.85 implies that Revenue Receipts tend to increase by 1.85 percentage points, if the GSDP increases by one per cent.

State Finances Audit Report for the year ended 31 March 2020
24
Chart 2.5 Trend of components of Revenue Receipts
6903375612
8302092854 9022512.28%
11.91% 11.83%
11.87%
10.56%
9.50%
10.00%
10.50%
11.00%
11.50%
12.00%
12.50%
2015-16 2016-17 2017-18 2018-19 2019-200
10000
20000
30000
40000
50000
60000
70000
80000
90000
100000
(as p
er c
ent o
f GSD
P)
(₹ in
cro
re )
Chart 2.4 Trend of Revenue Receipts
Revenue Receipts As per cent of GSDP
2015-16 2016-17 2017-18 2018-19 2019-20Own tax Revenue 38995 42176 46460 50644 50323Non Tax Revenue 8425 9700 11200 11783 12265State's Share in Union
Taxes and Duties 12691 15225 16833 19038 16401
Grants in aid fromGovernment of India 8921 8510 8528 11389 11235
0
5000
10000
15000
20000
25000
30000
35000
40000
45000
50000
55000
(₹ in
cro
re)

Chapter II – Finances of the State
25
General trends relating to Revenue Receipts of the State are as follows:
The Revenue Receipts of the State decreased by 2.83 per cent from ₹92,854 crore in 2018-19 to ₹90,225 crore in 2019-20. This was mainly due to decrease in share of union taxes and duties assigned to the State by 13.85 per cent (₹2,637 crore) from ₹19,038 crore in 2018-19 to ₹16,401 crore in 2019-2020.
The rate of growth of Revenue Receipts is in negative for the first time in five year period from 2015 to 2020.
State’s own resources contributed to 69 per cent of the Revenue Receipts during 2019-20, while Union Taxes and Grant-in- Aid together contributed 31 per cent. However the rate of growth of Own Revenue of the State during the year showed a meagre growth of 0.26 per cent and is the lowest in the five year period from 2015-16 to 2019-20.
The Buoyancy of Revenue receipts with GSDP decreased during 2019-20 compared to the previous year and was recorded at -0.30 per cent, indicating less than optimum growth in revenue receipts when compared to the growth in GSDP.
Buoyancy of own tax revenue with GSDP was less than one (0.03 per cent) during the year indicating low growth rate of own tax revenue when compared to the growth in GSDP.
2.3.2.2 State’s Own Resources State’s share in Central taxes is determined on the basis of recommendations of the Finance Commission. Grants-in-aid from Central Government are determined by the quantum of collection of Central tax receipts and anticipated Central assistance for schemes. State’s performance in mobilisation of additional resources should be assessed in terms of its own resources comprising revenue from its own tax and non-tax sources. Own Tax Revenue Own tax revenue of the State consist of State GST, State Excise, Taxes on Vehicles, Stamp duty and Registration fees, Land Revenue, Taxes on Goods and Passengers etc. The details of Own Tax Revenue of the State during the five-year period 2015-20 is given in Chart 2.6 below.

State Finances Audit Report for the year ended 31 March 2020
26
The State’s own tax revenue showed an increasing trend from 2015-16 to 2018-19 and decreased by ₹321 crore, from ₹50,644 crore in 2018-19 to ₹50,323 crore in 2019-20. The component wise Own Tax Revenue collected during the five-year period 2015-2020 is given in Table 2.4.
Table 2.4 : Components of States own tax revenue (₹ in crore)
Source: Finance Accounts of respective years The Revenue collected increased under heads Taxes on Sales, Trade etc (₹424 crore), Land Revenue (₹130 crore), Taxes on vehicle (₹12 crore) and others (₹25 crore). However this was offset by decrease in collection under the heads State Goods and Services tax (₹568 crore), State Excise (₹266 crore) and Stamps and
Revenue Head 2015-16 2016-17 2017-18 2018-19 2019-20 SparklineState Goods and Services tax 0 0 12008 21015 20447Land Revenue 182 124 162 203 333Stamps and Registration Fees 2878 3007 3453 3693 3615State Excise 1964 2019 2240 2521 2255Taxes on Sales, Trade etc. 30737 33453 24578 19226 19650Taxes on Vehicles 2814 3107 3663 3709 3721Other Taxes and Duties on Commodities and Services
0 0 100 37 39
Others 420 467 257 240 263Total 38995 42177 46460 50644 50323
3899542177
4646050644 50323
0
10000
20000
30000
40000
50000
60000
2015-16 2016-17 2017-18 2018-19 2019-20
(₹ in
cro
re)
C H ART 2 . 6 GR O W TH O F O W N TA X R EV E N U E DU R I NG 2 0 1 5 - 2 0

Chapter II – Finances of the State
27
Registration Fees (₹78 crore). The tax collection of four major revenue sources of the State compared all India average, during the last five years, is given in Appendix 2.1. State Goods and Service Tax (SGST) Kerala implemented GST with effect from 01 July 2017. GST is levied on intra-State supply of goods or services (except alcohol for human consumption and five specified petroleum products7) and its components are shared by the Centre (CGST) and the State (SGST). Further, IGST is levied and collected by the Central Government on inter-State supply of goods and services. The IGST so collected is apportioned between the Centre and the concerned State where the goods and services are consumed.
The GoI enacted the Goods and Services Tax (Compensation to States) Act, 2017 to compensate the States on account of loss of revenue which may arise due to implementation of the GST for a period of five years. The compensation was to be given by considering the base figure of revenue of a State for the year 2015-16, escalated by 14 per cent per annum for the next five years commencing from 01 July 2017.
For the State of Kerala, the base year (2015-16) revenue to be subsumed by the GST regime was fixed by GoI at ₹16,821.37 crore. Thus, the projected revenue for Kerala worked out to ₹28,410.62 crore for the period 2019-20.
Actual collection of revenue under State Goods and Services Tax (SGST) for the period 2017-18 to 2019-20 is given in the Table 2.5 below.
Table 2.5: SGST receipts of the State (₹ in crore) Particulars 2017-18 2018-19 2019-20 Tax 10927.61 17780.46 18966.81 Apportionment of taxes from IGST
1075.51 3231.79 814.41
Others 4.57 2.46 665.74* SGST Collection 12007.69 21014.71 20446.96 Pre GST Tax collected 8 2460.31 457.81 654.07
*The amount of ₹665.74 crore is the collection of Kerala flood cess.
Against the projected revenue of ₹28,410.63 crore, the State Government earned a revenue of ₹20,435.29 crore (SGST: ₹19,781.22 crore (excluding flood cess of 7 Five petroleum products are: Crude, High speed diesel, Petrol, Aviation turbine fuel and Natural gas
8 Taxes that have been subsumed under GST are: Value Added Tax, Central Sales Tax, Entertainment Tax, Luxury Tax, Entry tax, Cesses & Surcharges, Duties on Excise on medicinal and toilet preparations excluding KGST and CST on alcohol for human consumption and five specified petroleum products.

State Finances Audit Report for the year ended 31 March 2020
28
₹665.74 crore) plus subsumed Pre GST Tax: ₹654.07crore) during 2019-20 and therefore, entitled to a compensation of ₹7,975.34 crore.
The State Government received ₹5,575.04 crore as compensation till March 2020. Thus the total revenue under GST during the year was ₹26,010.33 crore (excluding flood cess ₹665.74 crore), which worked out to a growth of 4.37 per cent as against the projected growth of 14 per cent, requiring higher amount of compensation from the Government of India.
Besides the State received ₹4,654.19 crore as its share of net proceeds assigned to the State under Central Goods and Services Tax and no amount was received towards Integrated Goods and Services Tax. Analysis of arrears of revenue The arrears of revenue as on 31 March 2020 on some principal heads of revenue amounted to ₹3,584.87 crore of which ₹562.88 crore was outstanding for more than five years, as detailed in Appendix 2.2. Information called for from Forest, Labour, Port, SGST, Stationery, Transport and Land Revenue Departments were not furnished. Non-reporting untimely reporting of arrears to the Revenue Department, improper follow up by the departments in realising the arrears were the main reason for outstanding arrears of revenue.
Evasion of tax detected by the department
The details of cases of evasion of tax detected by the departments were called for by Audit from 16 department out of which nine departments did not detected any case of evasion of tax. The details furnished by Motor Vehicles and Revenue Departments are given in Table 2.6 below. SGST, Transport, Forest, Health, Agriculture Department did not furnish any reply.
Table 2.6: Evasion of Tax
Sl No.
Head of Revenue
Cases pending as on 31 March 2019
Cases detected during 2019-20
Total Number of cases in which assessment/ investigation completed and additional demand with penalty etc. raised
Number of cases pending for finalisation as on 31 March 2020
Number of cases
Amount of demand (₹ in crore)
1 0041-Taxes on vehicles
76 9 85 2 1.05 83
2 0029-Land Revenue
1328 147 1475 284 0.83 1191
Source: Information collected from departments

Chapter II – Finances of the State
29
Non Tax Revenue Non-Tax revenue consists of interest receipts, dividends and profits, mining receipts, departmental receipts, etc. Table 2.7: Components of non-tax revenue (₹ in crore)
Source: Finance Accounts of respective years
Non Tax Revenue, which contributed to 13.59 per cent of the Total Revenue Receipts of the State during 2019-20 when compared to 12.69 per cent in 2018-19 increased by ₹482 crore (four per cent) during the year. The increase is mainly due to increase in receipts under State Lotteries (₹709 crore). Receipts under State Lotteries is the major non-tax revenue of the State and its share in non-tax revenue during the year was 81 per cent which was the highest during the five-year period 2015-20. 2.3.2.3 Transfers from the Centre Transfers from Government of India including State’s share of Union taxes and Grants-in-aid from Government of India are shown in Chart 2.7
Revenue Head 2015-16 2016-17 2017-18 2018-19 2019-20 SparklineInterest receipts 105 144 144 132 85Dividends and profits 90 96 126 132 100State Lotteries 6271 7283 9034 9265 9974Forestry and Wildlife 283 297 245 287 256Other non-tax receipts 1677 1880 1650 1967 1850
Total 8426 9700 11199 11783 12265
73389699 9862
11607
15434
2161223735
25361
3042727636
5142 5990 6841 7469 7926
1269115225
1683319038
16401
21963709 3021 4138 7508
8921 8510 852811389 11235
0
5000
10000
15000
20000
25000
30000
35000
2010-11 2011-12 2012-13 2013-14 2014-15 2015-16 2016-17 2017-18 2018-19 2019-20
(₹in
cro
re)
Chart 2.7 Transfers from the Centre
Total Share in Central taxes Grants from Centre

State Finances Audit Report for the year ended 31 March 2020
30
State’s share in Union taxes and duties, actual devolution vis-à-vis Finance Commission projections are given in Table 2.8. Table 2.8: State’s share in Union taxes and duties: Actual devolution vis-à-vis Finance Commission projections
(₹ in crore)
Source: Reports of the XIII FC & XIV FC, Finance Accounts and Annual Financial Statement
Central Tax Transfer The XIV Finance Commission (FC) had recommended the States’ share of Central taxes to be increased to 42 per cent from 32 per cent recommended by the XIII Finance Commission. Kerala’s share in the net proceeds of Central tax and Service tax was fixed at 2.500 per cent and 2.526 per cent respectively by the XIV FC for the award period 2015-20. Details of Central tax transfers to the State during the period 2015-20 are given in Table 2.9.
Table 2.9: Central Tax Transfers
(₹ in crore)
Head 2015-16 2016-17 2017-18 2018-19 2019-20 Direct taxes Corporation Tax 4001 4886 5157 6621 5592 Taxes on Income other than Corporation Tax
2783 3396 4354 4876 4382
Taxes on Wealth 1 11 0 2 0 Total of Direct Taxes (A) 6785 8293 9511 11499 9974 Indirect taxes Central Goods and Services Tax (CGST)
0 0 240 4699 4654
Integrated Goods and Services Tax (IGST)
0 0 1700 375 0
Customs 2032 2102 1699 1350 1040 Union Excise Duties 1689 2400 1776 897 723 Service Tax 2176 2430 1907 174 0
Year Finance Commission projections Projections in FCR
Actual tax devolution Difference
2010-11 32 per cent of net proceeds of all shareable taxes excluding service tax and 2.341 per cent of net proceeds of sharable service tax (As per recommendations of XIII FC)
5601 5142 459 2011-12 6569 5990 579 2012-13 7749 6841 908 2013-14 9140 7469 1671 2014-15 10781 7926 2855 2015-16 42 per cent of net proceeds of all shareable
taxes excluding service tax and 2.526 per cent of net proceeds of shareable service tax (As per recommendations of XIV FC)
14482 12691 1791 2016-17 16711 15225 1486 2017-18 19308 16833 2475 2018-19 22336 19038 3298 2019-20 25869 16401 9468
As per fiscal consolidation roadmap of State Government

Chapter II – Finances of the State
31
Head 2015-16 2016-17 2017-18 2018-19 2019-20 Other Taxes9 9 0 0 44 10 Total of Indirect Taxes(B) 5906 6932 7322 7539 6427 Central Tax transfers (A+B) 12691 15225 16833 19038 16401 Percentage of increase over previous year
60.12 20 10.56 13.10 -13.85
Percentage of Central tax transfers to Revenue Receipts
18.38 20.14 20.28 20.50 18.18
The Central tax transfers stood at ₹16,401 crore in 2019-20, registering a decrease of 13.85 per cent (₹2,637 crore) over the previous year. Of the total Central tax transfers, the direct tax transfers was ₹9,974 crore and indirect tax transfers was ₹6,427 crore which included the Central Goods and Services Tax of ₹4,654 crore, no amount was received towards Integrated Goods and Services Tax as the recommended in the XIV FC. The components received under the GST regime, decreased by 8.28 per cent over the previous year. Grants-in-aid from GoI Grants-in-aid (GIA) received from the Government of India contributed to 12.45 per cent of the Revenue Receipts of the State during 2019-20. The trend of total grants from Government of India as a percentage of revenue receipts ranged between 10 per cent and 13 per cent during 2015-20. Details of GIA received by the State Government from GoI during 2015-20 is given in Table 2.10.
Table 2.10: Grants-in-aid from Government of India (₹ in crore)
*There are no figures since the nomenclature of plan and non -plan grants was removed with effect from the year 2017-18 and replaced by Grants for CSS, Finance Commission grants and Other Grants to States. 9 Include Other Taxes on Income and Expenditure, Other Taxes and Duties on Ccommodities and Services
Head 2015-16 2016-17 2017-18 2018-19 2019-20 Non-Plan Grants 5178 5250 -- -- -- Grants for State Plan Schemes 3406 2727 -- -- -- Grants for Central Plan Schemes* 170 71 -- -- -- Grants for Centrally Sponsored Schemes
167 462 -- (-)1 --
Grants for Special Plan Schemes -- -- -- -- -- Grants for Centrally Sponsored Schemes (CSS)
-- -- 3213 3771 3263
Finance Commission Grants -- -- 3182 1646 2343 Other transfers/Grants to States/Union Territories with Legislature
-- -- 2133 5973 5629
Total 8921 8510 8528 11389 11235 Percentage of increase over the previous year
18.82 4.61 0.21 33.65 -1.35
Percentage of GIA to Revenue Receipts
12.92 11.25 10.27 12.27 12.45

State Finances Audit Report for the year ended 31 March 2020
32
During the year 2019-20, Finance Commission grants increased by ₹697 crore and the grants under Centrally Sponsored Scheme and Other transfers decreased by ₹507 crore and ₹344 crore respectively. The increase in the Finance commission grants was offset by the decrease in the other grants and hence the Central assistance received during the year 2019-2020 in the form of Grant in aid decreased by ₹154 core when compared to the previous year.
2.3.2.4 XIV Finance Commission Grants Receipt and utilisation of XIV Finance Commission Grants during the award period (2015-2020) The XIV Finance Commission (hereinafter referred in this report as XIV FC) was constituted by the President of India under Article 280 of the Constitution of India to make recommendations on, i) the distribution of net proceeds of taxes between the Union and the States, ii) the Principles which should govern the Grants-in-aid of the revenues of the States and iii) the measures needed to augment the Consolidated Fund of the State to supplement the resources of Local Self Government Institutions (LSGIs). The XIV FC had recommended Grants-in-aid amounting to ₹17,966.71 crore for three purposes viz., Local Bodies, Disaster Management and Post-devolution Revenue Deficit during the award period 2015-2020. A study was conducted to examine the receipt and utilisation of XIV FC Grants for the award period 2015-16 to 2019-20 and to ascertain whether:
The stipulated Grants have been released by Government of India (GoI). The Grants received have been utilised in full and for the intended purposes.
Audit test checked relevant records in Government Secretariat, Directorate of Panchayats, Directorate of Urban Affairs, District Collectorate Thiruvananthapuram, O/o Chief Engineer, Irrigation and Administration, Directorate of Animal Husbandry during the course of audit. With a view to assess whether the LSGI Grants was utilised for the intended purpose, five LSGIs10 comprising one Corporation, two Municipalities and two Grama Panchayats (GP), on the basis of maximum XIV FC Grants received during the award period, were selected from Thiruvananthapuram and Kollam districts for detailed study. Audit methodology included scrutiny of basic records, registers, files, e-files, issue of audit enquiries, etc. Grants recommended by XIV FC and funds received by State Government are shown in Table 2.11.
10 Thiruvanathapuram Municipal Corporation, Kollam Municipal Corporation, Neyyattinkara Municipality,
Nedumangad Municipality, Karunagappally Municipality, Punalur Municipality, Parassala Grama Panchayat(GP), Peringamala GP, Kulathupuzha GP, Chithara GP.

Chapter II – Finances of the State
33
Table 2.11: Grants recommended by XIV FC and actually received by State Government (₹ in crore)
Particulars Award
amount for 2015-2020
Amount released for 2015-2020
Excess Release
Shortfall in
release Local Self Government 7681.96 7012.02 - 669.94 Disaster Management 765.75 766.50 0.75 Nil Post-devolution Revenue deficit Grant 9519.00 9519.00 - Nil
Total 17966.71 17297.52 0.75# 669.94 Source: Report of XIV FC and GoI release orders #An excess amount of ₹0.75 crore received by the State against the XIV FC recommended award amount.
The shortfall was mainly due to non-release of Performance Grant (PG) to LSGIs by GoI during the period 2018-19 (₹285.94 crore) and 2019-20 (₹374.42 crore). The State Government remarked that, though Ministry of Panchayati Raj (MoPR) and National Institute of Urban Affairs (NIUA) has recommended to the Ministry of Finance for release of PG to Rural Local Bodies (RLBs) and Urban Local Bodies (ULBs) respectively for the years 2018-19 and 2019-20, the same has not been released till date and that no reasons were attributed for non-releases. The audit findings regarding receipt and utilisation of XIV FC grants are detailed below:
Audit findings
Suboptimal utilisation of funds by LSGIs and retention of Grants to LSGIs by State Government for other purposes XIV FC recommended Grants to LSGIs in the form of Basic Grant (BG) and Performance Grant (PG). BG was provided to support LSGIs for delivering basic civic services assigned to LSGIs. PG was designed to serve the purpose of ensuring reliable audited accounts and data of receipts and expenditure and improvement in own revenues of LSGIs. The XIV FC Grants received from GoI is allocated to the LSGIs under the Head ‘3604-00-200-90 Expansion and Development under XIV FC Recommendations to Local Bodies’. The State Government received an amount of ₹7,012 crore as XIV FC Grants from GoI for LSGIs from 2015-16 to 2019-20. Out of this, an amount of ₹4,805.23 crore was utilized by LSGIs leaving an unspent balance of ₹2,206.77 crore. Audit observed that the funds remaining unutilised, lapsed at the end of each financial year. Of the total lapsed amount of ₹2,206.77 crore, ₹1,464.19 crore (66 per cent) lapsed in the year end 2019-20 alone as shown below.

State Finances Audit Report for the year ended 31 March 2020
34
Table 2.12: XIV FC recommended LSGI Grants remaining unutilised with the State (₹ in crore)
Source: GoI release orders and Detailed Appropriation Accounts * The State Government authorised the entire XIV FC Grants for 2015-16 as a part of Development fund to LSGIs prior to the actual release of the same by GoI in 2016-17 which led to excess expenditure in 2015-16 against the GoI releases during the year.
Chart 2.8 depicts the release and utilisation of XIV FC Grants from 2015-16 to 2019-20
As per the guidelines issued (October 2015) by GoI, XIV FC Grants should be transferred to the LSGIs within 15 days of it being credited to the accounts of State Government. However, unspent balances to a tune of ₹2,206.77 crore held with the State Government showed that the XIV FC Grants were merely allocated to the LSGIs and were not actually transferred to the LSGIs as required under the provisions of guidelines. Audit observed that the State Government had issued an order (March 2015), that the unspent amount (including Central Finance Commission funds) in the Consolidated Fund of the State has to be provided to the LSGIs as additional authorization/ Supplementary Demands for Grants (SDG) in succeeding years. Subsequent to the issue of GoI guidelines the Government of Kerala order with reference to Central Finance Commission funds should have been
392.71
1702.741256.57 1453.62
2206.36
940.16782.59
1183.43 1156.88
742.17
0
500
1000
1500
2000
2500
2015-16 2016-17 2017-18 2018-19 2019-20
(₹ in
cro
re)
Chart 2.8 Release and utilisation of XIV FC grant
FFC grant released by GoI Uilisation of FFC grant by LSGIs
Year XIV FC Grants received by
State Govt from GoI
Expenditure incurred by the State under the Head ‘3604-00-200-90 Expansion and Development under XIV FC recommendations to Local Bodies’
Unspent Balance
2015-16 392.71 940.16 (-)547.45* 2016-17 1702.74 782.59 920.15 2017-18 1256.57 1183.43 73.14 2018-19 1453.62 1156.88 296.74 2019-20 2206.36 742.17 1464.19 7012.00 4805.23 2206.77

Chapter II – Finances of the State
35
withdrawn. The practice of informing GoI that the XIV FC funds has been released to LSGIs though it has not been actually transferred, needs to be reviewed. The State Government replied (October 2020) that the unspent balances of XIV FC Grants were not reauthorized under SDG as the LSGIs failed to utilise even the budget provision of the respective years. The reply is not tenable as retention of GoI Grants by State Government is highly irregular and will defeat the purpose and intent of Local Bodies Grants as envisaged by XIV FC. In response to the audit query on poor utilisation of XIV FC Grants by LSGIs, the test checked LSGIs replied that the funds allocated to them were subject to restrictions/ regulations on treasury transactions imposed by the State Government which barred them from using the XIV FC Grants completely within the financial year even though the bills were submitted to treasury in time. In 2019-20, 16,947 bills relating to XIV FC Grants, amounting to ₹624.08 crore which were submitted in treasury by LSGIs of Kerala between November 2019 to March 2020, were not passed. LSGIs also stated that the delay in drawing funds from Treasury for payment to contractors for completed projects has adversely affected the ongoing projects undertaken by the same contractors. The regulations on treasury transactions put in force by the State Government as pointed out by the selected LSGIs during 2019-20 are detailed below:
In April 2019, the State Government imposed treasury restrictions on payment above ₹ five lakh and necessitated mandatory ways and mean (WAMS) clearance on such payment. The limit on WAMS clearance was enhanced from ₹ five lakh to ₹ one crore in May 2019.
In June 2019, the State Government decided to clear the bills of various Government department only after getting requisite instructions from the Finance Department.
In October 2019, the limit on WAMS clearance was reduced to ₹10 lakh and any amount above this limit required mandatory W&M clearance from Finance Department.
In February 2020, the State Government decided to clear the bills/ cheques of various departments from treasury only upto ₹50,000/- till further orders.
In March 2020, the State Government issued orders that all bills submitted after 27th of March 2020 would be placed under treasury queue and would be cleared in the succeeding year.
XIV FC Grants received from GoI was intended to timely flow to the LSGIs enabling them to plan and execute the work better. Hence, the restrictions/ regulations imposed on treasury transactions at regular intervals should not have been applied for XIV FC grants for LSGIs. Even though, XIV FC Grants for LSGIs to a tune of ₹2,206.77 crore was retained by the State Government, the cash balance in the treasuries at the end of the year

State Finances Audit Report for the year ended 31 March 2020
36
2019-20 was only ₹36.18 crore. Thus, it is apparent that the unspent balances in the XIV FC Grants were utilised by the State Government for other purposes.
Irregular placing of LSGI bills in treasury queue The Bills submitted at treasuries at the end of March every year were shifted to treasury queue as per the orders (March 2018, March 2019 and March 2020) issued by the State Government every year. The queued bills are intended to be cleared in the subsequent financial year. As per the data furnished by Information Kerala Mission11 (IKM), State Government had kept LSGI Bills related to XIV FC Grants amounting to ₹944.63 crore under the treasury queue during the period 2017-18 to 2019-20 which included ₹624.08 crore (66.07 per cent) in 2019-20 alone. Test check conducted by Audit on 10 LSGIs revealed that the bills submitted in treasury from November 2019 onwards were placed under treasury queue, despite having unspent balances of XIV FC Grants amounting to ₹2,206.77 crore with the State Government. Keeping LSGI Bills under Treasury queue system as early as in November has deprived the LSGIs from timely utilisation of XIV FC Grants. The amount released as XIV FC Grants for LSGI’s should not have been placed under treasury queue, since there was sufficient balance and XIV FC Grant should have been used only for the purpose for which it was given to State Government.
Delayed receipt of XIV FC Grants by LSGIs
The State Government allocates XIV FC Grants to LSGIs by issuing relevant orders within the prescribed time limit of 15 days on receipt of the same from GoI and furnishes Utilisation Certificate (UC) to GoI. However, the actual receipt of XIV FC Grants by the LSGIs materialise only when the bills submitted by the LSGIs are cleared at treasury for payment. Audit scrutiny of records for the period 2017-18 to 2019-20 in 10 test checked LSGIs revealed that the bills submitted at treasury for payment which were kept under treasury queue were passed in the succeeding year using the LSGI funds for that year. It was observed that there was a delay ranging from two to 12 months in passing the bills from the date of submission of the bill in the treasury to the date of passing of the bill therein. These delayed receipts of XIV FC Grants by LSGIs are in contravention to the instructions contained in guidelines issued by GoI which stipulates that the States should release the XIV FC Grants to the LSGIs within 15 days on receipt of the same from GoI.
LSGI (Queue) Bills pertaining to XIV FC period passed from XV FC Grants The LSGI bills which were kept under treasury queue by the State Government were passed in the succeeding year using the LSGI funds for that year. Audit in test checked LSGIs revealed that 1128 queued bills amounting to ₹104.41 crore for the year 2019-20 were passed in the year 2020-21 by debiting the Head of Account 11 Information Kerala Mission (IKM), an autonomous institution under Local Self Government Department, Government of Kerala, setup with a mandate to strengthen the local self-governance through Information and Communication Technological applications.

Chapter II – Finances of the State
37
‘3604-00-200-85-XV Expansion and Development under XV FC Recommendations’. Meeting the expenditure pertaining to XIV FC period from XV FC Grants despite having unspent balances of ₹2,206.77 crore during the XIV FC period is not in order.
Reduction in release of XIV FC recommended Performance Grant to LSGIs The XIV FC recommended that 10 per cent of the allocated amount be released to Rural Local Bodies (RLBs) as Performance Grant (PG) on fulfillment of two eligibility conditions, namely submission of audited accounts relating to the year not earlier than two years preceding the year in which the RLBs seek to claim PG and increase in Own Source Revenue (OSR) over the preceding year as reflected in the audited accounts. After disbursement of PG to the eligible RLBs, the undisbursed amount, if any, should be distributed on equitable basis among all the eligible RLBs. Out of 941 RLBs 827 fulfilled the eligibility conditions recommended by XIV FC and received the eligible share of PG from GoI for the year 2016-17. However, for claiming the PG of 2017-18, only 170 RLBs could fulfill the required eligibility conditions as 771 RLBs failed to increase their own source revenue over the previous year. As per the guidelines, after disbursement of PG to the eligible RLBs, the undisbursed amount was to be distributed on equitable basis among all the eligible RLBs. Ministry of Panchayati Raj (MoPR), GoI in January 2019 imposed an additional condition in which the eligible RLBs are entitled to receive PG up to a maximum of five times the Basic Grant allocated during the year of claim. Consequently, PG of 2017-18 related to 771 ineligible RLBs could not be distributed further to eligible RLBs. As such, the PG claimed by the State for RLBs was limited to ₹79.58 crore as against the award amount of ₹89.16 crore recommended by XIV FC. Thus, the failure of RLBs to increase their own source revenue over the preceding year in audited accounts of 2015-16 for claiming PG for the year 2017-18 curtailed the share of PG due to the State by ₹9.58 crore. The State Government replied that the decline in collection of property tax arrears in 2017-18 as compared to 2016-17 had resulted in drop in the own source revenue. The reply is not tenable since the arrears occurred due to lapse on the part of LSGIs in timely collection of revenue.
Excess expenditure incurred by State due to delay in transfer of Basic Grant to LSGI As per the guidelines issued (October 2015) by GoI, XIV FC Grants should be transferred to the LSGIs within 15 days of it being credited to the account of State Government. Any delay will require the State Government, to release the amount to LSGIs, with interest, at bank rate of RBI, for the number of days of delay from the own funds of State Government.

State Finances Audit Report for the year ended 31 March 2020
38
GoI released Basic Grant of ₹542.365 crore for 2019-20 to the State on 6/6/2019. The State Government allocated the Basic Grant to RLBs in two parts, ₹216.946 crore on 30/5/201912 and ₹325.419 crore on 26/6/2019. There was a delay of five days in issuing orders by State Government for allocating the 2nd part of Basic Grant to RLBs. As a result, the State Government had to allocate an excess amount of ₹26.75 lakh to LSGIs as interest at bank rate of RBI, for the number of days of delay. State Government allocated the interest amount to the LSGIs under the head of account ‘3604-00-200-90-(05)-35 Expansion and Development under XIV Finance Commission Recommendations’ instead of meeting the expenditure from its own fund as per XIV FC guidelines. The State Government replied that the interest amount was met from the head of account intended for the release of XIV FC Grants to avoid complexities. The reply is not acceptable since the above head of account is specifically meant for releasing XIV FC Grants to RLBs and such expenditure is necessarily to be met from State’s own fund.
Utilisation of XIV FC Grants in respect of LSGIs for non-basic services/ ineligible works
As per the recommendation of XIV FC, GoI issued (October 2015) guidelines emphasizing the utilisation of XIV FC Grants only on basic services such as water supply, sanitation including septic management, sewage and solid waste management, storm drainage, maintenance of community assets, roads, footpaths, street lighting, burial and cremation grounds. Subsequently, Ministry of Panchayati Raj issued (December 2015) the negative list of activities which cannot be undertaken using XIV FC Grants. The State Government also issued orders (January 2016) stipulating the projects on basic services as specified in GoI guidelines. Audit of test checked LSGIs revealed that out of 5,198 projects for ₹54,352 lakh taken up during the period 2015-16 to 2019-20, 86 projects amounting to ₹2,912.51 lakh involving non-basic services/ ineligible works were undertaken by LSGIs as shown in Table 2.13. Of this ₹858.54 lakh was spent in 12 projects funded under other schemes such as Pradhan Mantri Awas Yojana, Sarva Shiksha Abhiyan, Integrated Child Development Programme etc., These schemes were under the negative list.
12 Amount was released as a part of development fund to RLBs prior to receipt of XIV FC Grants from GoI

Chapter II – Finances of the State
39
Table 2.13: XIV FC Grants utilised for non-basic services/ ineligible works by LSGIs (₹ in lakh)
Sl No.
LSGIs PMAY* / JNAY
SSA*** ICDS (SNP)
State Housing Projects
LAR** case amount
Repayment of Loan
Others****
Total
Trivandrum District 1 Trivandrum
Corporation - - - 264.40
(5) 122.63
(2) 64.21
(2) 451.24
(9) 2 Neyyattinkara
Municipality 345 (2)
- - 446.45 (6)
90.27 (1)
28.42 (1)
910.14 (10)
3 Nedumangad Municipality
218 (2)
- - 4.50 (1)
- 4.49 (1)
21.62 (5)
248.61 (9)
4 Parassala GP - - - 54.05 (4)
- - 54.05 (4)
5 Peringamala GP 30 (1)
- - 69.60 (8)
- - 0.65 (1)
100.25 (10)
Kollam District 6 Kollam
Corporation 102.56
(2) - 0.97
(1) 26.76
(3) - 405.58
(1) 45.50
(4) 581.37
(1) 7 Punalur
Municipality 100 (1)
- - 6 (2)
57.61 (1)
- 163.61 (4)
8 Karunagappally Municipality
36.48 (1)
20 (1)
6.50 (2)
48.30 (4)
- 1.50 (1)
90.96 (12)
203.74 (21)
9 Kulathupuzha GP
- - - 193.25 (7)
- - 6.25 (1)
199.50 (8)
10 Chithara GP - - - - - - - - Total 832.04
(9) 20 (1)
7.47 (3)
1113.31 (40)
270.51 (4)
439.99 (4)
229.19 (25)
2912.51 (86)
Source: Data collected from test checked LSGIs The figures in parenthesis shows the number of projects *Pradhan Mantri Awas Yojana/ Jawaharlal Nehru Awas Yojana,**Land Acquisition related cases***Sarva Shiksha Abhiyan, ****includes payment of Electricity and water Charges, Cattle feed scheme, purchase of medicines for hospitals etc.
Kollam Municipal Corporation replied (December 2020) that due to shortage of funds under other Heads of Account assigned to LSGIs by the State Government, the LSGI resorted to utilise the XIV FC Grants. The reply is not acceptable as XIV FC Grants are solely meant for providing unconditional support to the LSGIs for delivering basic services and cannot be utilised for any other purpose.
2.3.3. Capital Receipts Capital receipts comprise miscellaneous capital receipts such as proceeds from disinvestments, recoveries of loans and advances, debt receipts from internal sources (market loans, borrowings from financial institutions/commercial banks) and loans and advances from GoI. Table 2.14 shows the trends in growth and composition of net Capital Receipts.
-

State Finances Audit Report for the year ended 31 March 2020
40
Table 2.14: Trends in growth and composition of Capital Receipts (₹ in crore)
Sources of State's Receipts 2015-16 2016-17 2017-18 2018-19 2019-20 Capital Receipts 19839 24180 30614 33904 60811 Miscellaneous Capital Receipts
28 30 29 47 27
Recovery of Loans and Advances
153 292 351 211 377
Public Debt Receipts 19658 23858 30234 33446 60407 Internal Debt * 19127 23006 29789 32994 58256 Growth rate 7.72 20.28 29.48 10.75 76.56 Loans and advances from GoI
531 852 445 452 2151
Growth rate -29.38 60.45 47.76 1.57 375.66 Rate of growth of debt Capital Receipts ( in per cent)
6.21 21.37 26.72 10.62 80.61
Rate of growth of non-debt capital receipts( in per cent)
19.08 77.90 18.01 -32.11 56.59
Rate of growth of GSDP ( in per cent)
9.64 12.97 10.51 12.64 8.15
Source: Finance Accounts and for GSDP– Official website of Economics and Statistics department, *Including gross figure under Ways and Means Advances
During the year 2019-20 the capital receipts (₹60,811 crore) increased by ₹26,907 crore as compared to the previous year (₹33,904 crore). During 2019-20, capital receipts increased by 79.36 per cent over the previous year primarily due to increase of 80.61 per cent in public debt receipts. The share of public debt receipts to capital receipts stood at 99.33 per cent in 2019-20. The Internal debt (₹58,256 crore) includes open market borrowings (₹18,073 crore), other borrowings from financial institutions like National Bank for Agriculture and Rural Development (₹637 crore), National Co-operative Development Corporation (₹165 crore), Punjab National bank (₹342 crore), Special Securities issued to National Small Savings Fund (₹3,294 crore) and ways and means advance from RBI (₹35,745 crore). Loans and advances from GoI fluctuated widely during 2015-20 and were highest at ₹2,151 crore in 2019-20. These loans of ₹2,151 crore had been received for externally aided projects namely, Dam Rehabilitation Improvement project (₹63 crore), Second Kerala Rural Water Supply and Sanitation Project (₹78 crore), Kerala State Transport Project (₹81 crore), Additional Skill Improvement for Post Basic Education (₹91 crore), Climate Friendly Urban Mobility Water Transport, Kochi (₹58 crore) and First Resilient Program Development Policy Financing (₹1,780 crore).

Chapter II – Finances of the State
41
2.3.4 State’s performance in mobilisation of resources As the State’s share in central taxes and grants-in -aid is determined on the basis of recommendations of the Finance Commission, the State’s performance in mobilisation of resources is assessed in term of its own resources comprising own tax and non-tax sources. The State’s actual tax and non-tax revenue for the year 2019-20 vis-à-vis assessments made by XIV FC and Budget Estimate are presented in Table 2.15 below.
Table 2.15 : Tax and Non-Tax receipts vis-à-vis projections (₹ in crore)
Source: Finance Accounts of respective years The actual tax revenue of the State in 2019-20 stood significantly lower than the projections made in the XIV FC, and Budget estimates. The actual tax revenue was lower than budget estimates due to less collection of State Goods and Service Tax (₹8,564 crore), Taxes on Sales, Trade, etc. (₹4,298 crore), Taxes on Vehicles (₹999 crore) and Stamps and registration fees (₹872 crore) and State Excise (₹728 crore). Actual non-tax revenue was lower than the budget estimates but higher than XIV FC projections.
2.4 Application of resources The State Government is vested with the responsibility of incurring expenditure within the framework of fiscal responsibility legislations, while at the same time ensuring that the ongoing fiscal correction and consolidation process of the State is not at the cost of expenditure directed towards development of capital infrastructure and social sector. 2.4.1 Growth and Composition of expenditure Capital Expenditure: All charges for the first construction of a project as well as charges for intermediate maintenance until the project is commissioned and charges for such further additions and improvements as may be sanctioned under the rules made by competent authority shall be classified as Capital expenditure.
Revenue Expenditure: Charges on maintenance, repair, upkeep and working expenses, which are required to maintain the assets in a running order as also all other expenses incurred for the day to day running of the organisation, including
FC Projections
Budget Estimates
Actual Percentage variation of actual over Budget Estimates
FC Projections
Own Tax Revenue 78865 65785 50323 (-)23.50 (-)36.19 Non Tax Revenue 10601 15070 12265 (-)18.61 15.70 Total 89466 80855 62588 (-)22.59 (-)30.04

State Finances Audit Report for the year ended 31 March 2020
42
establishment and administrative expenses shall be classified as revenue expenditure.
The trends in total expenditure (aggregate of revenue, capital and loans and advances expenditure) and various components of total expenditure-Plan and Non-Plan revenue expenditure, committed expenditure such as salaries and wages, interest payments, pension payments and subsidies, financial assistance to local bodies, etc., are discussed in the succeeding paragraphs. Overall expenditure and its components along with their percentage of GSDP are given in the Table 2.16. Table 2.16 Total expenditure and its composition (₹ in crore)
Parameters 2015-16 2016-17 2017-18 2018-19 2019-20 Total Expenditure (TE) 87032 102382 110238 120070 114385 Revenue Expenditure (RE) 78690 91096 99948 110316 104720 Capital Expenditure (CE) 7500 10126 8749 7431 8455 Loans and Advances 842 1160 1541 2323 1210 GSDP 561994 634886 701577 781653 854689 As a percentage of GSDP TE/GSDP 15.49 16.13 15.71 15.36 13.38 RE/GSDP 14.00 14.35 14.25 14.11 12.25 CE/GSDP 1.33 1.59 1.25 0.95 0.99 Loans and advances/GSDP 0.15 0.18 0.22 0.30 0.14
Source: Finance Accounts of respective years
The total expenditure of the State increased by 31.43 per cent from ₹87,032 crore in 2015-16 to ₹1,14,385 crore in 2019-20. During the year, it decreased by 4.73 per cent over the previous year mainly due to decrease in revenue expenditure. As a percentage of GSDP, the total expenditure remained in the range 15 per cent to 16 per cent during 2015-16 to 2018-19 and decreased to 13.38 per cent during 2019-20.
In terms of activities, the total expenditure is composed of expenditure on General Services including Interest Payments, Social Services, Economic Services and Others. Relative share of these components in the Total Expenditure of ₹1,14,385 crore during 2019-20 is given in Table 2.17. Table 2.17 : Relative share of various sectors of expenditure (in per cent)
Parameters 2015-16 2016-17 2017-18 2018-19 2019-20 General Services 41.76 40.44 41.54 42.50 48.66 Social Services 32.91 34.24 33.82 33.31 30.72 Economic Services 19.88 18.83 16.71 14.85 14.26 Others(Grants to Local Bodies and Loans and Advances)
5.45 6.49 7.93 9.34 6.36
Source: Finance Accounts of respective years

Chapter II – Finances of the State
43
Chart 2.9 : Total Expenditure - Trends in share of its components
Chart 2.10 : Total Expenditure - Expenditure by activities
The Capital expenditure of the State increased from 6.19 per cent in 2018-19 to 7.39 per cent in 2019-20.
While relative share of General Services in total expenditure increased, share of Social Services and Economic Services decreased during 2019-20 when compared to 2018-19.
2015-16 2016-17 2017-18 2018-19 2019-20
90.42 88.98 90.67 91.88 91.55
8.62 9.89 7.94 6.19 7.390.97 1.13 1.4 1.93 1.06
(in p
er c
ent)
Revenue Expenditure Capital Expenditure Loans and Advances
0
10
20
30
40
50
60
70
80
90
100
2015-16 2016-17 2017-18 2018-19 2019-20
41.76 40.44 41.54 42.548.66
32.91 34.24 33.82 33.3130.72
19.88 18.83 16.71 14.8514.26
5.45 6.49 7.93 9.34 6.36
(in p
er c
ent)
Grants to Local Bodies andLoans and AdvancesEconomic Services
Social Services
General Services

State Finances Audit Report for the year ended 31 March 2020
44
Chart 2.11 : Pie Chart for the composition of expenditure (in percentage)
2.4.2 Revenue Expenditure Revenue expenditure is incurred to maintain the current level of services and payment for the past obligation. As such, it does not result in any addition to the State’s infrastructure and service network. The overall Revenue Expenditure, its rate of growth, its ratio to Total Expenditure and buoyancy vis-a-vis GSDP and Revenue Receipts are indicated in Table 2.18 and the sectoral distribution of Revenue expenditure pertaining to 2019-20 is given in Chart 2.12.
Table 2.18: Revenue expenditure – basic parameter (₹ in crore)
Particulars 2015-16 2016-17 2017-18 2018-19 2019-20 Total Expenditure(TE) 87032 102382 110238 120070 114385 Revenue expenditure (RE) 78690 91096 99948 110316 104720 Rate of Growth of RE(per cent) 9.68 15.77 9.72 10.37 -5.07 Revenue expenditure as percentage to TE 90.42 88.98 90.67 91.88 91.55
RE/GSDP(per cent) 14.00 14.35 14.25 14.11 12.25 RE as percentage of RR 113.99 120.48 120.39 118.81 116.07 Buoyancy of Revenue Expenditure with
GSDP(ratio) 1.00 1.22 0.93 0.91 -0.54 Revenue Receipts(ratio) 0.51 1.65 0.99 0.88 1.79
Source: Finance Accounts of respective years
Capital expendiure, 5.34 Grant-in-
aid, 3.83
Economic Services(Revenue),
5.75
Social Services(Revenue),
21.5
General Services(Revenue),
35.04
Loans and advances , 0.76
Repayment of public debt,
27.78

Chapter II – Finances of the State
45
Chart 2.12 : Sector-wise distribution of revenue expenditure (in percentage)
The expenditure pattern of the State revealed that though the rate of growth of revenue expenditure decreased (-5.07 per cent) in the current year, it hovered around 88 to 91 per cent during the period (2015-20) leaving inadequate resources for creation of assets.
The share of Revenue expenditure in total expenditure decreased from 91.88 per cent in 2018-19 to 91.55 per cent in 2019-20 indicating a meagre improvement in priority assigned for capital expenditure during the year.
The Revenue receipts were not sufficient to meet its revenue expenditure during the year. The State had to resort to borrowed funds for meeting the revenue expenditure which is not a good indicator of a prudent fiscal path.
There was increase under General Services by 9.20 per cent (₹4,676.90 crore) and significant decrease under Social Services by 10.90 per cent (₹4,166 crore) and under Economic Services by 26.43 per cent (₹3,272 crore) compared to the previous year.
The buoyancy of revenue expenditure with reference to GSDP however, decreased and turned negative to (-) 0.54 during 2019-20 due to decrease in the rate of growth of revenue expenditure as compared to increase in the rate of growth of GSDP.
2.4.2.1 Major Changes in Revenue Expenditure Table 2.19 details significant variation (₹100 crore and above) under various Heads of Account with regard to Revenue Expenditure of the State during the current year and the previous year.
Organs of State, 1.17 Fiscal Services,
1.78Interest payments
and serving of debt, 18.35
Administrative Services, 5.29
Pension and Miscellanous
General Services, 26.41
Social Services, 32.51
Economic Services, 8.7
Grant in aid Contributions, 5.79

State Finances Audit Report for the year ended 31 March 2020
46
Table 2.19: Variations in Revenue Expenditure during 2019-20 compared to 2018-19 (₹ in crore) Major Head of Account 2018-19 2019-20 Increase (+)/
Decrease(-) 2049 Interest Payments 16747.92 19214.70 +2466.78 2075 Miscellaneous General Services 6528.68 8590.35 +2061.67 2210 Medical and Public Health 6279.50 6742.42 +462.92 2015 Elections 72.01 191.68 +119.67 2245 Relief on account of Natural Calamities 3133.76 221.47 -2912.29 3604 Compensation and Assignments to Local Bodies and Panchayati Raj Institutions
8898.72 6063.87 -2834.85
3054 Roads and Bridges 2343.77 1404.90 -938.87 2401 Crop Husbandry 1774.66 931.04 -843.62 2225 Welfare of Scheduled Castes, Scheduled Tribes, Other Backward Classes and Minorities
2554.93 1942.68 -612.25
2230 Labour, Employment and Skill Development 1266.99 714.47 -552.52 2202 General Education 17607.26 17151.38 -455.88 2851 Village and small industries 544.14 316.73 -227.41 2505 Rural Employment 345.53 170.10 -175.43 2501 Special Programmes for Rural Development 263.97 101.05 -162.92 2408 Food, Storage and Warehousing 1349.11 1190.81 -158.30 2435 Other Agricultural Programmes 392.57 255.20 -137.37
Source: Finance Accounts of respective years
Reasons for major variations in Revenue Expenditure is as detailed:
Increase under the head Interest payment is mainly due to increase in interests on Market Loans, other Savings Deposits, Insurance & Pension fund, State Provident Funds, Small Savings, Provident Funds etc. This was partly offset by decrease under Interest on other Internal Debts and Interest on State Plan Loans Consolidated in terms of recommendations of the XII Finance Commission.
Increase in Miscellaneous General Services is mainly due to increase under Other Expenditure and State Lotteries.
The decrease in expenditure under Relief on account of Natural Calamities is mainly due to decrease under the sub head ‘Transfer to Reserve Funds and Deposit Accounts-State Disaster Response Fund'.
Compensation and Assignments to Local Bodies and Panchayati Raj Institutions decreased mainly due to decrease under the head 'Other Miscellaneous Compensations and Assignments'.

Chapter II – Finances of the State
47
Decrease under the head Roads and Bridges is due to decrease under the sub heads 'General’, ‘Transfer to Reserve Funds/ Deposit Accounts under 'Roads of Inter State or Economic importance', 'District and Other Roads', 'State Highways' and ‘National Highways'.
Decrease under the head Crop Husbandry due to decrease under the sub heads 'Scheme of Small/Marginal Farmers and Agricultural Labour, 'Other Expenditure', 'Extension of farmers training, 'Horticulture and vegetable crops' and 'Food Grain Crops’.
Decrease under the major head ‘2225’ was due to decreased expenditure under 'Welfare of Scheduled Castes', 'Welfare of Backward Classes', 'Welfare of Scheduled Tribes', 'Welfare of Minorities'.
Decrease under the head Labour, Employment and Skill Development was due to decrease in expenditure under 'Labour' and 'Employment Service' however this was partly offset by increase under 'Training'.
2.4.2.2 Committed Expenditure The committed expenditure of the State Government on revenue account consist of interest payments, expenditure on salaries and wages and pension. It has first charge on Government resources. Though the KFR Act, 2003 prescribes that there should be a Revenue Surplus, it is challenging to achieve it, given that a large proportion of Revenue Expenditure goes into committed items like Salaries and wages, interest payments and pension. Table 2.20 presents the trends in the components of committed expenditure during 2015-16 to 2019-20. Percentage of component wise committed expenditure in Revenue Expenditure and the balance revenue expenditure during 2015-16 to 2019-20 is given in Chart 2.13.
Table 2.20: Components of Committed Expenditure (₹ in crore) Components of Committed Expenditure
2015-16 2016-17 2017-18 2018-19 2019-20
Salaries & Wages* 23757 28373 32243 32521 32942 Expenditure on Pensions 13063 15277 19938 19012 19064 Interest Payments 11111 12117 15120 16748 19215 Total 47931 55767 67301 68281 71221 As a percentage of Revenue Receipts (RR) Revenue Receipts(RR) 69033 75612 83020 92854 90225 Salaries & Wages 34.41 37.52 38.84 35.02 36.51 Expenditure on Pensions 18.92 20.20 24.02 20.48 21.13 Interest Payments 16.10 16.03 18.21 18.04 21.30 Total 69.43 73.75 81.07 73.54 78.94

State Finances Audit Report for the year ended 31 March 2020
48
Components of Committed Expenditure
2015-16 2016-17 2017-18 2018-19 2019-20
As a percentage of Revenue Expenditure (RE) Revenue expenditure (RE) 78690 91096 99948 110316 104720 Salaries & Wages 30.19 31.15 32.26 29.48 31.46 Expenditure on Pensions 16.60 16.77 19.95 17.23 18.20 Interest Payments 14.12 13.30 15.13 15.18 18.35 Total 60.91 61.22 67.34 61.90 68.01
Source: Finance Accounts *Salaries include teaching grant paid to aided educational institutions like schools and colleges to meet the salaries of their teaching and non-teaching staff.
Chart 2.13: Share of Committed expenditure in total Revenue Expenditure
Committed expenditure constituted over 68 per cent of the revenue expenditure of the State in 2019-20, while it accounted for over 78 per cent of the revenue receipts during the year. As a percentage of revenue expenditure, the committed expenditure showed an upward trend from 2015-16 to 2017-18 though it decreased in 2018-19 there was an increase in the year 2019-20. An increasing trend in the committed expenditure leaves the Government with lesser flexibility for development sector. Salaries and wages Expenditure on Salaries & wages and its share in the Revenue Expenditure shows an increasing trend from 2015-16 to 2017-18, though it decreased to 29.48 per cent in 2018-19, it increased to 31.46 per cent in 2019-20.
30.19
31.15
32.26
29.48
31.46
16.6
16.77
19.95
17.23
18.2
14.12
13.3
15.13
15.18
18.35
39.09
38.78
32.66
38.11
31.99
0% 10% 20% 30% 40% 50% 60% 70% 80% 90% 100%
2015-16
2016-17
2017-18
2018-19
2019-20
Salaries Pension Interest Payment Non Committed expenditure

Chapter II – Finances of the State
49
Interest Payments Interest payments increased from ₹11,111 crore in 2015-16 to ₹ 19,215 crore in 2019-20. Interest payments increased by 14.73 per cent in 2019-20 over the previous year due to increased interest liability of ₹1,164 crore on market loans. During 2019-20, interest payment on market loans was 58.08 per cent of the total interest payments while interest on Small Savings, Provident Fund etc stood at 30.64 per cent of the total interest payments. The expenditure on interest payment as percentage of revenue receipts increased from 16.10 per cent in 2015-16 to 21.30 per cent in 2019-20. Pensions The expenditure during the year on pension and other retirement benefits to State Government employees was ₹19,064 crore (18.20 per cent of Revenue Expenditure) showing an increase of ₹52 crore when compared to ₹19,012 crore for the year 2018-19. 2.4.2.3 Undischarged liabilities in National Pension System The Government of India introduced the Defined Contribution Pension Scheme namely ‘National Pension System’ to its employees recruited after 01 January 2004. The Government of Kerala introduced the National Pension System(NPS) applicable to all new entrants joining to State Government Service on or after 01 April 2013. As per the guidelines of the Scheme, the employee contributes 10 per cent of his basic pay and dearness allowance every month which is matched by the State Government. Both employees’ and employer’s contribution are initially transferred to the Public Account (Major Head 8342-117- Defined Contribution Pension Scheme). The State Government has the responsibility to deposit the entire amount to the designated fund manager through National Securities Depository Limited (NSDL)/Trustee Bank. During the year 2019-20, an amount of ₹835.38 crore (₹417.69 crore on account of Government’s contribution including backlog contribution of ₹42.72 crore and ₹417.69 crore as share of employee contribution including backlog contribution of ₹42.72 crore) was credited to MH 8342-117 Defined Contribution Pension Scheme. Out of total balances of ₹835.65 crore, the State Government transferred/ remitted ₹835.31 crore to NSDL, leaving a balance of ₹0.34 crore under the head of account as on 31 March 2020. The interest outstanding to the Fund since its inception has not been estimated. Uncollected, unmatched and untransformed amounts, with accrued interest, represent outstanding liabilities under the New Pension Scheme.

State Finances Audit Report for the year ended 31 March 2020
50
2.4.2.4 Subsidies Expenditure on subsidies decreased by 14.07 per cent from ₹1,663 crore in 2018-19 to ₹1,429 crore in 2019-20. The subsidies as a percentage of both Revenue Receipts and Revenue Expenditure shows a decreasing trend in the past four years. In absolute terms, the expenditure on payment of Subsidies decreased by ₹234 crore during the year when compared to the previous year as detailed in Table 2.21 below.
Table 2.21 : Expenditure on subsidies during 2015-2020
(₹ in crore)
2015-16 2016-17 2017-18 2018-19 2019-20
Subsidies 1372 1731 1584 1663 1429 Revenue Receipts 69033 75612 83020 92854 90225 Revenue Expenditure 78690 91096 99948 110316 104720 Subsidies as a percentage of Revenue Receipts 1.99 2.29 1.91 1.79 1.58
Subsidies as a percentage of Revenue Expenditure 1.74 1.9 1.58 1.51 1.36
Source: Finance Accounts of respective years
The main items of subsidies given during the year 2019-20 included Ration Subsidy (₹579.03 crore), Paddy Procurement through Kerala State Civil Supplies Corporation and Other Agencies (₹466.22 crore), Grant to Kerala State Civil Supplies Corporation Limited for market intervention operations (₹130.66 crore), Interest Subsidy to KURDFC towards the loan availed from HUDCO for the implementation of Life-Parppida Mission (₹50.81 crore).
2.4.2.5 Financial assistance to Local Bodies and Other Institutions The assistance provided by the Government as grants and loans to local bodies, educational institutions, Government companies, Welfare Fund Boards, etc., during the current year relative to the previous years is presented in Table 2.22.
Table 2.22: Financial assistance to local bodies, educational institutions, etc. (₹ in crore)
Financial Assistance to Institutions
2015-16 2016-17 2017-18 2018-19 2019-20
(A) Local Bodies Municipal Corporation and Municipalities
1405.77 2756.55 3178.62 3287.46 2296.24
Panchayati Raj Institutions 7767.62 7775.98 11335.87 10426.56 5711.11 Total (A) 9173.39 10532.53 14514.49 13714.02 8007.35 (B) Others

Chapter II – Finances of the State
51
Financial Assistance to Institutions
2015-16 2016-17 2017-18 2018-19 2019-20
Educational Institutions (Aided Schools, Aided Colleges, Universities etc)
8409.89 9602.98 16511.23 11532.60 11410.11
Development Authorities 5.91 14.73 20.91 16.93 6.51 Hospital and Other Charitable Institutions
407.60 812.18 686.29 696.91 256.47
Other Institutions 2104.35 2927.71 3196.28 5526.36 2511.83 Total (B) 10927.75 13357.6 20414.71 17772.8 14184.92 Total (A +B) 20101.14 23890.13 34929.20 31486.82 22192.27 Revenue Expenditure 78690 91096 99948 101316 104720 Assistance as percentage of Revenue Expenditure
26 26 35 29 21
Source: Finance Accounts of respective years
The financial assistance to local bodies and other institutions decreased from ₹31,486.82 crore in 2018-19 to ₹22,192.27 crore in 2019-20. The table above shows that the percentage of assistance with reference to revenue expenditure was 21 per cent during 2019-20. Substantial decrease was noticed in the release of Grants in respect of Educational institutions and Zilla Parishads and Other Panchayat Raj Institutions during 2019-20 compared to the previous year.
2.4.3 Capital Expenditure Capital Expenditure includes primarily expenditure on creation of fixed infrastructure assets, such as buildings, roads, bridges etc.
Chart 2.14: Capital expenditure in the State
The Capital Expenditure constituted 7.39 per cent of the total expenditure for the year 2019-20, showing an increase of 1.20 per cent when compared to the year
7500
101268749
74318455
8.62
9.89
7.93
6.197.39
0
2000
4000
6000
8000
10000
12000
2015-16 2016-17 2017-18 2018-19 2019-200
2
4
6
8
10
12
(₹ in
cro
re)
(Per
cent
)
Capex Capex as percentage of total expenditure

State Finances Audit Report for the year ended 31 March 2020
52
2018-19 (6.19 per cent) and a decrease of 1.23 per cent to the year 2015-16 (8.62 per cent). The capital expenditure of the State increased by 13.78 per cent (₹1,024 crore) during the year. The increase was mainly under the Economic Services Sector (32.28 per cent). The expenditure in the Social Services sector decreased by 38.87 per cent and in the General Services sector decreased by 20.48 per cent.
2.4.3.1 Major changes in Capital Expenditure Significant variations under various Heads of Account with regard to capital expenditure of the State during the current year and the previous year is given in the Table 2.23. Table 2.23: Capital expenditure during 2019-20 compared to 2018-19
(₹ in crore) Major Heads of Account 2018-19 2019-20 Increase (+)/
Decrease(-) 5475 Capital Outlay on Other General Economic Services 1611.40 2217.22 605.82 4515 Capital Outlay on other Rural Development Programmes
316.95 916.32 599.37
5053 Capital Outlay on Civil Aviation -220.00 238.17 458.17 5054 Capital Outlay on Roads and Bridges 1846.63 2302.80 456.17 4215 Capital outlay on Water Supply and Sanitation 538.94 271.58 -267.36 4202 Capital Outlay on Education, Sports, Art and Culture
472.66 311.15 -161.51
5051 Capital Outlay on Ports and Light Houses 163.08 60.40 -102.68 4235 Capital Outlay on Social Security and Welfare 121.14 29.82 -91.32
Source: Finance Accounts of respective years Out of the total capital expenditure of ₹8,455 crore, 53 per cent was incurred on Capital Outlay on Roads and Bridges (27 per cent) and Other General Services sectors (26 per cent) followed by 11 per cent on Other Rural Development Programmes.
2.4.3.2 Quality of Capital Expenditure This section presents an analysis of investments and other capital expenditure undertaken by the Government. Quality of Investments in the Companies, Corporations and other bodies In the post-Fiscal Responsibility and Budget Management framework, the State is expected to keep its fiscal deficit (and borrowings) not only at low levels but also meet its capital expenditure/investment (including loans and advances) requirements from its own sources of revenue. In addition, in a transition to complete dependence on market-based resources, the State Government is required

Chapter II – Finances of the State
53
to initiate measures to earn adequate returns on its investments and recover its cost of borrowed funds rather than bearing the same on its budget in the form of implicit subsidies. This section presents the broad financial analysis of investments and other capital expenditure undertaken by the Government during the current year vis-à-vis previous years. As per Finance Accounts 2019-20, the State Government had invested ₹8,881.70 crore in three Statutory Corporations, 117 Government Companies, 40 Joint Stock Companies and various co-operatives. The average rate of return on these investments was 1.42 per cent in the last five years while the rate of interest paid by the Government on its borrowings during 2015-16 to 2019-20 is 7.58 per cent.
Table 2.24: Return on investments
Investment/Return/Cost of Borrowings 2015-16 2016-17 2017-18 2018-19 2019-20
Amount of Investment (₹ in crore) 6733.85 7240.03 8211.47 8322.38 8881.70
Return (₹ in crore) 90.23 96.37 126.48 132.12 100.33 Return (per cent) 1.34 1.33 1.54 1.59 1.13 Average rate of interest on Government borrowing (per cent)13
7.35 6.92 7.48 7.34 7.58
Difference between interest rate and return (per cent) 6.01 5.59 5.94 5.75 6.45
Source: Finance Accounts of respective years
Progressive expenditure on investments was increased by ₹12.50 crore under Government companies and decreased by ₹27.48 crore (due to proceeds of retirement of share capital transferred to capital receipts) under Co-operative banks and societies. Table 2.25 : Investment made in companies, whose net worth is completely eroded
(₹ in crore) Company/Corporation Net
worth as on
Investment made during the year
Cumulative investment as on 31 March 2020
Meat Products of India Limited -21.83 0.34 1.82
The Kerala State Cashew Development Corporation Limited -798.94 14.70
506.04
Total 15.04
Source: Data collected from commercial audit wing and Finance Accounts
13 Interest Received/(Amount of previous year’s Fiscal Liabilities + Current year’s Fiscal liabilities)/2)*100

State Finances Audit Report for the year ended 31 March 2020
54
During 2019-20, State Government invested ₹110 crore in Statutory Corporation, ₹145.60 crore in Government Companies, ₹238.16 crore in Joint Stock Company and ₹55.53 crore in Co-operative Banks and Societies. Nine out of 18 Government Companies in which an amount of ₹292.68 crore was invested during the year are loss making. The total investment of the Government upto 31 March 2020 in these nine loss making Companies is ₹2,276.53 crore. Details of investments made in loss making companies is given in Table 2.26 below.
Table 2.26: Investments made in loss making companies (₹ in crore)
Source: Data collected from commercial audit wing and Finance Accounts
If the State Government keeps on making investments in loss making government companies there are no chances of return on investment. Investment made in Companies which are loss making and those where net worth is completely eroded, affect quality of capital expenditure.
Irregular booking of investment made by the Government The State Government released ₹15 crore to Indian Institute of Information Technology -Kerala, (IIIT-K) for the construction of building and infrastructure development of permanent campus. The fund was released with an instruction to IIIT-K, to issue share certificate to the State Government for the whole up-to date paid up capital. The amount drawn as additional authorisation was booked under the head of account 4859-02-004-97 - Research and Development instead of 4859-
Corporations/Companies Loss after tax and interest
Year of accounts
Investment made during 2019-20
Cumulative investment as on 31.03.2020
Kerala Tourism Development Corporation limited 7.35 2014-15 4.58 117.6 The Kerala State Development Corporation for Scheduled Caste and Scheduled Tribes Limited 6.21 2017-18 21.40 192.58 The Kerala State Film Development Corporation Limited 0.63 2015-16 2.00 55.38 Kerala Shipping and Inland Navigation Corporation Limited 1.15 2017-18 3.00 66.67 Kerala State Development Corporation for the Welfare of Christian Converts from Scheduled Castes and the Recommended Communities limited 0.35 2012-13 7.00 67.05 Meat Products of India Limited 3.75 2016-17 0.34 1.82 Vision Varkala Infrastructure Development Corporation Limited 0.35 2017-18 1.50 12.23 Kannur International Airport Limited 0.52 2015-16 238.16 1257.16 The Kerala State Cashew Development Corporation Limited 0.35 2017-18 14.70 506.04 Total 292.68 2276.53

Chapter II – Finances of the State
55
02-190-94 -Investment in Public Sector Undertakings. As per Notes to Accounts, no reply was furnished by the State Government on the matter cited.
Loans and Advances by the State In addition to investments in Statutory Corporations, Government Companies, Joint Stock Companies and Co-operative Societies, the Government also provides loans and advances to these institutions. Table 2.27 presents the status of loans and advances disbursed, repayments and interest received vis-à-vis interest paid by the State Government on its borrowings during 2015-2020.
Table 2.27: Quantum of loans disbursed and recovered during five years (₹ in crore)
Source: Finance Accounts of the respective years Interest received against these loans remained less than one per cent during the period 2015-16 to 2019-20 and was 0.30 per cent during 2019-20 as against the average cost of borrowings of 7.58 per cent during the year. The table indicated that State borrowings were more expensive than the loans advanced by it.
The table also shows that the total outstanding loans and advances increased from 14 Difference of ₹12 crore with reference to previous year’s closing balance was on account of pro forma adjustments vide footnote (q) of Statement no.18 of Finance Accounts 2015-16. 15 Difference of ₹96 crore with reference to previous year’s closing balance was on account of pro forma adjustments vide footnote (p) of Statement no.18 of Finance Accounts 2018-19. 16 Difference of ₹718 crore with reference to previous year’s closing balance was on account of pro forma adjustments vide footnote (q) of Statement no.18 of Finance Accounts 2019-20 17 Includes ₹126 crore being the irrecoverable loans written off. 18 Includes ₹0.40 crore being the irrecoverable loans written off 19 Includes ₹0.30 crore being the irrecoverable loans written off 20 Interest Received/(Opening balance + Closing balance of Loans and Advances)/2)*100
Quantum of Loans disbursed and recovered
2015-16 2016-17 2017-18 2018-19 2019-20
Opening Balance of loans outstanding 1232014 13010 13877 1516315 1655716
Amount advanced during the year 842 1160 1541 2323 1210
Amount recovered during the year 152 29217 351 21118 29519
Closing Balance of the Loans Outstanding 13010 13878 15067 17275 17472
Net addition 690 868 1190 2112 915
Interest received 32 31 38 41 51
Interest rate on loans and Advances given by the Government20 (in per cent)
0.25 0.23 0.26 0.25 0.30
Rate of Interest paid on the Outstanding borrowings of the Government (in per cent) 7.35 6.92 7.48 7.34 7.58
Difference between the rate of interest paid and interest received (per cent)
7.25 6.69 7.22 7.09 7.28

State Finances Audit Report for the year ended 31 March 2020
56
₹17,275 crore in 2018-19 to ₹17,472 crore in 2019-20. Of the total loans advanced during the year (₹1,210 crore), ₹1,189 crore was advanced for economic services, ₹seven crore was advanced for social services, and ₹14 crore was advanced for Miscellaneous purposes and Government Servants. Loans advanced under social services were used for Self-employment scheme for the registered unemployed widows/deserted /divorced/ unmarried woman and unwedded mother. Of the loans advanced under economic services ₹989 crore was provided to Kerala State Road Transport Corporation.
Further, of the total loans advanced during the year (₹1,210 crore), loans amounting ₹1,196 crore were disbursed by the Administrative Departments or Finance Department without setting terms and conditions for repayments of loans and rate of interest payable.
Capital locked in incomplete projects As per Finance Accounts for the year 2019-2020 there are, 295 capital works, each valuing ₹one crore or more, were incomplete on which an expenditure of ₹1,301.53 crore had been incurred. Age-wise and Department-wise details of incomplete projects are given in Table 2.28 and Table 2.29 respectively. Table 2.28: Age profile of incomplete projects as on 31 March 2020
(₹ in crore) Year of Commencement No. of
Incomplete projects
Estimated Cost
Expenditure as on 31 March 2020
Prior to 2010 10 72.72 68.57 2010 14 71.63 52.96 2011 8 46.26 34.28 2012 10 56.04 39.96 2013 16 187.98 171.14 2014 14 464.82 314.86 2015 28 191.75 134.39 2016 73 512.09 273.07 2017 70 397.34 148.77 2018 51 254.51 63.53 2019 1 1 0 Total 295 2256.14 1301.53
Source: Finance Accounts of respective years

Chapter II – Finances of the State
57
Table 2.29: Department-wise profile of incomplete projects as on 31 March 2020 (₹ in crore)
Source: Finance Accounts Physical progress of the projects as on 31 March 2020 ranged between five to 99 per cent. There was delay ranging from one to 29 years in completion of 295 projects/works and this would result in time overrun and cost overrun, and deprive the State of the intended benefits for prolonged periods.
Implementation of Ujwal Discom Assurance Yojana (UDAY)
The Ministry of Power (MoP), Government of India launched (20 November 2015) Ujwal DISCOM Assurance Yojana (UDAY Scheme) for financial turnaround of Power Distribution Companies (DISCOMs). With an objective to improve the operational and financial efficiency of the State DISCOMs, a tripartite Memorandum of Undertaking (MoU) was executed between Ministry of Power (GoI), concerned State Government and State Power Distribution Companies. This scheme facilitated State Governments to take over 75 per cent of DISCOM’s outstanding debt over a period of two years. The outstanding debt of the DISCOMs was taken over in the form of equity, loan and grant/subsidy. The loan extended to DISCOMs under UDAY has to be converted into grant and equity in the subsequent three years. Accordingly, the States have to convert loan into equity and subsidy. In Kerala, a tripartite Memorandum of Understanding (MoU) amongst Ministry of Power, Government of India, Government of Kerala (GoK) and Kerala State Electricity Board Limited (KSEBL) in order to improve operational efficiency was entered into on 15 March 2017. The measures to be taken by KSEBL included activities for improving operational efficiency, and to enable sustainable operations of KSEBL. The MoU did not envisage financial turnaround package. 2.4.3.3 Investments in Government Companies/ Corporations and
budgetary support The State Public Sector Undertakings (SPSUs) in Kerala which consists of State Government Companies and Statutory Corporations are established to carry out
Department No. of Incomplete projects
Estimated Cost
Expenditure as on 31 March 2020
Public Works Department –(Roads including National Highway)
143 887.73 453.77
Public Works Department-(Buildings) 93 348.93 175.43 Public Works Department-(Bridges) 36 577.07 382.21 Irrigation Department-(Irrigation and Minor Irrigation Works)
18 404.89 245.35
Harbour Engineering Department 5 37.51 44.77 Total 295 2256.14 1301.53

State Finances Audit Report for the year ended 31 March 2020
58
activities of commercial nature keeping in view the welfare of the people. The GoK has a financial stake in these companies which is mainly in the form of:
Share Capital and Loans : Share capital contribution and financial assistance by way of loans
Special financial support : Budgetary support by way of grants and subsidies.
Guarantees : For repayment of loans with interest availed by the SPSUs from financial institutions.
It also occupies important place in the State’s economy as the turnover (₹31,507.00 crore21) of these PSUs was about 4.03 per cent of the GSDP of the State for 2018-19. The figures in respect of equity, loans and guarantees outstanding as per the records of the SPSUs should agree with that of the figures appearing in the Finance Accounts of the State. In case the figures do not agree, the PSUs concerned and the Finance Department should carry out reconciliation of the differences. The position in this regard as on 31 March 2019 is given in Table 2.30.
Table 2.30: Equity, loans and guarantees outstanding as per Finance Accounts vis-à-vis records of SPSUs
(₹ in crore)
Sl. No.
Outstanding in respect of
Amount as per Difference Finance Accounts SPSUs
1 Equity 5,702.64 9,248.93 (-) 3,546.29 2 Loans 9,105.53 6,629.35 2,476.18 3 Guarantees 17,451.90 17,415.39 36.51
Source: Compiled based on information received from PSUs and Finance Accounts.
There were differences in respect of one Power Sector PSU and 117 Other than Power Sector PSUs. The major differences were observed in nine22 companies. The Government and the PSUs should take concrete steps to reconcile the differences. The details of stake of the State Government in the SPSUs are brought out in the subsequent paragraphs.
21 Latest finalized accounts as of September 2019. 22 Equity: Kannur International Airport Limited, Cochin Smart Mission Limited, Kerala Social Security
Pension Limited, Kerala State Drugs and Pharmaceuticals Limited and Kerala State Road Transport Corporation. Loans: Kerala Police Housing and Construction Corporation Limited, Roads and Bridges Development Corporation of Kerala Limited, Kerala State Beverages (Manufacturing and Marketing) Corporation Limited, Kerala Urban and Rural Development Finance Corporation Limited and Kerala State Road Transport Corporation.

Chapter II – Finances of the State
59
(i) Share Capital in the SPSUs As per the Report of the C&AG of India on PSUs for the year ended 2019, there are 14023 PSUs in the State under the audit jurisdiction of the C&AG. The State Government invested ₹38,428.09 crore in these PSUs as at the end of March 2019 as furnished by PSUs in their latest finalized accounts. However, as per the Finance Accounts, there are 110 Government Companies and Statutory Corporations where the Government has invested ₹14,808.17 crore as at the end of 2018-19. In addition to the investments, during 2018-19, the State Government has given grants/ subsidies amounting to ₹1,305.34 crore to 32 PSUs. (ii) Disinvestment/ Closure of SPSUs There was no disinvestment, restructuring and privatisation by the State Government during the year 2018-19. Further, out of 16 non-working PSUs, liquidation process was initiated in respect of four PSUs. (iii) Returns from Government Companies/ Corporations During 2014-15 to 2018-19, the number of PSUs which earned profits ranged between 45 and 55, out of which only seven to 20 PSUs had declared dividend. During 2018-19, against the profit of ₹581.11 crore earned by these entities, ₹12.11 crore was paid by them as dividend. The dividend payment as percentage of paid up capital was very nominal and was 0.13 per cent during 2018-19. The profitability of a PSU is traditionally assessed through return on investment24, return on equity25 and return on capital employed26.
The return on the State Government funds infused in the three Power Sector PSUs in the State ranged between (-) 8.78 per cent and 4.11 per cent during 2014-15 to 2016-17 which reduced to (-) 52.55 per cent in 2017-18 and to (-) 51.57 per cent in 2018-19.
The return on equity in the three Power Sector PSUs was 3.66 per cent in the year 2014-15 and in respect of years from 2015-16 to 2018-19, the return on equity could not be worked out as net income was negative for these years. On the other hand, the return on the capital employed ranged between 0.65 per cent and 9.55 per cent during the period 2014-15 to 2018-19.
All the PSUs other than the Power Sector had negative return on investment which ranged between (-) 25.62 per cent and (-) 11.28 per cent during 2014-15 to 2018-19.
23 Statutory Corporations - 4, non-working Government Companies - 16, working Government Companies - 120. 24 Measures the profit or loss made in a fixed year relating to the amount of money invested in the form of equity and long term loans and is expressed as a percentage of profit to total investment. 25 Measure of performance calculated by dividing net profit by shareholder’s funds. 26 Financial ratio that measures the company’s profitability and the efficiency with which its capital is used and
is calculated by dividing the company’s earnings before interest and taxes by capital employed.

State Finances Audit Report for the year ended 31 March 2020
60
Similarly, the return on equity in the PSUs other than Power Sector was negative as the PSUs incurred losses in all the five years.
The return on capital employed of the PSUs other than Power Sector ranged between 4.08 per cent and 7.56 per cent during the period 2014-15 to 2018-19.
(iv) Loss incurred by the Government Companies/ Corporations During 2018-19, 59 working PSUs incurred loss of ₹3,656.97 crore. Out of this, one Power Sector PSU incurred an overall loss of ₹1,860.42 crore. In respect of the balance loss, the major contributor was Kerala State Road Transport Corporation (₹1,431.29 crore). (v) Erosion of capital in SPSUs Net worth is a measure of what an entity is worth to the owners. A negative net worth indicates that the entire investment by the owners has been wiped out by accumulated losses. As at the end of 2018-19, capital worth ₹5,580.12 crore of 55 PSUs was eroded. While the overall net worth of three Power Sector PSUs was positive during 2014-15 to 2016-17 and was negative during 2017-18 and 2018-19, the net worth of one PSU (₹1,472.08 crore) was eroded. Similarly, the overall net worth of PSUs other than Power Sector was positive in all the years during 2014-15 to 2018-19. However, the net worth of 54 PSUs (₹6,561.12 crore) was eroded as at 31 March 2019. (vi) Analysis of long term loans Assessment of the ability of the SPSUs to service the debt owned by them to the Government, banks and other financial institutions through Interest coverage ratio and Debt Turnover ratio revealed the following:
As at 31 March 2019, out of the three Power Sector PSUs, all three had interest burden. Of these, one had interest coverage ratio of less than one.
The debt-turnover ratio of three Power Sector PSUs had not improved as the compounded annual growth rate of turnover was less than that of debt during 2014-15 to 2018-19.
As at 31 March 2019, 40 out of 62 PSUs had interest coverage ratio of less than one, indicating that these PSUs could not generate sufficient revenues to meet expenses on interest.
The debt-turnover ratio of working PSUs of other than Power Sector had not improved as the compounded annual growth rate of turnover was less than that of debt during 2014-15 to 2018-19.
(vii) Accountability framework and submission of accounts by PSUs and its audit
The process of audit of Government Companies are governed by respective provisions of Section 619 of the Companies Act, 1956 and Sections 139 and 143 of
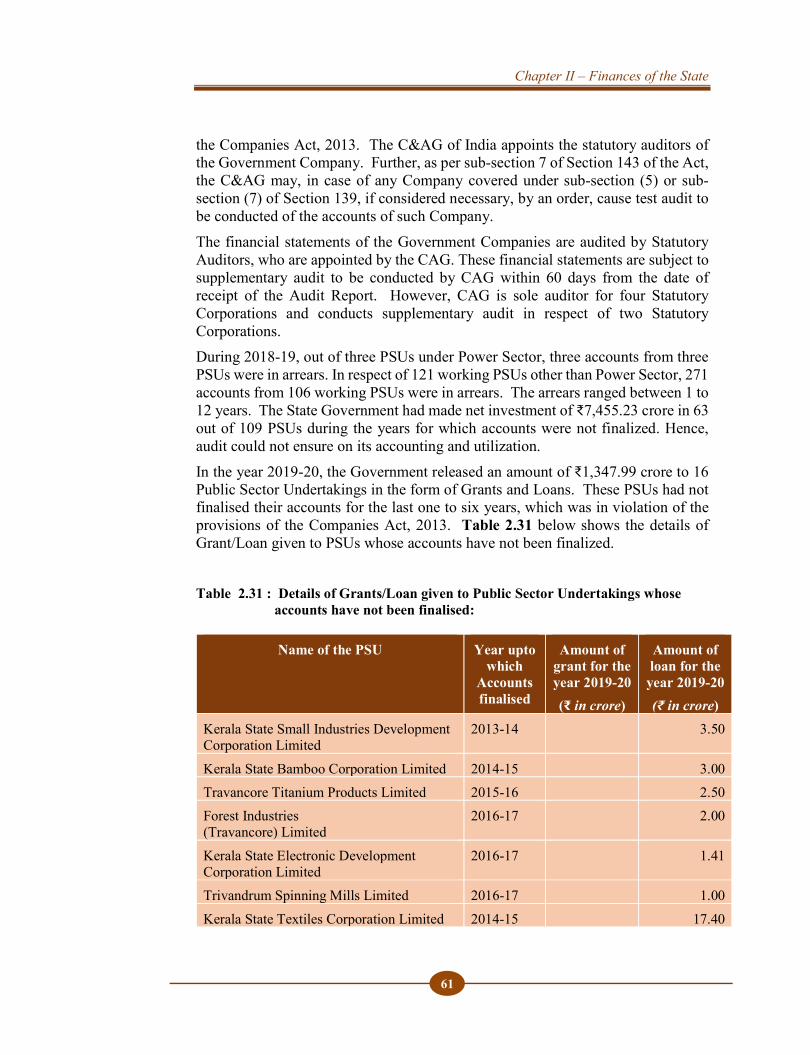
Chapter II – Finances of the State
61
the Companies Act, 2013. The C&AG of India appoints the statutory auditors of the Government Company. Further, as per sub-section 7 of Section 143 of the Act, the C&AG may, in case of any Company covered under sub-section (5) or sub-section (7) of Section 139, if considered necessary, by an order, cause test audit to be conducted of the accounts of such Company. The financial statements of the Government Companies are audited by Statutory Auditors, who are appointed by the CAG. These financial statements are subject to supplementary audit to be conducted by CAG within 60 days from the date of receipt of the Audit Report. However, CAG is sole auditor for four Statutory Corporations and conducts supplementary audit in respect of two Statutory Corporations. During 2018-19, out of three PSUs under Power Sector, three accounts from three PSUs were in arrears. In respect of 121 working PSUs other than Power Sector, 271 accounts from 106 working PSUs were in arrears. The arrears ranged between 1 to 12 years. The State Government had made net investment of ₹7,455.23 crore in 63 out of 109 PSUs during the years for which accounts were not finalized. Hence, audit could not ensure on its accounting and utilization. In the year 2019-20, the Government released an amount of ₹1,347.99 crore to 16 Public Sector Undertakings in the form of Grants and Loans. These PSUs had not finalised their accounts for the last one to six years, which was in violation of the provisions of the Companies Act, 2013. Table 2.31 below shows the details of Grant/Loan given to PSUs whose accounts have not been finalized. Table 2.31 : Details of Grants/Loan given to Public Sector Undertakings whose accounts have not been finalised:
Name of the PSU Year upto which
Accounts finalised
Amount of grant for the year 2019-20 (₹ in crore)
Amount of loan for the
year 2019-20 (₹ in crore)
Kerala State Small Industries Development Corporation Limited
2013-14 3.50
Kerala State Bamboo Corporation Limited 2014-15 3.00 Travancore Titanium Products Limited 2015-16 2.50 Forest Industries (Travancore) Limited
2016-17 2.00
Kerala State Electronic Development Corporation Limited
2016-17 1.41
Trivandrum Spinning Mills Limited 2016-17 1.00 Kerala State Textiles Corporation Limited 2014-15 17.40

State Finances Audit Report for the year ended 31 March 2020
62
Name of the PSU Year upto which
Accounts finalised
Amount of grant for the year 2019-20 (₹ in crore)
Amount of loan for the
year 2019-20 (₹ in crore)
Travancore Cements Limited 2016-17 1.82 Kerala State Poultry Development Corporation Limited
2014-15 3.35
Kerala State Civil Supplies Corporation Limited
2015-16 3.00
Kerala Medical Services Corporation Limited
2013-14 307.07
Kerala State Road Transport Corporation 2014-15 987.37 Kerala Women Development Corporation 2016-17 0.33 Kerala Livestock Development Board 2014-15 10.00 Kerala State Handicapped Persons Welfare Corporation Limited
2014-15 3.79
Kerala State Warehousing Corporation 2018-19 0.45 Total 327.54 1020.45
Source: Finance Accounts
2.4.4 Expenditure Priorities
Enhancing human development levels requires the States to step up their expenditure on key social services like education, health etc. Low fiscal priority (ratio of expenditure under a category to aggregate expenditure) is attached to a particular sector, if the allocation is below the respective national average. The higher the ratio of these components to total expenditure, the quality of expenditure is considered to be better. Table 2.32 analyses the fiscal priority of the State Government with regard to Health Education and Capital Expenditure during 2015-16 and 2019-20.
Table 2.32 : Expenditure priority of the State with regards to Health, Education and Capital expenditure (in per cent)
AE/GSDP CE/AE Education/AE Health/AE General Category States’ Average (2015-16)
16.97 14.81 15.68 4.79
Kerala 15.49 8.62 16.73 5.48 General Category States’ Average (2019-20)
15.15 12.97 15.91 5.21
Kerala 13.39 7.39 16.40 6.59 AE- Aggregate Expenditure, CE- Capital Expenditure,
Source: Information furnished by Economic Advisor and base on Finance Accounts

Chapter II – Finances of the State
63
The State’s share of expenditure on the health and education sectors in the total expenditure was more than General Category States, but the share of capital expenditure was less than that of General Category States. 2.4.5 Object head wise expenditure The Total Expenditure for the year 2019-20 was ₹1,14,385 crore. The Chart 2.15 below gives information about object/ purpose of the expenditure.
Chart : 2.15 Object head wise expenditure (₹ in crore)
From above, it can be seen that expenditure on salaries and interest payments were the highest and major works constituted only 1.32 per cent of total expenditure.

State Finances Audit Report for the year ended 31 March 2020
64
2.5 Public Accounts
Receipts and Disbursements in respect of certain transactions such as Small Savings, Provident Funds, Reserve Funds, Deposits, Suspense, Remittances etc., which do not form part of the Consolidated Fund, are kept in the Public Account set up under Article 266(2) of the Constitution and are not subject to vote by the State Legislature. The Government acts as a banker in respect of these. The balance after disbursements during the year is the fund available with the Government for use for various purposes.
2.5.1 Net Public Account Balances Component-wise net balances in Public Account of the State as on 31 March 2020 are shown below in Table 2.33.
Table 2.33 : Component-wise net balances (₹ in crore)
Sector Sub Sector 2015-16 2016-17 2017-18 2018-19 2019-20 I. Small Savings, Provident Funds etc.
Small Savings Provident Funds
8332.07 12931.66 7206.84 9619.21 8274.11
J. Reserve Funds (a) Reserve Funds bearing Interest
50.62 43.34 171.22 1826.90 -1478.41
(b) Reserve Funds not bearing Interest
14.28 118.88 137.76 154.12 127.99
K. Deposits and Advances
(a) Deposits bearing Interest
0.17 1.40 -1.32 -0.30 0.23
(b) Deposits not bearing interest
-3280.42 104.28 267.23 392.70 584.93
(c ) Advances -0.04 -0.03 0 -0.23 -59.42 L. Suspense and Miscellaneous
(a) Suspense 296.86 -1015.96 691.76 -534.98 17.05 (b) Other Accounts 359.92 -1153.13 510.92 -226.68 -270.19 (c ) Accounts with Government of Foreign Countries
0 0 0 0 0
(d)Miscellaneous 117.50 0 -0.15 -0.57 -0.06 M. Remittances (a) Money Orders,
and other Remittances
-51.49 -367.34 -61.62 -90.82 35.18
(b) Inter Governmental Adjustment Account
-40.70 54.33 -104.35 39.30 82.36
Total 5798.77 10717.43 8818.29 11178.65 7313.77 Source: Finance Accounts of respective years

Chapter II – Finances of the State
65
Chart 2.16: Yearly changes in Composition of Public Account Balances (₹ in crore)
2.5.2 Reserve Funds Reserve funds are created for specific and defined purposes under the Public Account of the State Government. These Funds are met from contribution of grants from the Consolidated Fund of the State.
SmallSavings
ProvidentFunds etc
ReserveFunds
Depositsand
Advances
Suspenseamd
Miscellaneous
Remittances
2015-16 8332.07 64.9 -3280.29 774.28 -92.192016-17 12931.66 162.22 105.65 -2169.09 -313.012017-18 7206.84 308.98 265.91 1202.53 -165.972018-19 9619.21 1981.02 392.17 -762.23 -51.522019-20 8274.11 -1350.42 525.75 -253.2 117.55
-6000
-4000
-2000
0
2000
4000
6000
8000
10000
12000
14000
2015-16 2016-17 2017-18 2018-19 2019-20

State Finances Audit Report for the year ended 31 March 2020
66
As on 31 March 2020, the State Government had 16 Reserve Funds with balances amounting to ₹3,113.86 crore. Out of these, two Reserve Funds (₹635.57 crore) are interest bearing, and 14 Reserve Funds (₹2,478.29 crore) are non-interest bearing. Five out of the 14 non-interest bearing funds had nil balance and are inoperative.
Details of Significant Reserve funds are given below:
2.5.2.1 Consolidated Sinking Fund In line with the recommendations of the XII Finance Commission the State Government set up Consolidated Sinking Fund (CSF) with effect from the financial year 2007-2008, according to which the Fund was to be utilised as an amortisation fund for redemption of all outstanding liabilities of the Government commencing from the financial year 2012-13. The Fund was to be credited with contributions from revenue at the prescribed rate and interest accrued on investments made out of the Fund. Only the interest accrued and credited in the Fund was to be utilised for redemption of the outstanding liabilities of the Government. As per paragraph 5 of revised model scheme for the constitution and administration of the Consolidated Sinking Fund of Kerala, the rate of contribution to the Consolidated Sinking Fund was 0.50 per cent of the outstanding liabilities at the end of the previous year.
Against a requirement of ₹1,208.07 crore (0.50 per cent of the outstanding liabilities of ₹2,41,614.51 crore as on 01 April 2019), the State Government did not contribute any amount to the Fund during the year. The State Government has not made any contribution to the Fund since 2012-13.
The State Government stated that (as per Notes to Accounts) as it is continuously running in revenue deficit, the contribution to Consolidated Sinking Fund (CSF) can materialise only from borrowed funds. Government also stated that the yield on Consolidated Sinking Fund investment as against the cost of borrowings would give a negative carry and hence it is not prudent to contribute to CSF, given the high cost of borrowings. However, audit observed that non-contribution to the Consolidated Sinking Fund has reduced the reserve fund for future amortization of loan liability.
At the beginning of the year, ₹2,018.54 crore was available and with the interest received on the investment (₹166.77 crore), the outstanding balance at the end of the year was ₹2,185.31 crore. The outstanding balance is invested in GoI Securities as per the recommendations of the XII Finance Commission.
2.5.2.2 State Disaster Response Fund Government of India (GoI) replaced the erstwhile Calamity Relief Fund with the State Disaster Response Fund (SDRF) with effect from 1 April 2010. In terms of the guidelines of the Fund, the Centre and States are required to contribute to the

Chapter II – Finances of the State
67
Fund in the certain proportion. The contributions are to be transferred to the Public Account to Major Head-8121. Expenditure during the year is incurred by operating Major Head -2245. The State Governments are required to pay interest to the SDRF at the rate applicable to overdrafts under overdraft Regulation Guidelines of the RBI. The interest is to be credited on a half yearly basis. The accretions to the SDRF together with the income earned on the investment of SDRF are to be invested in Central Government dated Securities, auctioned Treasury Bills and other interest earning deposits with Scheduled Commercial Banks. The SDRF is to be used only for meeting the expenditure for providing immediate relief to the victims of a disaster and the provision for disaster preparedness, restoration, reconstruction and mitigation should not be a part of SDRF. Such expenditure has to be built into the normal budgetary heads/ State Plan Funds, etc. The size of the Fund for Kerala for the year 2019-20 was ₹225 crore, 75 per cent (₹168.75 crore) of which was to be contributed by the Central Government and 25 per cent (₹56.25 crore) by the State Government.
During the year, an amount of ₹249.27 crore was credited to the Fund (Central share of ₹136.65 crore after adjusting excess amount of ₹32.10 crore which was released in 2018-19, ₹88.35 crore of State share and ₹24.27 crore on account of interest on uninvested balances for the years 2015-16 to 2017-18).
After setting off the expenditure for disaster relief operations to the extent of ₹1,811.64 crore, the balance in SDRF as on 31 March 2020 is ₹551.61 crore.
According to the guidelines issued by the Government of India, the accretions to SDRF are to be invested in GoI securities/ Treasury Bills/ interest earning deposits with scheduled commercial Banks by the State Executive Committee constituted for the management of the fund. However, this was not done till date.
2.5.2.3 Guarantee Redemption Fund As per recommendations of the XII Finance Commission, the State Government is required to constitute ‘Guarantee Redemption Fund’ for meeting the payment obligations arising out of the guarantees issued by the Government in respect of bonds issued and other borrowings by the State Public Sector Undertakings or other Bodies and invoked by the beneficiaries. The accumulations in the Fund are to be utilised only towards payment of the guarantees issued by the Government and not paid by the institutions on whose behalf guarantee was issued. However, Government of Kerala has not established Guarantee Redemption Fund. The Fund is to be operated outside the State Government account and administered by the Reserve Bank of India. Under the guidelines, the State Government is required to make minimum annual contribution of 0.50 per cent of outstanding guarantee at the beginning of the year. The amount to be contributed by the State Government in the Fund during the year is ₹134.17 crore.

State Finances Audit Report for the year ended 31 March 2020
68
In terms of the Kerala Ceiling on Government Guarantees Act, 2003 the guarantee commission received annually are to be transferred to the Public Account and these contributions shall form the corpus of the Guarantee Redemption Fund (GRF) under Public Account of the State. As the State Government has not constituted GRF as per para 6 of the Kerala Ceiling on Government Guarantees Act, 2003 and RBI guidelines, Guarantee commission amounting to ₹1,250.59 crore collected during 2003-04 to 2019-20 (this includes ₹150.80 crore for the year 2019-20) had not been credited to the Fund but treated as non-tax revenue and used for meeting the revenue expenditure of Government. Non-crediting of guarantee commission collected to the GRF resulted in understatement of revenue expenditure to that extent. State Government replied (April 2021) that fund rules for constitution of Guarantee Redemption Fund is in the final stages and would be notified shortly. As and when the Guarantee Redemption Fund is constituted, immediate action will be taken to credit the commission in the fund. 2.5.2.4 Non discharge of Interest liability on Reserve Funds and Deposits The interest liabilities in respect of Reserve Funds bearing interest and Deposits bearing interest under sectors J and K respectively of the Public Accounts are annual liabilities that the State Government is required to discharge. An amount of ₹24.27 crore was adjusted during the year towards the arrears of interest payable by Government on the uninvested balances for the earlier years from 2015-16 to 2017-18 under State Disaster Response Fund (SDRF). However, the State Government has not made any Budget provision/ adjustments of ₹144.32 crore for interest on the uninvested SDRF amount (as per interest rate applicable to overdraft) during the year 2019-20. Consequent to the non-provision/non-payment of interest, Revenue Expenditure was understated by ₹144.32 crore. The State Government replied (April 2021) that the interest portion of ₹171.85 crore pertaining to the uninvested balances of SDRF for the years 2018-19 and 2019-20 has been transferred to the SDRF by placing it in the Supplementary Demands for Grants(SDG) of January 2021. However the fact remains that the Revenue Expenditure was understated by ₹144.32 crore during the year 2019-20.
2.6 Debt Management Debt management is the process of establishing and executing a strategy for managing the Government’s debt in order to raise the required amount of funding, achieve its risk and cost objectives, and to meet any other sovereign debt management goals that the Government may have set through enactment or any other annual budget announcements.

Chapter II – Finances of the State
69
Chart 2.17: Trend of Overall Debt
2.6.1 Debt Profile: Components Total debt of the State Government typically constitutes of Internal debt of the State (market loans, ways and means advances from RBI, special securities issued to National Small Savings Fund and loans from financial institutions, etc.), loans and advances from the Central Government, and Public Account Liabilities. The details relating to total debt received, repayment of debt ratio of debt to GSDP and the actual quantum of debt available to the State during the five-year period 2015-2020 are given in the Table 2.34.
Table 2.34: Component wise debt trends (₹ in crore) 2015-16 2016-17 2017-18 2018-19 2019-20
Outstanding Overall Debt 160539 189769 214518 241615 265362
Public Debt Internal Debt 102496 118269 135500 150992 165960 Loans from GoI 7235 7614 7484 7243 8680
Liabilities of Public Account 50808 63886 71534 83380 90722 Rate of growth of outstanding overall debt (percentage) 13.10 18.21 13.04 12.63 9.83
160539189769
214518241615
265362
28.57
29.89
30.58 30.57
31.05
27.00
27.50
28.00
28.50
29.00
29.50
30.00
30.50
31.00
31.50
0
50000
100000
150000
200000
250000
300000
2015-16 2016-17 2017-18 2018-19 2019-20
Outstanding debt (₹ in crore) As a percentage of GSDP

State Finances Audit Report for the year ended 31 March 2020
70
2015-16 2016-17 2017-18 2018-19 2019-20 Gross State Domestic Product (GSDP) 561994 634886 701588 790302 854689 Debt/GSDP (per cent) 28.57 29.89 30.58 30.57 31.05 Total Debt Receipts 75063 89787 120228 146499 183509 Total Debt Repayments 56471 60557 95478 119403 159761 Total Debt Available 18592 29230 24750 27096 23748 Debt Repayments/Debt Receipts (percentage) 75.23 67.45 79.41 81.50 87.06
Source: Finance Accounts of respective years
Total outstanding liabilities of the State grew from ₹1,60,539 crore in 2015-16 to ₹ 2,65,362 crore in 2019-20. In 2019-20, the outstanding liabilities grew at 9.83 per cent over the previous year. It comprised internal debt of ₹1,65,960 crore (63 per cent), public account of ₹90,722 crore (34 per cent) and loans and advances from GoI of ₹ 8,680 crore (three per cent). The internal debt largely composed of market loans (₹1,42,336 crore) and special securities issued to NSSF (₹17,396 crore). Component wise break-up of debt is shown below in Chart 2.18.
Chart : 2.18 Component wise breakup of debt
Internal Debt, 165960, 63%
Loans from GoI, 8680,
3%
Public Account
Liabilities, 90722, 34%
OVER ALL DEBT ₹2,65,362 Crore

Chapter II – Finances of the State
71
Chart: 2.19 Internal debt taken vis-a vis repaid
(₹ in crore)
Components of Fiscal deficit and its financing patterns The financing pattern of the fiscal deficit had undergone a compositional shift as reflected in Chart 2.20 and Table 2.35. The receipts and disbursements under the components of financing the fiscal deficit during the year 2019-20 are given in Table 2.36.
1912723006
2978932994
58256
5699 723312557
17503
43287
0
10000
20000
30000
40000
50000
60000
70000
2015-16 2016-17 2017-18 2018-19 2019-20
Internal Debt Taken Internal Debt Repaid

State Finances Audit Report for the year ended 31 March 2020
72
Chart: 2.20 Component wise debt trends (₹ in crore)
2015-16 2016-17 2017-18 2018-19 2019-20Market Borrowing 12886 14686 16203 13984 12617Loans from GoI 169 379 -130 -240 1436Special Securities issued to
National Small Savings Fund 731 972 1048 1051 1788
Loans form FinancialInstitutions -64 107 -19 455 564
Small Saving ProvidentFunds etc 8332 12932 7207 9619 8274
Reserve Fund -59 170 309 1981 -1350Deposits and Advances -3280 105 266 392 526Suspense and Miscellaneous 774 -2169 1203 -762 -253Remittances -93 -313 -166 -52 117Increase(-) Decrease(+) in
Cash Balance -1578 -421 917 530 193
Contingency fund 0 0 0 0 -75Gross Fiscal Deficit 17818 26448 26838 26958 23837
-5000
0
5000
10000
15000
20000
25000
30000

Chapter II – Finances of the State
73
Table 2.35: Components of Fiscal Deficit and its financing pattern (₹ in crore) Particulars 2015-16 2016-17 2017-18 2018-19 2019-20 Composition of Fiscal Deficit Revenue Deficit 9657 15484 16928 17462 14495 Net Capital Expenditure 7472 10096 8720 7384 8427 Net Loans and Advances 689 868 1190 2112 915 Total 17818 26448 26838 26958 23837 Financing Pattern of Fiscal Deficit Market Borrowing 12886 14686 16203 13984 12617 Loans from GoI 169 379 -130 -240 1436 Special Securities issued to National Small Savings Fund 731 972 1048 1051 1788 Loans form Financial Institutions -64 107 -19 455 564 Small Saving Provident Funds etc. 8332 12932 7207 9619 8274 Reserve Fund -59 170 309 1981 -1350 Deposits and Advances -3280 105 266 392 526 Suspense and Miscellaneous 774 -2169 1203 -762 -253 Remittances -93 -313 -166 -52 117 Contingency fund 0 0 0 0 -75 Overall Deficit 19396 26869 25921 26428 23644 Increase(-)Decrease(+) in Cash Balance -1578 -421 917 530 193 Gross Fiscal Deficit 17818 26448 26838 26958 23837
Source: Finance Accounts of respective years Table 2.36: Receipts and Disbursement under components financing the fiscal deficit (₹ in crore)
Particulars Receipts Disbursement Net Market Borrowing 18073 5456 12617 Loans from GoI 2150 714 1436 Special Securities issued to National Small Savings Fund 3294 1506 1788 Loans form Financial Institutions 36889 36325 564 Small Saving Provident Funds etc. 118983 110709 8274 Reserve Fund 515 1865 -1350 Deposits and Advances 3209 2683 526 Suspense and Miscellaneous 137056 137309 -253 Remittances 2025 1908 117 Contingency fund 0 75 -75 Overall Deficit 322194 298550 23644 Increase(-)Decrease(+) in Cash Balance 2203 2010 193 Gross Fiscal Deficit 324397 300560 23837
Source: Finance Accounts

State Finances Audit Report for the year ended 31 March 2020
74
During 2019-20, the State Government raised ₹18,073 crore as market loans at a weighted average interest rate of 7.43 per cent, loans amounting to ₹637.14 crore from National Bank for Agriculture and Rural Development, ₹3,294.29 crore from National Small Savings Fund at an interest rate of 8.20 per cent and ₹164.63 crore from National Cooperative Development Corporation at interest rates of 10.36 per cent to 11.20 per cent. The State Government also received loan amounting to ₹324 crore from Punjab National Bank during the year by transferring the principal portion of outstanding House Building Advance granted to State Government employees. The State Government also received loans amounting to ₹ 2,150 crore from the Government of India during the year.
Chart 2.21 Financing of Fiscal deficit expressed through a flow chart
(₹ in crore)
The above Tables and Charts reveal that, during the year, market borrowings and net accretions in Public Account, mainly Small savings and Provident Funds etc., are the main sources of the State Government to finance the fiscal deficit like previous years. The net market borrowings (₹12,617 crore) and net accretions in Small savings, Provident Fund etc. (₹8,274 crore) contributed to financing 87.64 per cent of the fiscal deficit of the State Government.
26958
12617
1436
1788
564
8274
-1350
526
-253
117
-75
193
23837
-5000 0 5000 10000 15000 20000 25000 30000
Fiscal liability (FY 2018-19)
Market Borrowings
Loans from GOI
Special Securities issued to National Small Savings Fund
Loans from financial Institutions
Small Saving Provident Funds etc
Reserve fund
Deposits and Advances
Suspense and Miscellaneous
Remittances
Contingency fund
Increase -Decrease (+) in cash balance
Fiscal liability (FY 2019-2020)

Chapter II – Finances of the State
75
2.6.2 Off-budget borrowings The borrowings of the State Government are governed by Article 293(1) of the Constitution of India, under which the State Governments can borrow money within the territory of India upon security of the Consolidated Fund of the State. The limits on such borrowings are regulated under Article 293(3) of the Constitution of India under which the State must obtain prior consent of the Government of India (GoI) to raise any loan. The State Government is, therefore, required to furnish to GoI, the financial statements showing the estimates of receipts and repayments of all sources of borrowings including open market borrowings, other liabilities arising out of Public Account transfers, etc. based on which the GoI gives the consent for raising loans and fixes the borrowing ceiling for the State Government. GoI had fixed Net Borrowing of the State for 2019-20 in line with the recommendations of Finance Commission at three per cent of the estimated GSDP in April 2019. Thereafter, in February 2020, GoI allowed an additional borrowing of ₹1,471 crore in 2019-20 to the State as onetime special dispensation, beyond the State’s eligibility of three per cent of estimated GSDP.
Off-budget borrowing refers to use of those financial resources by the State Government for meeting expenditure requirements in a particular year or years, which are not reflected in the budget for that year or those years, for seeking grant/ appropriation. Hence, these off-budget borrowings remain outside Legislative control. They are financed through State Government owned or controlled public sector enterprises or departmental commercial undertakings, which raise the resources through market borrowings on behalf of the State Government. However, the State Government has to repay and service the debt from its budget.
Audit noticed instances where the State Government of Kerala resorted to off-budget borrowing through statutory body/ State Government Company viz. Kerala Infrastructure Investment Fund Board (KIIFB) and Kerala Social Security Pension Limited (KSSPL) amounting to ₹1,930.04 crore and ₹6,843.65 crore respectively for financing its capital as well as revenue spending during the year 2019-20. These two entities borrow funds for financing various Government Schemes and Government projects, the expenditure on which are not disclosed in the budget or in the Finance Accounts of the State. In terms of revenue spending, off-budget borrowing was used for financing social security pension schemes including welfare pensions through borrowings by KSSPL. In terms of capital spending, off-budget borrowing was used for financing critical and large infrastructure projects in the State through borrowings by KIIFB.

State Finances Audit Report for the year ended 31 March 2020
76
Off-budget borrowing for capital spending being resorted through KIIFB The Kerala Infrastructure Investment Fund Board (KIIFB) is a statutory body constituted (November 1999) and controlled by the State Government under the Kerala Infrastructure Investment Fund (KIIF)Act, 1999 to manage the Kerala Infrastructure Investment fund with the objective of providing investment for critical and large infrastructure projects in Kerala. Every year the State Government sets apart petroleum cess and a share of Motor Vehicle Tax (MVT) collected to KIIFB through regular budget provision under capital account. As per section 8 of the KIIF (Amendment) Act, 2016, the share of MVT to be paid is 10 per cent for the first year (2016-17) and increased by 10 per cent every year up to 50 per cent of the tax in the fifth year. The State Government has set apart ₹5,572.85 crore to KIIFB as petroleum cess and share of MVT till 2019-20 as shown in the Table 2.37 given below.
Table 2.37: Details of funds received from State Government. (₹ in crore)
Head of account 2016-17 2017-18 2018-19 2019-20 Total 5475-00-115-97- Share of KIIFB from cess on petrol and diesel
448.10 421.19 501.82 550.00 1921.11
5475-00-115-98- Share of KIIFB from Motor Vehicle Tax
281.43 621.45 1098.86 1650.00 3651.74
Grand Total 729.53 1042.64 1600.68 2200.00 5572.85 Source: Details furnished by KIIFB
In addition to petroleum cess and share of Motor Vehicle Tax, the State Government had also provided additional funds as Corpus fund under Major Infrastructure Development Projects and Technical Assistance Fund as shown in Table 2.38 given below. Table 2.38 : Details of additional funds received from State Government. (₹ in crore)
Head of account 2015-16 2016-17 2017-18 2018-19 2019-20 Total 3475-00-800-96 Technical Assistance Fund
- - 58.25 15.89 - 74.14
5475-00-800-92 Major Infrastructure Development Projects
873.85 1624.56 - - - 2498.41
Grand Total 873.85 1624.56 58.25 15.89 - 2572.55 Source: Details furnished by KIIFB KIIFB had incurred an expenditure of ₹5,014.17 crore for various Government approved infrastructure projects till 2019-20, which are not disclosed in the budget

Chapter II – Finances of the State
77
or in the accounts of the State. KIIFB borrowed/ raised funds amounting to ₹5,036.61 crore from financial institutions till 2019-20 and paid interest amounting to ₹353.21 crore till 2019-20 on these borrowings as shown in the Table 2.39 given below. Table 2.39 : Details of funds raised/ borrowed by KIIFB (₹ in crore)
Name of institution from where funds borrowed
Borrowed Amount Amount Repaid 2017-18 2018-19 2019-20 Principal Interest
Masala Bond - 2150.00 - - 209.25 NABARD 100.80 100.00 364.20 19.38 12.15 SBI - 300.00 500.00 - 42.59 UBI - 250.00 250.00 - 33.23 Indian Bank - 200.00 300.00 - 39.95 Syndicate Bank - - 200.00 - 9.80 Corporation Bank - - 150.00 - 1.03 KIIFB Bonds to KSFE Pravasi Chitty - 5.77 109.26 - 4.55 Loans from Kerala Non-resident Keralites-Welfare Board - - 56.58 - 0.66
Total 100.80 3005.77 1930.04 19.38 353.21 Source: Details furnished by KIIFB
The repayment of liabilities is however by utilising petroleum cess and share of Motor Vehicle Tax received each year from Government. Thus, even though repayment of borrowed amount and its interest are being financed through Government revenue, the Government’s financial documents do not reflect these borrowings. In response to audit findings, the State Government replied that the borrowings of KIIFB are not off-budget borrowings of the State, and that the liabilities raised through KIIFB are contingent liabilities as the borrowings of KIIFB are limited to the provisions of KIIF Act relating to earmarked share of MVT and Petroleum cess from the State budget. It was also stated that the records and statements of KIIFB are laid before the Legislature and hence the borrowings of KIIFB have legislative approval.
The reply is not tenable, as KIIFB has no revenue of its own and the State Government has to defray the debt obligations of KIIFB by transferring its own revenue resources on a regular basis through State budget as provided under KIIF Act. Merely, because these repayment obligations are provided in the Act does not detract from the fact that the liabilities of KIIFB are a direct charge on the Government’s own revenue resources and are thus direct liability of the State Government. The contention of State Government that the records and statements of KIIFB are laid before the Legislature and hence the borrowings of KIIFB has legislative approval is also not tenable as the borrowings and expenditure of KIIFB are not included in the State’s budget documents for the vote of Legislature as exercised under Article 203(2) of the Constitution of India.

State Finances Audit Report for the year ended 31 March 2020
78
In the exit conference, Audit suggested the Government to consider the inclusion of the disclosure of the details of the off-budget borrowings done through various agencies of the State Government in the Budget and Accounts. It was informed by the Government that the process of bringing into the budget documents, the borrowings which were not getting into budget documents but being reported in the Legislature, will be considered.
Off budget borrowing for revenue spending being resorted through KSSPL Kerala Social Security Pension Limited (KSSPL) is a wholly owned Government Company constituted as per Government of Kerala order GO(MS) No. 232/2018/Finance of 26 June 2018, under Finance Department with the objective of improving the disbursement of various Social Security Pensions including welfare pensions in the State. KSSPL was registered and incorporated on August 2018 at ROC (Registrars of Companies)-Ernakulam (Kerala) with Corporate Identification Number (CIN)27 U66030KL2018SGC054259, with its registered office at Room No. 400 in Finance Department, Government of Kerala, Secretariat Building, Thiruvananthapuram. State Government had issued orders (June 2018) to transfer funds to KSSPL through State Budget every year and to transfer the funds received from GoI under National Social Assistance Programme (NSAP). Accordingly, State Government transferred funds amounting to ₹2,200 crore till 2019-20 to KSSPL through State Budget as shown in the Table 2.40 given below. Table 2.40 : Details of funds received from State Government. (₹ in crore)
Head of Account 2018-19 2019-20 Total 4235-02-190-94 Share Capital Investment in Kerala Social Security Pension Limited 100 Nil 100
2235-60-102-89 Assistance to Kerala Social Security Pension Limited Nil 2100 2100
Total 100 2100 2200 Source: Finance Accounts and DAA of respective years KSSPL was constituted by the State Government to carry on the business as a Special Purpose Vehicle (SPV) for disbursement of various Social Security Pensions including Welfare pensions being disbursed by the State Government, in line with disbursement calendar notified by the Government of Kerala (GoK) from time to time. The required funds are to be provided by GoK through its budgets along with the funds received from GoI under NSAP or any other Welfare Pension Scheme. The additional funds required to meet the liquidity requirements are to be raised by the Company through other sources in the form of Deposits, Loan or other instruments from Public Sector Undertaking (PSU), other institutions or from the public at large. However, all the repayment liabilities pertaining to the disbursement of Social Security Pensions and other expenses of the company be met by the GoK through budget every year. Audit observed that KSSPL had borrowed / raised 27 Corporate Identification Number or CIN is a unique identification number which is assigned by the ROC (Registrar of Companies) of various states under the MCA (Ministry of Corporate Affairs).

Chapter II – Finances of the State
79
funds amounting to ₹13,662.47 crore from three State Government Companies/ Institutions viz. Kerala State Beverages Corporation Limited (KSBCL), Kerala State Financial Enterprises Limited (KSFE) and Primary Co-operative Societies Consortium for Security Pensions (PCSCSP) upto 2019-20, out of which ₹6,843.65 crore pertains to the year 2019-20 as shown in the Table 2.41 given below. Table 2.41: Details of funds raised/ borrowed by KSSPL. (₹ in crore)
Name of institution from which funds borrowed Borrowed Amount Total
2018-19 2019-20 Kerala State Beverages Corporation Limited 1000 2000 3000 Kerala State Financial Enterprises Limited 2020.69 3000 5020.69 Primary Co-operative Societies Consortium for Security Pensions 3798.13 1843.65 5641.78 Total 6818.82 6843.65 13662.47
Source: Details furnished by KSSPL
The State Government issued orders (June 2018) to take over the repayment liabilities of KSSPL arising on account of pension disbursement and assured to service the loans raised by KSSPL with the funds provided every year through State budget. Thus, the borrowings of KSSPL are direct liabilities of the State Government despite being off-budget. These, off-budget borrowings not only reflect lack of disclosure, it also puts expenditure on various schemes disbursed through KSSPL beyond the control and scrutiny of Legislature. The contention of the State Government (April 2021) that as KSSPL is a separate entity incorporated under Companies Act, 2013, the liabilities of KSSPL are not the liabilities of the State Government is not tenable. KSSPL was formed for the sole function of disbursement of various Social Security pensions. As disbursement of Social Security Pensions including welfare pensions are the core functions of the Government, mere transferring these functions to a company does not detract from the fact that the liabilities arising out of the execution of these functions are the liabilities created on the Government’. Moreover, in the Government order (July 2018) constituting the company, the State Government explicitly stated that all repayment liabilities of the Company arising on account of pension disbursement would be borne by the State Government.
Conclusion In both the above cases, borrowings of these concerns ultimately are the liabilities of the State Government. These off-budget borrowings are not taken into the disclosure statement in the budget documents or in the accounts, nor does have legislative approval. They are used to finance Government expenditure, details of which are not reflected in the budget or finance accounts. Moreover, these off-budget borrowings by the State Government have the effect of bypassing the Net Borrowing Ceiling (NBC) of the State by routing loans outside State budget through Government owned or controlled Companies/ statutory bodies despite being responsible for repayment of such loans. Such borrowings naturally

State Finances Audit Report for the year ended 31 March 2020
80
have impact on the Revenue Deficit and Fiscal Deficit and thus, have the effect of surpassing the targets set for fiscal indictors under ‘The Kerala Fiscal Responsibility Act, 2003’ (as amended from time to time). Creating such liabilities, without disclosing them in the budget, raises questions both of transparency, and of inter-generational equity. If the State Government increasingly resorts to these off-budget route to finance both its capital as well as revenue spending, the liabilities of the State may increase substantially over a period of time leading to a debt trap, without the Legislature even knowing that such liabilities are being created. Recommendation Budget is the most important instrument of legislative control and is at the very core of a democratic setup. Hence, all Government borrowings and expenditure should legitimately be covered within the respective budgets. Expenditure on social security pension schemes and critical infrastructure projects in the State are desirable. However, financing expenditures through off-budget borrowings raises public debt and detracts from compliance with the letter and spirit of the provisions of the Kerala Fiscal Responsibility Act, 2003. Such outstanding extra budgetary liabilities need to be clearly identified, with transparent reporting of deficit and debt as provided in the Act. The Government may include the disclosure of the details of the off-budget borrowings done through various agencies of the State Government in the Budget and Accounts. 2.6.3 Debt Profile: Maturity and Repayment Debt maturity and repayment profile indicates commitment on the part of the Government for debt repayment or debt servicing. As per Finance Accounts for the year 2019-20, the maturity profile of the public debt is as shown in Table 2.42 and Chart 2.22.
Table 2.42: Debt Maturity profile
Year of Maturity Maturity Profile
Amount (₹ in crore) Per cent of Total Public Debt
Internal Debt
Loans & Advances from GoI Total
By 2020-21 0-1 year 6730.66 332.94 7063.60 4.29 Between 2021-22 & 2022-23 2-3 years 21677.96 1308.81 22986.77 13.98 Between 2023-24 & 2024-25 4-5years 27207.80 1347.8 28555.60 17.36 Between 2025-26 & 2026-27 6-7 years 33422.57 901.35 34323.92 20.87
2027-2028 onwards Above 7 years 66751.21 4789.28 71540.49 43.50
Total 155790.20 8680.18 164470.38 100 Amount for which Maturity profile details not furnished by State Government 10169.83
Source: Finance Accounts

Chapter II – Finances of the State
81
Chart 2.22: Debt Maturity profile (₹ in crore)
2.7 Debt Sustainability Analysis (DSA) Debt sustainability implies the State’s ability to service the debt in future. Apart from the magnitude of debt of the State Government, it is important to analyse various indicators that determine the debt sustainability of the State. This section analyses sustainability of overall debt liability of the State Government in terms of growth rate of debt and GSDP, Debt-GSDP ratio, net debt available to the State etc. These indicators for the last five years are given in Table 2.43 and Chart 2.23 below: Table 2.43: Trends in Debt Sustainability indicators (₹ in crore)
Debt Sustainability Indicators 2015-16 2016-17 2017-18 2018-19 2019-20
Outstanding Public Debt 109731 125883 142984 158235 174640
Rate of Growth of Outstanding Public Debt 14.14 14.72 13.58 10.67 10.37
GSDP 561994 634886 701588 790302 854689
Rate of Growth of GSDP 9.64 12.97 10.51 11.40 8.15
Debt/GSDP 19.53 19.83 20.38 20.02 20.43
Debt Maturity profile of repayment of State debt – including default history if any
Up to one year 3751.61 5682.54 6980.49 6948.14 7063.60
One to three years 12243.13 13331.80 13373.47 16870.66 22986.77
Three to five years 13284.34 16677.73 22907.53 26865.91 28555.60
Five to seven years 22808.05 26786.58 28437.13 30372.21 34323.92
Seven years and above 52857.95 58456.21 66308.08 70013.73 71540.49
Maturity profile details not furnished by State Government
4785.90 4948.00 4977.82 7163.79 10169.83
7063.60
22986.77 28555.60 34323.92 71540.49
10169.83
0% 10% 20% 30% 40% 50% 60% 70% 80% 90% 100%
0- 1year 1-3 years 3-5years 5-7 years 7years and above Others

State Finances Audit Report for the year ended 31 March 2020
82
Debt Sustainability Indicators 2015-16 2016-17 2017-18 2018-19 2019-20
Average interest Rate of Outstanding Public Debt (per cent)28 10.79 10.29 11.25 11.12 11.54
Percentage of Interest Payment to Revenue Receipt 16.10 16.03 18.21 18.04 21.30
Percentage of Debt Repayment to Debt Receipts* 23.06 22.82 28.44 35.78 35.63
Net Debt available to the State29 5240 6736 6164 3168 3132
Net Debt available as per cent to Debt Receipts 26.65 28.23 20.39 9.47 5.18
Source: Finance Accounts of respective years *excluding ways and means advance
Chart 2.23: Trends of Debt Sustainability indicators
28 Average interest rate = (Interest paid/OB of Public Debt + CB of Public Debt/2) 29 Net Debt available=Public debt receipt during the year minus repayment of principal amount minus Interest
paid on public debt
14.1
4
9.64
19.5
3
16.1
23.0
6
14.7
2
12.9
7
19.8
3
16.0
3
22.8
2
13.5
8
10.5
1
20.3
8
18.2
1
28.4
4
10.6
7
12.6
4
20.0
2
18.0
4
35.7
8
10.3
7
8.15
20.4
3
21.3
35.6
3
R A T E O F G R O W T H O F
O U T S T A N D I N G P U B L I C D E B T
R A T E O F G R O W T H O F
G S D P
D E B T A S P E R C E N T O F G S D P
P E R C E N T A G E O F I N T E R E S T T O
R E V E N U E R E C E I P T
P E R C N T A G E O F P U B L I C D E B T P A Y M E N T T O P U B L I C D E B T
R E C E I P T
(in p
er c
ent)
Debt Susta inai l i ty Indicators
2015-16 2016-17 2017-18 2018-19 2019-20

Chapter II – Finances of the State
83
Indicators What it means What the above table and chart shows
Ratio of total outstanding Public debt to GSDP
The debt-to-GSDP ratio is the metric comparing a State’s public debt to its gross state domestic product (GSDP). By comparing what a states owes with what it produces, the debt-to-GDP ratio reliably indicates that particular State’s ability to pay back its debts. A falling debt/GSDP ratio can be considered as leading towards stability. If Debt/GSDP ratio is increasing rapidly and goes above a threshold, we can say that current level of the primary balance is not sufficient to stabilize the debt-to-GSDP ratio, which is on an explosive path. Sufficient fiscal adjustment should be made by reducing the fiscal deficit (primary balance) to a level necessary to make public debt sustainable.
The Ratio of total outstanding debt to GSDP showed a growing trend from 2015-16 to 2017-18 and fell in 2018-19 however the ratio has shown a rise of 2.05 per cent in 2019-20 when compare to 2018-19.
Rate of Growth of Outstanding Public Debt vis-à-vis Rate of Growth of GSDP
If the growth rate of public debt is higher than the GSDP growth rate, it will lead to higher debt to GSDP ratio.
The rate of growth of outstanding public debt is higher than the GSDP growth rate in all the years except 2018-19.
Average interest Rate of Outstanding Debt
Higher interest rate means that there is scope for restructuring of debt. The interest rate shows a
growing trend and is the highest in the year 2019-20
Percentage of Interest payments to Revenue Receipt
Higher percentage of interest payments leaves less funds for priority areas. It measures the margin of safety a government has for paying interest on its debt during a given period. Governments need to have more than enough revenues to cover interest payments in order to survive future (and perhaps unforeseeable) financial hardships that may arise.
The interest rate shows a growing trend and is the highest in the year 2019-20. It indicates that significant portion of the borrowed funds is utilized for repayment of the portion of the borrowings and interest thereon, the net debt available with State for development activities is curtailed.
Percentage of Public Debt Repayment to Public Debt Receipt
Higher the percentage, the greater the proportion of debt utilised for debt servicing rather than productively.
This ratio was the highest in the year 2018-19 (35.78 per cent) and has shown a decrease of 0.42 per cent in the 2019-20 (35.63 per cent )

State Finances Audit Report for the year ended 31 March 2020
84
2.7.1 Utilisation of borrowed funds As per the disclosure Form B-2(A) under Kerala Fiscal Responsibility Act, 2005, State Government liabilities comprise the following components:
(i) Special securities issued to the National Small Savings Fund
(ii) Loans and advances from Central Government (iii) Market loans (iv) Loans from financial institutions/banks (v) Ways and means advances/overdraft from RBI (vi) Small savings, provident fund of Government employees
etc. (vii) Pension liabilities (viii) Reserve fund/deposits and provident fund of other
employees (ix) Other liabilities
These funds are utilised for various activities of the Government. Details of utilisation of borrowed funds is given in Table 2.44 and Chart 2.24 below.
Table 2.44 : Utilisation of borrowed funds (₹ in crore)
Particulars 2015-16 2016-17 2017-18 2018-19 2019-20 Total Borrowings 115792 133589 156117 176430 218642 Repayment of earlier borrowings (Principal)
6061 7706 13132 18196 44001
Net Capital Expenditure 7472 10096 8720 7384 8427 Net loans and advances 690 868 1190 2112 915 Portion of Revenue expenditure met out of net available borrowings
101569 114919 133075 148738 165299
Source: Finance Accounts of respective years

Chapter II – Finances of the State
85
Chart 2.24: Trends of Utilisation of borrowed funds
In all the five years a major portion of the borrowed funds is utilized for meeting the Revenue Expenditure of the State. Though there is a decrease in the proportion of fund used for Revenue expenditure in the year 2019-20, this is mainly due to increase in use of fund for repayment of borrowings. Borrowed funds should ideally be used to fund capital creation and development activities. Using borrowed funds for meeting current consumption and repayment of interest on outstanding loans is not sustainable.
2.7.2 Status of Guarantees- Contingent liabilities Guarantees are liabilities contingent on the Consolidated Fund of the State in case of default by the borrower for whom the guarantee has been extended. The State Governments have come out with legislations or instructions with regard to cap on the guarantees. As per section 3 of the Kerala Government Guarantees Act, 2003 amended vide ‘Kerala Finance (No.2) Act, 2018’ the total outstanding Government Guarantees shall be within the limit of five per cent of the Gross State Domestic Product (GSDP) of the State as calculated by the Department of Economics and Statistics for the respective financial year. This Act came into force with effect from 01 April 2018. The Estimate (Advance) of GSDP for the year was ₹8,54,689 crore (as per Department of Economics and Statistics). The total outstanding Guarantees as on 31 March 2020 was ₹27,757.01 crore, which was within the limit of five per cent of the GSDP for the year. The Act also stipulates that a minimum of 0.75 per cent of Government Guarantee outstanding against the entity should be charged by the State Government each year
5.23 5.77 8.41 10.3120.13
87.72 86.02 85.24 84.375.6
6.45 7.56 5.59 4.19 3.85
0.6 0.65 0.76 1.2 0.42
0
20
40
60
80
100
120
2015-16 2016-17 2017-18 2018-19 2019-20
(in p
erce
nt)
Repayment of borrowings Revenue Expenditure
Net Capital Expenditure Net Loans and Advances

State Finances Audit Report for the year ended 31 March 2020
86
as Guarantee Commission, which could not be waived under any circumstances. Guarantee Commission of ₹150.80 crore was received during 2019-20. However, Guarantee Commission of ₹269.83 crore was receivable upto 2019-20. Major institutions who have not paid Guarantee Commission upto 2019-20 are Kerala Small Industries Development Corporation Limited (₹57.93 crore), Kerala State Road Transport Corporation (₹51.23 crore), Kerala Water Authority (₹27.66 crore) and Keltron (₹15.81 crore).
2.7.3 Management of Cash Balance As per an agreement with the Reserve Bank of India, State Governments have to maintain a minimum daily cash balance with the Bank. If the balance falls below the agreed minimum on any day, the deficiency is made good by taking ordinary Ways and Means Advances (WMA)/Special Ways and Means Advances (SWMA)/Overdrafts (OD) from time to time. The limit for ordinary WMA to the State Government are revised by the RBI from time to time. State Government invests its surplus cash balance in short and long-term GoI Securities and Treasury Bills. The profits derived from such investments are credited as receipts under the head ‘0049-Interest Receipts’. The cash balances are invested in the Consolidated Sinking Fund and Guarantee Redemption Fund as well.
It is not desirable that State Government take recourse to market loans despite having large cash balances leading to further accretion to cash balances without putting it to productive use. The cash balance and Investments made by the State Government out of the cash balances during the year are shown in Table 2.45. Table 2.45 : Cash balances and Investment of cash balance (₹ in crore)
Particulars Opening balance on 01 April 2019
Closing Balance on 31 March 2020
A. General Cash Balance Cash in treasuries 34.16 35.13 Deposits with Reserve Bank of India
-52.17 -221.0230
Deposits with other Banks31 Remittance in transit-Local 0.20 0.92 Total -17.81 -184.97 Investment held in Cash Balance investment account
189.53 1.67
Total (A) 171.72 -183.30
30 There was a difference of ₹219.83 crore (debit) between the figures reflected in accounts (credit item ₹221.02 crore) and that communicated by Reserve Bank of India (debit item ₹1.19 crore) as on 31 March 2020. Out of the difference, an amount of ₹201.17 crore (net credit) has been cleared in 2020-21. The balance difference of ₹421.00 crore (net debit) is under reconciliation 31 Represents cash held with State Bank of India (amount negligible)

Chapter II – Finances of the State
87
Particulars Opening balance on 01 April 2019
Closing Balance on 31 March 2020
B. Other Cash Balances and Investments Cash with departmental officers viz, Public Works, Forest Officers
-0.98 -5.70
Permanent advances for contingent expenditure with department officers
0.48 0.52
Investment in earmarked funds 2031.93 2198.70 Total (B) 2031.43 2193.52
Total (A+B) 2203.15 2010.22 Interest realized 37.14 7.88
Source: Finance Accounts of respective years
Cash Balances of the State Government at the end of the March 2020, decreased by ₹192.93 crore compared to the closing balance at the end of March 2019. This was mainly due to decrease in investment held in Cash Balance Investment Account (₹187.86 crore). Investment in GoI Treasury bills showed a Nil balance at the end of the year and the interest realised decreased by ₹29.26 crore. The Cash Balance included investment of ₹2,198.70 crore from earmarked funds. The said investment consisted of Sinking Fund Investment (₹2,185.30 crore) and Development and Welfare fund (₹13.39 crore). The State Government was able to maintain a minimum cash balance of ₹1.66 crore for 132 days during 2019-20. The Government had to resort to ways and means advance for 203 days, Special Drawing Facility for 31 days and Overdraft for 57 days, amounting to ₹35,745.17 crore for various purposes. The State Government repaid an amount ₹35,215.35 crore along with an interest of ₹28.21 crore leaving a balance of ₹529.82 crore. The Cash Balance Investment of the State during the five-year period 2015-16 to 2019-20 are given below. Table 2.46: Cash Balance Investment Account (Major Head-8673)
(₹ in crore) Year Opening
Balance Closing Balance
Increase (+)/ Decrease(-)
Interest earned
2015-16 147.05 1636.75 1489.69 40.85 2016-17 1636.75 1944.50 307.76 78.32 2017-18 1944.50 891.03 -1053.47 47.66 2018-19 891.03 189.53 -701.49 37.14 2019-20 189.53 1.67 -187.86 7.88
Source: Finance Accounts of respective years
Chart 2.25 below, compares the balances available in the Cash Account and Market Loans taken by the State during the period 2015-16 to 2019-20. Both

State Finances Audit Report for the year ended 31 March 2020
88
market loan and Cash balance showed a decreasing trend from 2017-18 to 2019-20.
Chart 2.25: Market Loan vis-à-vis Cash Balance
Chart 2.26: Month wise movement of Cash Balances and Net Cash Balance Investment during the year
From the above chart it is seen that the monthly cash balance has shown a negative balance from June 2019 onwards and was (-) ₹184.97 crore in March 2020.
3229 36502733 2203 2010
15000
17300
2050019500
18073
2015-16 2016-17 2017-18 2018-19 2019-20
(₹ in
cro
re)
Cash Balance Market loans
38.77
531.71
23.82 -5.31-168.44
-10.49 -2.16 -29.42 -37.60
-440.20
-108.90
-184.97
-1880.86
1280.90
493.90
-663.87
-233.12
769.23
-691.31
1113.00
-1230.34
835.54
394.80
-0.03
-2500.00
-2000.00
-1500.00
-1000.00
-500.00
0.00
500.00
1000.00
1500.00
( ₹ in
cro
re)
Cash balance at the end of the month Net Cash Balance Investment

Chapter II – Finances of the State
89
2.8 Conclusions
1. Revenue resources
Revenue receipts of the State increased from ₹69,033 crore in 2015-16 to ₹90,225 crore in 2019-20, recording a growth of 31 per cent during the last five years. The State’s own tax revenue, being the main source of revenue in revenue receipts increased by only 29 per cent during the period and its share in revenue receipts also remained at 56 per cent in 2015-16 and 2019-20 indicating no growth of tax revenue during the period.
2. Revenue Expenditure
Revenue Expenditure of the State increased from ₹78,690 crore in 2015-16 to ₹1,04,720 crore in 2019-20 recording a growth of 33 per cent during the five-year period. Revenue expenditure as a percentage of total expenditure ranged between 89 to 92 per cent during the period showing predominance of revenue expenditure in total expenditure. Share of committed expenditure in revenue expenditure was 68 per cent during 2019-20 and it consumed 79 per cent of the revenue receipts during the year. Interest payments consumed 21 per cent of revenue receipts during 2019-20 and is a matter of concern for the State Government.
3. Quality of expenditure
Capital Expenditure of the State increased from ₹7,500 crore in 2015-16 to ₹8,455 crore in 2019-20 recording a meagre growth of 12 per cent during the five year period showing low priority of the Government towards capital expenditure. The State’s share of expenditure on the health and education sectors in the total expenditure was more than General Category States, but the share of capital expenditure was less than that of General Category States. Though the State Government invested ₹8,881.70 crore in Statutory Corporations, Government Companies, Joint Stock Companies and Co-operatives, average return on these investments was 1.39 per cent in the last five years while the Government paid an average interest rate of 7.33 per cent on its borrowings during 2015-16 to 2019-20. The interest receipt on loans and advances given by State Government was 0.30 per cent during 2019-20 against the average cost of borrowing of 7.58 per cent. During the year the Government invested ₹292.68 crore in loss making institutions and ₹15.04 crore in institution whose net worth is completely eroded.

State Finances Audit Report for the year ended 31 March 2020
90
4. Reserve Funds and liabilities
The Consolidated Sinking Fund was constituted with the aim to amortize the outstanding liabilities of the Government, but the Government did not contribute to the fund during 2019-20. Similarly, the Government has to constitute a Guarantee Redemption Fund for crediting guarantee commission collected for meeting future liabilities arising out of guarantees given by the Government. The Guarantee Redemption Fund has not been constituted so far and guarantee commission of ₹1,250.59 crore collected during 2003-04 to 2019-20 was not credited to the Fund. The State Disaster Response Fund (SDRF) had an accumulated balance of ₹551.61 crore by the end of March 2020. As per the guidelines issued by GoI, accretions to SDRF have to be invested in GoI Securities/Treasury Bills by the State Executive Committee constituted for the management of the fund. However, this was not done.
5. Debt Management Open market Loans had a major share (54 per cent) in the total fiscal liabilities of the State. The net debt available with the State for development activities was only ₹3,132 crore (5.18 per cent of public debt receipts) during 2019-20.
6. Debt Sustainability
The ratio of Debt to GSDP of the State increased from 20.02 per cent in 2018-19 to 20.43 per cent in 2019-20. Similarly, the ratio of interest payments to total revenue receipts of the State increased from 18.04 per cent in 2018-19 to 21.3 per cent in 2019-20.
2.9 Recommendations
1. The Government needs to address the growth of its own tax revenue and take measures to improve the same.
2. The State needs to improve its capital expenditure to augment its growth and
development. The government may review the investment made in loss making institutions and introduce a methodology to revive such institution.

Chapter II – Finances of the State
91
3. The government need to take necessary steps to constitute a Guarantee Redemption Fund and also invest the accretions in the SDRF in GoI Securities/ Treasury bills.
4. The State Government should closely monitor the debt sustainability of the
State and make earnest efforts to maintain a healthy debt-GSDP ratio and also ensure that the incremental interest burden is adequately covered.


