\\ State finances hit by economic slowdown in 2019-20, curtailing growth in revenue and spending Revenue loss and increase in debt due to COVID-19, expenditure priorities may also change States given loans instead of GST compensation grants; 14% growth guarantee ends in 2022 Lower revenue growth in 2019-20 curtails growth in expenditure Revenue loss due to COVID-19 in 2020-21 will further hurt spending Higher central cesses and surcharges reduce devolution of taxes to states States given loans in 2020-21 instead of GST compensation grants STATE OF STATE FINANCES Suyash Tiwari Saket Surya December 2020
Transcript
\\
State finances hit by economic slowdown in 2019-20, curtailing growth in revenue and spending
Revenue loss and increase in debt due to COVID-19, expenditure priorities may also change
States given loans instead of GST
compensation grants; 14% growth guarantee ends in 2022
STATE OF STATE FINANCES
Suyash Tiwari Saket Surya
December 2020
Lower revenue growth in 2019-20 curtails growth in expenditure
Revenue loss due to COVID-19 in 2020-21 will further hurt spending
Higher central cesses and surcharges reduce devolution of taxes to states
States given loans in 2020-21 instead of GST compensation grants
STATE OF STATE FINANCES
Suyash Tiwari Saket Surya
December 2020
The negative impact of economic slowdown during 2019-20 was acutely visible in state finances in
the form of nearly zero growth in revenue as compared to the previous year. The financial year
2020-21 started with the onset of COVID-19 pandemic and strict lockdown restrictions which led to
a contraction in economic activity. This has created a situation where, on one hand, revenue
collection of both centre and states has further suffered; on the other hand, there is the increased
expenditure on account of providing relief to the vulnerable sections and increasing public
investment to boost the economy. This has increased reliance of states on borrowings to fund their
expenditure. Also, lower GST collections have led to an increase in the compensation requirement
from the centre, creating a challenge for its funding. Further risks have emerged from the persistent
poor financial situation of state-owned power distribution companies. In this context, we look at the
recent trends and developments in the finances of state governments.
This report is based on the data compiled from state budget documents of the last eleven years. It
covers all states, and the union territories of Jammu and Kashmir (only for 2020-21) and Delhi.
Note that most of the states presented their budgets for the year 2020-21 were presented before the
imposition of the national lockdown, and the final outcome this year will likely be quite different
from the budget estimates. Figures for 2019-20 are revised estimates, unless stated otherwise. Data
for salaries, outstanding liabilities, guarantees, and GSDP of states has been taken from various
reports of RBI. The following abbreviations have been used in the charts throughout the report.
State Abbreviation State Abbreviation State Abbreviation
Andhra Pradesh AP Jharkhand JH Odisha OD
Arunachal Pradesh AR Jammu and Kashmir JK Punjab PB
Assam AS Karnataka KA Rajasthan RJ
Bihar BR Kerala KL Sikkim SK
Chhattisgarh CG Meghalaya MG Tamil Nadu TN
Delhi DL Maharashtra MH Tripura TR
Goa GA Madhya Pradesh MP Telangana TS
Gujarat GJ Manipur MN Uttarakhand UK
Himachal Pradesh HP Mizoram MZ Uttar Pradesh UP
Haryana HR Nagaland NL West Bengal WB
Contents
Section Page No.
Developing Themes in State Finances 1-8
Trends in State Finances
i. Receipts 9-14
ii. Expenditure 14-18
iii. Debt and Deficit 18-22
Appendix 1: Fiscal deficit of states for 2020-21 23
Appendix 2: GST compensation to states 24-25
Appendix 3: Recommendations of the 15th Finance Commission for 2020-21 25-26
Appendix 4: Spending by States on Key Sectors 27-30
Glossary of Key Terms 31
DISCLAIMER: This document is being furnished to you for your information. You may choose to reproduce or redistribute this report for non-commercial purposes in part or in full to any other person with due acknowledgement of PRS Legislative Research (“PRS”). The
opinions expressed herein are entirely those of the author(s). PRS makes every effort to use reliable and comprehensive information, but
PRS does not represent that the contents of the report are accurate or complete. PRS is an independent, not-for-profit group. This document has been prepared without regard to the objectives or opinions of those who may receive it.
1
DEVELOPING THEMES IN STATE FINANCES
▪ Low growth in receipts and expenditure: In 2019-20,
nominal GDP (i.e., real GDP plus inflation) grew at 7.2%
as compared to the budget estimate of 12%. As a result,
states not only saw a cut in the devolution they expected
out of the Centre’s tax revenue, their own tax revenue also
got impacted. States’ revenue receipts decreased by 0.8%
in 2019-20 over the previous year, significantly lower than
the budgeted growth of 20%. States’ expenditure growth
was curtailed at 3.9% in 2019-20 (average growth during
2011-19 was 13.8%). As revenue expenditure is relatively
inflexible, due to items such as salaries, pension and
interest, capital outlay saw a disproportionately higher cut,
declining by 8.7% from the previous year (Page 2).
Figure 1: Growth in states’ revenue
receipts and expenditure (2011-20)
▪ Increased reliance on borrowing in 2020-21: Due to COVID-19, economic activity declined in
the first half of 2020-21. This has resulted in a decline in tax revenue. As per the data available
for 21 states for Apr-Oct 2020, their revenue receipts declined by 13% from the same period last
year. To sustain expenditure, the Centre has allowed all states to increase their borrowings this
year. The fiscal deficit limit has been raised from 3% of GSDP to 4% of GSDP. Another 1% of
GSDP will be allowed after implementation of four reforms (0.25% of GSDP for each reform):
one nation one ration card, ease of doing business, power distribution, and urban local body/
utility. Till December 11, 2020, states borrowed Rs 4.6 lakh crore through market borrowings
(net), 82.5% higher than their net market borrowings during the same period last year (Page 3).
▪ GST compensation cess collection insufficient to pay compensation to states: Shortfall in a
state’s GST collection is compensated by the centre and funded through a cess. In 2019-20, the
GST compensation requirement of states was Rs 1.65
lakh crore, nearly double that of 2018-19. This resulted
in a shortfall of nearly Rs 70,000 crore which was partly
met through 2020-21 cess collection. In 2020-21, states’
compensation requirement is set to rise further to Rs 3
lakh crore, leaving a shortfall of about Rs 2.3 lakh crore.
Part of this (Rs 1.1 lakh crore) will be funded through
additional borrowings by states, and the remaining will be
paid by extending cess collections beyond June 2022.
The compensation guarantee ends in June 2022, after
which states dependent on compensation will see a gap in
their revenue balance (this could be significant for some
states such as Punjab where this item accounts for 20% of
the revenue receipts in 2019-20) (Pages 4 and 5).
Figure 2: GST cess collection and
compensation requirement (Rs crore)
▪ Increasing share of cess and surcharge in Centre’s tax revenue: Between 2012-13 and 2019-
20, the Centre’s cess and surcharge revenue rose from 0.9% of GDP to 1.7% of GDP. In contrast,
its gross tax revenue declined from 10.4% of GDP to 9.9% of GDP. The divisible pool of tax
revenue (which the centre shares with states) does not include revenue from cess and surcharge.
Therefore, the increasing share of cess and surcharge in the gross tax revenue has reduced the size
of the divisible pool (Page 6).
▪ Government expenditure on health below target: COVID-19 has brought focus on provision
of health services. The National Health Policy, 2017 recommends government expenditure on
health to be increased to 2.5% of GDP by 2025. Between 2015-16 and 2020-21, budget
allocation by the Centre and states together has increased from 0.9% of GDP to 1.1% of GDP (a
cumulative increase of 0.2% of GDP in six years). The National Policy also recommended that
expenditure on health by states should be increased to 8% or more of their budget by 2020. In
2020-21, none of the larger states have allocated 8% of their budget towards health (Page 7).
-4%
0%
4%
8%
12%
16%
20%
2011
-12
2012
-13
2013
-14
2014
-15
2015
-16
2016
-17
2017
-18
2018
-19
2019
-20
Revenue Expenditure
62,6
12
95,0
81
95,4
44
77,3
80
48,7
85
81,1
41
1,65
,302
3,00
,000
0
1,00,000
2,00,000
3,00,000
4,00,000
2017-18 2018-19 2019-20 2020-21
Cess collections Compensation requirement
2
Revenue shortfall due to the economic slowdown led to muted growth in expenditure in 2019-20
In its 2019-20 budget, the central government
estimated a 12% growth in the nominal GDP
(i.e., real GDP plus inflation) during the year.
However, the provisional GDP estimates
suggest that the growth in nominal GDP in
2019-20 was 7.2%. Since the union and state
budgets based their revenue estimates for
2019-20 on the assumption of a 12% GDP
growth, they did not meet their revenue
projections. States not only saw a cut in the
devolution they had expected out of the
Centre’s tax revenue, but their own tax
revenue also got impacted. As a result, states’
total revenue receipts decreased by 0.8% in
2019-20 over the previous year. This is
significantly lower than the budgeted growth
of 20% as well as the average growth of
13.3% seen during the period 2011-19.
Figure 3: Growth in states’ revenue receipts and
expenditure during 2011-20
Note: 2019-20 data from provisional accounts for all states except Delhi and Goa. 2019-20 revenue excludes one-time non-tax revenue
of Rs 71,180 crore that UP got as a transfer of its entire Sinking Fund
balance. Including that amount, 2019-20 revenue growth will be 2%. Sources: State Budget Documents; CAG (2019-20 data); PRS.
Revenue receipts shortfall: In 2019-20, Centre’s gross tax revenue declined by 3.4% over the
previous year, primarily due to the economic slowdown and the options of lower income tax rate for
domestic companies.1 As a result, devolution to states declined, which typically forms 27% of their
revenue receipts. The devolution in 2019-20 got further reduced by Rs 58,843 crore to account for the
extra devolution that Centre did in 2018-19 above what was actually due. Thus, in 2019-20, states
received Rs 6,50,677 crore as devolution, which is 20% lower than the budget estimate of Rs 8,09,133
crore. The slowdown in demand impacted the revenue from GST, which is levied on the consumption
of most goods and services. In 2019-20, the gross GST revenue (Centre+states) increased by just 4%
over the previous year.2 Since states have the guarantee of a 14% growth in their GST revenue till
2022, the compensation grants would have insulated them from any impact of the slowdown on GST
revenue. However, Centre deferred payment of Rs 65,546 crore of grants to the next year (page 4).
Impact on expenditure: Lower growth of revenue receipts led to curtailment of expenditure as well
as an increase in borrowings. States’ expenditure in 2019-20 increased by 3.9% over the previous
year, much lower than the 13.8% average growth seen during the period 2011-19. Since nearly half
of the revenue expenditure is made up of committed expenditure items, such as salaries, pension, and
interest, capital outlay bore the brunt. Revenue expenditure increased by 6%, whereas capital outlay
declined by 8.7% from the previous year. States’ borrowings also rose during the year – their fiscal
deficit widened from 2.37% of GDP in 2018-19 to 2.5% of GDP in 2019-20.
High budget estimates: States have consistently
over-estimated their revenue receipts while
preparing their budgets for the upcoming year. This
may be due to: (i) ambitious growth projections
made for the next year, or (ii) use of an unrealistic
‘revised estimate’ as base revenue for the present
year, which turns out to be an overestimate of the
actual revenue. This has resulted in a shortfall in
states’ revenue receipts over the years. In such a
scenario, states can either borrow more to plug the
shortfall or cut their budgeted expenditure. As
states’ fiscal deficit is restricted to 3% of GSDP by
their Fiscal Responsibility and Budget Management
Acts, they often end up cutting their expenditure.
Since revenue expenditure is relatively inflexible, a
higher cut is seen in capital outlay (Figure 4).
Figure 4: Revenue shortfall and underspending:
deviation of the actuals from budget estimates
Sources: State Budget Documents; CAG (2019-20 data); PRS.
-4%
0%
4%
8%
12%
16%
20%
2011
-12
2012
-13
2013
-14
2014
-15
2015
-16
2016
-17
2017
-18
2018
-19
2019
-20
Revenue Expenditure
-30%
-25%
-20%
-15%
-10%
-5%
0%
2011-12 2013-14 2015-16 2017-18 2019-20
Revenue shortfall
Underspending
Underspending - Capital outlay
3
With COVID-19 impacting revenue, states rely more on borrowing for expenditure in 2020-21
The 2020-21 union budget estimated a 10% growth in nominal GDP (i.e. real GDP plus inflation) for
the year 2020-21. More than half of the states estimated their nominal GSDP growth rate in the range
of 8%-13%. However, due to the impact of COVID-19 and the lockdown, the actual growth in 2020-
21 may be negative, with nominal GDP during the first two quarters contracting by 22.6% and 4%
respectively.3,4,5 RBI has projected that real GDP will contract by 7.5% this year.6 As a result, the
revenue of the centre and the states, particularly tax revenue, will likely be lower than budgeted.
Figure 5 shows the change in the revenue receipts of 21 states (for which data was available) during
the period Apr-Oct 2020 over the same period in 2019-20. On average, states’ revenue declined by
13% in comparison to the same period previous year. While these states had generated 52% of their
revenue in the period Apr-Oct 2019, this year, they have raised only 37% of the full-year target in the
corresponding period. Note that the 2020-21 budget estimate for revenue of these states was based on
a 22% growth over the previous year’s revenue, much higher than the growth seen in 2019-20.
To aid the cash flow situation of states in the initial part of the year, the Centre transferred devolution
out of its tax revenue based on the budget estimates, not actual tax collections. As the total devolution
in 2020-21 will take into account the year-round shortfall in the Centre’s gross tax revenue, states’
share during the rest of the year may get revised downwards, affecting the devolution receipts.7 This
is likely to affect those states more which receive a higher share of revenue in the form of devolution.
Figure 5: Change in states’ revenue receipts during the period Apr-Oct 2020 over the same period in 2019
Note: A major reason for the growth in revenue of some states is higher grants-in-aid from the Centre. Data for Himachal Pradesh and West Bengal is till the month of September. Latest data (Sep/ Oct 2020) not available for the other states not in the graph.
Sources: CAG; PRS.
Since states’ revenue would be severely constrained in 2020-21, they need to either increase their
borrowings to maintain the budgeted expenditure or curtail expenditure. To increase states’ capacity
to borrow, the Centre has allowed states to increase their fiscal deficit from 3% of GSDP to 5% of
GSDP for 2020-21 (i.e., an additional borrowing of Rs 4.28 lakh crore). The increased limit of 5% of
GSDP allows states an unconditional fiscal deficit of up to 3.5% of GSDP. Another 0.5% of GSDP is
available to states which have chosen Option 1 for GST compensation borrowing (details on pages 5-
6). As all states have chosen Option 1, they are now eligible for a fiscal deficit limit of 4% of GSDP.
The remaining 1% of GSDP will be allowed after implementation of reforms in four areas (0.25% of
GSDP for each reform): one nation one ration card, ease of doing business, urban local body/ utility,
and power distribution. Appendix 1 shows the unconditional and conditional fiscal deficit approved
for states for 2020-21. Note that the market borrowings allowed to states have been approved on a
provisional basis and may get revised later during the year. Till December 11, 2020, states have
borrowed Rs 4.6 lakh crore through market borrowings (net, including loans for GST compensation),
which is 82.5% higher than the net market borrowings done during the same period last year.
Faced with a revenue shortfall and revised spending priorities amidst the COVID-19 pandemic, states
have also taken measures to defer or cut their expenditure. During the period Apr-Oct 2020, while the
expenditure of the 21 states decreased by 3.2%, capital expenditure saw a disproportionately higher
decline of 25.3%. To incentivise states to do capital investment in 2020-21, the Centre is providing
50-year interest-free loans of total Rs 12,000 crore to states (equivalent to 2% of their planned capital
outlay for 2020-21), of which Rs 2,000 crore is conditional based on the reforms discussed above.
2%
-10%
-21%
-7%
-17% -16%
-23%
-4%
2%
-13%
-4%-8%
18%
-17%
3%
-12%
11%
-10%
8%
-21%-18%
-30%
-20%
-10%
0%
10%
20%
AP CG GJ HP HR JH KA KL MG MP NL OD PB RJ SK TN TR TS UK UP WB
4
GST compensation cess collections insufficient for financing states’ compensation requirements
With the implementation of GST in 2017, the principle of indirect taxation for many goods and
services changed from origin-based to destination-based. This means that the ability to tax goods and
services and raise revenue shifted from the origin state (where goods or services are produced) to the
destination state (where they are consumed). This change posed a risk of revenue uncertainty for
some states. This concern was addressed through constitutional amendments, which required
Parliament to make a law to provide for compensation to states for five years to avoid any loss of
revenue due to the implementation of GST.8
Consequently, the GST (Compensation to States) Act was enacted in 2017.9 The Act guarantees all
states a compounded annual growth of 14% in their GST revenue during the period July 2017-June
2022. If a state’s GST revenue grows slower than 14%, such ‘loss of revenue’ will be covered by the
Centre by providing GST compensation grants to the state. The Centre levies a GST compensation
cess on certain luxury and sin goods such as cigarettes and tobacco products, pan masala, caffeinated
beverages, coal, and some passenger vehicles. The Act requires the Centre to credit this cess revenue
into a separate Compensation Fund and all compensation grants to states are paid out of this Fund.
For 2018-19, the Centre gave Rs 81,141 crore to
states as GST compensation. However, for the year
2019-20, the compensation requirement of states
nearly doubled to Rs 1.65 lakh crore. In 2019-20, the
nominal GDP grew just 7.2%, much lower than the
forecast made in the union budget (Figure 6).
Consequently, gross GST revenue (Centre+states)
increased by just 4% over the previous year.2 As
states are assured a 14% growth rate in their GST
revenue, their compensation requirement increased.
At the same time, the cess collection slowed down
due to decline in sales of certain goods on which the
cess is imposed. For instance, in 2019-20, sales of
passenger vehicles declined by 18% and coal offtake
from domestic coal companies reduced by 5%.10,11,12
Figure 6: GDP growth rate (2017-21)
Sources: Union Budget Documents; MOSPI; PRS.
Thus, while the compensation requirement increased by 104% to Rs 1.65 lakh crore, cess collection
registered a growth of just 0.4% in 2019-20 (Figure 7). This resulted in a wide gap of Rs 70,000 crore
between the cess collected and the compensation payable to states for 2019-20. It was met through:
(i) surplus cess collection from previous years (nearly Rs 28,000 crore), (ii) utilisation of close to Rs
9,000 crore out of the cess collected in 2020-21, and (iii) a transfer of Rs 33,412 crore of unsettled
GST funds from the Centre to the Compensation Fund.13 These unsettled funds are GST collections
generated in 2017-18 from inter-state and foreign trade, but not settled between the Centre and states.
While these sources were used to bridge
the shortfall, the provisioning was not done
on time, resulting in delayed payment to
states and affecting their 2019-20 finances.
For the months April-September 2019,
compensation was paid to states on time,
i.e. on a bi-monthly basis as per the GST
(Compensation to States) Act, 2017.
However, following that, there was a delay
in the payment of compensation for the
months October 2019-March 2020. Close
to 40% of the compensation dues of states
for 2019-20 was paid by the Centre in the
financial year 2020-21, which amounts to
more than Rs 65,500 crore.14
Figure 7: Cess collections insufficient for providing
compensation grants to states in 2019-20 and 2020-21
Sources: Union Budget Documents; Ministry of Finance; GST Council;
Lok Sabha Questions; PRS.
14%
12% 10%11.1% 11.0%
7.2%
0%
4%
8%
12%
16%
2017-18 2018-19 2019-20 2020-21
GST revenue growth guaranteed to states
GDP growth (budget estimate)
GDP growth (actual)
62,61295,081 95,444
77,38048,785
81,141
1,65,302
3,00,000
0
50,000
1,00,000
1,50,000
2,00,000
2,50,000
3,00,000
3,50,000
2017-18 2018-19 2019-20 2020-21
Rs
cror
e
Cess collections Compensation requirement
5
COVID-19 to further widen the gap between compensation cess and dues to Rs 2.3 lakh crore
In the 2020-21 budget, the Centre estimated a 10% growth in nominal GDP. Due to the impact of
COVID-19 and the lockdown, the actual growth is likely to be much lower, with nominal GDP during
Apr-Sep 2020 contracting by 13.3%.5 In such a scenario, states’ GST revenue is also expected to be
much lower than expected, leading to a higher compensation requirement. Taking into account the
prevailing economic situation, in August 2020, the Centre estimated the compensation requirement of
states for the year 2020-21 at nearly Rs 3 lakh crore.15 However, the ability of the Centre to pay this
compensation depends on the cess collections, which are also going to get impacted this year. After
deducting nearly Rs 9,000 crore used for paying compensation for 2019-20, the Centre estimates the
cess collections available for compensation for 2020-21 at Rs 68,700 crore. This would lead to a
shortfall of nearly Rs 2.3 lakh crore. Till October 2020, cess collection was 23% less in comparison
to the same period last year, with about Rs 34,000 crore available to pay compensation to all states.
For the four-month period April-July 2020, the compensation requirement of states (provisional) was
Rs 1,51,365 crore, 92% of the compensation for the full year 2019-20.16 Table 6 in Appendix 2 shows
the state-wise compensation due for the period April-July 2020. Under the GST (Compensation to
States) Act, 2017, compensation must be paid to states on a bi-monthly basis. However, the first
payment for 2020-21, of Rs 20,000 crore, was done by the Centre in October 2020.17
The GST (Compensation to States) Act, 2017 requires the Centre to provide compensation to states
through the money available in the Compensation Fund. The Union Finance Minister, in her budget
speech in February 2020, stated that transfers to the Fund would be limited to the GST compensation
cess collections.18 However, the Centre has a Constitutional obligation to meet states’ compensation
requirement for a period of five years. Note that the GST (Compensation to States) Act, 2017 allows
the GST Council to recommend any funds/ amount for credit into the Compensation Fund. At the
GST Council meeting on August 27, 2020, the Centre proposed two options to states to meet the Rs
2.3 lakh crore shortfall in compensation cess collections in 2020-21. These were:
Option 1 (partial borrowing): States can borrow in 2020-21 only to meet the shortfall related to
GST implementation (Rs 1.1 lakh crore), with the rest payable after 2022 from surplus cess
collections. Out of the Rs 2.3 lakh crore shortfall, the Centre attributed Rs 1.1 lakh crore shortfall to
implementation of GST (assuming a 7% growth in states’ GST revenue in 2020-21), with the rest due
to the COVID-19 pandemic. Note that the GST (Compensation to States Act), 2017 does not make
any such distinction as it calculates compensation based on the actual revenue of states. For the
borrowing under Option 1, the principal and interest on it will be refunded by future cess collections.
Option 2 (full borrowing): States can borrow in 2020-21 to meet the entire shortfall of Rs 2.3 lakh
crore. Only the principal will be refunded by future cess collections, and states have to pay interest.
Thus, Option 2 required states to incur expenditure, in the form of interest payments, to receive funds
against the GST compensation guarantee. All states and union territories have chosen Option 1
instead.19 As per Option 1, the Centre increased its borrowing target in October 2020 by Rs 1.1 lakh
crore to provide back-to-back loans to states. Unlike previous years, where compensation grants
would increase the revenue receipts of states (thus lowering the fiscal deficit), these back-to-back
loans will increase the fiscal deficit of states. However, such borrowing will be counted over and
above the fiscal deficit limit of 5% of GSDP allowed to states for 2020-21. Till December 21, 2020,
Rs 48,000 crore has been borrowed by states under Option 1.20 Five states (Arunachal Pradesh,
Manipur, Mizoram, Nagaland, and Sikkim) have not taken any loan yet under Option 1, as they do not
have any gap in their revenue on account of GST implementation, as per the Centre’s estimates.20
Impact on states post 2022: States have been guaranteed compensation only for five years. After
June 2022, states dependent on compensation will see a revenue gap in absence of these grants (they
will still get the delayed compensation for 2020-21 as per Option 1 for some time). As a result, they
have less than two years to bridge this gap with other tax and non-tax sources to avoid a potential loss
of revenue. This is particularly crucial for states where the GST compensation grants form a large
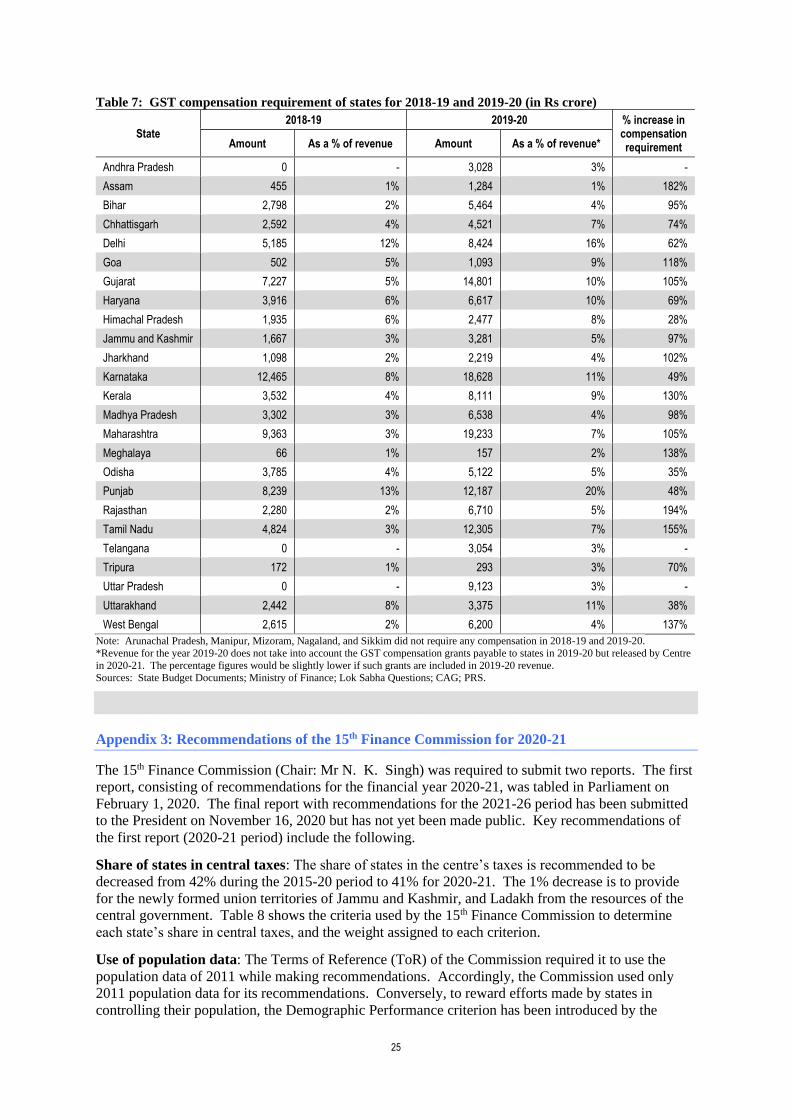
part of their revenue, e.g. 20% in Punjab and 16% in Delhi in 2019-20. See Table 7 in Appendix 2 for
the compensation grants of each state in 2018-19 and 2019-20.
6
Higher share of cess and surcharge in Centre’s gross tax revenue reduces devolution to states
The Finance Commission recommends the share of Centre and states in the divisible pool, which is
made up of net proceeds of taxes required to be divided between them as per the Constitution. Article
270 of the Constitution specifies the taxes which form the divisible pool. It does not include any cess
or surcharge levied by Centre. As a result, the entire cess and surcharge revenue forms part of
Centre’s net tax revenue and is not shared with states as part of devolution.
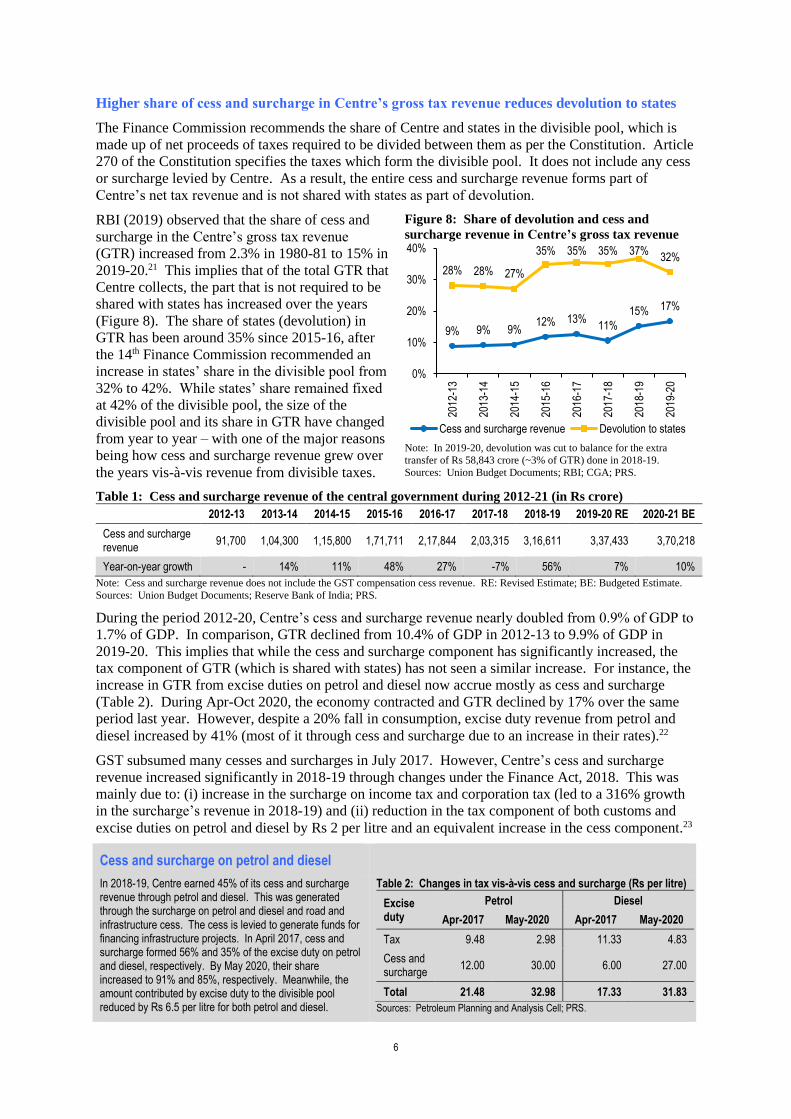
RBI (2019) observed that the share of cess and
surcharge in the Centre’s gross tax revenue
(GTR) increased from 2.3% in 1980-81 to 15% in
2019-20.21 This implies that of the total GTR that
Centre collects, the part that is not required to be
shared with states has increased over the years
(Figure 8). The share of states (devolution) in
GTR has been around 35% since 2015-16, after
the 14th Finance Commission recommended an
increase in states’ share in the divisible pool from
32% to 42%. While states’ share remained fixed
at 42% of the divisible pool, the size of the
divisible pool and its share in GTR have changed
from year to year – with one of the major reasons
being how cess and surcharge revenue grew over
the years vis-à-vis revenue from divisible taxes.
Figure 8: Share of devolution and cess and
surcharge revenue in Centre’s gross tax revenue
Note: In 2019-20, devolution was cut to balance for the extra
transfer of Rs 58,843 crore (~3% of GTR) done in 2018-19.
Sources: Union Budget Documents; RBI; CGA; PRS.
Table 1: Cess and surcharge revenue of the central government during 2012-21 (in Rs crore)
2012-13 2013-14 2014-15 2015-16 2016-17 2017-18 2018-19 2019-20 RE 2020-21 BE
Note: Cess and surcharge revenue does not include the GST compensation cess revenue. RE: Revised Estimate; BE: Budgeted Estimate.
Sources: Union Budget Documents; Reserve Bank of India; PRS.
During the period 2012-20, Centre’s cess and surcharge revenue nearly doubled from 0.9% of GDP to
1.7% of GDP. In comparison, GTR declined from 10.4% of GDP in 2012-13 to 9.9% of GDP in
2019-20. This implies that while the cess and surcharge component has significantly increased, the
tax component of GTR (which is shared with states) has not seen a similar increase. For instance, the
increase in GTR from excise duties on petrol and diesel now accrue mostly as cess and surcharge
(Table 2). During Apr-Oct 2020, the economy contracted and GTR declined by 17% over the same
period last year. However, despite a 20% fall in consumption, excise duty revenue from petrol and
diesel increased by 41% (most of it through cess and surcharge due to an increase in their rates).22
GST subsumed many cesses and surcharges in July 2017. However, Centre’s cess and surcharge
revenue increased significantly in 2018-19 through changes under the Finance Act, 2018. This was
mainly due to: (i) increase in the surcharge on income tax and corporation tax (led to a 316% growth
in the surcharge’s revenue in 2018-19) and (ii) reduction in the tax component of both customs and
excise duties on petrol and diesel by Rs 2 per litre and an equivalent increase in the cess component.23
Cess and surcharge on petrol and diesel
In 2018-19, Centre earned 45% of its cess and surcharge revenue through petrol and diesel. This was generated through the surcharge on petrol and diesel and road and infrastructure cess. The cess is levied to generate funds for financing infrastructure projects. In April 2017, cess and surcharge formed 56% and 35% of the excise duty on petrol and diesel, respectively. By May 2020, their share increased to 91% and 85%, respectively. Meanwhile, the amount contributed by excise duty to the divisible pool reduced by Rs 6.5 per litre for both petrol and diesel.
Table 2: Changes in tax vis-à-vis cess and surcharge (Rs per litre)
Excise duty
Petrol Diesel
Apr-2017 May-2020 Apr-2017 May-2020
Tax 9.48 2.98 11.33 4.83
Cess and surcharge
12.00 30.00 6.00 27.00
Total 21.48 32.98 17.33 31.83
Sources: Petroleum Planning and Analysis Cell; PRS.
9% 9% 9%12% 13%
11%
15% 17%
28% 28% 27%
35% 35% 35% 37%32%
0%
10%
20%
30%
40%
2012
-13
2013
-14
2014
-15
2015
-16
2016
-17
2017
-18
2018
-19
2019
-20
Cess and surcharge revenue Devolution to states
7
Budget allocation towards health likely to miss the targets set under the National Policy
The onset of the COVID-19 pandemic has brought back focus on the state of the healthcare system in
the country. The High-Level Group on Health Sector (2019) constituted by 15th Finance Commission
had observed that there is a need for a larger allocation of funds towards the health sector for meeting
the key targets regarding improvement in health services.24 The National Health Policy, 2017, which
aims to progressively achieve universal health coverage, recommends the government expenditure on
health to be increased to 2.5% of GDP by 2025.25
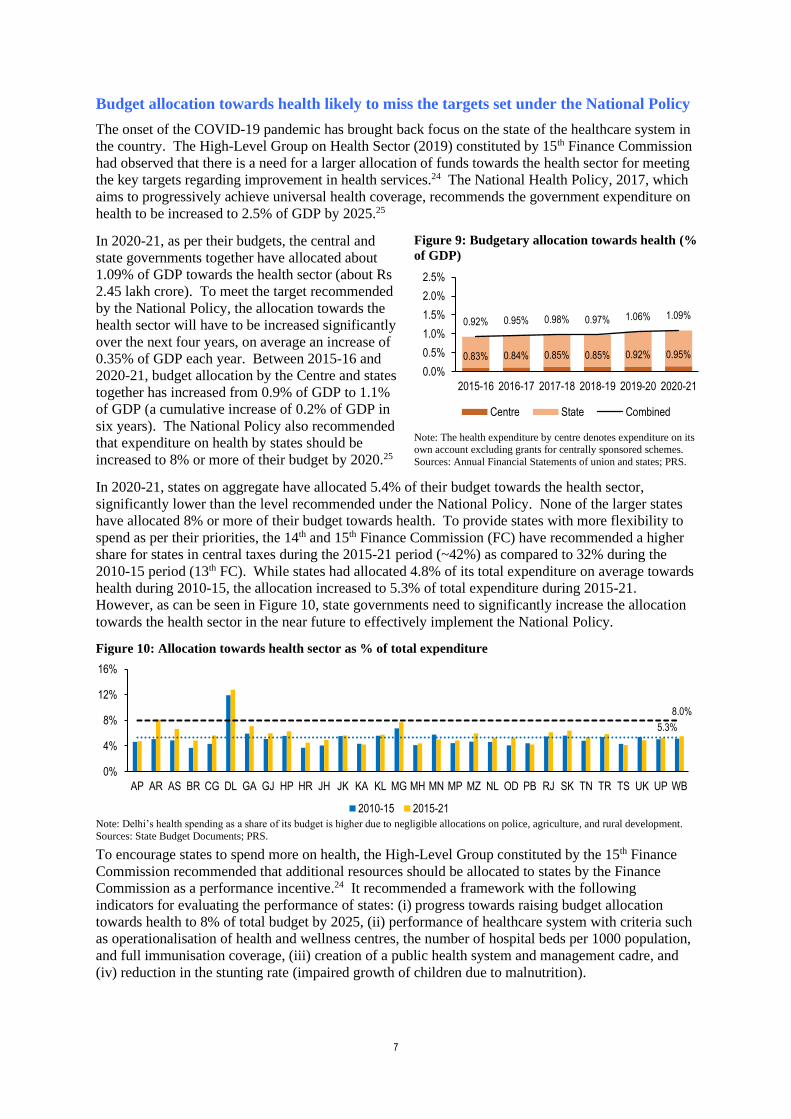
In 2020-21, as per their budgets, the central and
state governments together have allocated about
1.09% of GDP towards the health sector (about Rs
2.45 lakh crore). To meet the target recommended
by the National Policy, the allocation towards the
health sector will have to be increased significantly
over the next four years, on average an increase of
0.35% of GDP each year. Between 2015-16 and
2020-21, budget allocation by the Centre and states
together has increased from 0.9% of GDP to 1.1%
of GDP (a cumulative increase of 0.2% of GDP in
six years). The National Policy also recommended
that expenditure on health by states should be
increased to 8% or more of their budget by 2020.25
Figure 9: Budgetary allocation towards health (%
of GDP)
Note: The health expenditure by centre denotes expenditure on its own account excluding grants for centrally sponsored schemes.
Sources: Annual Financial Statements of union and states; PRS.
In 2020-21, states on aggregate have allocated 5.4% of their budget towards the health sector,
significantly lower than the level recommended under the National Policy. None of the larger states
have allocated 8% or more of their budget towards health. To provide states with more flexibility to
spend as per their priorities, the 14th and 15th Finance Commission (FC) have recommended a higher
share for states in central taxes during the 2015-21 period (~42%) as compared to 32% during the
2010-15 period (13th FC). While states had allocated 4.8% of its total expenditure on average towards
health during 2010-15, the allocation increased to 5.3% of total expenditure during 2015-21.
However, as can be seen in Figure 10, state governments need to significantly increase the allocation
towards the health sector in the near future to effectively implement the National Policy.
Figure 10: Allocation towards health sector as % of total expenditure
Note: Delhi’s health spending as a share of its budget is higher due to negligible allocations on police, agriculture, and rural development.
Sources: State Budget Documents; PRS.
To encourage states to spend more on health, the High-Level Group constituted by the 15th Finance
Commission recommended that additional resources should be allocated to states by the Finance
Commission as a performance incentive.24 It recommended a framework with the following
indicators for evaluating the performance of states: (i) progress towards raising budget allocation
towards health to 8% of total budget by 2025, (ii) performance of healthcare system with criteria such
as operationalisation of health and wellness centres, the number of hospital beds per 1000 population,
and full immunisation coverage, (iii) creation of a public health system and management cadre, and
(iv) reduction in the stunting rate (impaired growth of children due to malnutrition).
0.83% 0.84% 0.85% 0.85% 0.92% 0.95%
0.92% 0.95% 0.98% 0.97% 1.06% 1.09%
0.0%
0.5%
1.0%
1.5%
2.0%
2.5%
2015-16 2016-17 2017-18 2018-19 2019-20 2020-21
Centre State Combined
8.0%
5.3%
0%
4%
8%
12%
16%
AP AR AS BR CG DL GA GJ HP HR JH JK KA KL MG MH MN MP MZ NL OD PB RJ SK TN TR TS UK UP WB
2010-15 2015-21
8
Deteriorating financial situation of discoms lead to higher contingent liabilities for states
Power distribution activity in India is mostly carried out
by state government-owned companies (discoms). The
poor financial situation of discoms has been a continued
area of concern. Discoms have continued to suffer
losses, resulting from underpricing of tariffs and high
levels of technical and commercial losses, among other
factors. Since state governments own the discoms, they
often provide a guarantee for the loans taken by discoms.
More than 60% of the total outstanding guarantees given
by state governments is for power sector companies.21
These guarantees are contingent liabilities of the states as
states will have to honour them in case of default by any
discom. The risk for invocation of these guarantees
could further rise in near future, owing to continuing
losses and an increase in the outstanding debt of discoms.
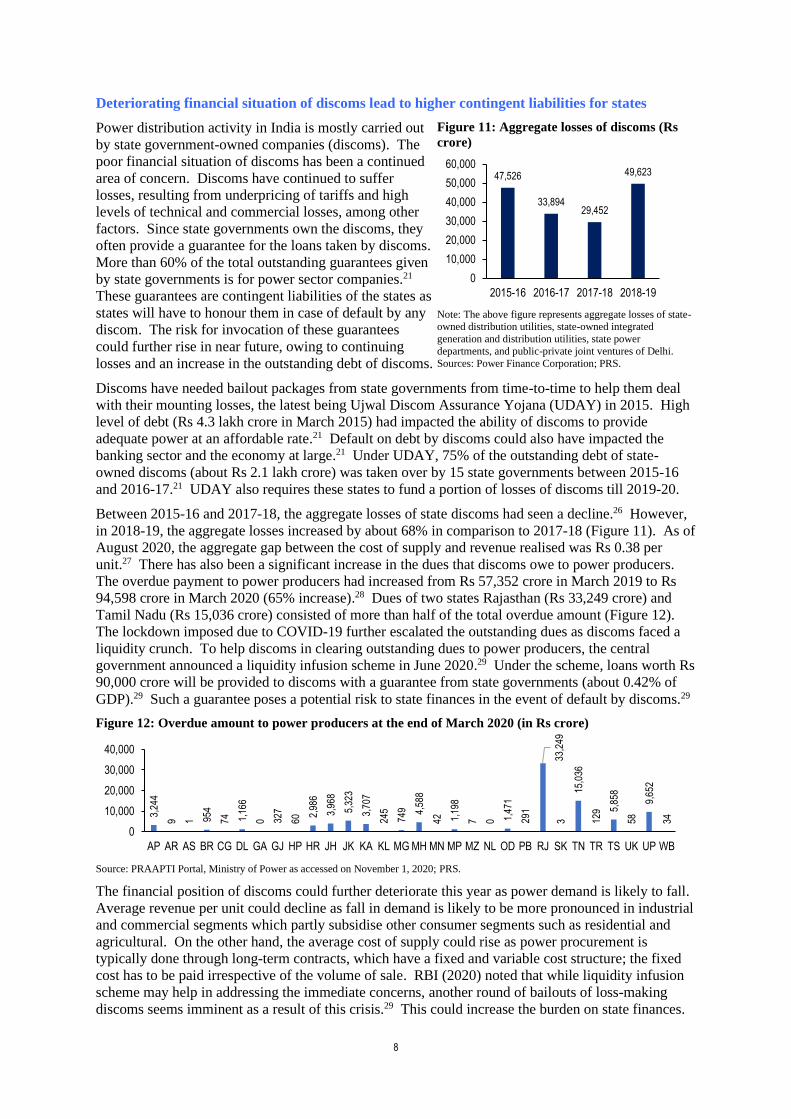
Figure 11: Aggregate losses of discoms (Rs
crore)
Note: The above figure represents aggregate losses of state-
owned distribution utilities, state-owned integrated
generation and distribution utilities, state power
departments, and public-private joint ventures of Delhi.
Sources: Power Finance Corporation; PRS.
Discoms have needed bailout packages from state governments from time-to-time to help them deal
with their mounting losses, the latest being Ujwal Discom Assurance Yojana (UDAY) in 2015. High
level of debt (Rs 4.3 lakh crore in March 2015) had impacted the ability of discoms to provide
adequate power at an affordable rate.21 Default on debt by discoms could also have impacted the
banking sector and the economy at large.21 Under UDAY, 75% of the outstanding debt of state-
owned discoms (about Rs 2.1 lakh crore) was taken over by 15 state governments between 2015-16
and 2016-17.21 UDAY also requires these states to fund a portion of losses of discoms till 2019-20.
Between 2015-16 and 2017-18, the aggregate losses of state discoms had seen a decline.26 However,
in 2018-19, the aggregate losses increased by about 68% in comparison to 2017-18 (Figure 11). As of
August 2020, the aggregate gap between the cost of supply and revenue realised was Rs 0.38 per
unit.27 There has also been a significant increase in the dues that discoms owe to power producers.
The overdue payment to power producers had increased from Rs 57,352 crore in March 2019 to Rs
94,598 crore in March 2020 (65% increase).28 Dues of two states Rajasthan (Rs 33,249 crore) and
Tamil Nadu (Rs 15,036 crore) consisted of more than half of the total overdue amount (Figure 12).
The lockdown imposed due to COVID-19 further escalated the outstanding dues as discoms faced a
liquidity crunch. To help discoms in clearing outstanding dues to power producers, the central
government announced a liquidity infusion scheme in June 2020.29 Under the scheme, loans worth Rs
90,000 crore will be provided to discoms with a guarantee from state governments (about 0.42% of
GDP).29 Such a guarantee poses a potential risk to state finances in the event of default by discoms.29
Figure 12: Overdue amount to power producers at the end of March 2020 (in Rs crore)
Source: PRAAPTI Portal, Ministry of Power as accessed on November 1, 2020; PRS.
The financial position of discoms could further deteriorate this year as power demand is likely to fall.
Average revenue per unit could decline as fall in demand is likely to be more pronounced in industrial
and commercial segments which partly subsidise other consumer segments such as residential and
agricultural. On the other hand, the average cost of supply could rise as power procurement is
typically done through long-term contracts, which have a fixed and variable cost structure; the fixed
cost has to be paid irrespective of the volume of sale. RBI (2020) noted that while liquidity infusion
scheme may help in addressing the immediate concerns, another round of bailouts of loss-making
discoms seems imminent as a result of this crisis.29 This could increase the burden on state finances.
47,526
33,89429,452
49,623
0
10,000
20,000
30,000
40,000
50,000
60,000
2015-16 2016-17 2017-18 2018-19
3,24
4
9 1 954
74 1,16
6
0 327
60
2,98
6
3,96
8
5,32
3
3,70
7
245
749 4,
588
42 1,19
8
7 0 1,47
1
291
33,2
493
15,0
36
129 5,
858
58
9,65
2
34
0
10,000
20,000
30,000
40,000
AP AR AS BR CG DL GA GJ HP HR JH JK KA KL MG MH MN MP MZ NL OD PB RJ SK TN TR TS UK UP WB
9
TRENDS IN STATE FINANCES
This section looks at the finances of the states and trends that have emerged during the period between
2015-16 and 2020-21 with respect to states’ revenue, expenditure, and deficit.
Own tax revenue is the largest source of revenue for most states; own non-tax is the smallest
Revenue receipts of states comprise revenue from own sources, and transfers from the centre. During
the 2015-21 period, 54% of revenue receipts of states has come from own sources, and 46% from
central transfers (Figure 13). Own revenue consists of tax revenue (46%), and non-tax revenue (8%).
Central transfers consist of states’ share in central taxes (27%), and grants-in-aid from the centre
(19%). Share in central taxes is based on the recommendations by the Finance Commission (FC).
The share of states in central taxes changed in 2020-21 as compared to 2019-20 as per the
recommendations given by the 15th FC for the year 2020-21. Table 3 compares funds received by
states for every 100 rupees added to the divisible pool of taxes during the 14th and 15th FC period.
Figure 13: Revenue receipts of states (2015-21)
Note: Data for Jammu and Kashmir corresponds to 2020-21.
Sources: State Budget Documents; PRS.
Table 3: Share in the divisible pool
State 14th FC
(2015-20) 15th FC
(2020-21) % change
AP 4.31 4.12 -4%
AR 1.38 1.76 27%
AS 3.31 3.12 -6%
BR 9.67 10.07 4%
CG 3.07 3.41 11%
GA 0.38 0.39 2%
GJ 3.10 3.39 10%
HP 0.71 0.80 13%
HR 1.10 1.07 -2%
JH 3.14 3.32 6%
JK 1.86 - -
KA 4.71 3.63 -23%
KL 2.50 1.95 -22%
MG 0.64 0.76 18%
MH 5.52 6.15 11%
MN 0.62 0.71 14%
MP 7.55 7.88 4%
MZ 0.45 0.51 13%
NL 0.50 0.56 12%
OD 4.64 4.63 0%
PB 1.57 1.78 13%
RJ 5.50 5.98 9%
SK 0.36 0.39 9%
TN 4.02 4.20 4%
TR 0.64 0.71 10%
TS 2.43 2.12 -13%
UK 1.05 1.10 5%
UP 17.95 17.93 0%
WB 7.33 7.51 2%
100 100 - Note: Jammu and Kashmir does not have any share in the divisible
pool in 2020-21 as it is not a state anymore.
Sources: Finance Commission Reports; PRS.
The change in the share of states may be attributed to: (i) shift in the criteria used for determining a
state’s share, (ii) shift in the weight assigned to each criterion, and (iii) overall change in the
percentage of the taxes devolved. The 15th FC had recommended a 41% share for states in the central
government’s tax revenue in 2020-21, the same level as the 42% share recommended by the 14th FC,
after accounting for the conversion of Jammu and Kashmir to a union territory. For more details on
15th Finance Commission recommendations, please see Appendix 3.
43%
44%
47%
75%
17%
69%
25%
55%
61%
44%
9%
11%
43%
10%
73%
20%
69%
65%
20%
42%
76%
33%
69%
68%
86%
45%
25%
34%
11%
51%
57%
56%
53%
25%
83%
31%
75%
45%
39%
56%
91%
89%
57%
90%
27%
80%
31%
35%
80%
58%
24%
67%
31%
32%
14%
55%
75%
66%
89%
49%
0% 20% 40% 60% 80% 100%
WB
UP
UK
TS
TR
TN
SK
RJ
PB
OD
NL
MZ
MP
MN
MH
MG
KL
KA
JK
JH
HR
HP
GJ
GA
DL
CG
BR
AS
AR
AP
Own Revenue Central Transfer
10
The contribution of own revenue is significantly higher (more than 70% of total state receipts) in
states such as Haryana, Maharashtra, Telangana, and Delhi (Figure 13). On the other hand, states
such as Bihar, Jammu and Kashmir, Himachal Pradesh and the north-eastern states depend on central
transfers for most of their revenue. Share of own non-tax revenue is in the range of 6-16% of total
revenue in most states. Goa at 26% is an exception (electricity distribution in the state is through a
government department unlike most states). As can be seen in
Figure 14, states such as Himachal Pradesh, Jammu and Kashmir, and the north-eastern states are
comparatively more dependent on the grants-in-aid from the centre. Unlike devolution, which is
constitutionally provided as per the Finance Commission’s criteria, most of the grants are allocated by
the centre. Most of the grants (other than the GST compensation and revenue deficit grants) are tied
to specific expenditure priorities and thus, offer states little flexibility and choice. Higher dependence
on central grants limits the ability of the states to spend as per local economic and social priorities.
Figure 14: Components of revenue receipts (2015-21, figures in %)
Note: As Delhi and Jammu and Kashmir are union territories, they do not have any share in the divisible pool of central taxes.
Sources: State Budget Documents; PRS.
State’s own tax revenue as a percentage of GSDP ranges between 5%-8%
As discussed earlier, own tax revenue has been the largest source of revenue (46% of total revenue)
for states during the 2015-21 period. Typically, own tax revenue consists mainly of receipts from: (i)
21
16
30
9
46
14
32
18
22
23
60
52
21
56
13
37
11
16
80
20
13
51
16
9
14
22
24
29
26
24
WB
UP
UK
TS
TR
TN
SK
RJ
PB
OD
NL
MZ
MP
MN
MH
MG
KL
KA
JK
JH
HR
HP
GJ
GA
DL
CG
BR
AS
AR
AP
Grants-in-aid
36
40
23
16
36
16
43
28
18
33
31
37
36
34
14
43
19
20
0
38
11
16
15
23
0
33
51
37
62
25
WB
UP
UK
TS
TR
TN
SK
RJ
PB
OD
NL
MZ
MP
MN
MH
MG
KL
KA
JK
JH
HR
HP
GJ
GA
DL
CG
BR
AS
AR
AP
Central taxes
2
9
9
14
3
7
10
12
10
13
3
5
7
1
6
5
13
4
5
15
14
8
11
26
2
11
3
9
4
4
WB
UP
UK
TS
TR
TN
SK
RJ
PB
OD
NL
MZ
MP
MN
MH
MG
KL
KA
JK
JH
HR
HP
GJ
GA
DL
CG
BR
AS
AR
AP
Own non-tax
40
36
38
61
15
62
15
43
51
31
7
6
36
8
66
15
56
60
15
27
63
25
58
42
84
34
22
24
8
47
WB
UP
UK
TS
TR
TN
SK
RJ
PB
OD
NL
MZ
MP
MN
MH
MG
KL
KA
JK
JH
HR
HP
GJ
GA
DL
CG
BR
AS
AR
AP
Own Tax
11
goods and services tax (GST), (ii) sales tax/ value-added tax (VAT), (iii) state excise, (iv) stamp duty
and registration fees, (v) taxes and duties on electricity, and (vi) land revenue.
Own tax-GSDP ratio is a measure of a state’s potential to generate taxes from its economy on its own.
A higher ratio indicates a better ability to harvest taxes from the economic activities in the state. The
average own tax-GSDP ratio of states during 2015-16 to 2020-21 has been 6.3% (Figure 15). For
most states, it ranges between 5%-7.5%, except north-eastern states where it is between 2.5%-5%.
Figure 15: Own tax as a percentage of GSDP (2015-21)
Sources: RBI; State Budget Documents; PRS.
India’s Tax Capacity
Successive Finance Commissions (10th, 11th, and 12th, and 15th) have used tax efforts of states as a criterion in the devolution formula to reward the state’s own tax performance.30 Revenue from taxes is the largest component of own revenue receipts of both centre (89%) and states (87%). The 15th Finance Commission noted that India’s tax collection (centre and states together) remains far below India’s estimated tax capacity and has broadly remained unchanged since the early 1990s.30 In comparison, in other emerging markets, tax revenue as a percentage of GDP has been rising.30 The Economic Survey (2015-16) had estimated that after accounting for both levels of economic development and type of political system (democracy), India’s overall tax to GDP ratio (centre and states together) is lower by about 5.5% of GDP than that of comparable countries.31 Government expenditure as a percentage of GDP was estimated to be lower by about 6.2% of GDP.31 The 15th Finance Commission identified the following as key drivers in tax capacity: (i) broadening of the tax base and (ii) increasing the capacity and expertise of tax administration.30 The Economic Survey (2015-16) had stressed on developing property taxation as an important measure for increasing tax collection.31
Figure 16: General Government Revenue as % of GDP in 2020 (IMF Estimates)
Note: General government includes national and sub-national governments. Emerging Markets mean countries classified as “emerging markets and middle-income countries” by IMF. These include India, China, South Africa, Brazil, and others. Advanced Economies include USA, UK, Australia, Canada, and others. Revenue includes tax as well as non-tax revenues. Source: International Monetary Fund’s Fiscal Monitor; PRS.
Figure 17: Tax to GDP Ratio-India (2015-21)
Source: Central and state budget documents; PRS.
State GST is the largest source of own tax revenue for states
Own tax revenue of states can be categorized as direct tax revenue and indirect tax revenue. Direct
taxes include taxes on income and property whereas indirect taxes include taxes on commodities and
services. Key sources of direct taxes for states are: (i) taxes on agricultural income, (ii) land revenue,
and (iii) stamp duty and registration fees. Currently, agricultural income is exempted from levy of
6.4%
5.0% 5.3%
5.5% 7.4%
4.9% 6.
7%
5.3% 5.
2%
5.9% 5.5%
6.4% 6.7%
5.2% 6.8%
3.8%
6.2%
2.9%
2.8%
6.3%
6.1% 6.4%
3.1%
6.5%
3.7%
7.4%
5.0% 7.
2%
5.4%
0%
2%
4%
6%
8%
AP AR AS BR CG DL GA GJ HP HR JH KA KL MG MH MN MP MZ NL OD PB RJ SK TN TR TS UK UP WB
19.6%
25.8%
26.9%
30.5%
31.5%
25.3%
33.6%
0% 10% 20% 30% 40%
India
China
South Africa
Brazil
Russia
Emerging Markets
Advanced Economies
10.5% 11.1% 12.3%10.9% 10.6% 10.8%
6.4% 6.1%6.2%
6.3% 6.5% 6.6%
16.9% 17.3%18.6%
17.2% 17.1% 17.3%
0%
5%
10%
15%
20%
0%
5%
10%
15%
20%
2015
-16
2016
-17
2017
-18
2018
-19
2019
-20
2020
-21
States Centre y-o-y growth (centre+states)
12
income tax irrespective of the level of income, except those levied on plantations by states like
Assam.21 Key indirect taxes levied by states include: (i) state goods and services tax (SGST), (ii)
sales tax/ value added tax (VAT), (iii) state excise duty, (iv) taxes on vehicles, and (v) taxes and
duties on electricity. More than 75% of the own tax revenue of states come from indirect taxes.
SGST: Between 2018-19 and 2020-21, SGST is the largest source of own tax revenue of states (41%)
(Figure 18). With the introduction of GST, many indirect taxes levied by states have been replaced.
While these taxes were earlier under the control of each state, GST rates are now decided by the GST
Council. This implies that states have limited flexibility in making decisions regarding tax rates on
goods and services. Consequently, states have limited autonomy on a large part of their own tax
revenue as the receipts from SGST depend on tax rates decided by the GST Council. States such as
Jammu and Kashmir, Manipur, and Mizoram are estimated to receive more than 50% of their own tax
revenue from SGST in 2020-21.
After SGST, Sales tax/ VAT (24%), and the state’s excise duty (12%) are the largest sources of own
tax revenue for the states. Sales tax/ VAT and excise duty revenue mainly come from levy on
Figure 18: Share of key taxes in own tax revenue (2018-21, figures in %)
Note: Meghalaya is not included in the figure as the SGST numbers are not available for 2019-20. Due to alcohol prohibition in place in
Bihar and Gujarat, revenue from excise duty is nearly zero.
Sources: State Budget Documents; PRS.
15
9
13
6
13
6
11
13
17
17
20
10
8
15
13
8
11
6
13
8
17
22
9
6
17
11
8
29
7
WB
UP
UK
TS
TR
TN
SK
RJ
PB
OD
NL
MZ
MN
MP
MH
KL
KA
JK
JH
HR
HP
GJ
GA
DL
CG
BR
AS
AR
AP
Other Sources
9
14
9
10
3
11
2
7
7
6
0
1
1
10
14
7
11
2
4
14
4
10
11
12
6
14
2
1
9
WB
UP
UK
TS
TR
TN
SK
RJ
PB
OD
NL
MZ
MN
MP
MH
KL
KA
JK
JH
HR
HP
GJ
GA
DL
CG
BR
AS
AR
AP
Stamp Duty
18
22
24
18
11
6
21
15
17
13
1
4
1
19
9
5
20
11
10
14
20
0
9
14
20
0
8
12
11
WB
UP
UK
TS
TR
TN
SK
RJ
PB
OD
NL
MZ
MN
MP
MH
KL
KA
JK
JH
HR
HP
GJ
GA
DL
CG
BR
AS
AR
AP
Excise Duty
12
18
15
31
19
41
19
27
17
24
25
19
22
21
19
37
15
11
26
21
17
27
21
15
17
20
24
24
37
WB
UP
UK
TS
TR
TN
SK
RJ
PB
OD
NL
MZ
MN
MP
MH
KL
KA
JK
JH
HR
HP
GJ
GA
DL
CG
BR
AS
AR
AP
Sales Tax
46
37
39
35
54
36
47
38
42
40
54
67
68
35
45
44
43
70
47
43
44
41
49
53
39
55
58
34
36
WB
UP
UK
TS
TR
TN
SK
RJ
PB
OD
NL
MZ
MN
MP
MH
KL
KA
JK
JH
HR
HP
GJ
GA
DL
CG
BR
AS
AR
AP
SGST
13
petroleum products and alcohol (these two products are not part of the GST system). Share of sales
tax/ VAT in own tax revenue of states such as Kerala, Tamil Nadu, and Andhra Pradesh is higher than
the average.
Stamp duty and registration fee applicable on transfer or sale of a property is another major source
of revenue, which contributes about 11% to the own tax revenue. The revenue from this source
depends on the tax rates and the valuation of the property on which these rates are applied. The
valuation of a property, in turn, depends on the land rates approved by states from time to time.
Taxes on vehicles (6%), and electricity (3%) are among other important sources of own tax revenue.
Contribution of taxes on vehicles for most states is estimated to be between 4%-7%. Contribution of
taxes and duties on electricity is estimated to be higher than average in states such as Gujarat (10%),
Punjab (10%), Odisha (9%), and Chhattisgarh (9%) (Figure 19).
Figure 19: Taxes and duties on electricity as a percentage of own tax revenue (2018-21)
Sources: State Budget Documents; PRS.
While on aggregate, land revenue comprises only 1% of the own tax revenue of states, the
contribution of land revenue in own tax revenue is higher in states such as West Bengal (5%),
Haryana (5%), and Jharkhand (4%) (Figure 20).
Figure 20: Land revenue as a percentage of own tax revenue (2018-21)
Sources: State Budget Documents; PRS.
Measures taken by states to raise revenue in response to COVID-19 pandemic
Between April and May 2020, state governments observed about 50% decline in their own tax revenue as compared to the corresponding period in the previous year. To mobilise additional revenue, 22 states/ UTs hiked their duties on petrol and diesel, while 25 states/ UTs hiked duties on alcohol.29 As per an estimate by RBI (2020), these measures could provide a revenue gain in the range of 0.03%-0.35% of respective GSDP.29 Some states increased rate of existing taxes whereas others imposed new cesses on these items. For instance, Haryana imposed a COVID cess on all types of liquor.32 Nagaland imposed a COVID-19 cess of Rs 5 per litre on diesel and Rs 6 per litre on petrol and other motor spirits.33
States raise 9% less revenue than budgeted, higher shortfall in grants-in-aid from the centre
During the 2015-19 period, states raised 9% less revenue than their budget estimates. States can
borrow more in order to make up for this shortfall so that they can spend as budgeted. However, as
borrowing is limited by states’ Fiscal Responsibility and Budget Management (FRBM) laws, many
states cut their expenditure to meet the borrowing limits (see Figure 32). States such as Assam (22%),
Tripura (22%), and Telangana (20%) saw a relatively higher shortfall in revenue (Figure 21).
0% 0% 1% 1%
9%
0% 0%
10%
5%
1%2%
0%
3%
0% 0%
5%
0%
6%
0% 0%
9% 10%
4%
0%1% 1%
0%
3% 3%4%
0%
3%
6%
9%
12%
AP AR AS BR CG DL GA GJ HP HR JH JK KA KL MG MH MN MP MZ NL OD PB RJ SK TN TR TS UK UP WB
0%
1% 1%2% 3%
0%
1%
3%
0%
5%4%
0% 0% 1% 0%
2%
0%1%
2%
0%
1%
0% 1% 1%0% 1%
0% 0% 1%
5%
0%
2%
4%
6%
AP AR AS BR CG DL GA GJ HP HR JH JK KA KL MG MH MN MP MZ NL OD PB RJ SK TN TR TS UK UP WB
14
Figure 21: Shortfall in revenue receipts of states (2015-19)
Sources: State Budget Documents; PRS.
Among the four broad categories of revenue
receipts, a higher shortfall is seen in grants-
in-aid from the centre (23%), and own non-
tax revenue (10%) (Figure 22). During the
2015-19 period, states such as Telangana
(58%), Assam (42%), Tripura (41%), and
Uttar Pradesh (38%) saw a much higher
variance between the budget estimates and
actuals for grants-in-aid from the centre as
compared to others (Figure 23).
Figure 22: Shortfall in revenue vis-à-vis BE (2015-19)
Sources: State Budget Documents; PRS.
Figure 23: Difference between budget estimates and actuals for grants-in-aid from the centre (2015-19)
Sources: State Budget Documents; PRS.
States finance 76% of their expenditure through revenue receipts; 20% from borrowings
Revenue receipts are the major source of funds for states to finance their expenditure. 76% of total
expenditure during the 2015-21 period was funded by revenue receipts. To finance the rest of the
expenditure, states rely on capital receipts, which mostly consist of borrowings. During the 2015-21
period, 20% of the total expenditure of states has been met through borrowings. Capital receipts also
include recovery of loans and advances given by states, money received from the sale of assets such
as land, and disinvestment. The share of capital receipts (other than borrowings) in meeting the
Figure 24: Financing of expenditure during the 2015-21 period
Sources: State Budget Documents; PRS.
-15%
-7%
-22%
-14%-13%-11%
-6% -6%
0%
-12%
-18%
1%
-11%
-15%
-4%-7%
-4%-1%
-7%
-3%
-11%-8% -7% -6%
-22%-20%
-17%
-9%
-5%
-25%
-20%
-15%
-10%
-5%
0%
5%
AP AR AS BR CG DL GA GJ HP HR JH KA KL MG MH MN MP MZ NL OD PB RJ SK TN TR TS UK UP WB
-4% -4%
-10%
-23%-25%
-20%
-15%
-10%
-5%
0%
Own TaxShare in
central taxesOwn Non-
TaxGrants-in-aidfrom centre
-35%-24%
-42%-33%
-23%
7%
-29%-22%
2%
-16%
-31%
17%
-12%
-34%
-12%-11%-10%-6%-14%
-22%
-3%
-16%
-30%
-6%
-41%
-58%
-27%-38%
-22%
-80%
-60%
-40%
-20%
0%
20%
AP AR AS BR CG DL GA GJ HP HR JH KA KL MG MH MN MP MZ NL OD PB RJ SK TN TR TS UK UP WB
0%
20%
40%
60%
80%
100%
AP AR AS BR CG DL GA GJ HP HR JH JK KA KL MG MH MN MP MZ NL OD PB RJ SK TN TR TS UK UP WB
Revenue Receipts Borrowing Others
15
expenditure of the states is small (4%). During the 2015-21 period, states such as Punjab (45%),
Haryana (30%), and West Bengal (30%) have had a higher reliance on borrowings to meet their
expenses as compared to other states. Note that in the year 2020-21, states’ reliance on borrowing to
finance their expenditure is likely to increase notably due to the COVID-19 pandemic.
Revenue expenditure forms the bulk of total expenditure of all states
The expenditure of a government can be classified into two components: (i) revenue expenditure, and
(ii) capital expenditure. Revenue expenditure is recurring in nature and includes expenditure on
salaries, pensions, interest payment, and subsidies. Capital expenditure goes towards creating assets
or reducing liabilities. Capital expenditure includes capital outlay which leads to the creation of
assets such as schools, hospitals, and roads and bridges. Capital expenditure also includes repayment
of loans (which lowers the state’s liability burden), and loans and advances given by a government.
During the 2015-21 period, states on aggregate have incurred 85% of their expenditure as revenue
expenditure and 15% as capital outlay (debt components excluded from the expenditure for analysis).
Figure 25: Composition of expenditure of states during the 2015-21 period
Note: Expenditure excludes debt repayment, and loans and advances given by the states.
Sources: State Budget Documents; PRS.
States spend 50% of its revenue receipts on committed expenditure items
Committed expenditure of a state typically includes expenditure on payment of salaries, pensions, and
interest payments. A larger proportion of state budget allocated for committed expenditure crowds
out other developmental expenditure. During the 2015-21 period, states on an average have spent
50% of their revenue receipts on committed expenditure (salaries, pensions, and interest payments)
(Figure 26). 26% of the revenue receipts have been spent on salaries, followed by 12% of the revenue
receipts on interest payments and another 12% on pensions. Punjab (80%) spends the highest on
committed expenditure, followed by Kerala (72%) and Uttarakhand (71%). Spending on committed
expenditure is lower than average in states such as Madhya Pradesh and Bihar. This is mainly due to
a lower portion of their revenue receipts being spent on salaries.
Figure 26: Committed expenditure as a percentage of revenue receipts (2015-21)
Sources: RBI, State Budget Documents; PRS.
Education receives highest allocation; highest capital outlay in roads and bridges and irrigation
Following the 14th and 15th Finance Commission recommendations, the centre devolved a higher
share of its taxes to states (42%) during the 2015-21 period. This has provided more flexibility to
states to spend as per their priorities. While education remained the sector with the highest
expenditure, its share in total expenditure decreased during 2015-21 when compared to 2010-15
period. On the other hand, the share of agriculture, rural development, health, and urban development
0%
20%
40%
60%
80%
100%
AP AR AS BR CG DL GA GJ HP HR JH JK KA KL MG MH MN MP MZ NL OD PB RJ SK TN TR TS UK UP WB
Revenue Capital
56%
41%
54%
35%
40%
30%
46%
49%
64%
61%
38%
52%
39%
72%
57%
55%
51%
34% 54
% 62%
42%
80%
59%
58%
61%
56%
42%
71%
39% 62
%
0%
20%
40%
60%
80%
100%
AP AR AS BR CG DL GA GJ HP HR JH JK KA KL MG MH MN MP MZ NL OD PB RJ SK TN TR TS UK UP WB
16
saw an increase in allocation. A study commissioned by the 15th Finance Commission observed that
states spend more or less equally across key sectors such as education, health, roads and bridges, and
irrigation regardless of the level of indicators such as educational outcomes, maternal and infant
mortality rate, connectivity, and irrigation potential.34 It added that there is scope for rationalising the
allocation such that expenditure is directed towards the sectors which need it the most. For more
details on the sector-wise expenditure by states, please see Appendix 4.
Figure 27: Allocation towards key sectors
Sources: State Budget Documents; PRS.
Figure 28: Share of key sectors in capital outlay
Sources: State Budget Documents; PRS.
During the 2015-21 period, states have spent the highest proportion of their capital outlay on roads
and bridges (23%), irrigation (20%), and energy (10%) (Figure 28). The share of irrigation sector has
declined between 2010-15 and 2015-21 period, whereas sectors such as rural development, water
supply and sanitation, and urban development have seen an increase. Capital outlay on health and
education sectors have not undergone any significant change.
States spend 24% of their budgets on human development
Expenditure on human development comprises allocations made towards education, health, and water
supply and sanitation. Expenditure on these sectors aims to improve the overall well-being of citizens
and aids in the creation of human capital. Between 2015-16 and 2020-21, states have spent 24% of
their budget on human development (Figure 29). Within this, the highest allocation is towards
education (16%), followed by health (5.3%). Delhi spent the highest portion of its total expenditure
on human development (42%), followed by Assam (31%), and Meghalaya (30%).
Figure 29: Spending on human development as a percentage of total expenditure (2015-21)
Sources: State Budget Documents; PRS.
1.3%
2.3%
2.9%
3.1%
4.0%
4.1%
4.7%
5.3%
5.7%
5.9%
6.4%
15.9%
0.9%
1.8%
2.7%
2.5%
5.3%
4.0%
5.0%
4.8%
5.5%
4.3%
5.4%
17.6%
0% 5% 10% 15% 20%
Housing
Water Supply and Sanitation
Welfare of SC, ST, and OBC
Urban Development
Irrigation and Flood Control
Social Security and Welfare
Roads and Bridges
Health and Family Welfare
Energy
Rural Development
Agriculture and Allied Activities
Education
2010-15 2015-21
2.0%
3.6%
3.8%
3.7%
4.6%
7.2%
6.9%
10.2%
19.8%
22.8%
2.3%
3.1%
3.4%
3.2%
3.6%
6.0%
5.6%
10.9%
24.4%
23.1%
0% 10% 20% 30%
Housing
Education
Health and Family Welfare
Agriculture and Allied Activities
Urban Development
Water Supply and Sanitation
Rural Development
Energy
Irrigation and Flood Control
Roads and Bridges
2010-15 2015-21
20%25%
31%27%26%
42%
28%24%
29%23%23%
26%20%
23%30%
24%21%23%25%
21%25%
19%
28%26%22%
25%16%26%
21%24%
0%
10%
20%
30%
40%
50%
AP AR AS BR CG DL GA GJ HP HR JH JK KA KL MG MH MN MP MZ NL OD PB RJ SK TN TR TS UK UP WB
17
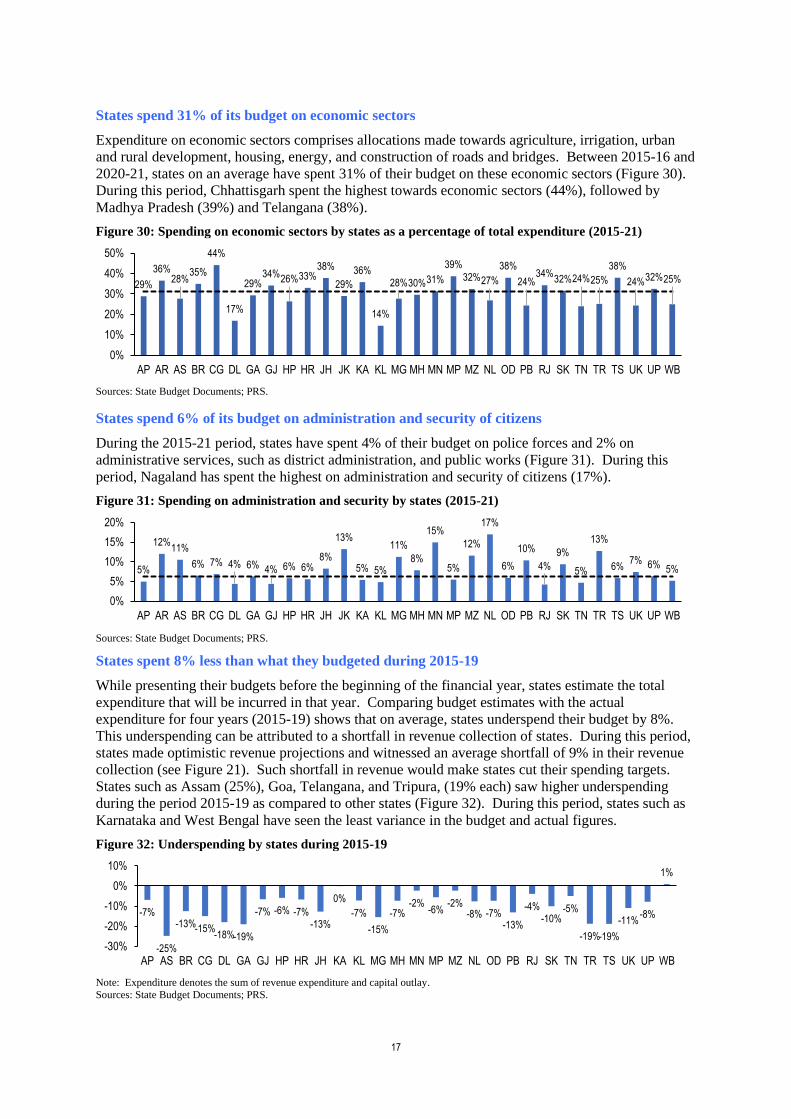
States spend 31% of its budget on economic sectors
Expenditure on economic sectors comprises allocations made towards agriculture, irrigation, urban
and rural development, housing, energy, and construction of roads and bridges. Between 2015-16 and
2020-21, states on an average have spent 31% of their budget on these economic sectors (Figure 30).
During this period, Chhattisgarh spent the highest towards economic sectors (44%), followed by
Madhya Pradesh (39%) and Telangana (38%).
Figure 30: Spending on economic sectors by states as a percentage of total expenditure (2015-21)
Sources: State Budget Documents; PRS.
States spend 6% of its budget on administration and security of citizens
During the 2015-21 period, states have spent 4% of their budget on police forces and 2% on
administrative services, such as district administration, and public works (Figure 31). During this
period, Nagaland has spent the highest on administration and security of citizens (17%).
Figure 31: Spending on administration and security by states (2015-21)
Sources: State Budget Documents; PRS.
States spent 8% less than what they budgeted during 2015-19
While presenting their budgets before the beginning of the financial year, states estimate the total
expenditure that will be incurred in that year. Comparing budget estimates with the actual
expenditure for four years (2015-19) shows that on average, states underspend their budget by 8%.
This underspending can be attributed to a shortfall in revenue collection of states. During this period,
states made optimistic revenue projections and witnessed an average shortfall of 9% in their revenue
collection (see Figure 21). Such shortfall in revenue would make states cut their spending targets.
States such as Assam (25%), Goa, Telangana, and Tripura, (19% each) saw higher underspending
during the period 2015-19 as compared to other states (Figure 32). During this period, states such as
Karnataka and West Bengal have seen the least variance in the budget and actual figures.
Figure 32: Underspending by states during 2015-19
Note: Expenditure denotes the sum of revenue expenditure and capital outlay.
Sources: State Budget Documents; PRS.
29%
36%28%
35%
44%
17%
29%34%
26%33%38%
29%
36%
14%
28%30%31%
39%
32%27%
38%
24%34%
32%24%25%
38%
24%32%25%
0%
10%
20%
30%
40%
50%
AP AR AS BR CG DL GA GJ HP HR JH JK KA KL MG MH MN MP MZ NL OD PB RJ SK TN TR TS UK UP WB
5%
12%11%
6% 7% 4% 6% 4% 6% 6%8%
13%
5% 5%
11%
8%
15%
5%
12%
17%
6%
10%
4%
9%
5%
13%
6%7% 6% 5%
0%
5%
10%
15%
20%
AP AR AS BR CG DL GA GJ HP HR JH JK KA KL MG MH MN MP MZ NL OD PB RJ SK TN TR TS UK UP WB
-7%
-25%
-13%-15%-18%-19%
-7% -6% -7%-13%
0%
-7%
-15%
-7%-2%
-6%-2%
-8% -7%-13%
-4%-10%
-5%
-19%-19%
-11%-8%
1%
-30%
-20%
-10%
0%
10%
AP AS BR CG DL GA GJ HP HR JH KA KL MG MH MN MP MZ NL OD PB RJ SK TN TR TS UK UP WB
18
Average underspending during this period in case of revenue expenditure is 7%. As a large part of
revenue expenditure is committed in nature, there is a disproportionately higher underspending in case
of capital outlay, at 14%. States such as Goa (50%), Punjab (45%), and Assam (42%) saw a much
higher cutback in capital outlay as compared to the budgeted estimates during the 2015-19 period.
Such high cutbacks could adversely impact the government-led capital investment in the country, as a
higher share of this capital outlay depends on the states as compared to the centre. For instance, in
2020-21, states on aggregate are estimated to spend 2.7% of GDP on capital outlay as compared to the
centre’s capital outlay of 1.8% of GDP.
Figure 33: Underspending in capital outlay during 2015-19
Sources: State Budget Documents; PRS.
Underspending across most sectors; higher than budgeted expenditure on energy
Among major sectors on which state governments spend, the housing sector has witnessed the highest
underspending (19%) during the 2015-19 period (Figure 34). On the other hand, states under-
budgeted their expenditure requirements on energy by 11%. Energy sector witnessed higher actual
expenditure than budgeted due to the implementation of UDAY between 2015-2017 by certain states.
Huge underspending could imply that states are being unable to meet their development targets in
specific sectors.
Figure 34: Housing saw highest underspending; overspending on energy (2015-19)
Sources: State Budget Documents; PRS.
Eleven states have observed a revenue deficit during the 2015-21 period
One of the Terms of Reference of the 15th Finance Commission was to examine whether revenue
deficit grants are required to be provided to states. Revenue deficit is the excess of revenue
expenditure over revenue receipts. A revenue deficit means that states need to borrow to meet
expenses which do not create any assets. A revenue balance indicates that the revenue sources of
states are just sufficient to meet their revenue expenditure requirements in a given year. A revenue
surplus can be used to incur capital outlay or pay off outstanding debt. While a high revenue surplus
in the short term may allow for greater spending on asset creation, such a surplus for a longer-term
may indicate inadequate revenue expenditure by the state.
-17%-29%
-42%
-15%
-31%-39%
-50%
-12%
6% 2%
-7%
1%
-11%-23%
-14%-12%-5%
-14%-6%
4%
-45%
-17%-7%
-18%
-37%
-15%-3%
-10%-16%
-80%
-60%
-40%
-20%
0%
20%
AP AR AS BR CG DL GA GJ HP HR JH KA KL MG MH MN MP MZ NL OD PB RJ SK TN TR TS UK UP WB
11%
0%
-5%
-6%
-7%
-9%
-9%
-13%
-14%
-15%
-16%
-19%
-25% -20% -15% -10% -5% 0% 5% 10% 15%
Energy
Roads and Bridges
Agriculture and Allied Activities
Social Security and Welfare
Health and Family Welfare
Education
Water Supply and Sanitation
Welfare of SC, ST, and OBC
Rural Development
Irrigation and Flood Control
Urban Development
Housing
19
The 13th Finance Commission (FC) recommended that a long term and permanent target for states
should be to maintain a zero-revenue deficit. Kerala, Punjab, and West Bengal were expected to
eliminate revenue deficit by the end of 13th FC period (2014-15), and all other states were expected to
eliminate their revenue deficit by 2011-12 or earlier. The 14th FC re-iterated this recommendation
that states should eliminate their revenue deficit by 2019-20. In order to do so, it also provided
revenue deficit grants to some states. Similarly, for 2020-21, the 15th FC has provided revenue deficit
grants worth Rs 74,340 crore to 14 states. However, despite receiving such revenue deficit grants
from the Finance Commission, some states including Andhra Pradesh, Kerala, and West Bengal
continued to have a revenue deficit during the 2015-21 period.
Figure 35: Average revenue balance (as a percentage of GSDP) during the 2015-21 period
Note: Arunachal Pradesh’s average revenue surplus during this period is 14.8% of GSDP.
Sources: State Budget Documents; RBI; PRS.
On average basis, during the 2015-21 period, 11 states have observed a revenue deficit. States with a
higher revenue deficit as compared to others include Rajasthan (2.1% of GSDP), Kerala (2%), Andhra
Pradesh (2%), Haryana (1.9%), and Punjab (1.9%). The revenue surplus is high in the case of some
north-eastern states such as Arunachal Pradesh and Mizoram. This is mainly due to the large share of
central transfers in their revenue receipts. The revenue surplus in other states can be attributed to the
augmentation of their own resources. However, in some states, a high revenue surplus could also be
due to lower provisioning of public goods leading to lower revenue expenditure. Some notable states
having high revenue surplus are Odisha (2.3%), Bihar (1.5%), and Uttar Pradesh (1.4%).
Average fiscal deficit of states at 2.7% of GSDP during 2017-21
Fiscal deficit is the excess of government expenditure over its receipts. A high fiscal deficit of a
government implies a higher borrowing requirement in a financial year. The borrowed funds may be
spent by the state for various purposes, such as capital outlay, administrative expenditure, interest
payments, and repayment of loans. In 2015, the 14th Finance Commission recommended that states
maintain their fiscal deficit within 3% of their GSDP. It suggested that the fiscal deficit limit should
be relaxed to a maximum of 3.5% if states were able to contain their debt and interest payments to
specified levels. The relaxation would be allowed in the following cases: (i) 0.25%, if the debt-GSDP
ratio of the state was under 25% in the preceding year, and (ii) 0.25%, if interest payments of the state
were less than or equal to 10% of its revenue receipts in the preceding year.
Between 2015-16 and 2016-17, 15 states took over the debt of the respective state-owned discoms
under the Ujwal Discom Assurance Yojana (UDAY). This led to a higher borrowing requirement
during those years. During the 2017-21 period, on an average basis, 14 states have crossed the
prescribed 3% limit for GSDP (Figure 36). Of these states, three states have contained their fiscal
deficit within the conditional limit of 3.5%. States with fiscal deficit higher than 3.5% limit include
Bihar (4.6%) and Andhra Pradesh (4.2%). Note that while states have been allowed to borrow up to
5% of GSDP in 2020-21, their budget estimates for 2020-21, which were made before the relaxation,
are as per the previous limit of 3% and conditional limit of 3.5% (Madhya Pradesh which presented
its budget later in July 2020 is an exception).
-2.0%
1.1%1.5%
0.3%
0.9%
0.5%0.2%
-0.1%
-1.9%
1.3%
0.1%
-2.0%
1.7%
-0.3%
3.7%
0.1%
4.9%
2.0%2.3%
-1.9% -2.1%
2.1%
-1.2%
0.0%
0.3%
-0.4%
1.4%
-0.8%
-4%
-2%
0%
2%
4%
6%
AP AS BR CG DL GA GJ HP HR JH KA KL MG MH MN MP MZ NL OD PB RJ SK TN TR TS UK UP WB
20
Figure 36: Average fiscal deficit as a percentage of GSDP during the 2017-21 period
Sources: State Budget Documents; RBI; PRS.
As per the Article 293 (3) of the Constitution, state governments require the permission of the central
government to raise any loan if there is still any outstanding loan or guarantee that the central
government has given to the state. The permission granted by the central government is based on the
projected GSDP figures. As the actual GSDP figures could be different, states may end up borrowing
above the budgeted fiscal deficit to GSDP ratio. In certain cases, the central government may give
permission to raise borrowing beyond 3% limit (up to 3.5%) during the year. This may lead to a
higher actual fiscal deficit as compared to the budgeted fiscal deficit.
States spend 23% of their revenue receipts on debt servicing
Governments are required to service the debt by making periodic interest payments as well as
repaying the principal amount on maturity of the debt. Higher debt servicing costs constrain spending
on other priorities. Between 2015-16 and 2020-21, the states have spent 23.4% of their revenue
receipts on debt servicing (11.3% on debt repayment and 12.1% on interest payments). Punjab has
used the highest proportion of its revenue receipts for debt servicing (84%) during the 2015-21 period.
Nagaland (46%), West Bengal (43%), and Haryana (40%) are some other states which have been
spending a higher proportion of their revenue receipts on debt servicing.
Figure 37: Debt servicing as a percentage of revenue receipts during the 2015-21 period
Sources: State Budget Documents; PRS.
RBI observed that the debt level of a state is sustainable if interest payment is less than 10% of its
revenue receipts.21 In 2020-21, states are estimated to spend 11.7% of their revenue receipts on
interest payments. 15 states are estimated to spend more than the recommended 10% of revenue
receipts. Punjab (22%), Haryana (20%), and West Bengal (18%) are some of the states which are
estimated to spend a higher portion of their revenue receipts on interest payments in 2020-21.
Outstanding liabilities of state governments estimated at 26.6% of GSDP at the end of 2020-21
Outstanding liabilities refer to the debt accumulated by states from the borrowings in the past. Higher
outstanding liabilities indicate a higher obligation for the state to repay loans in the coming years.
The FRBM Acts of states usually specify limits on the outstanding liabilities as a percentage of
GSDP. Typically, these limits are set at 25% of GSDP in a year. In recent years, outstanding
liabilities of state governments have increased partly due to large one-time expenditure such as farm
loan waivers and debt takeover under the UDAY scheme (Figure 38). At the end of 2020-21,
outstanding liabilities of state governments is estimated at 26.6% of their GSDP.
4.2%
3.7%3.3%
4.6%
3.8%
0.1%
2.2%
1.7%
4.0%2.9% 2.7%
2.4%
3.3%3.7%
1.6%
4.4%
3.7%4.1%
4.4%
2.7% 2.9%3.2%
2.7%2.9%
4.3%
2.9%
2.8%2.4% 2.7%
0%
1%
2%
3%
4%
5%
6%
AP AR AS BR CG DL GA GJ HP HR JH KA KL MG MH MN MP MZ NL OD PB RJ SK TN TR TS UK UP WB
32%
9% 10%12% 9% 12%
30%25%28%40%
13%
38%
16%
39%
10%20%20%16%
9%
46%
10%
84%
24%
12%23%
13%
26%32%
17%
43%
0%
20%
40%
60%
80%
100%
AP AR AS BR CG DL GA GJ HP HR JH JK KA KL MG MH MN MP MZ NL OD PB RJ SK TN TR TS UK UP WB
Interest Payment Debt Repayment
21
Note that outstanding liabilities would rise further as states
are likely to undertake higher borrowing in 2020-21 (up to
5% of their GSDP), which has not been taken into account in
their budget estimates. At the end of 2020-21, 18 states are
expected to cross the 25% limit (Figure 39). States such as
Arunachal Pradesh (41.7%), Mizoram (40.9%), and Punjab
(38.7%) have outstanding liabilities much higher than the
average. In 2017, the FRBM Review Committee (Chair: Mr.
N. K. Singh) had recommended that a debt to GDP ratio of
60% should be targeted for the entire country, with a 40%
limit for the centre and 20% limit for the states.35 In 2020-21,
26 states have estimated their outstanding liabilities to be
greater than 20% of GSDP.
Figure 38: Aggregate outstanding
liabilities of states (as % of GSDP)
Sources: RBI; PRS.
Figure 39: Outstanding liabilities at the end of 2020-21 (in % of GSDP)
Sources: RBI; PRS.
Effect of COVID-19 on medium term fiscal policy: The case of Madhya Pradesh
States in their respective FRBM statements provide targets for key fiscal indicators for the upcoming three years. This acts as the medium-term roadmap for the state’s finances. Due to the adverse impact of COVID-19 on the economy, states have been allowed to borrow up to 5% of GSDP in 2020-21 by the central government. They were also allowed additional borrowing in 2019-20 (Rs 58,843 crore on aggregate) as devolution in 2019-20 decreased due to reasons including a slowdown in economy and adjustments for excess devolution during 2018-19.36 As per its 2019-20 FRBM statement (presented in July 2019), Madhya Pradesh was expecting to maintain a revenue surplus, keep its fiscal deficit within 3%, and have a slender rise in outstanding liabilities by 2022-2023. Madhya Pradesh presented its budget for 2020-21 in July 2020, taking into account the impact of COVID-19 on the economy. The 2020-21 FRBM statement indicates an increase in the state’s borrowing requirement till 2022-23. Consequently, outstanding liabilities are expected to rise to 31.2% of GSDP in 2022-23, significantly higher than the 2019-20 projection (24.8% of GSDP).
Table 4: Madhya Pradesh’s fiscal indicators - projections vs budget estimates (as % of GSDP)
Head 2019-20 Budget
Estimates
2019-20 Revised
Estimates
2020-21 (2019-20
Projection)
2020-21 Budget
Estimates
2022-23 (2019-20
Projection)
2022-23 (2020-21
Projection)
Revenue Balance
0.8% -0.3% >0% -1.9% >0% >0%
Fiscal Deficit 3.3% 3.6% 2.8% 5.0% 2.8% 3.8%
Outstanding Liabilities
24.4% 25.0% 24.6% 28.8% 24.8% 31.2%
Note: The projection denotes the target as per that year’s FRBM statement.
Source: Madhya Pradesh FRBM statements of 2019-20 and 2020-21; PRS.
Outstanding guarantees given by states at 2.8% of their GSDP as of 2018-19
Outstanding liabilities of states do not include a few other liabilities that are contingent in nature,
which states may have to honour in certain cases. State governments guarantee the borrowings of
State Public Sector Enterprises (SPSEs) from financial institutions. This may be because these
enterprises have a poor credit profile, and a government guarantee will make it easier for them to
obtain a loan. RBI has noted that these contingent liabilities are a risk to state governments owing to
the large outstanding debt and losses of SPSEs. The guarantee given by the states was 2.8% of their
21.7
%
23.4
%
24.7
%
25.1
%
25.2
%
26.3
%
26.6
%
0%
10%
20%
30%
40%
2014
-15
2015
-16
2016
-17
2017
-18
2018
-19
2019
-20
2020
-21
32.7
% 41.7
%
23.7
% 30.8
%
27.1
%
0.4%
28.1
%
18.8
%
35.7
%
24.9
%
27.9
%
20.5
%
30.3
%
33.4
%
16.7
%
34.7
%
29.4
%
40.9
%
38.2
%
23.1
%
38.7
%
34.5
%
23.1
%
24.5
% 30.9
%
22.8
%
24.8
% 33.1
%
34.7
%
0%
10%
20%
30%
40%
50%
AP AR AS BR CG DL GA GJ HP HR JH KA KL MG MH MN MP MZ NL OD PB RJ SK TN TR TS UK UP WB
22
GSDP at the end of 2018-19 (as per the latest data available for all states). At the end of 2018-19, the
outstanding government guarantee of 11 states was less than 1% of their GSDP (Figure 40).
States with a higher level of outstanding guarantees are Sikkim (12%), Telangana (9%), and
Rajasthan (7.5%).
Figure 40: Outstanding government guarantees as a percentage of GSDP at the end of 2018-19
Sources: RBI; PRS.
RBI (2020) observed that since 2017-18, net accretion to guarantees has seen a significant jump.29 As
per estimates by RBI, the outstanding guarantee of states was at 2% of GDP at the end of 2016-17,
and is set to rise to 3% of GDP at the end of 2019-20.29 RBI (2019) had noted that although the
guarantees given by states are at modest levels currently, state governments may not have enough
fiscal space to bear the additional financial burden of invoked guarantees.29 Under the Aatmanirbhar
Bharat Economic Package announced in May 2020, the Power Finance Corporation and Rural
Electrification Corporation will provide loans to discoms worth Rs 90,000 crore.29 Loans will be
given against guarantees by state governments for the exclusive purpose of discharging liabilities of
discoms to generators. As a result, the outstanding guarantees of state governments would increase by
about 0.42% of GDP in 2020-21.29
6.3%
0.0%
0.0% 1.
0%
3.5%
0.3% 1.
2% 2.5%
0.5% 1.
6%
3.4%
3.4%
1.0% 1.
7%
3.8%
0.4% 0.8%
0.9%
7.5%
12.0
%
2.7%
0.0%
9.0%
0.5%
6.6%
0.6%
0%
5%
10%
15%
AP AR AS BR CG GJ HP HR JH KA KL MG MH MN MP MZ OD PB RJ SK TN TR TS UK UP WB
23
Appendix 1: Fiscal deficit of states for 2020-21
Table 5: Fiscal deficit approved for states for the year 2020-21 (Rs crore), as on December 20, 2020
State Unconditional* (4% of GSDP)
Conditional (1% of GSDP)
Allowed so far (out of the conditional 1% of GSDP) ^
Total fiscal deficit available for 2020-21 (5% of GSDP)
Andhra Pradesh 40,408 10,102 5,051 50,510
Arunachal Pradesh 1,142 286 0 1,428
Assam 14,954 3,738 0 18,692
Bihar 25,846 6,462 0 32,308
Chhattisgarh 14,334 3,584 0 17,918
Goa 3,570 892 223 4,462
Gujarat 69,632 17,408 4,352 87,040
Haryana 34,346 8,586 2,147 42,932
Himachal Pradesh 7,014 1,754 0 8,768
Jharkhand 14,120 3,530 0 17,650
Karnataka 72,144 18,036 9,018 90,180
Kerala 36,174 9,044 2,261 45,218
Madhya Pradesh 37,966 9,492 4,746 47,458
Maharashtra 1,23,152 30,788 0 1,53,940
Manipur 1,206 302 0 1,508
Meghalaya 1,550 388 0 1,938
Mizoram 1,054 264 0 1,318
Nagaland 1,256 314 0 1,570
Odisha 22,864 5,716 0 28,580
Punjab 24,262 6,066 0 30,328
Rajasthan 43,698 10,924 0 54,622
Sikkim 1,246 312 0 1,558
Tamil Nadu 77,014 19,254 4,814 96,268
Telangana 40,136 10,034 5,017 50,170
Tripura 2,376 594 149 2,970
Uttar Pradesh 77,622 19,406 4,852 97,028
Uttarakhand 11,238 2,810 0 14,048
West Bengal 54,298 13,574 0 67,872
Total 8,54,622 2,13,660 42,628 10,68,282
Note: *Of this, 0.5% of GSDP was conditional on states choosing Option 1 for GST compensation borrowing, which has been done by all
states. ^All states indicated have implemented the one nation one ration card reform except for MP and TN. MP and TN have implemented the ease of doing business reform, along with AP, KA, and TS. MP has also implemented the urban local body/ utility reform. The reform
implementation data has been collected from various press releases, so the latest reform status may not match with the data for some states.
Sources: Unstarred Question No. 206, September 14, 2020, Lok Sabha; Ministry of Finance; PRS.
24
Appendix 2: GST compensation to states
Table 6: GST compensation payment due to states for the period April-July 2020 (Rs crore)
State 2019-20 (full year) April-July 2020
(four months)
Amount due so far as a % of the 2019-20 compensation requirement
Andhra Pradesh 3,028 4,627 153%
Arunachal Pradesh 0 0 -
Assam 1,284 2,149 167%
Bihar 5,464 4,493 82%
Chhattisgarh 4,521 2,827 63%
Delhi 8,424 6,931 82%
Goa 1,093 987 90%
Gujarat 14,801 11,563 78%
Haryana 6,617 5,841 88%
Himachal Pradesh 2,477 1,623 66%
Jammu and Kashmir 3,281 2,104 64%
Jharkhand 2,219 2,475 112%
Karnataka 18,628 13,763 74%
Kerala 8,111 7,077 87%
Madhya Pradesh 6,538 5,863 90%
Maharashtra 19,233 22,485 117%
Manipur 0 53 -
Meghalaya 157 255 162%
Mizoram 0 6 -
Nagaland 0 27 -
Odisha 5,122 3,633 71%
Puducherry 1,057 564 53%
Punjab 12,187 6,959 57%
Rajasthan 6,710 6,312 94%
Sikkim 0 69 -
Tamil Nadu 12,305 11,269 92%
Telangana 3,054 5,424 178%
Tripura 293 259 88%
Uttar Pradesh 9,123 11,742 129%
Uttarakhand 3,375 2,235 66%
West Bengal 6,200 7,750 125%
Total compensation 1,65,302 1,51,365 92%
Sources: Unstarred Question No. 206, September 14, 2020, Lok Sabha; Ministry of Finance; PRS.
25
Table 7: GST compensation requirement of states for 2018-19 and 2019-20 (in Rs crore)
State 2018-19 2019-20 % increase in
compensation requirement Amount As a % of revenue Amount As a % of revenue*
Andhra Pradesh 0 - 3,028 3% -
Assam 455 1% 1,284 1% 182%
Bihar 2,798 2% 5,464 4% 95%
Chhattisgarh 2,592 4% 4,521 7% 74%
Delhi 5,185 12% 8,424 16% 62%
Goa 502 5% 1,093 9% 118%
Gujarat 7,227 5% 14,801 10% 105%
Haryana 3,916 6% 6,617 10% 69%
Himachal Pradesh 1,935 6% 2,477 8% 28%
Jammu and Kashmir 1,667 3% 3,281 5% 97%
Jharkhand 1,098 2% 2,219 4% 102%
Karnataka 12,465 8% 18,628 11% 49%
Kerala 3,532 4% 8,111 9% 130%
Madhya Pradesh 3,302 3% 6,538 4% 98%
Maharashtra 9,363 3% 19,233 7% 105%
Meghalaya 66 1% 157 2% 138%
Odisha 3,785 4% 5,122 5% 35%
Punjab 8,239 13% 12,187 20% 48%
Rajasthan 2,280 2% 6,710 5% 194%
Tamil Nadu 4,824 3% 12,305 7% 155%
Telangana 0 - 3,054 3% -
Tripura 172 1% 293 3% 70%
Uttar Pradesh 0 - 9,123 3% -
Uttarakhand 2,442 8% 3,375 11% 38%
West Bengal 2,615 2% 6,200 4% 137%
Note: Arunachal Pradesh, Manipur, Mizoram, Nagaland, and Sikkim did not require any compensation in 2018-19 and 2019-20.
*Revenue for the year 2019-20 does not take into account the GST compensation grants payable to states in 2019-20 but released by Centre
in 2020-21. The percentage figures would be slightly lower if such grants are included in 2019-20 revenue.
Sources: State Budget Documents; Ministry of Finance; Lok Sabha Questions; CAG; PRS.
Appendix 3: Recommendations of the 15th Finance Commission for 2020-21
The 15th Finance Commission (Chair: Mr N. K. Singh) was required to submit two reports. The first
report, consisting of recommendations for the financial year 2020-21, was tabled in Parliament on
February 1, 2020. The final report with recommendations for the 2021-26 period has been submitted
to the President on November 16, 2020 but has not yet been made public. Key recommendations of
the first report (2020-21 period) include the following.
Share of states in central taxes: The share of states in the centre’s taxes is recommended to be
decreased from 42% during the 2015-20 period to 41% for 2020-21. The 1% decrease is to provide
for the newly formed union territories of Jammu and Kashmir, and Ladakh from the resources of the
central government. Table 8 shows the criteria used by the 15th Finance Commission to determine
each state’s share in central taxes, and the weight assigned to each criterion.
Use of population data: The Terms of Reference (ToR) of the Commission required it to use the
population data of 2011 while making recommendations. Accordingly, the Commission used only
2011 population data for its recommendations. Conversely, to reward efforts made by states in
controlling their population, the Demographic Performance criterion has been introduced by the
26
Commission. It will be computed by using the
reciprocal of the total fertility ratio of each
state, scaled by 1971 population data. States
with a lower fertility ratio will be scored higher
on this criterion.
Revenue deficit grant: The Commission
recommended post-devolution revenue deficit
grants for 14 states worth Rs 74,340 crore.
Sector-specific and performance-based
grants: The Commission recommended a grant
of Rs 7,375 crore for nutrition in 2020-21. The
Commission will provide sector-specific grants
for following sectors in its final report: (i)
nutrition, (ii) health, (iii) pre-primary education,
(iv) judiciary, (v) rural connectivity,
Table 8: Criteria for devolution (2020-21)
Criteria 14th FC 2015-20
15th FC 2020-21
Income Distance 50.0 45.0
Population (1971) 17.5 -
Population (2011) 10.0 15.0
Area 15.0 15.0
Forest Cover 7.5 -
Forest and Ecology - 10.0
Demographic Performance - 12.5
Tax Effort - 2.5
Total 100 100
Note: Income distance is the distance of the state’s income from the state with the highest income, where income is expressed as GSDP per capita.
Sources: Report for the year 2020-21, 15th Finance Commission; PRS.
(vi) railways, (vii) police training, and (viii) housing. It will also provide certain performance-based
grants in its final report for: (i) implementation of agricultural reforms, (ii) development of
aspirational districts and blocks, (iii) power sector reforms, (iv) enhancing trade including exports, (v)
incentives for education, and (vi) promotion of tourism.
GST implementation: The Commission highlighted some challenges with the implementation of the
Goods and Services Tax (GST). These include: (i) large shortfall in collections as compared to
original forecast, (ii) high volatility in collections, (iii) accumulation of large integrated GST credit,
(iv) glitches in invoice and input tax matching, and (v) delay in refunds. The Commission observed
that the continuing dependence of states on compensation from the central government (21 states out
of 29 states in 2018-19) for making up for the shortfall in revenue is a concern. It suggested that the
structural implications of GST for low consumption states need to be considered.
Financing of security-related expenditure: The ToR of the Commission required it to examine
whether a separate funding mechanism for defence and internal security should be set up and if so,
how it can be operationalised. In this regard, the Commission had constituted an expert group
comprising representatives of the Ministries of Defence, Home Affairs, and Finance. The
Commission noted that the Ministry of Defence proposed following measures for this purpose: (i)
setting up of a non-lapsable fund, (ii) levy of a cess, (iii) monetisation of surplus land and other assets,
(iv) tax-free defence bonds, and (v) utilising proceeds of disinvestment of defence public sector
undertakings. The expert group is expected to examine these proposals or alternative funding.
Off-budget borrowing: The Commission observed that financing capital expenditure through off-
budget borrowings detracts from compliance with the FRBM Act. It recommended that both the
central and state governments should make full disclosure of extra-budgetary borrowings. The
outstanding extra-budgetary liabilities should be identified and eliminated in a time-bound manner.
Statutory framework for public financial management: The Commission recommended forming
an expert group to draft legislation to provide for a statutory framework for sound public financial
management system. It observed that an overarching legal fiscal framework is required which will
provide for budgeting, accounting, and audit standards to be followed at all levels of government.
27
Appendix 4: Spending by states on key sectors
This section provides details on expenditure by states on key sectors during the 2015-21 period. The
share of expenditure on a particular sector denotes the share of that sector in the state’s budget.
Expenditure on a sector is the sum of the revenue expenditure made and the capital outlay done in that
sector. Note that spending on a sector may be affected by funding from the centre in the form of
grants for centrally sponsored schemes and other central grants. The sectoral spending in Delhi may
be different from other states as Police is with the centre and the state has negligible rural or
agricultural area.
Education
During the 2015-21 period, states on an average have spent 15.9% of their budget on the education
sector. This consists of 0.5% of the budget on capital outlay, and 15.4% of the budget on revenue
expenditure. This includes expenditure on schemes (such as the Sarva Shiksha Abhiyan and the
Midday Meal scheme), construction and maintenance of school buildings, and payment of salaries and
pensions of teaching and other staff.
Figure 41: Delhi spends the highest on education
Sources: State Budget Documents; PRS.
Agriculture and allied activities
Expenditure under this head includes expenditure on subsidies, agricultural marketing, crop
husbandry, horticulture, waiver of agricultural loans (in some states), and implementing schemes,
including Prime Minister Fasal Bima Yojana and Rashtriya Krishi Vikas Yojana. During the 2015-21
period, states on an average have spent 6.4% of their budget on agriculture. This consists of 0.5% of
the budget on capital outlay, and 5.9% of the budget on revenue expenditure.
Figure 42: Chhattisgarh spends the highest on agriculture and allied activities
Sources: State Budget Documents; PRS.
Rural development
Expenditure on this sector includes implementation of various rural development schemes, such as the
National Rural Employment Guarantee Scheme, and the Swachh Bharat Mission. During the 2015-21
period, states on an average have spent 5.9% of their budget on rural development. This consists of
1% of the budget on capital outlay, and 4.9% of the budget on revenue expenditure.
13.5
%
11.8
%
21.3
%
18.5
%
18.8
% 26.1
%
15.6
%
15.3
% 18.3
%
15.1
%
14.7
%
16.6
%
13.1
% 16.2
%
17.8
%
18.1
%
12.7
% 16.2
%
16.2
%
13.8
%
15.0
%
13.3
% 17.8
%
17.1
%
15.4
%
16.6
%
9.5%
19.0
%
14.8
%
16.6
%
0%
10%
20%
30%
AP AR AS BR CG DL GA GJ HP HR JH JK KA KL MG MH MN MP MZ NL OD PB RJ SK TN TR TS UK UP WB
Capital Revenue
5.6%
6.0%
5.1%
3.1%
18.1
%
0.4%
3.0% 5.
0% 6.2%
4.7%
4.8% 6.
9% 8.8%
5.7% 6.6% 8.
6%
4.9%
7.6%
7.6%
5.7% 8.
1%
12.2
%
4.5%
7.2%
6.2%
5.8%
11.3
%
7.6%
4.0%
3.7%
0%
5%
10%
15%
20%
25%
AP AR AS BR CG DL GA GJ HP HR JH JK KA KL MG MH MN MP MZ NL OD PB RJ SK TN TR TS UK UP WB
Capital Revenue
28
Figure 43: Jharkhand spends the highest on rural development
Sources: State Budget Documents; PRS.
Energy
Expenditure under this head includes subsidy to consumers, the allocation for power projects, and
assistance to discoms under UDAY scheme in certain states. During the 2015-21 period, states on an
average have spent 5.7% of their budget on the energy sector. This consists of 1.5% of the budget on
capital outlay, and 4.2% of the budget on revenue expenditure.
Figure 44: Goa spends the highest on energy
Note: Expenditure on energy in Goa is higher as electricity distribution in the state is through a state department unlike in other states.
Sources: State Budget Documents; PRS.
Health and family welfare
During the 2015-21 period, states on an average have spent 5.3% of their budget on health and family
welfare. This consists of 0.5% of the budget on capital outlay, and 4.8% of the budget on revenue
expenditure. This includes expenditure on schemes such as the Ayushman Bharat, National Health
Mission, and construction and maintenance of hospitals.
Figure 45: Delhi spends the highest on health and family welfare
Sources: State Budget Documents; PRS.
Roads and bridges
During the 2015-21 period, states on an average have spent 4.7% of their budget on roads and bridges.
This consists of 3.4% of the budget on capital outlay, and 1.3% of the budget on revenue expenditure.
Figure 46: Arunachal Pradesh spends the highest on roads and bridges
Sources: State Budget Documents; PRS.
6.5%
3.4% 4.4%
12.3
%
5.8%
0.5% 1.5% 3.
4%
3.6%
4.2%
14.5
%
6.4%
3.7%
2.7%
9.4%
3.8%
10.9
%
7.0%
3.6%
7.5% 9.
2%
1.1%
7.7%
3.2%
3.3%
8.2%
4.4% 7.
3%
6.4%
10.4
%
0%
10%
20%
AP AR AS BR CG DL GA GJ HP HR JH JK KA KL MG MH MN MP MZ NL OD PB RJ SK TN TR TS UK UP WB
Capital Revenue
3.9% 6.
5%
2.6%
6.7%
4.9%
4.9%
15.3
%
6.5%
2.5%
12.9
%
4.8% 7.
7%
6.0%
0.1% 1.3% 3.
6% 4.3%
8.2%
7.0%
4.4%
1.9%
5.5%
13.3
%
4.6%
4.6%
0.7%
7.3%
0.5%
7.6%
2.0%
0%
10%
20%
AP AR AS BR CG DL GA GJ HP HR JH JK KA KL MG MH MN MP MZ NL OD PB RJ SK TN TR TS UK UP WB
Capital Revenue
5.0% 7.
5%
6.6%
4.8% 5.7%
12.8
%
7.1%
6.0%
6.3%
4.5%
5.0% 6.
4%
4.2% 5.
8% 7.7%
4.4% 5.0%
4.8% 6.0%
5.3%
5.3%
4.2% 6.
1%
6.4%
5.4%
5.9%
4.2% 4.9%
5.3%
5.5%
0%
10%
20%
AP AR AS BR CG DL GA GJ HP HR JH JK KA KL MG MH MN MP MZ NL OD PB RJ SK TN TR TS UK UP WB
Capital Revenue
1.6%
15.8
%
8.4%
4.8% 6.
8%
3.9%
4.4%
4.7%
9.7%
2.9%
6.9%
1.9%
5.7%
4.0%
7.3%
4.7%
4.2%
4.1%
9.2%
5.7%
9.0%
1.5% 3.
1%
10.9
%
4.2%
4.7%
1.6% 4.
3% 6.4%
2.2%
0%
10%
20%
AP AR AS BR CG DL GA GJ HP HR JH JK KA KL MG MH MN MP MZ NL OD PB RJ SK TN TR TS UK UP WB
Capital Revenue
29
Police
During the 2015-21 period, states on an average have spent 4.2% of the budget on police. This
consists of 0.3% of the budget on capital outlay, and 3.9% of the budget on revenue expenditure.
Figure 47: Manipur spends the highest on police
Sources: State Budget Documents; PRS.
Social security
During the 2015-21 period, states on an average have spent 4.1% of the budget on social security.
This consists of 0.1% of the budget on capital outlay, and 4% of the budget on revenue expenditure.
Figure 48: West Bengal spends the highest on social security
Sources: State Budget Documents; PRS.
Irrigation and flood control
During the 2015-21 period, states on an average have spent 4% of their budget on irrigation and flood
control. This consists of 3% of the budget on capital outlay, and 1% of the budget on revenue
expenditure.
Figure 49: Telangana spends the highest on irrigation and flood control
Sources: State Budget Documents; PRS.
Urban development
During the 2015-21 period, states on an average have spent 3.1% of their budget on urban
development. This consists of 0.7% of the budget on capital outlay, and 2.4% of the budget on
revenue expenditure.
Figure 50: Gujarat spends the highest on urban development
Sources: State Budget Documents; PRS.
3.4%
5.4%
5.3%
4.6%
5.3%
0.5%
3.7%
3.1%
3.3% 4.
3% 6.5%
9.1%
4.0%
3.1%
6.4%
4.7%
12.9
%4.
0%
6.6%
11.7
%
3.4%
7.0%
3.3%
5.7%
3.1%
8.9%
4.3%
4.5%
4.6%
3.8%
0%
3%
6%
9%
12%
15%
AP AR AS BR CG DL GA GJ HP HR JH JK KA KL MG MH MN MP MZ NL OD PB RJ SK TN TR TS UK UP WBCapital Revenue
7.8%
2.3%
1.8%
3.7%
2.5%
6.0%
5.3%
0.8%
2.9%
7.1%
4.0%
2.2%
5.4%
4.5%
2.7%
1.4% 2.
5% 3.1%
1.9%
1.4%
4.7%
2.9% 3.4%
1.7%
4.1% 5.
2% 6.9%
4.3%
4.1%
9.2%
0%
5%
10%
AP AR AS BR CG DL GA GJ HP HR JH JK KA KL MG MH MN MP MZ NL OD PB RJ SK TN TR TS UK UP WB
Capital Revenue
6.7%
2.1% 3.
1%
2.5% 3.2%
0.8%
2.8%
6.6%
2.5% 3.
3%
2.9%
2.6%
7.2%
0.9%
1.2%
4.3%
3.9% 5.
5%
0.5%
0.9%
7.3%
2.6%
2.5%
0.9% 1.
8%
0.7%
8.4%
2.5% 3.
8%
1.9%
0%
4%
8%
12%
AP AR AS BR CG DL GA GJ HP HR JH JK KA KL MG MH MN MP MZ NL OD PB RJ SK TN TR TS UK UP WB
Capital Revenue
3.2%
2.3%
2.1% 2.4% 2.8%
5.7%
2.2%
6.4%
1.4%
4.8%
3.7%
2.9%
2.3%
0.9% 1.3%
3.9%
2.8% 3.
4% 4.0%
1.8%
1.8%
0.9%
3.1%
3.0%
2.3% 3.
5%
3.1%
2.0% 2.7%
4.5%
0%
5%
10%
AP AR AS BR CG DL GA GJ HP HR JH JK KA KL MG MH MN MP MZ NL OD PB RJ SK TN TR TS UK UP WB
Capital Revenue
30
Welfare of SC, ST, and OBC
During the 2015-21 period, states on an average have spent 2.9% of the budget on welfare of SC, ST,
and OBC. This consists of 0.3% of the budget on capital outlay, and 2.6% of the budget on revenue
expenditure.
Figure 51: Andhra Pradesh spends the highest on welfare of SC, ST, and OBC
Sources: State Budget Documents; PRS.
Water supply and sanitation
During the 2015-21 period, states on an average have spent 2.3% of their budget on water supply and
sanitation. This consists of 1.2% of the budget on capital outlay, and 1.1% of the budget on revenue
expenditure.
Figure 52: Arunachal Pradesh spends the highest on water supply and sanitation
Sources: State Budget Documents; PRS.
Housing
During the 2015-21 period, states on an average have spent 1.3% of the budget on the housing sector.
This consists of 0.3% of the budget on capital outlay, and 1% of the budget on revenue expenditure.
Figure 53: Bihar spends the highest on housing
Sources: State Budget Documents; PRS.
11.3
%0.
0%
1.8% 1.8%
0.9%
0.7%
1.2%
2.6%
0.2% 0.
5% 2.1%
0.5%
5.4%
2.3%
1.0%
4.6%
2.8%
2.7% 4.
3%
0.5%
2.8%
0.9%
1.0%
1.1%
2.0%
3.6%
6.9%
0.8% 1.
5%
1.5%
0%
3%
6%
9%
12%
AP AR AS BR CG DL GA GJ HP HR JH JK KA KL MG MH MN MP MZ NL OD PB RJ SK TN TR TS UK UP WB
Capital Revenue
1.3%
5.9%
3.1% 3.5%
1.9%
3.2%
5.4%
2.6%
4.8%
3.4%
3.1%
2.7%
2.5%
0.9%
4.1%
1.4%
3.4%
2.4% 3.
2%
1.8%
4.7%
1.3%
4.4%
2.8%
1.2%
2.7%
2.1%
2.3%
1.5% 1.7%
0%
5%
10%
AP AR AS BR CG DL GA GJ HP HR JH JK KA KL MG MH MN MP MZ NL OD PB RJ SK TN TR TS UK UP WB
Capital Revenue
1.4%
0.4%
1.9%
3.1%
2.5%
0.6%
0.1%
1.5%
0.4%
0.1%
0.2%
0.4%
2.0%
0.1% 0.
6% 0.8%
0.2%
2.9%
0.4% 0.
8%
0.6%
0.6%
0.1%
1.6%
1.6%
1.4% 1.
8%
0.1%
1.7%
0.4%
0%
2%
4%
6%
AP AR AS BR CG DL GA GJ HP HR JH JK KA KL MG MH MN MP MZ NL OD PB RJ SK TN TR TS UK UP WB
Capital Revenue
31
Glossary of key terms
Receipts indicate the money received by the government. This includes: (i) the money earned by the
government, (ii) grants received (mainly from the centre), and (iii) the money it receives in the form
of borrowings or repayment of loans.
Capital receipts indicate the receipts which lead to a decrease in assets or an increase in liabilities of
the government. It consists of: (i) the money earned by selling assets such as shares of public
enterprises, and (ii) the money received in the form of borrowings or repayment of loans.
Revenue receipts are receipts which do not have a direct impact on the assets and liabilities of the
government. This consists of the money earned by the government through tax and non-tax sources
(such as dividend income and grants from the central government).
Capital expenditure is used to create assets or to reduce liabilities. It consists of: (i) the money spent
by the government on creating assets such as roads and hospitals, and (ii) the money given by the
government in for repayment of its borrowings.
Revenue expenditure is the expenditure by the government which does not impact its assets or
liabilities. For example, this includes salaries, interest payments, pension, administrative expenses,
and subsidies.
Devolution of union taxes means the money received by states from the central government as the
state’s share in union taxes such as corporation tax, income tax, central GST, customs, and union
excise. It is devolved to the state as per the criteria recommended by the Finance Commission.
Grants-in-aid are transferred by the central government to states and are tied in nature, i.e., they are
linked to specific schemes and expenditure avenues, such as Swachh Bharat Mission, and National
Health Mission.
Outstanding debt is the stock of money borrowed by subsequent governments over the years which
the government currently owes. The figure for a financial year indicates the government’s
outstanding debt at the end of the year.
Fiscal deficit is the gap between the government’s expenditure requirements and its receipts. This
equals the money the government needs to borrow during the year. A surplus arises if receipts are
more than expenditure.
Revenue deficit is the gap between the revenue components of receipts and expenditure, i.e., revenue
disbursements and revenue receipts. This indicates the money the government needs to borrow to
spend on non-capital components (which do not lead to creation of assets).
Primary deficit equals fiscal deficit minus interest payments. This indicates the gap between the
government’s expenditure requirements and its receipts, not taking into account the expenditure
incurred on interest payments on loans taken during the previous years.
Consolidated Fund of the State is the Fund or account into which all of the state government’s
receipts are credited, and which it uses for financing its expenditure.
Charged expenditure includes expenditure which is not required to be voted on by the Assembly and
is charged directly from the Consolidated Fund of the State. Such expenditure can still be discussed
in the Assembly. Examples include interest payments, and salaries and allowances of the Governor
and judges of the High Court.
Voted expenditure consists of all expenditure other than charged expenditure. Such expenditure is
required to be voted upon by the Assembly in the form of Demands for Grants.
Fiscal Responsibility and Budget Management Framework relates to laws passed by states for
institutionalizing financial discipline. The framework provides targets for revenue deficit, fiscal
deficit, and outstanding debt to be met for a specified timeframe by states. It also requires states to
bring out statements on fiscal policy for greater transparency.
32
1 The Income Tax Act, 1961 was amended in December 2019 to provide lower tax rate options of 22% to domestic companies and 15% to new domestic manufacturing companies, provided they do not avail certain deductions. The central government estimated the resultant
revenue loss at Rs 1.45 lakh crore.; Chapter 2: Economic Review, Annual Report 2019-20, Reserve Bank of India, August 25, 2020, https://rbidocs.rbi.org.in/rdocs/AnnualReport/PDFs/2ECONOMICREVIEW694BE07E290546588161AD43C4E702AF.PDF. 2 “GST Revenue Collection for March 2020”, Press Information Bureau, Ministry of Finance, April 1, 2020. 3 World Economic Outlook Update, October 2020, International Monetary Fund, https://www.imf.org/en/Publications/WEO/Issues/2020/09/30/world-economic-outlook-october-2020. 4 Press note on estimates of GDP for Q1 (April-June) of 2020-21, Ministry of Statistics and Programme Implementation, August 31, 2020, http://www.mospi.gov.in/sites/default/files/press_release/PRESS_NOTE-Q1_2020-21.pdf. 5 “Estimates of GDP for Q2 (July-September) 2020-21”, Ministry of Statistics and Programme Implementation, November 27, 2020, https://mospi.gov.in/documents/213904/416359//PRESS_NOTE-Q2_2020-211606480008567.pdf/f2b98a11-a06d-8b6f-6f37-621f33ca8f25. 6 Monetary Policy Statement, December 2020, Reserve Bank of India, December 4, 2020, https://rbidocs.rbi.org.in/rdocs/PressRelease/PDFs/PR720A9A40E7FC8884A6A9F158967DE9BFF20.PDF. 7 Presentation of details of 5th Tranche announced by Union Finance & Corporate Affairs Minister Smt. Nirmala Sitharaman under
Aatmanirbhar Bharat Abhiyaan to support Indian economy in fight against COVID-19, May 17, 2020, https://static.pib.gov.in/WriteReadData/userfiles/Aatma%20Nirbhar%20Bharat%20%20Presentation%20Part%205%2017-5-2020.pdf. 8 The Constitution (101st Amendment) Act, 2016, Ministry of Law and Justice, September 8, 2016, http://legislative.gov.in/sites/default/files/Cons.amend%20101-060717.pdf. 9 The GST (Compensation to States) Act, 2017, India Code, Ministry of Law and Justice, as on September 17, 2020, https://www.indiacode.nic.in/bitstream/123456789/2253/1/A2017-15.pdf. 10 Industry Consumption Review, March 2020, Petroleum Planning and Analysis Cell, Ministry of Petroleum and Natural Gas, https://www.ppac.gov.in/WriteReadData/Reports/202004240833124222578WebVersion-IndustryConsumptionReportforMarch2020.pdf. 11 Performance of SCCL at a Glance, Singareni Collieries Company Limited, as on September 17, 2020, https://scclmines.com/scclnew/performance_production.asp. 12 Provisional Production and Off-take Performance of CIL and Subsidiary Companies for the period April 2019-March 2020, Coal India Limited, April 1, 2020, https://www.coalindia.in/DesktopModules/DocumentList/documents/nsebseprodmar2001042020.pdf. 13 “Centre Released Rs. 1,65,302 Crore as GST Compensation to States/UTs for the FY 2019-20 against cess collection of Rs. 95,444 crore”, Press Information Bureau, Ministry of Finance, July 27, 2020. 14 Unstarred Question No. 58, Lok Sabha, September 14, 2020, http://164.100.24.220/loksabhaquestions/annex/174/AU58.pdf. 15 “Borrowing options for GST Compensation requirement for 2020-21”, Press Information Bureau, Ministry of Finance, August 29, 2020. 16 Unstarred Question No. 226, Rajya Sabha, September 15, 2020, https://pqars.nic.in/annex/252/AU226.pdf. 17 “Recommendations of the 42nd GST Council Meeting”, Press Information Bureau, Ministry of Finance, October 5, 2020. 18 Budget Speech, 2020-21, Union Budget, February 1, 2020, https://www.indiabudget.gov.in/doc/Budget_Speech.pdf. 19 “All States choose Option-1 to meet GST implementation shortfall”, Press Information Bureau, Ministry of Finance, December 5, 2020. 20 “8th Instalment of Rs. 6,000 crore released to the States as back-to-back loan to meet the GST compensation shortfall”, Press Information Bureau, Ministry of Finance, December 21, 2020. 21 State Finances: A Study of Budgets of 2019-20, Reserve Bank of India, September 30, 2019, https://rbidocs.rbi.org.in/rdocs/Publications/PDFs/STATEFINANCE201920E15C4A9A916D4F4B8BF01608933FF0BB.PDF. 22 Industry Consumption Report, October 2020, Petroleum Planning and Analysis Cell, Ministry of Petroleum and Natural Gas, https://www.ppac.gov.in/WriteReadData/Reports/202011251221482780555IndustryConsumptionOctober2020WebVer.pdf. 23 The Finance Act, 2018, Ministry of Finance, March 28, 2018, http://egazette.nic.in/writereaddata/2018/184302.pdf. 24 Report of the High-Level Group on Health Constituted under the 15th Finance Commission, 2019, https://fincomindia.nic.in/writereaddata/html_en_files/fincom15/StudyReports/High%20Level%20group%20of%20Health%20Sector.pdf. 25 National Health Policy 2017, Ministry of Health and Family Welfare, Government of India, March 2017, https://www.nhp.gov.in/nhpfiles/national_health_policy_2017.pdf. 26 Report on Performance of State Power Utilities 2018-19, Power Finance Corporation of India, as accessed on November 3, 2020, https://pfcindia.com/DocumentRepository/ckfinder/files/Operations/Performance_Reports_of_State_Power_Utilities/Report_on_Performance_of_State_Power_Utilities_2018_19.pdf. 27 UDAY Portal, Ministry of Power, as accessed on August 8, 2020, https://www.uday.gov.in/home.php. 28 PRAAPTI Portal, Ministry of Power, as accessed on November 4, 2020, https://praapti.in/. 29 Chapter II: Fiscal Position of State Governments, State Finances: A study of budgets, Reserve Bank of India, October 2020, https://rbidocs.rbi.org.in/rdocs/Publications/PDFs/0SF_271020FCF77451F1DF744B2B244875C785B8EF3.PDF. 30 The Report of the 15th Finance Commission for FY 2020-21, February 2020, https://fincomindia.nic.in/. 31 Chapter 7: Fiscal Capacity for the 21st Century, Volume I, Economic Survey 2015-16, https://www.indiabudget.gov.in/budget2016-2017/es2015-16/echapvol1-07.pdf. 32 “Haryana cabinet, which met under the chairmanship of chief minister, Mr. Manohar Lal today approved certain changes in the excise
policy of the year 2020-21“, Public Relations Department, Government of Haryana, May 5, 2020, https://prharyana.gov.in/en/haryana-cabinet-which-met-under-the-chairmanship-of-chief-minister-mr-manohar-lal-today-approved-3. 33 “Nagaland impose Covid-19 cess on petrol and diesel sales”, The Economic Times, April 30, 2020,
https://economictimes.indiatimes.com/industry/energy/oil-gas/nagaland-impose-covid-19-cess-on-petrol-and-diesel-sales/articleshow/75462776.cms?from=mdr. 34 “Development Expenditure in the States Post Fourteenth Finance Commission Award: How have States Spent the Award Money?”, Study
Commissioned by the 15th Finance Commission, ICRIER, May 2019,
https://fincomindia.nic.in/writereaddata/html_en_files/fincom15/StudyReports/Development%20Expenditure%20in%20the%20States%20Post%20FFC%20Award_How%20have%20states%20spent%20the%20award%20money.pdf. 35 FRBM Review Committee Report Volume-I, Ministry of Finance, January 2017, https://dea.gov.in/sites/default/files/Volume%201%20FRBM%20Review%20Committee%20Report.pdf. 36 FRBM Statement 2020-21, Madhya Pradesh, https://finance.mp.gov.in/2020/frbm_hindi.pdf.