897 8.2.1. Power is one of the prime movers of economic development. The level of availability and accessibility of affordable and quality power is also one of the main determinants of the qualify of life. The Government has, since Independence, been giving priority to this sector while fixing the Plan outlays. As a result, the installed generation capacity has risen from a mere 1,300 megawatt (MW) at the time of Independence to more than 1,00,000 MW today. Along with the growth in installed generation capacity, there has also been a phenomenal increase in the transmission and distribution (T&D) capacity. However, despite these achievements, the power sector has not kept pace with the growth in demand with the result that the country has always faced energy and peaking shortages. 8.2.2. The state electricity boards (SEBs), have, in the past, played a significant role in the generation and supply of power. But the present financial health of the SEBs is not sound, to say the least. This is mainly due to un-economic tariffs for agriculture, lower slabs of domestic consumption and high T&D losses, which often disguise large-scale theft, and low billing and collection efficiency. This is the main roadblock to attracting the much-needed private investment and, in fact, has been one of the main reasons for the shortfall in capacity addition from private sector projects during the Ninth Plan. The actual capacity addition during the Ninth Plan was 19,015 MW against a target of 40,245 MW. The other major reasons for shortfall in the capacity addition were delay in land acquisition and environmental clearances, unresolved issues in fuel linkages, contractual problems, resettlement and rehabilitation (R&R) problems and law and order problems. 8.2.3. As far as the Tenth Plan is concerned, the Working Group Report on Power has envisaged a capacity addition requirement of 46,939 MW during the Plan period. However, keeping in view the status CHAPTER 8.2 POWER of the ongoing, sanctioned and new projects in the pipeline, the Planning Commission assessed that a capacity addition target of the order of 41,110 MW (comprising 18,659 MW from on-going, 9,193 MW from projects cleared by the Central Electricity Authority (CEA) and 13,258 MW from new schemes) would be more realistic. 8.2.4. The Government proposes to enhance public funding for the sector as well as encourage the public sector undertakings (PSUs) to take up projects in joint ventures with private investors and state governments during the Tenth Plan period. As part of these efforts, the Accelerated Generation and Supply Programme (AG&SP) is proposed to be extended during the Tenth Plan to provide funds to critical on-going schemes at subsidised interest rates. There is also a focus on initiating suitable policy measures to accelerate the pace of hydro power development as well as to make nuclear power generation as competitive as power generation from other fuels. The Government is making concerted efforts to channelise adequate investment to ensure the completion of the National Grid by the end of the Eleventh Plan. This would enhance the inter-regional transfer of power and facilitate the optimum utilisation of existing assets. 8.2.5. Power sector reforms were initiated in 1991 to encourage competition in each sub element of the sector, namely, generation, transmission and distribution under an independent and transparent regulatory regime. With this objective in mind a Central Electricity Regulatory Commission (CERC) has already been set up at the national level and State Electricity Regulatory Commissions (SERCs) set up in 19 states, 11 of which have issued tariff orders. Private sector participation has also been set in motion with the enactment of the Electricity Laws (Amendment) Act in 1998. The draft Electricity Bill, 2001 has been introduced in Parliament which will replace the existing three laws relating to
Transcript
897
8.2.1. Power is one of the prime movers ofeconomic development. The level of availability andaccessibility of affordable and quality power is alsoone of the main determinants of the qualify of life.The Government has, since Independence, beengiving priority to this sector while fixing the Planoutlays. As a result, the installed generation capacityhas risen from a mere 1,300 megawatt (MW) at thetime of Independence to more than 1,00,000 MWtoday. Along with the growth in installed generationcapacity, there has also been a phenomenalincrease in the transmission and distribution (T&D)capacity. However, despite these achievements,the power sector has not kept pace with the growthin demand with the result that the country hasalways faced energy and peaking shortages.
8.2.2. The state electricity boards (SEBs), have,in the past, played a significant role in the generationand supply of power. But the present financial healthof the SEBs is not sound, to say the least. This ismainly due to un-economic tariffs for agriculture,lower slabs of domestic consumption and high T&Dlosses, which often disguise large-scale theft, andlow billing and collection efficiency. This is the mainroadblock to attracting the much-needed privateinvestment and, in fact, has been one of the mainreasons for the shortfall in capacity addition fromprivate sector projects during the Ninth Plan. Theactual capacity addition during the Ninth Plan was19,015 MW against a target of 40,245 MW. Theother major reasons for shortfall in the capacityaddition were delay in land acquisition andenvironmental clearances, unresolved issues in fuellinkages, contractual problems, resettlement andrehabilitation (R&R) problems and law and orderproblems.
8.2.3. As far as the Tenth Plan is concerned, theWorking Group Report on Power has envisaged acapacity addition requirement of 46,939 MW duringthe Plan period. However, keeping in view the status
CHAPTER 8.2
POWER
of the ongoing, sanctioned and new projects in thepipeline, the Planning Commission assessed thata capacity addition target of the order of 41,110 MW(comprising 18,659 MW from on-going, 9,193 MWfrom projects cleared by the Central ElectricityAuthority (CEA) and 13,258 MW from newschemes) would be more realistic.
8.2.4. The Government proposes to enhancepublic funding for the sector as well as encouragethe public sector undertakings (PSUs) to take upprojects in joint ventures with private investors andstate governments during the Tenth Plan period.As part of these efforts, the Accelerated Generationand Supply Programme (AG&SP) is proposed tobe extended during the Tenth Plan to provide fundsto critical on-going schemes at subsidised interestrates. There is also a focus on initiating suitablepolicy measures to accelerate the pace of hydropower development as well as to make nuclearpower generation as competitive as powergeneration from other fuels. The Government ismaking concerted efforts to channelise adequateinvestment to ensure the completion of the NationalGrid by the end of the Eleventh Plan. This wouldenhance the inter-regional transfer of power andfacilitate the optimum utilisation of existing assets.
8.2.5. Power sector reforms were initiated in 1991to encourage competition in each sub element ofthe sector, namely, generation, transmission anddistribution under an independent and transparentregulatory regime. With this objective in mind aCentral Electricity Regulatory Commission (CERC)has already been set up at the national level andState Electricity Regulatory Commissions (SERCs)set up in 19 states, 11 of which have issued tarifforders. Private sector participation has also beenset in motion with the enactment of the ElectricityLaws (Amendment) Act in 1998. The draft ElectricityBill, 2001 has been introduced in Parliament whichwill replace the existing three laws relating to
TENTH FIVE YEAR PLAN 2002-07
898
electricity: the Indian Electricity Act, 1910 asamended from time to time; the Electricity (Supply)Act, 1948 as amended from time to time; and theElectricity Regulatory Commission Act, 1998.
8.2.6. The Electricity Bill recognises trading ofpower as a distinct activity and permits SERCs toallow open access in distribution of electricity inphases that would ultimately encourage efficiencyand competition.
8.2.7 These reforms have to be carried forwardaggressively to improve the financial health of theSEBs. The issue of one-time settlement of duespayable by SEBs to central power utilities (CPUs)has been addressed by securitising the dues. It islikely to facilitate further reforms in the sector.Reforms in the distribution sector have beenidentified as the key area of reform. The AcceleratedPower Development Programme (APDP) wasinitiated in 2000-01 in order to give a fillip to thereform process in the power sector. One of the mainstrategies identified in this regard is thedevelopment of distribution plans/projects for alldistribution circles as centres of excellence thatcan be replicated by the states in the later phaseof distribution reforms. Sixty-three such circles havebeen taken up initially under APDP funding, whichenvisages metering of 11 KiloVolt (KV) feeders,improvement/strengthening of sub-transmissionand distribution network, 100 per cent metering,establishment of a management information system(MIS) to improve billing, collection etc.
8.2.8 To ensure better utilisation of funds forreforms, an Accelerated Power Development andReforms Programme (APDRP) has beenformulated by making certain modifications in theAPDP scheme. It is aimed at promoting investmentfor distribution reforms. The funding under APDRPis proposed to be 50 per cent on investment streamand 50 per cent on incentive stream. The focus isto ensure that investment must result in quantifiablephysical and financial benefits in the selectedcircles.
8.2.9. Out of the estimated 80,000 villages yet tobe electrified, the Tenth Plan proposes to electrify62,000 villages through grid supply. The balance18,000 remote villages are proposed to be electrified
by 2011-12 through the use of decentralised non-conventional sources of energy. In order to facilitatethe flow of funds, the rural electrification programmehas been included as a component of the PradhanMantri Gramodaya Yojana (PMGY) and the statesare being encouraged to pool resources from otherschemes under the Minimum Need Programme(MNP) and Rural Infrastructure Development Fund(RIDF) to meet the objective of 100 per centelectrification. A new scheme called AcceleratedRural Electrification Programme (AREP), withprovision for interest subsidy, is being launched.The participation of decentralised power producerswill be encouraged, especially for electrification ofremote villages. Village-level organisations likepanchayat raj institutions (PRIs), rural cooperativesand non-government organisations (NGOs) will playa crucial role in the rural electrification programme.Community participation is essential for success ofthe programme.
8.2.10. The restructuring of the existing renewableenergy programmes towards gradualcommercialisation as initiated during the Ninth Planwould be continued during the Tenth Plan period.In this context, a draft Renewable Energy Policyformulated by the Ministry of Non-ConventionalSources of Energy is under the consideration ofthe Cabinet.
8.2.11. Private sector investments in renewableenergy sources are to be encouraged by promotinga bidding process for available subsidies. Thecontracts should be awarded to privateentrepreneurs who provide the maximum benefitwith the lowest amount of subsidies.
POWER SECTOR REFORMS
8.2.12. Apart from envisaging the setting up ofthe CERC, the Common Minimum Planformulated at the Chief Minister’s conference inDecember 1996 also accepted the need forrationalisation of tariffs so that subsidisedsectors like agriculture would pay at least 50 percent of the average cost of supply within threeyears. The establishment of SERCs had beenenvisaged by the State Power Ministers’conference, also in December 1996.
POWER
899
8.2.13. Besides licensing and setting ofperformance norms, the CERC was expected toset tariffs for all generation and transmission utilitiessupplying power across several states. The SERCswere expected to discharge a similar function forstate utilities. Most importantly, the regulatory bodieswere expected to encourage competition, on a levelplaying field, in each sub sector, namely generation,transmission, distribution and supply. Suchcompetition under an independent adequate andtransparent regulatory regime was expected to yieldthe desired efficiency gains. Accordingly, theElectricity Regulatory Commissions Act, was passedin July 1998.
8.2.14. Nineteen states — Orissa, Haryana,Andhra Pradesh, Uttar Pradesh, Karnataka,West Bengal, Tamil Nadu , Punjab, Delhi, Gujarat,Madhya Pradesh, Arunachal Pradesh,Maharashtra, Rajasthan, Himachal Pradesh,Assam, Chhatisgarh, Kerala and Uttaranchal —have either constituted or notified the constitutionof SERCs. The SERCs of Orissa, AndhraPradesh, Uttar Pradesh, Maharashtra, Gujarat,Karnataka, Rajasthan, Delhi, Madhya Pradesh,Himachal Pradesh and West Bengal have issuedtariff orders.
8.2.15. The Electricity Laws (Amendment) Act waspassed in 1998 to enable private participation inthe power transmission sector. The Indian ElectricityGrid Code (IEGC) was established by the CERCin January 2000 to ensure grid discipline and set
operation and governance parameters for individualplayers in the T&D sector. Trading of power hasbeen recognised as a distinct activity that wouldencourage efficiency and competition. The PowerTrading Corporation (PTC) was set up to facilitateinter-state trading in power. The Availability BasedTariff order notified by the CERC in January, 2000is a step towards encouraging greater reliabilityand efficiency in generation.
8.2.16. Orissa, Haryana, Andhra Pradesh, UttarPradesh, Karnataka, Rajasthan, Madhya Pradeshand Delhi have enacted State Electricity ReformsActs which provide for unbundling/corporatisationof SEBs, setting up of SERCs etc. The SEBs ofOrissa, Haryana, Andhra Pradesh, Karnataka, UttarPradesh, Delhi and Rajasthan have beenunbundled/ corporatised. (Table 8.2.1)
8.2.17. Hundred per cent metering of 11 KVfeeders have either been completed or is in thefinal stages of completion in Goa, Maharashtra,Gujarat, Andhra Pradesh, Karnataka, TamilNadu, Kerala, Lakshadweep, Haryana, HimachalPradesh, Delhi, Uttar Pradesh, Madhya Pradesh,Rajasthan and Punjab. The Ministry of Power hassigned memorandums of understanding (MoUs)with 20 states to undertake reforms in a time-bound manner. These MoUs provide for time-bound metering in two phases i.e. (i) metering of11 KV feeders and (ii) all consumers. Monitoringis being done to ensure that the agreedmilestones are achieved.
Table 8.2.1Progress Along with Reform Path by States leading the Process
Separate Distribution Yes Yes No Yes No Yes Yescompanies established.
Distribution Yes No No No No No YesPrivatised
TENTH FIVE YEAR PLAN 2002-07
900
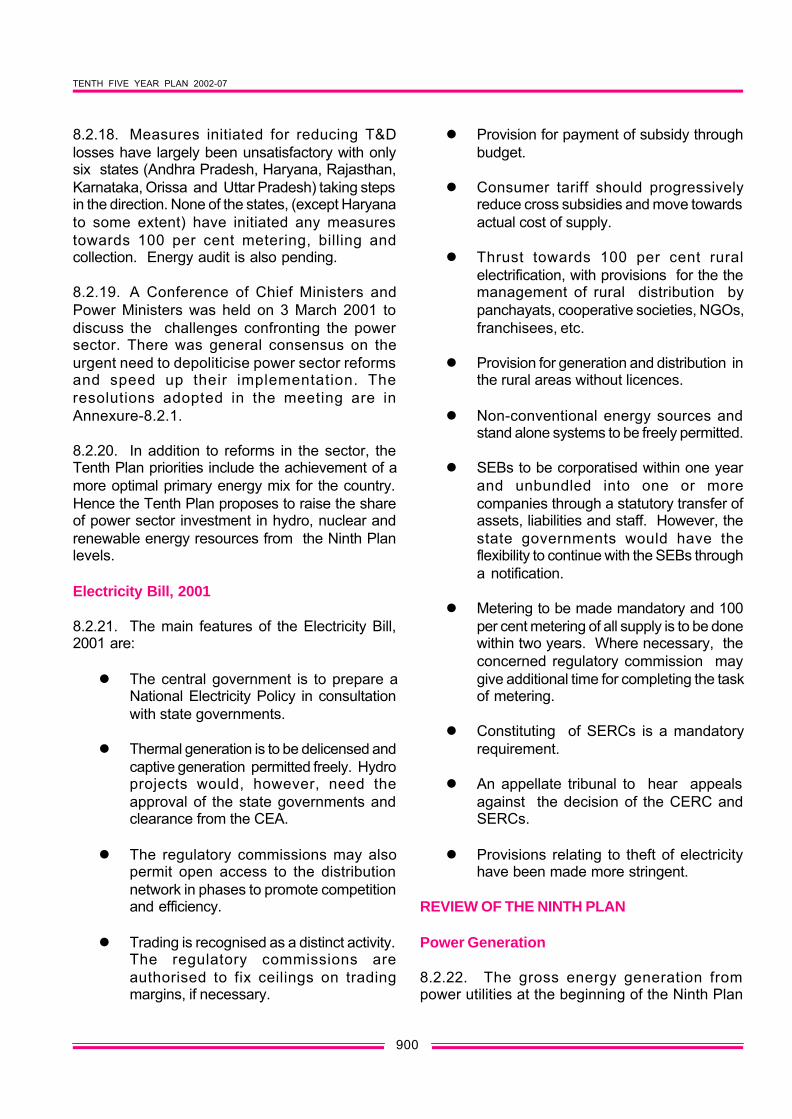
8.2.18. Measures initiated for reducing T&Dlosses have largely been unsatisfactory with onlysix states (Andhra Pradesh, Haryana, Rajasthan,Karnataka, Orissa and Uttar Pradesh) taking stepsin the direction. None of the states, (except Haryanato some extent) have initiated any measurestowards 100 per cent metering, billing andcollection. Energy audit is also pending.
8.2.19. A Conference of Chief Ministers andPower Ministers was held on 3 March 2001 todiscuss the challenges confronting the powersector. There was general consensus on theurgent need to depoliticise power sector reformsand speed up their implementation. Theresolutions adopted in the meeting are inAnnexure-8.2.1.
8.2.20. In addition to reforms in the sector, theTenth Plan priorities include the achievement of amore optimal primary energy mix for the country.Hence the Tenth Plan proposes to raise the shareof power sector investment in hydro, nuclear andrenewable energy resources from the Ninth Planlevels.
Electricity Bill, 2001
8.2.21. The main features of the Electricity Bill,2001 are:
l The central government is to prepare aNational Electricity Policy in consultationwith state governments.
l Thermal generation is to be delicensed andcaptive generation permitted freely. Hydroprojects would, however, need theapproval of the state governments andclearance from the CEA.
l The regulatory commissions may alsopermit open access to the distributionnetwork in phases to promote competitionand efficiency.
l Trading is recognised as a distinct activity.The regulatory commissions areauthorised to fix ceilings on tradingmargins, if necessary.
l Provision for payment of subsidy throughbudget.
l Consumer tariff should progressivelyreduce cross subsidies and move towardsactual cost of supply.
l Thrust towards 100 per cent ruralelectrification, with provisions for the themanagement of rural distribution bypanchayats, cooperative societies, NGOs,franchisees, etc.
l Provision for generation and distribution inthe rural areas without licences.
l Non-conventional energy sources andstand alone systems to be freely permitted.
l SEBs to be corporatised within one yearand unbundled into one or morecompanies through a statutory transfer ofassets, liabilities and staff. However, thestate governments would have theflexibility to continue with the SEBs througha notification.
l Metering to be made mandatory and 100per cent metering of all supply is to be donewithin two years. Where necessary, theconcerned regulatory commission maygive additional time for completing the taskof metering.
l Constituting of SERCs is a mandatoryrequirement.
l An appellate tribunal to hear appealsagainst the decision of the CERC andSERCs.
l Provisions relating to theft of electricityhave been made more stringent.
REVIEW OF THE NINTH PLAN
Power Generation
8.2.22. The gross energy generation frompower utilities at the beginning of the Ninth Plan
POWER
901
was 394.5 billion units (BU). The Ninth Planenvisaged a gross energy generation target of606.7 BU for the utilities in the terminal year ofthe Ninth Plan (2001-02). As against this, theactual energy generation has been 515.3 BU.This works out to a compound annual growth rate(CAGR) of about 5.5 per cent during the NinthPlan period. The shortfall of 91.4 BU in 2001-02is mainly due to the shortfall in generationcapacity addition and hydro generation due toinadequate rainfall in the catchment areas ofhydro power stations.
Capacity Addition
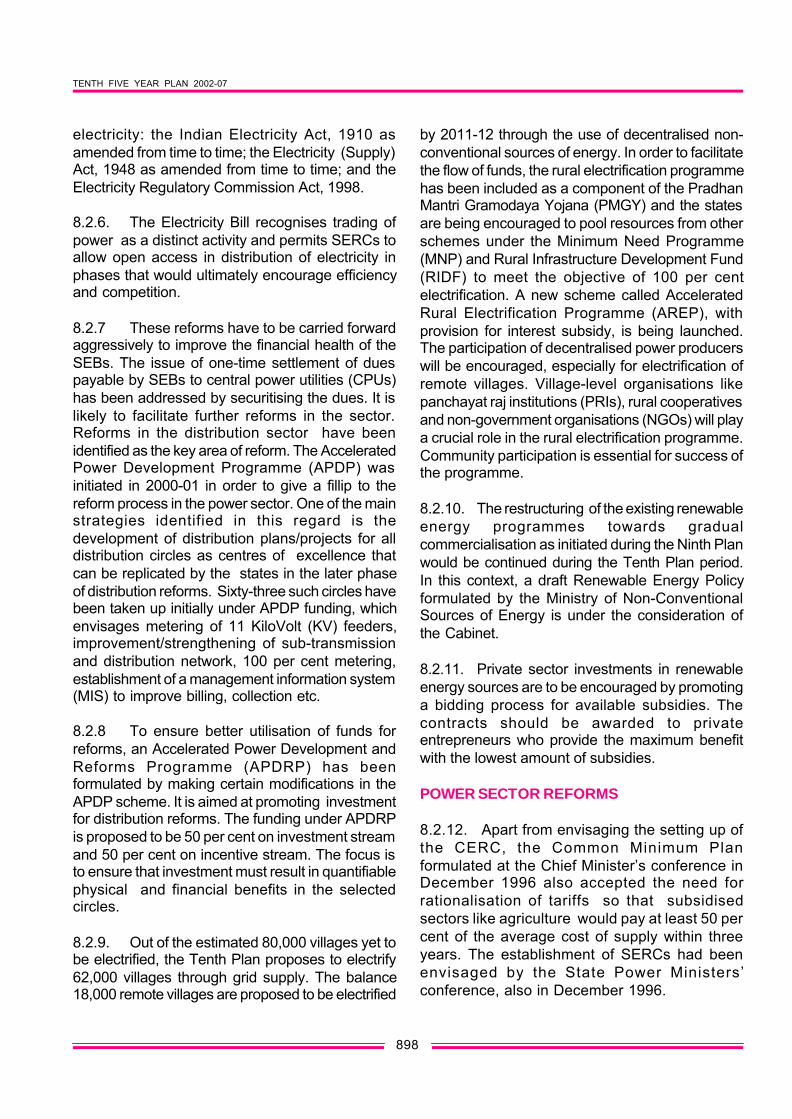
8.2.23. The all-India installed generating capacityof utilities at the beginning of the Ninth Plan was84,893 MW (excluding wind capacity of 902 MW).This included 21,568 MW of hydro, 61,012 MW ofthermal and 2,225 MW of nuclear power. The NinthPlan programme envisaged a capacity addition of40,245 MW. As against this, the actual capacityaddition was 19,015 MW during the Ninth Plan(Table 8.2.2).
8.2.24. The capacity addition of 19,015 MWduring the Ninth Plan represents 47 per cent ofthe targeted addition. In contrast, capacity additionduring the Eighth Plan was 54 per cent of the target(16,422 MW against the target of 30,538 MW). Thesector-wise shortfalls during the Ninth Plan were :central sector 62.2 per cent, state sector 12.1 percent and private sector 71.2 per cent. Theachievement of 19,015 MW represents an additionof 3,803 MW per annum, compared to the target of8,049 MW per annum.
8.2.25. The main reasons for the shortfall incapacity addition are: inability to get private sectorprojects off the ground in the absence of adequatearrangements for ensuring payment security, delayin land acquisition and environmental clearances,unresolved issues relating to fuel linkages,contractual problems, resettlement andrehabilitation problems and law and order problems.
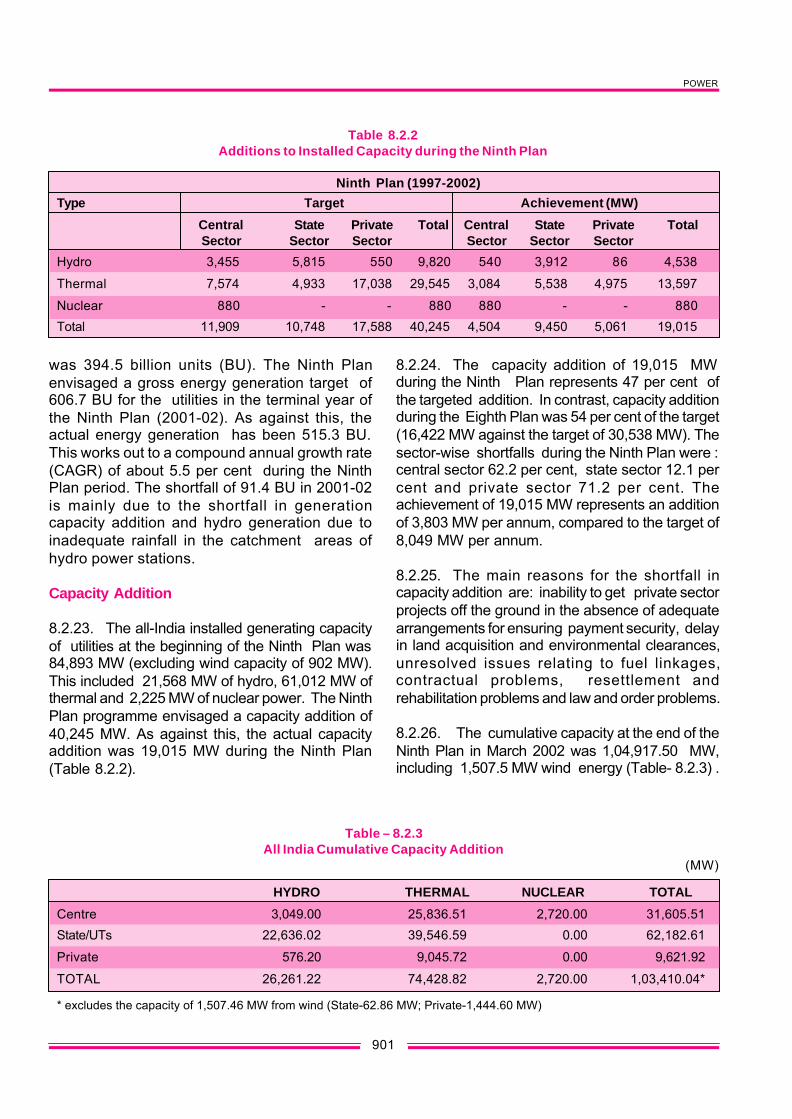
8.2.26. The cumulative capacity at the end of theNinth Plan in March 2002 was 1,04,917.50 MW,including 1,507.5 MW wind energy (Table- 8.2.3) .
Table 8.2.2Additions to Installed Capacity during the Ninth Plan
Ninth Plan (1997-2002)
Type Target Achievement (MW)
Central State Private Total Central State Private TotalSector Sector Sector Sector Sector Sector
Total 11,909 10,748 17,588 40,245 4,504 9,450 5,061 19,015
Table – 8.2.3All India Cumulative Capacity Addition
(MW)
HYDRO THERMAL NUCLEAR TOTAL
Centre 3,049.00 25,836.51 2,720.00 31,605.51
State/UTs 22,636.02 39,546.59 0.00 62,182.61
Private 576.20 9,045.72 0.00 9,621.92
TOTAL 26,261.22 74,428.82 2,720.00 1,03,410.04*
* excludes the capacity of 1,507.46 MW from wind (State-62.86 MW; Private-1,444.60 MW)
TENTH FIVE YEAR PLAN 2002-07
902
Performance of Thermal Power Plants
8.2.27. The performance of the country’s thermalpower plants registered an overall improvementduring the Ninth Plan. The all-India average PlantLoad Factor (PLF) of the thermal power plants was64.4 per cent at the beginning of the Ninth Planand had increased to at 69.9 per cent by the end ofthe Plan period. This is mainly due to a reductionin the weighted average of the generating stations,improvement in the design of the new units andbetter plant maintenance practices. The year-wiseactual achievement of PLF during the Ninth Planperiod is given in Table-8.2.4 :
Power Supply Position
8.2.28. At the beginning of the Ninth Plan, it wasestimated that the energy and peak deficits were11.5 per cent and 18 per cent respectively.However, at the end of the Plan period, despiteachieving only 47 per cent of the envisagedcapacity addition, the energy and peak deficitswere restricted to 7.5 per cent and 12.6 per centrespectively. This is mainly due to a markedimprovement in PLF of the thermal plants and alower than projected growth in demand duringthe Ninth Plan.
Central Share in Total Installed GenerationCapacity
8.2.29. The central sector undertakings viz. theNational Thermal Power Corporation (NTPC), theNational Hydro Electric Power Corporation (NHPC),Nuclear Power Corporation India Ltd. (NPCIL) andNorth Eastern Electric Power Corporation(NEEPCO), continue to play an important role in
adding new generation capacities in different partsof the country. The central sector share in the totalinstalled generation capacity increased from 25.6per cent at the end of the Seventh Plan to 31.52per cent at the end of the Eighth Plan and stood at30.1 per cent at the end of the Ninth Plan due toshortfalls in capacity addition.
Renovation, Modernisation and Life Extension
8.2.30. Since 1984, renovation & modernisation(R&M) has been considered the most cost-effectiveoption to maximise generation from the existingcapacity. Phase-I of the R&M programme, takenup in September 1984 for execution during theSeventh Plan, covered 163 thermal units with atotal capacity of 13,570 MW at 34 selected powerstations. The programme was successfullycompleted in 1991-92 at a total cost of Rs.1,066crore. An average additional generation of 10,000million units (MU)/year was achieved as against thetargeted benefits of 7000 MU/year after completionof the programme.
8.2.31. Encouraged with the results of Phase-I ofthe R&M programme, Phase-II was taken up in1990-91 for 44 thermal power stations comprising198 units with a total capacity of 20,870 MW. Theprogramme was estimated to cost Rs. 2,383 croreand was scheduled to be completed during theEighth Plan. An additional generation of 7,864 MU/year was expected on completion of theprogramme. However, many utilities could notimplement their R&M schemes on schedule due tothe non-availability of funds. As a result, by the endof the Eighth Plan, only around 50 per cent of theworks could be completed, yielding an additionalgeneration of 5,000 MU/year. The remaining R&Mactivities under Phase II, were taken up during theNinth Plan period. The works for 153 thermal unitsare at various stages of completion.
8.2.32. By the end of the Ninth Plan, Life ExtensionWork on 28 units (with a total of 1,981 MW) is likelyto be completed. The life of the units covered bythe programme is likely to be extended by 12-15years.
8.2.33. The R&M and Life Extension Programmesface various constraints. These include:
l Non-availability of timely and adequatefunds due to poor financial health of mostSEBs/utilities.
l Delay in obtaining loans from the PowerFinance Corporation (PFC) due to non-fulfilment of loan conditionalities.
l Procedural delays in the formulation ofschemes and finalistion of orders by SEBs/utilities.
l Reluctance on the part of the SEBs toundertake renovation and modernisationsince this leads to the units going out ofthe system temporarily, thereby loweringgeneration.
R&M and Uprating of Hydro Power Stations
8.2.34. In the Ninth Plan, 36 hydro schemes (23under Phase-I and 13 under Phase II), with anaggregate installed capacity of 9,001 MW, wereidentified for Renovation, Modernisation andUprating (RM&U) work at an estimated cost of Rs.917.30 crore. The RM&U programme wasestimated to add 1,609 MW of capacity andenhance generation by 4,987 MU.
8.2.35. Of these 36 schemes, RM&U work hasso far been completed on 18 hydro schemes withan aggregate installed capacity of 4,860 MW at
an estimated cost of Rs. 554 crore and benefitsexpected to accrue are to the tune of 1,123MW/3,350 MU. Of the remaining 18 RM&Uschemes, five, with an aggregate installedcapacity of 369 MW, have been declared ‘closed’and work on four, with an aggregate installedcapacity of 380 MW, is yet to commence. Thebalance nine schemes, with an aggregateinstalled capacity of 3,392 MW, are under variousstages of implementation,
8.2.36 The status of hydro RM&U schemes ason 30 June 2001, is given in Table 8.2.5:
Transmission and Distribution Facilities
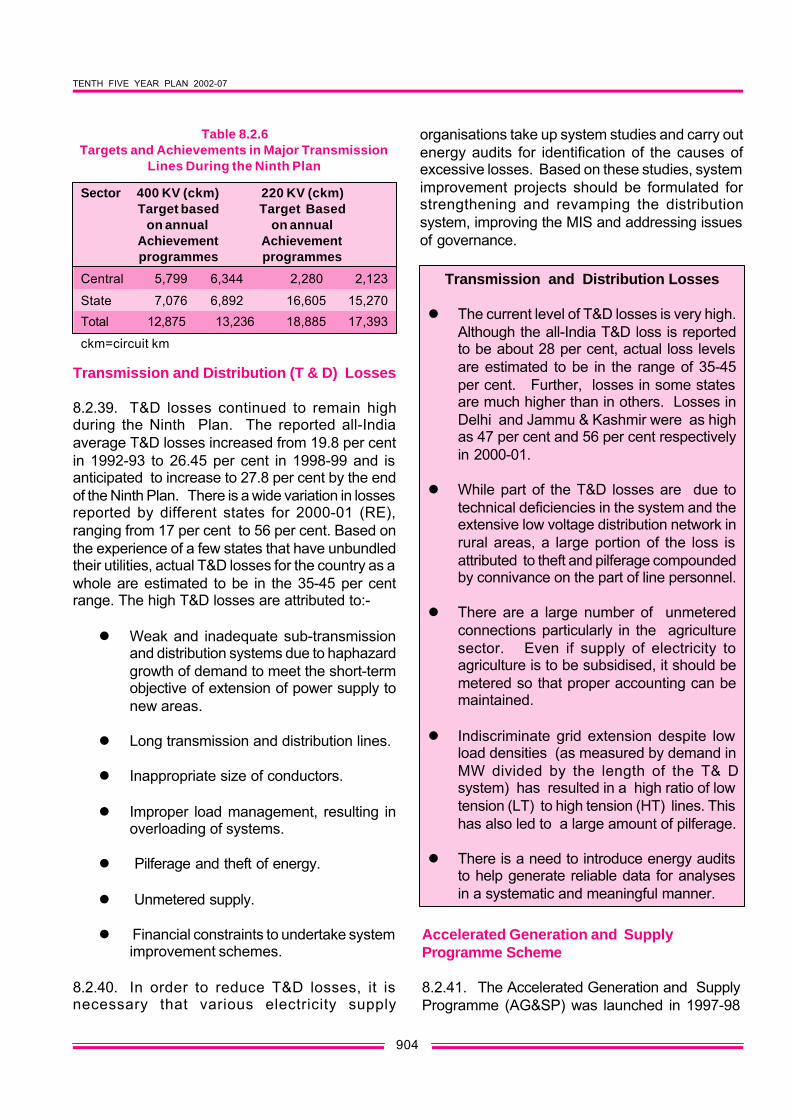
8.2.37. The major portion of the 400 KVtransmission network planned to be set up duringthe Ninth Plan was in the central sector, whilethat of the 220 KV network was in the state sector.Most of the targeted additions under thetransmission programme are likely to be achievedduring the Ninth Plan. Capacity addition wasadequate as neither the targeted generation northe projected demand was realised. The detailsof the targets and achievements during the NinthPlan in respect of major transmission projectsare given in Table –8.2.6:
8.2.38. By the end of Ninth Plan, the country islikely to have 52,482 ckm of 400 KV lines and99,178 ckm of 220 KV lines.
Table 8.2.5Status of Renovation, Modernisation & Uprating of Hydro Schemes
Details of schemes Nos. Installed Estimated cost Expected Benefitscapacity(MW) Rs. Crore. MW MU
Phase-I
Programmed 23 5,863.75 647.03 1,472.63 3,890.06
Completed 14 4,269.00 422.43 1,069.48 2,565.46
Phase–II
Programmed 13 3,137.60 270.27 136.10 1,096.50
Completed 4 591.40 131.43 53.90 784.50
Phase I &II
Programmed 36 9,001.35 917.30 1,608.73 4,986.56
Completed 18 4,860.40 553.86 1,123.38 3,349.96
TENTH FIVE YEAR PLAN 2002-07
904
Transmission and Distribution (T & D) Losses
8.2.39. T&D losses continued to remain highduring the Ninth Plan. The reported all-Indiaaverage T&D losses increased from 19.8 per centin 1992-93 to 26.45 per cent in 1998-99 and isanticipated to increase to 27.8 per cent by the endof the Ninth Plan. There is a wide variation in lossesreported by different states for 2000-01 (RE),ranging from 17 per cent to 56 per cent. Based onthe experience of a few states that have unbundledtheir utilities, actual T&D losses for the country as awhole are estimated to be in the 35-45 per centrange. The high T&D losses are attributed to:-
l Weak and inadequate sub-transmissionand distribution systems due to haphazardgrowth of demand to meet the short-termobjective of extension of power supply tonew areas.
l Long transmission and distribution lines.
l Inappropriate size of conductors.
l Improper load management, resulting inoverloading of systems.
l Pilferage and theft of energy.
l Unmetered supply.
l Financial constraints to undertake systemimprovement schemes.
8.2.40. In order to reduce T&D losses, it isnecessary that various electricity supply
organisations take up system studies and carry outenergy audits for identification of the causes ofexcessive losses. Based on these studies, systemimprovement projects should be formulated forstrengthening and revamping the distributionsystem, improving the MIS and addressing issuesof governance.
Transmission and Distribution Losses
l The current level of T&D losses is very high.Although the all-India T&D loss is reportedto be about 28 per cent, actual loss levelsare estimated to be in the range of 35-45per cent. Further, losses in some statesare much higher than in others. Losses inDelhi and Jammu & Kashmir were as highas 47 per cent and 56 per cent respectivelyin 2000-01.
l While part of the T&D losses are due totechnical deficiencies in the system and theextensive low voltage distribution network inrural areas, a large portion of the loss isattributed to theft and pilferage compoundedby connivance on the part of line personnel.
l There are a large number of unmeteredconnections particularly in the agriculturesector. Even if supply of electricity toagriculture is to be subsidised, it should bemetered so that proper accounting can bemaintained.
l Indiscriminate grid extension despite lowload densities (as measured by demand inMW divided by the length of the T& Dsystem) has resulted in a high ratio of lowtension (LT) to high tension (HT) lines. Thishas also led to a large amount of pilferage.
l There is a need to introduce energy auditsto help generate reliable data for analysesin a systematic and meaningful manner.
Table 8.2.6Targets and Achievements in Major Transmission
Lines During the Ninth Plan
Sector 400 KV (ckm) 220 KV (ckm)Target based Target Based
on annual on annualAchievement Achievementprogrammes programmes
Central 5,799 6,344 2,280 2,123
State 7,076 6,892 16,605 15,270
Total 12,875 13,236 18,885 17,393
ckm=circuit km
Accelerated Generation and SupplyProgramme Scheme
8.2.41. The Accelerated Generation and SupplyProgramme (AG&SP) was launched in 1997-98
POWER
905
initially for one year and was later extended up tothe end of Ninth Plan. The scheme covers thefollowing activities:
1. R&M and life extension/rehabilitation.
2. Ongoing generation projects.
3. Missing transmission links and systemimprovement.
4. Grant for studies.
8.2.42. The Ministry of Power provides a grantfrom its budget to fund an interest subsidy of 4per cent on normal lending rates of the PFC toSEBs/State Generation Corporations (SGCs). R&Mschemes costing less than Rs. 100 crores arecurrently also being financed under APDP. It isproposed that in the Tenth Plan, all R&M schemeswould be financed under AG&SP only and nofinancing would be made through APDP.
Programme for Central Assistance under APDP
8.2.43 Projects relating to the following areas arefinanced under the APDP, which was initiated in 2000-01 in order to give a fillip to power sector reforms:
i) R&M/life extension/uprating of old powerplants (thermal and hydel).
ii) Upgradation of the sub-transmission anddistribution network (below 33 KV or 66KV) including energy accounting andmetering.
8.2.44. One of the main strategies identified fordistribution reforms is the development ofdistribution plans/projects for all distribution circles.Sixty-three such circles have been identified initiallyin which 11 KV feeders will be taken as profitcentres. Improvement/strengthening of the sub-transmission and distribution network, 100 per centmetering, establishing of an MIS to improve billing,collection etc. will be taken up in the selected circles.It has been decided to utilise APDP funds todevelop the selected circles as centres ofexcellence that can be replicated by the states inthe later phase of distribution reforms.
8.2.45. Funds under APDP are released to stategovernments as additional Central Plan by theMinistry of Finance under advice from the Ministryof Power. The funding modality (a combination ofgrants and loans) is given in the Table – 8.2.7 :
8.2.46. An amount of Rs.1,000 crore andRs.1,500 crore were provided under APDP during2000-01 and 2001-02 respectively. An amountof Rs. 3,500 crore has been provided for theAnnual Plan 2002-03, which is the first year ofthe Tenth Plan.
8.2.47. There is a need to restructure theconcept of APDP from being merely aninvestment window to a mechanism forsupporting power sector reforms in the states,linked to the fulfilment of certain performancecriteria by way of benchmarks. This isnecessary to reduce the burden of transition andto ensure that the reform is sustainable andirreversible. The existing APDP may be revisedto provide enhanced investment to cover all thedistribution circles during the Tenth Plan andalso provide for transition finance based on thefinancial performance of SEBs/uti l i t ies.However, the funding and financing pattern forinvestment in distribution will be the same asAPDP. Transition finance may be based onactual cash loss reductions effected by theSEBs/utilities, net of tariff increases given bythe regulator, additional purchase of power andincrease in fuel costs. In order to avail oftransition assistance, states may have toconform to minimum eligibility conditions:
Table – 8.2.7Funding pattern under APDP schemes
S. Category % ofprojects/ % of projects/No. of states scheme cost scheme Cost
from APDP as from PFC/REC/Own/
Other SourcesGrant Loan
1 Special 90 10 -categorystates
2 Non-special 25 25 50category states
TENTH FIVE YEAR PLAN 2002-07
906
Ø The state should have set up a SERC.
Ø The SEB/utility should have filed its firsttariff petition before the SERC.
Ø The SEB/utility should have achieved aminimum prescribed percentage reductionin cash losses compared to the previousyear.
8.2.48. The modified APDP could be named asAccelerated Power Development and ReformProgramme (APDRP).
Financial performance of the SEBs
8.2.49 The financial health of the SEBs hasdeteriorated over the years mainly due to higherlevel of technical and commercial losses and
Table –8.2.8.Financial Performance of the State Power Sector
(ii) Additional revenuemobilisation from achieving
(a) 3 per cent ROR 4,959.00 27,216.62 30,280 29,403.65 26,226.42
(b) From introducing 50 paise/ 2,176.00 1,637.83 1,840 1,350.44 1,329.71unit from agriculture/irrigation
RE : Revised Estimates, AP : Annual Plan Projections, # In percent@ Commercial losses are different from uncovered subsidy because they include financial results of other activitiesundertaken by the SEBs.
Note:-(i) The information relating to the subsidy for agriculture, domestic and inter-state sales for 1999-2000, 2000-01 and 2001-
02 in respect of Orissa is not available, as the distribution is now with private companies. The information regardingcommercial losses pertains to GRIDCO only .
(ii) Information in case of Andhra Pradesh, Haryana, Rajasthan, Uttar Pradesh and Karnataka relates to T&D companies setup after the reforms. In the case of other states, the information pertains to SEBs.
(iii) The estimates do not include information relating to Uttaranchal as these have not been furnished by the state.
POWER
907
subsidised sale of electricity to agricultural anddomestic consumers. Table 8.2.8 gives thefinancial performance of the state power sector.The net subsidy of Rs. 5,404 crore onagriculture and domestic sectors in 1991-92 was46 per cent of Central Plan assistance flowing tostates/Union Territories in that year. The samehas increased substantially to Rs. 25,607 crorein 2000-01 and is likely to be 69 per cent of thefunds flowing from Central Plan assistance.Further, the subsidy on account of the sale ofelectricity to the agricultural sector has comedown from Rs. 29,461 crore in 2001-02 annualplan (AP) and is expected to come down to Rs.26,959.30 crore for 2002-03 (AP). This may bepartly due to the reform and restructuring processinitiated by some of the states.
8.2.50. The March 2001 conference of ChiefMinisters/Power Ministers noted that the largeamount of dues owed by the SEBs to centralpublic sector undertakings (CPSUs) was a majorimpediment to power sector reforms. Theconference resolved that an expert group shouldbe set up to recommend a one time settlementof the past dues of SEBs to CPSUs and dues ofthe SEBs from CPSUs. The outstanding duespayable by SEBs to CPSUs as on September,2001 was Rs. 41,852.63 crore including interestliability of about Rs. 16,000 crore.
8.2.51 The recommendations of the expertgroup headed by Shri. Montek Singh Ahluwaliafor securitisation of dues through the issue oftax-free bonds by the respective stategovernments have been accepted by theGovernment with certain modifications. Underthe arrangement, 60 per cent of the surchargewould be waived while securitising the dues. Butthe SEBs would have to pay the current dues infuture, failing which certain steps like gradedreduction in the supply of power from centralpower stations and in coal supplies would betaken. The SEBs should accept reform-basedperformance milestones such as setting up of
SERCs, metering of distribution feeders andimprovement in revenue realisation. Themilestones should be specified in the MoU to besigned with the Ministry of Power.
Plan expenditure during the Ninth Plan
8.2.52. An analysis of the Plan expenditure on thebasis of actuals for 1997-98, 1998-99 and 1999-2000 (for central/state and Union Territories) andthe actual/RE (2000-01) for central/state andrevised estimates for 2001-02 for the central andstate sector reveal the following:
Central Sector
8.2.53. The actual expenditure on power by theCentral sector during the first four years of theNinth Plan (1997-2001) and approved provisionfor 2001-02 accounted only for 83.30 per cent ofthe approved Ninth Plan outlay at current prices.Similarly, at constant prices, it accounts for only69.4 per cent of the Plan outlay. The estimateddomestic budgetary support (gross budgetarysupport minus external aid) during the Ninth Planwas Rs.14,381 crore which works out to about98 per cent (at current price) of the approvedamount of Rs. 14,380 crore. At constant prices,it works out to Rs.11,662 crore, at 81 per centof the approved provision. The major shortfall inthe central sector was due to the non-mobilisation of resources through internalresources and bonds and because four gas-based extension projects of the NTPC were nottaken up.
State Sector
8.2.54. The Plan expenditure for the state sectorduring the first three years of the Ninth Plan was53.4 per cent of outlay at current prices. The majorshortfalls were in the states of Assam, Bihar,Haryana, Meghalaya, Orissa and Uttar Pradesh.The areas most affected by the shortfalls weretransmission and distribution.
TENTH FIVE YEAR PLAN 2002-07
908
SUCCESS STORIES OF THE POWERSECTOR
Ø The Plant Load Factor (PLF) of thermalstations improved from 63.0 per cent at thebeginning of the Ninth Plan to 69.90 per centat the end of the Plan period. The PLF ofthe nuclear power stations improved from55.90 per cent to 79.4 per cent over thesame period.
Ø Thirteen States have constituted andoperationalised State Electricity RegulatoryCommissions (SERC) while six others havenotified the constitution of the SERCs.
Ø The SERCs of Orissa, Andhra Pradesh,Uttar Pradesh, Maharashtra, Gujarat,Karnataka, Rajasthan, Delhi, MadhyaPradesh, Himachal Pradesh and WestBengal have issued tariff orders.
Ø Seven States have unbundled/corporatisedtheir SEBs into separate companies forgeneration, transmission and distribution.Of these, Orissa and Delhi have privatiseddistribution.
Ø A three-stage clearance procedure has beenintroduced for central sector hydro electricprojects to minimise time and cost overruns.
Ø The Accelerated Generation and SupplyProgramme (AG&SP) initiated during NinthPlan provided incentives in the form ofinterest subsidy to SEBs/states and centralpower utilities. This has helped in carryingout power development activities particularlyin the state sector. The capacity addition inthe state sector achieved was around 88 percent of the target, in which the contributionof AG&SP was around 55 per cent. Thescheme has also given boost to therenovation and modernisation (R&M)programme during the Ninth Plan period.The additional generation due to theincentives given through AG&SP isestimated to be about 10,000 MU/annum.
Ø The Accelerated Power DevelopmentProgramme (APDP) scheme was initiatedin 2000-01 with the objective of giving a fillip
to reforms in the distribution segment. Thescheme is now proposed to be modified asthe Accelerated Power Development andReform Programme (APDRP), which is acritical investment for providing distributionreforms. Under the modified scheme, therewould be an element of incentive linked toachievement of certain reform-basedparameters besides provision for investmentin the distribution sector.
Ø In order to liquidate the outstanding dues ofCPSUs, a mechanism was evolved for onetime settlement of these dues payable bystates.
Ø In the programme of electrification of remotevillages, there has been success inelectrifying the Sagar Island situated intheSundarban region of West Bengalthrough solar energy. About 1,400 familieson this island are benefited from thecommunity and individual solar photovoltaicsystems. The community is totally involvedin the operation and revenue collection inthis programme.
APPROACH TO THE TENTH PLAN
Capacity Additions Required During the TenthPlan
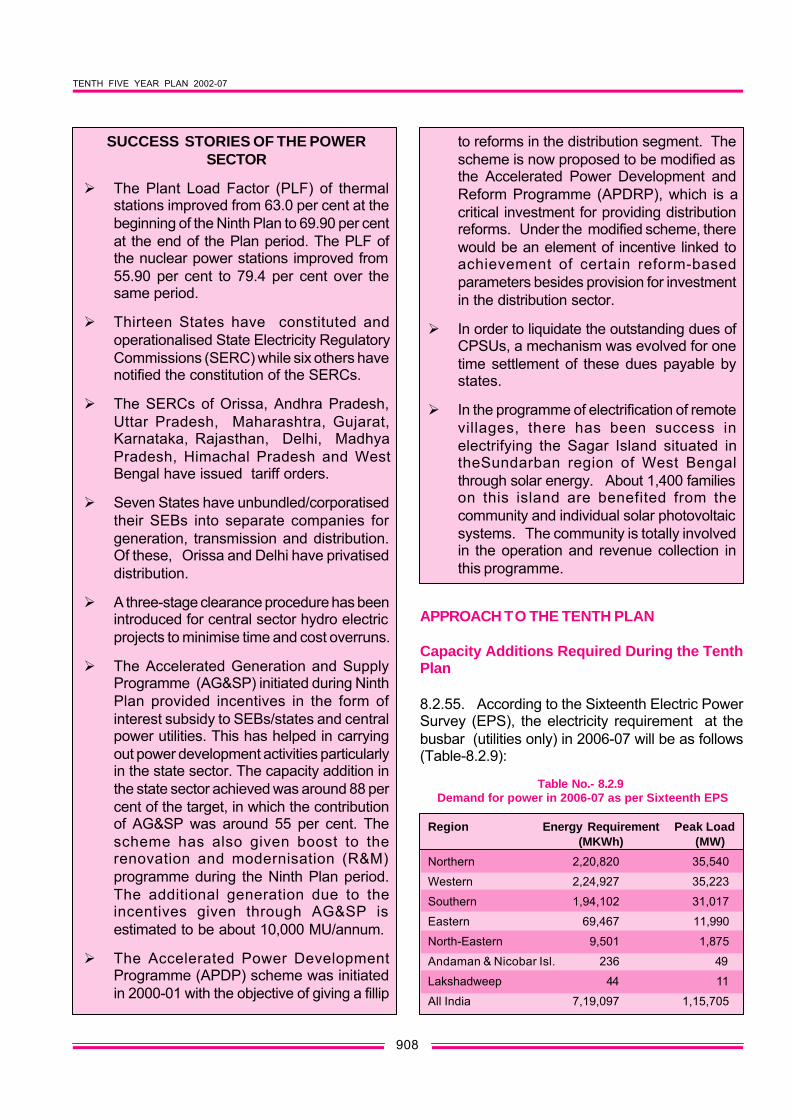
8.2.55. According to the Sixteenth Electric PowerSurvey (EPS), the electricity requirement at thebusbar (utilities only) in 2006-07 will be as follows(Table-8.2.9):
Table No.- 8.2.9 Demand for power in 2006-07 as per Sixteenth EPS
Region Energy Requirement Peak Load(MKWh) (MW)
Northern 2,20,820 35,540
Western 2,24,927 35,223
Southern 1,94,102 31,017
Eastern 69,467 11,990
North-Eastern 9,501 1,875
Andaman & Nicobar Isl. 236 49
Lakshadweep 44 11
All India 7,19,097 1,15,705
POWER
909
added by the private sector (Table 8.2.10 A).Thus, the public sector will continue to play adominant role during the Tenth Plan whileprogress along the reform path helps clear theroadblock for greater private participation in themedium to long term.
8.2.59. A major portion of this incrementalcapacity can materialise only during the lateryears of the Tenth Plan. This implies thelikelihood of power shortages increasing beyondcurrent levels during the first three years of theTenth Plan. To overcome this, at least partially,it is imperative that all-out efforts are made totake up R&M work at existing plants aggressivelyand operate the power system efficiently.
8.2.60. The capacity addition will be contingentupon fuel linkages being firmed up and earlystart of work on new projects. For the newprojects, particularly in the central sector, it isessential to simplify and streamline proceduresfor input linkages/techno-economic clearance/investment clearance. Based on this, thecumulative generation capacity in the country bythe end of 2006-07 will be as follows (Table8.2.11):
8.2.56. The Tenth Plan Working Group Reporton Power has envisaged a capacity additionrequirement of 46,939 MW during the Planperiod, with 24,405 MW coming from the centralsector, 12,033 MW from the state sector and10,501 MW from the private sector.
8.2.57. However, keeping in view the status ofthe ongoing, sanctioned and new projects in thepipeline, the Planning Commission felt that atarget capacity addition of 41,110 MW — 18,659MW from ongoing projects, 9,193 MW fromprojects cleared by the CEA and 13,258 MW fromnew schemes — would be more realistic. Evenunder this lower estimate for capacity addition,only 27,852 MW appears to be firmed up so far.Vigorous and urgent steps have to be taken forthe balance capacity addition programme. Asummary on the feasible capacity addition of41,110 MW is given in Table 8.2.10:
8.2.58. Out of the total addition of 41,110 MWenvisaged for the Tenth Plan period, 22,832MW (55.6 per cent) is accounted for by thecentral sector and 11,157 MW (27.1 per cent) isaccounted for by the state sector. The balanceof 7,121 MW (17.3 per cent) is expected to be
Table - 8.2.10Benefits from Sanctioned/CEA-Cleared and New Schemes During the Tenth Plan (MW)
Source Ongoing/ CEA- New Totalsanctioned cleared schemes
8.2.61 The energy and peaking shortages at theend of the Ninth Plan are 7.5 per cent and 12.6 percent respectively. The Working Group on Powerestimated that if capacity addition targets are met,the energy and peaking shortages would be 11.6per cent and 9.5 per cent respectively by the endof the Tenth Plan. Lower capacity addition targetsproposed above will raise these projected deficitsunless there are significant improvements inmanagement and plant operations.
Hydro Power Development
8.2.62. The share of hydel capacity in the totalgenerating capacity of the country has declinedfrom 34 per cent at the end of the Sixth Plan to 25per cent at the end of the Ninth Plan. The share islikely to decline even further unless suitablecorrective measures are initiated immediately.Hydel power projects, with storage facilities providepeak time support to the power system. Inadequatehydel support in some regions is adversely affectingthe performance of the thermal power plants. In thewestern and eastern regions, peaking power isbeing provided by thermal plants. This is a costlyand inefficient use of thermal capacity. It is proposedto add 14,393 MW capacity from hydro in the totalcapacity addition of 41,110 MW during the TenthPlan period.
8.2.63. Geological uncertainty, contractmanagement, resettlement & rehabilitation, delayin land acquisition and infrastructure developmenthave been the main reasons for time and costoverruns in hydro projects. In order to avoid delaysin project implementation, the following steps need
to be taken before the zero date of the projectimplementation.
1. Bankable detailed project report (DPR),based on a detailed survey, should beprepared to avoid geological uncertainty.
2. Contract monitoring, as distinct fromproject monitoring, should be emphasised.
3. Land acquisition and infrastructuredevelopment should be settled andcompleted before the start of the project.
8.2.64. Further, the following steps need to betaken in order to accelerate the pace of hydrodevelopment:
Ø Although the preliminary ranking study ofthe remaining hydro potential sites of allthe basins in the country has beencompleted by the CEA, detailed rankingstudy and preparation of detailed feasibilityreport based on economic viability needsto be done.
Ø Adopt a national rehabilitation policy(supported by appropriate legislativechanges and the apex court directives) andimplement the policy uniformly.
Ø Streamline clearances for pursuing priorityprojects.
Ø Simplify approval procedures.
Ø Facilitate the early financial closure ofprojects through a concerted approach
Table-8.2.11Generating Capacity Anticipated at the End of the Tenth Plan (in MW)
Hydro Thermal Nuclear Total
Installed Capacity as 26,261.22 74,428.82 2,720.00 1,03,410.04*on 31.3.2002
Addition 14,393.20 25,416.64 1300.00 41,109.84During Tenth Plan
Total Capacity 40,654.42 99,845.46 4,020.00 1,44,519.88on 31.3.2007
* excludes the capacity of 1,507.46 MW from wind
POWER
911
(comprising centre, states, Indian financialinstitutions, private sector promoters)towards multilateral agencies and otherinternational funding sources.
Nuclear Power
8.2.65. Atomic energy is an important source ofelectric power which has environmental advantagesand is also likely to be economical in the longerrun. At present, nuclear energy accounts for only2.4 per cent of total primary energy consumption,against the global average of 13 per cent. This isfar too low.
8.2.66. Nuclear power plants have shownprogressive improvement in generatingperformance. The PLF of NPCIL stations hasincreased from 60 per cent in 1995-96 to 82 percent in 2000-01. During the Ninth Plan, NPCILcompleted the refurbishment and upgradation ofRajasthan Atomic Power Station(RAPS)-2(200MWe), and commissioned Kaiga 1 & 2(2x220MWe) and RAPS 3 and 4 (2x220 MWe).It is proposed to add 1,300 MWe of new capacityduring the Tenth Plan period and 5,915 MWeduring the Eleventh Plan so as to achieve about10,000 MWe by 2011-12. The NPCIL hasdemonstrated the capability of setting up andoperating nuclear energy power plants with highlevels of technical efficiency and safety. It isdesirable to plan for a significant expansion innuclear power generation capacity. An expandedprogramme would also make it possible to reducethe costs of construction.
8.2.67. In the context of moderate uranium andvast thorium resources in India, a three-stagenuclear power programme is envisaged. Thisprogramme consists of setting up of PressurisedHeavy Water Reactors (PHWRs) in the first stage,Fast Breeder Reactors (FBRs) in the second stageand reactors based on the Uranium 233-Thorium232 cycle in the third stage. It is also envisagedthat in the first stage of the programme, capacityaddition will be supplemented by electricitygeneration through Light Water Reactors (LWRs)initially through imports of technology with the long-term objective of indigenisation. PHWR technologywas selected for the first stage, as these reactors
are efficient users of natural uranium for yieldingplutonium fuel required for the second stage FBRprogramme. The FBRs will be fuelled by plutoniumand will also recycle uranium for breeding moreplutonium fuel for electricity generation. Thoriumas blanket material in FBRs will produce Uranium233 to start the third stage. An Advanced HeavyWater Reactor (AHWRs) is being developed by theBhabha Atomic Research Centre (BARC) , Mumbai,for demonstration of technology to utilise thoriumfor electricity generation. AHWR will be a forerunnerof reactors to be set up under the third stage of thenuclear power programme.
8.2.68. The first stage programme of PHWR hasprogressed well and the technology has reached astate of maturity. A beginning has been made inthe introduction of LWRs with the inter-governmental agreement between India and theRussian Federation for co-operation in setting upof 2x1,000 MWe LWRs at Kudankulam, Tamil Nadu.A 40 MWe Fast Breeder Test Reactor (FBTR) hasbeen set up at Kalpakkam to gain experience inthe technology. This has been followed by progressin the development of technology for the firstPrototype Fast Breeder Reactor (PFBR) of 500MWe capacity, which has reached an advancedstage. Pre-project activities for commencingconstruction of the PFBR are in progress as isresearch and development on the utilisation ofthorium.
8.2.69. Aggressive nuclear power developmentis essential in the context of energy security,environmental advantages and changingperceptions about nuclear power in developedcountries such as the United States and theUnited Kingdom. Improvements in nucleartechnology are likely to make nuclear power moreeconomical and total life cycle costs morecompetitive in comparison to other fuels.Therefore, India needs to:
Ø Aggressively build capabilities and capacityin nuclear power to progressively raise itsshare in India’s fuel mix.
Ø Actively promote research anddevelopment on FBRs and thorium-basedtechnologies.
TENTH FIVE YEAR PLAN 2002-07
912
Ø The reactor/dome in nuclear power plantfacilities is highly technical and sensitive.This should be implemented by NPCIL/Department of Atomic Energy. Othercomponents of nuclear power plant arealike turbo generator (TG) facilities etc.should be permitted for private sectorparticipation. The Department of AtomicEnergy should decide on the componentsof the nuclear power plant which could beentrusted to the private sector.
Ø Encourage innovative financingmechanisms (infrastructure debt fromfinancial institutions/banks, supplier credit/equity, long term bonds, private sectorequity in non-nuclear island).
8.2.70. The initial response of domestic andforeign investors to the policy of privateparticipation in the power sector had beenencouraging. However, many projects haveencountered unforeseen delays in thefinalisation of power purchase agreements,guarantees and counter-guarantees,environmental clearances, matching transmissionnetworks and legally enforceable contracts forfuel supplies One of the most importantimpediments to private participation was thebankruptcy of the monopoly purchaser – theSEBs. That necessitated complex paymentsecurity mechanisms for achieving financialclosure. Further, the high tariff of power fromsome of the commissioned independent powerprojects (IPPs) due to factors such as high costof liquid fuels, risk factors involved and unrealisticforecast for future growth of demand etc. haveprevented full utilisation of available capacities.With the power sector reforms already set inmotion, these problems are expected to be sortedout in due course.
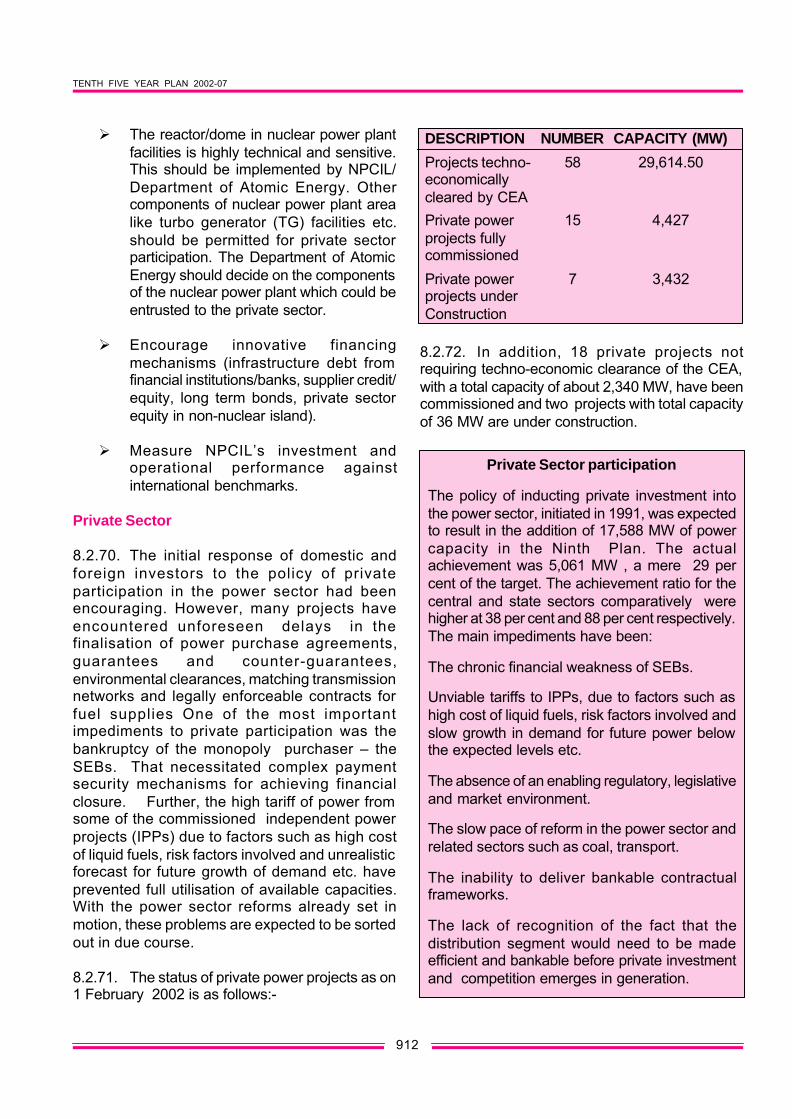
8.2.71. The status of private power projects as on1 February 2002 is as follows:-
8.2.72. In addition, 18 private projects notrequiring techno-economic clearance of the CEA,with a total capacity of about 2,340 MW, have beencommissioned and two projects with total capacityof 36 MW are under construction.
DESCRIPTION NUMBER CAPACITY (MW)
Projects techno- 58 29,614.50economicallycleared by CEAPrivate power 15 4,427projects fullycommissioned
Private power 7 3,432projects underConstruction
Private Sector participation
The policy of inducting private investment intothe power sector, initiated in 1991, was expectedto result in the addition of 17,588 MW of powercapacity in the Ninth Plan. The actualachievement was 5,061 MW , a mere 29 percent of the target. The achievement ratio for thecentral and state sectors comparatively werehigher at 38 per cent and 88 per cent respectively.The main impediments have been:
The chronic financial weakness of SEBs.
Unviable tariffs to IPPs, due to factors such ashigh cost of liquid fuels, risk factors involved andslow growth in demand for future power belowthe expected levels etc.
The absence of an enabling regulatory, legislativeand market environment.
The slow pace of reform in the power sector andrelated sectors such as coal, transport.
The inability to deliver bankable contractualframeworks.
The lack of recognition of the fact that thedistribution segment would need to be madeefficient and bankable before private investmentand competition emerges in generation.
POWER
913
Formation of National Grid
8.2.73. The National Powergrid will comprise atransmission system associated with the centralgenerating projects and inter-regional lines. It isexpected that the first phase of the NationalPowergrid will be completed with a 500 MW HighVoltage Direct Current (HVDC) TransmissionSystem back-to-back at Sasaram in Bihar comingup by December 2002 connecting the eastern andnorthern region. This will enhance the cumulativeinter-regional power transfer capacity to a level ofabout 4,850 MW.
8.2.74. It is proposed that in the subsequentphase, a strong synchronous National Powergridwould be established, including schemes toevacuate the power from major generatingresources, covering hydro projects in the north-eastern region and large-sized thermal powerplants in Bihar, Orissa and Madhya Pradesh. Thetransmission scheme for the ultimate NationalPowergrid would involve the development of a highcapacity transmission corridor in the Chicken Neckarea in the northeast and the establishment of aring of 765 KV lines interconnecting the eastern,western and northern regions. With the completionof these links, the cumulative inter-regional powertransfer capacity would increase to a level of about30,000 MW by 2012.
Captive Power Generation
8.2.75. The industrial sector is the largestconsumer of electricity. Besides purchasing powerfrom the utilities, a number of industries, viz.aluminium, cement, fertiliser, iron, steel, paper,sugar etc. have their own captive power plants eitherto supplement the electricity supply from the utilitiesor for generating electricity as a by-product throughco-generation. Captive power plants are being setup by industries to meet their own powerrequirements to enable them to tide over problemsdue to power shortages and poor quality of supply.The Electricity Bill, 2001 proposes to free captivegeneration and enable captive generators to selldirectly to other consumers by wheeling powerthrough the grid under an open access regime.However, the Tenth Plan capacity addition has beenfinalised based on the demand as per the Sixteenth
Electric Power Survey that excludes the demandmet by captive power plants.
8.2.76. In accordance with the guidelines issuedby the Ministry of Power, the following categorieswould be eligible to install captive power plants:
(a) A consumer of electricity.
(b) A group comprising more than oneconsumer as a joint venture.
(c) An actual user of power but not aconsumer.
(d) A group of actual users of power, but notconsumers, as a joint venture.
(e) A group comprising both consumers andactual users of power as a joint venturebut excluding ‘Generating Company’ asdefined under Section 2(4A) of theElectricity (Supply) Act, 1948.
(f) If the captive plant falls under the categoryof hydro or co-generation plant, such plantmay be permitted, irrespective of its sizeand the power supply position in the state.
(g) If the captive power plant is based on coalor liquid fuel or gas and if the state is deficitin power supply, the installation of the plantcould normally be allowed and the plantcan be permitted to have a capacity up to200 per cent of the requirement of the hostindustry.
(h) If the captive power plant is based on coal,liquid fuel or gas and the state is surplusin power, the installation of such captiveplants can still be considered in caseswhere the state/SEB cannot guaranteeuninterrupted supply or stipulated qualityof supply (within prescribed voltage andfrequency variations) required by theindustry or a particular process. Further,captive generation may also be permittedif it is found, after a review of costs andtariffs, to be more economical than gridsupply.
TENTH FIVE YEAR PLAN 2002-07
914
(i) Banking facilities may also be provided tothe captive plants so that availablecapacities are utilised to the extent possibleand when required. The rates for bankingmay be determined on mutually agreedterms.
(j) Units in Special Economic Zones (SEZ)and industrial estates may be allowed toset up captive power plants liberally.
Rural Electrification
8.2.77. The rural electrification programme is oneof the important components in rural developmentand as important as rural drinking water supply,health, nutrition, primary education, shelter and ruralconnectivity. The availability of power in rural areaswill lead to economic development and its attendantspin-off benefits like food security, better health,literacy, etc. With this in view, the Government hasbeen focussing on village electrification since thebeginning of the planning process. While this hasresulted in the electrification of around 86 per centof the country’s villages, the use of electricity invillages for productive and subsistence needs is stillvery limited. About 70 per cent of the ruralhouseholds are yet to get electric connections andpower-based economic activities in the electrifiedvillages are minimal. The actual benefits of theinvestments made in the rural electrificationprogramme can only be realised if the people arein a position to use electricity for their day-to-dayactivities as well as for industrial and commercialactivity. Therefore, the second phase of the ruralelectrification programme, apart from seeking 100per cent electrification, must also ensure morewidespread use of electricity by the rural people ina time-bound manner.
8.2.78. The existing definition of an electrifiedvillage has been found to be inadequate as it doesnot meet the requirements of the rural people. Theexisting definition states that ‘A village will bedeemed to be electrified if electricity is used in theinhabited locality within the revenue boundary ofthe village for any purpose whatsoever.’ There isneed to change this definition so as to declare avillage as electrified only if a minimum number ofhouseholds in that village are provided with
electricity connections. According to the 1991Census, there are 5,87,000 villages of which5,00,000 (86 per cent) are declared to be electrifiedon the basis of the existing definition. Further,available data shows that only 31 per cent of therural households are electrified. Finally, against thetotal estimated potential of 19.5 million electricpumpsets for irrigation, only 12 million pumpsetshave been energised. The expansion of theprogramme of energising pumpsets needs to takeinto account issues like energy efficiency, waterconservation, watershed management, rain waterharvesting and other matters related to the optimumuse of ground water and the danger of overexploiting this scarce resource.
8.2.79. Around 80,000 villages in the country areyet to be electrified even on the basis of the currentdefinition of village electrification. Thirteen stateshave declared 100 per cent electrification of theirvillages. The villages yet to be electrified are mostlyin Assam, Arunachal Pradesh, Bihar, Jharkhand,Madhya Pradesh, Meghalaya, Orissa, Rajasthan,Uttar Pradesh, Uttaranchal and West Bengal. Ofthese 80,000 villages, it may be feasible to electrifyonly around 62,000 through the conventional gridexpansion. The balance 18,000 villages are locatedin remote areas, hilly terrains, islands, deserts etc.and are also thinly populated. Such villages canbe electrified more economically throughdecentralised and non-conventional energy sourceslike solar, wind, small hydro and biomass.
8.2.80. The strategy and time-frame for ruralelectrification will be as follows:
l The Tenth Plan proposes to cover all62,000 villages that can be electrifiedthrough grid extension. The balance18,000 remote villages are to be electrifiedby 2011-12 through the use of non-conventional technologies. A survey toidentify these villages is required.
l In order to facilitate the flow of funds, theRural Electrification Programme wasincluded as a component of the PMGY in2001-02. Special category states areeligible to receive 90 per cent of the fundsas grant and 10 per cent as loan. For other
POWER
915
states, the funds will be made available ina grant-loan ratio of 30:70.
l In addition, the funds available underMinimum Need Programme for RuralElectrification will be pooled to meet theobjective of 100 per cent electrification.
l The funds available under Member ofParliament Local Area DevelopmentScheme (MPLADS) and Jawahar GramSiddhi Yojana (JGSY) should also beutilised for supplementing the funding ofvillage electrification.
l Involvement of MPs through district-levelcommittees in the selection and monitoringof village electrification may be mademandatory. The states would also be welladvised to try and persuade MPs to providefunds under the MPLAD for extendingvillage electrification. They could considerevolving arrangements where the provisionof, say, 25 to 50 per cent of the cost ofelectrification of an area could ensureautomatic provision of the remaining fundsunder PMGY.
l SEBs may receive an interest subsidy ondebt raised for rural electrification throughthe proposed Accelerated RuralElectrification Programme. Interest subsidywould be provided for the loans to be takenby the state governments for theelectrification of unelectrified villagesincluding dalit bastis. Rural electrificationcould be done through conventional as wellas non-conventional sources of energy.
l A suitable mechanism to disburse fundsdirectly from the central government tostates may be followed for which the stateswill be required to maintain a separateaccount so as to ensure that the fundsare not diverted for purposes other thanrural electrification.
l Given the positive impact of thisprogramme on poverty alleviation it is alegitimate claimant for soft International
Development Agency (IDA) funding. Thisshould be pursued through the Departmentof Economic Affairs which may indicate tothe World Bank the high priority that theGovernment gives to this programme.
l Village electrification would also include theelectrification of dalit/tribal bastis, whereverapplicable.
l The Kutir Jyoti programme to extend singlepoint light connections to rural householdsbelow the poverty line (BPL) will berevamped so that 100 per cent coverageof such households will be achieved by2012. The norms of expenditure for ruralBPL households has already beenenhanced from the present Rs. 1,000 toRs. 1,800 per household in specialcategory states and Rs. 1,500 in otherstates.
l The Rural Electrification Corporation(REC) will continue to carry out systemimprovement and load intensificationactivities in electrified villages. It will financethese activities through the RuralInfrastructure Development Fund (RIDF)and issue of bonds under Section 54 ECof Income Tax Act that provides taxexemption on capital gains.
l The proposals of the states for ruralelectrification will be scrutinised andappraised by the REC and the presentarrangement of monitoring by the REC andthe CEA will be continued with the Ministryof Power acting as the central nodalministry.
l The participation of decentralised powerproducers will be encouraged specially forelectrification of remote villages. Village-level organisations like PRIs, ruralcooperatives and NGOs will play a crucialrole in the rural electrification programme.Community participation is essential for thesuccess of the programme. The conceptof barefoot solar engineers may beadopted.
TENTH FIVE YEAR PLAN 2002-07
916
l States which are to electrify the left-outvillages are required to finalise a year-wise action plan for completing theelectrification of all villages to beconnected through grid during the TenthPlan. Local elected representativesshould be involved by the implementingagencies both at the planning andimplementation stage, which wouldensure proper monitoring of theprogramme.
l Electrification of remote villages will bedone through the Ministry of Non-Conventional Energy Sources inassociation with the Indian RenewableEnergy Development Agency (IREDA),the financial institution under theMinistry.
l The Electricity Bill, 2001 contains anenabling provision in regard todecentralised generation so thatcooperatives/PRIs and NGOs can also bidfor and supply electricity to dispersedcommunities.
Environmental Management / SustainablePower Development
8.2.81. The utilisation rate of fly ash in India is ofthe order of 2 per cent as compared to 80 per centin Germany followed by 20 per cent in theNetherlands. The poor rate of utilisation is attributedto the non- availability of proper machinery,ignorance regarding the potential of the use of flyash in various applications and lack of clear policiesto promote fly ash utilisation, among other things.The following steps are necessary to promote theuse of fly ash:
1. Private entrepreneurs should beencouraged to set up facilities to utilise flyash in building materials such as bricks,cement etc. To this end, state governmentsmay exempt the end products of ash fromsales tax, on the lines of the excise dutyexemption given by the central governmentto products having a minimum 25 per centash content.
2. Financial institutions may extend loans ona priority basis for the manufacture of ash-based industrial products.
3. In order to promote manufacture of fly-ash based Portland Pozzland Cement(FAPPC) government departments like theCPWD, DDA and power utilities should beadvised to use FAPPC for a majority ofapplications.
4. All new thermal power stations should beadvised to earmark land in the planningstage itself for ash-based industries.
5. Stowing of underground mines using flyash in place of river sand is to beconsidered in all coal projects.
8.2.82. Concerns relating to pollution and thedisposal of the large amount of ash from coal-basedpower stations, which are the mainstay of India’spower generation, are being addressed throughstrategies to promote environmentally sustainablepower development. In order to undertake fruitfulchannelising of investment for afforestation works,the project authority should actively involve the stategovernment and set up a specific cell with a forestofficer on deputation, if need be, to monitor theimplementation of afforestation work.
Energy Efficiency/Conservation
8.2.83. Energy efficiency and energy conservationinvolve all the sectors of the economy. Althoughenergy efficiency and energy conservation havebeen discussed for nearly ten years now, the effortson the ground have been fragmented and half-hearted. There has also been a lack of adequatefocus on the institutional arrangements which willdevise suitable incentives and disincentivesappropriate to each sector, backed by adequatestatutory power of enforcement.
8.2.84. During the Ninth Plan, it was realised thatit is necessary to have an Energy Conservation Act.Accordingly, the Government has enacted theEnergy Conservation Act, 2001 to meet the legalrequirement needed to enforce energy efficiencyand conservation measures. The Act provides for:
POWER
917
l The establishment of the Bureau ofEnergy Efficiency (BEE) in place of theexisting Energy Management Centre(EMC).
l Declaring a user or class of users ofenergy as a designated consumer.
l Laying down minimum energyconsumption standards and labelling foridentified appliances/equipments andnorms for industrial processes for energy-intensive industries.
l Formulation of energy consumption codes.
l Establishment of an Energy ConservationFund both at the central and state levels.
l Penalties and adjudication. No penaltieswould be effective during the first fiveyears as the focus during this periodwould be on promotional activities andcreating the infrastructure forimplementing the Act.
l The BEE would facilitate the evolution of aself-regulatory system and organisationsthat will regulate on their own becausesaving energy also makes goodcommercial sense.
8.2.85. The central government has establishedthe BEE with effect from 1 March 2002. Further,the provisions of Section 1 to 29 and Sections 46 to62 of the Energy Conservation Act relating to thishave come into force from the same date.
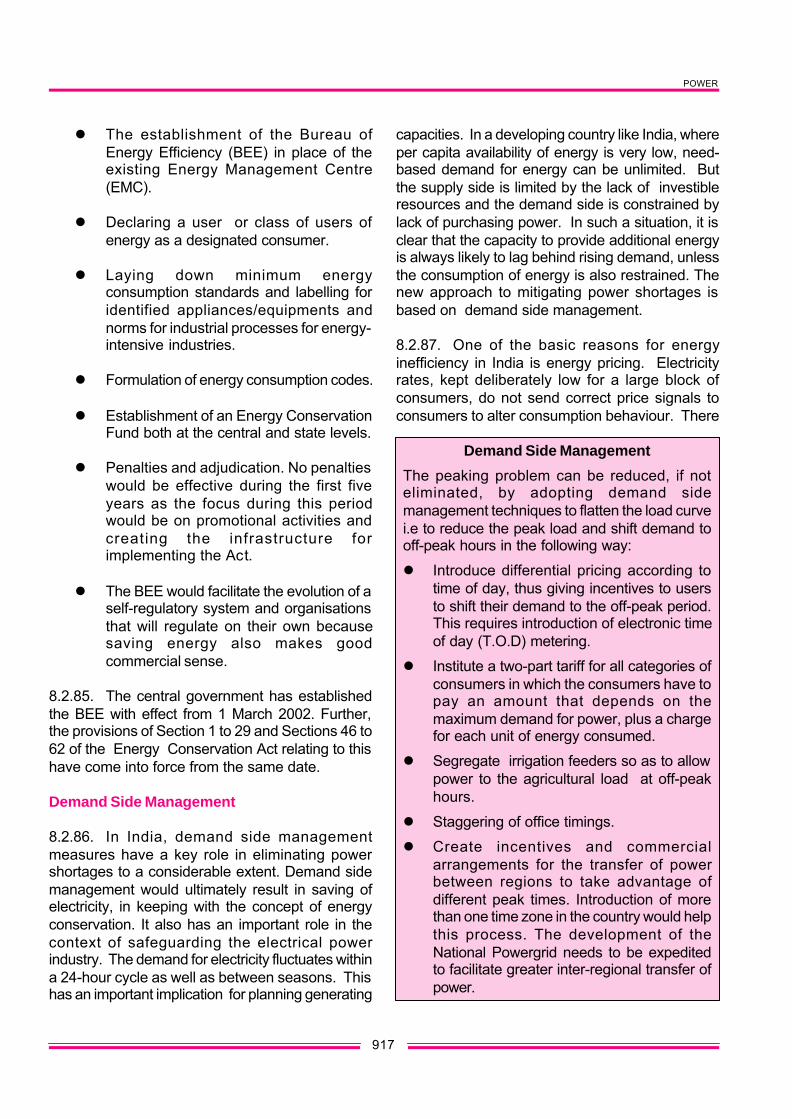
Demand Side Management
8.2.86. In India, demand side managementmeasures have a key role in eliminating powershortages to a considerable extent. Demand sidemanagement would ultimately result in saving ofelectricity, in keeping with the concept of energyconservation. It also has an important role in thecontext of safeguarding the electrical powerindustry. The demand for electricity fluctuates withina 24-hour cycle as well as between seasons. Thishas an important implication for planning generating
capacities. In a developing country like India, whereper capita availability of energy is very low, need-based demand for energy can be unlimited. Butthe supply side is limited by the lack of investibleresources and the demand side is constrained bylack of purchasing power. In such a situation, it isclear that the capacity to provide additional energyis always likely to lag behind rising demand, unlessthe consumption of energy is also restrained. Thenew approach to mitigating power shortages isbased on demand side management.
8.2.87. One of the basic reasons for energyinefficiency in India is energy pricing. Electricityrates, kept deliberately low for a large block ofconsumers, do not send correct price signals toconsumers to alter consumption behaviour. There
Demand Side Management
The peaking problem can be reduced, if noteliminated, by adopting demand sidemanagement techniques to flatten the load curvei.e to reduce the peak load and shift demand tooff-peak hours in the following way:
l Introduce differential pricing according totime of day, thus giving incentives to usersto shift their demand to the off-peak period.This requires introduction of electronic timeof day (T.O.D) metering.
l Institute a two-part tariff for all categories ofconsumers in which the consumers have topay an amount that depends on themaximum demand for power, plus a chargefor each unit of energy consumed.
l Segregate irrigation feeders so as to allowpower to the agricultural load at off-peakhours.
l Staggering of office timings.
l Create incentives and commercialarrangements for the transfer of powerbetween regions to take advantage ofdifferent peak times. Introduction of morethan one time zone in the country would helpthis process. The development of theNational Powergrid needs to be expeditedto facilitate greater inter-regional transfer ofpower.
TENTH FIVE YEAR PLAN 2002-07
918
is, therefore, an urgent need to look into the issueof economic pricing that delivers the desiredbehaviour. Innovative pricing options which haveproved successful in managing electricity demandin several developed and developing countries, suchas time-of-day tariffs, interruptible tariffs andseasonal tariffs, should be taken up by the utilities.
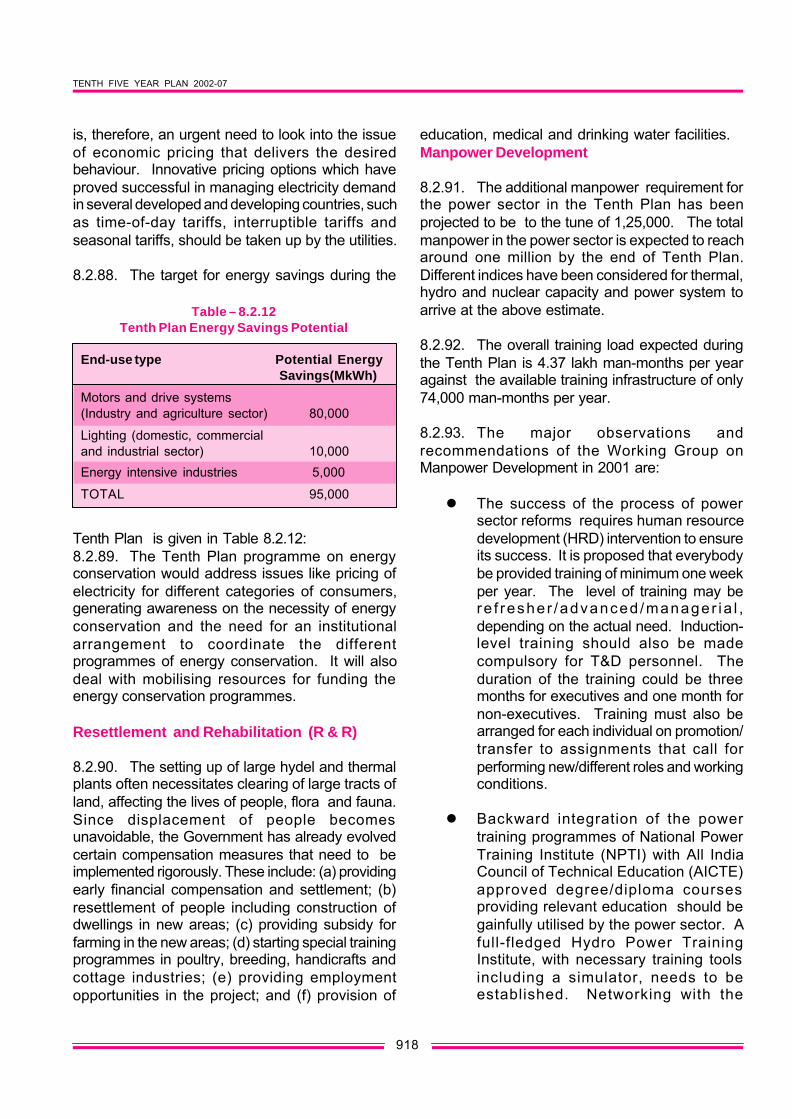
8.2.88. The target for energy savings during the
education, medical and drinking water facilities.Manpower Development
8.2.91. The additional manpower requirement forthe power sector in the Tenth Plan has beenprojected to be to the tune of 1,25,000. The totalmanpower in the power sector is expected to reacharound one million by the end of Tenth Plan.Different indices have been considered for thermal,hydro and nuclear capacity and power system toarrive at the above estimate.
8.2.92. The overall training load expected duringthe Tenth Plan is 4.37 lakh man-months per yearagainst the available training infrastructure of only74,000 man-months per year.
8.2.93. The major observations andrecommendations of the Working Group onManpower Development in 2001 are:
l The success of the process of powersector reforms requires human resourcedevelopment (HRD) intervention to ensureits success. It is proposed that everybodybe provided training of minimum one weekper year. The level of training may bere f resher /advanced /manager ia l ,depending on the actual need. Induction-level training should also be madecompulsory for T&D personnel. Theduration of the training could be threemonths for executives and one month fornon-executives. Training must also bearranged for each individual on promotion/transfer to assignments that call forperforming new/different roles and workingconditions.
l Backward integration of the powertraining programmes of National PowerTraining Institute (NPTI) with All IndiaCouncil of Technical Education (AICTE)approved degree/diploma coursesproviding relevant education should begainfully utilised by the power sector. Afull-fledged Hydro Power TrainingInstitute, with necessary training toolsincluding a simulator, needs to beestablished. Networking with the
Table – 8.2.12Tenth Plan Energy Savings Potential
End-use type Potential EnergySavings(MkWh)
Motors and drive systems(Industry and agriculture sector) 80,000
Tenth Plan is given in Table 8.2.12:8.2.89. The Tenth Plan programme on energyconservation would address issues like pricing ofelectricity for different categories of consumers,generating awareness on the necessity of energyconservation and the need for an institutionalarrangement to coordinate the differentprogrammes of energy conservation. It will alsodeal with mobilising resources for funding theenergy conservation programmes.
Resettlement and Rehabilitation (R & R)
8.2.90. The setting up of large hydel and thermalplants often necessitates clearing of large tracts ofland, affecting the lives of people, flora and fauna.Since displacement of people becomesunavoidable, the Government has already evolvedcertain compensation measures that need to beimplemented rigorously. These include: (a) providingearly financial compensation and settlement; (b)resettlement of people including construction ofdwellings in new areas; (c) providing subsidy forfarming in the new areas; (d) starting special trainingprogrammes in poultry, breeding, handicrafts andcottage industries; (e) providing employmentopportunities in the project; and (f) provision of
POWER
919
training/academic institutions like NPTI,Indian Institutes of Management (IIMs),Administrative Staff College of India(ASCI) and other reputed institutions forproviding training to power sectorpersonnel and other stakeholders isrecommended.
l Central assistance should be provided foraugmenting training facilities, procurementof simulators and diversification of existingrecognised training institutes. At least 5per cent of a power sector organisation’ssalary budget should be spent on trainingpersonnel.
Research and Development
8.2.94. Since the power sector is highlytechnology-intensive, technological upgradationand modernisation assume an important role,especially in realising economy in generation, T&Dand efficient utilisation of electrical energy.
8.2.95. The research and developmentprogrammes must necessarily provide inputs tofuture power programmes relating to bothgeneration as well as T&D. Full advantage shouldbe taken of the large base of existing research anddevelopment capabilities. Emphasis must be laidon solving field problems adversely affecting theproduction of power, creating bottlenecks in theoperation of the power system and affecting thequality of power supplied.
8.2.96. Various areas of research and technologydevelopment in the field of hydro, thermal, nuclearand power system have been identified where R&Dactivities could be focused on achieving improvedperformance of existing facilities, optimum utilisationof resources and to keep pace with the state-of-arttechnologies suiting our environment and prevailingconditions. Thrust areas identified are:
a) Development of Integrated GasificationCombined Cycle (IGCC) as ademonstration project to prove thetechnology based on Indian coal.
b) Coal beneficiation and use of alternate fuel
for power generation.c) Improvement in power station
performance relating to availability,reliability, efficiency and safety.
d) Studies on T&D networks relating to gridoperation and control, geographicalinformation system (GIS) and T&D losses.
e) Hydro power generation related proposalscovering silt erosion, and performancesimprovement.
f) Renovation and modernisation.
8.2.97. The Working Group on Power hasidentified 71 projects - 23 in the thermal sector, 39in the power system field and nine in the hydrosector – to promote research and developmentactivities. It is suggested that 1 per cent of the powersector outlay may be included in the Plan for R&D.
8.2.98 The following action points have beenidentified for research and development in thepower sector:
a) Creation of a Research and TechnologyDemonstration Fund for demonstrationprojects with the major portion as grant andthe balance as long-term interest-free loanfor research and demonstration of newtechnologies.
b) Making technology transfer mandatory inthe case of foreign direct investment. TheGovernment may consider liberalising theimport of technology at par with the importof materials and capital goods.
c) Encouraging the commercialisation ofindigenous technology leading to their full-scale development.
d) Enhancing bilateral / multilateralcooperation with developed countries forstate-of-the-art technological transfer andexchange of technical experts.
e) Enabling the CEA to oversee the progressand status of research and developmentfacilities in the country.
f) Networking and mapping the research anddevelopment resources, includingintellectual capital.
TENTH FIVE YEAR PLAN 2002-07
920
8.2.99. Table 8.2.13 shows that while the powersector outlay as a proportion of the total outlay bythe central and state governments has been declining,the central power sector outlay as a proportion oftotal power sector outlay has remained in the rangeof 38-43 per cent in the 1991-2001 period. The shareof the state sector has shown a declining trend,coming down from 27 per cent in 1991-92 to 17 percent in 2000-01. This has been mainly on account ofthe drive to enhance private sector investment in thepower sector since 1991-92. The states havepractically stopped investing in new generationprojects. The share of the central power sector in thetotal central sector outlay has also declined from 13per cent to 10 per cent during the same period .Keeping in view the low level of investment by theprivate sector, it would be desirable, in the shortterm, to step up public sector investment even asefforts continue to put the SEBs back on the rails inorder to attract private sector investment. Theschemewise break-up for the Tenth Plan outlay inrespect of Ministry of Power & Deptt. of Atomic Energy(Power) is given in the Appendix.
THE PATH AHEAD
8.2.100. The roadmap for the Tenth Plan will have
the following reform objectives:-l Rationalising power tariffs and making the
tariff setting process transparent.
l Reflecting cost of service in the tariffs andtransferring all subsidies explicitly to statebudgets.
l Improving efficiency in all the threesegments viz. generation, transmissionand distribution, either by creating separateprofit centres with full accountability withinthe vertically integrated structure, orunbundling SEBs into generation,transmission and distribution entities orthrough other models of reform dependingon the choice of the state government.
l Encouraging competition and privateparticipation in each element of theelectricity value chain.
l Instituting open access by separating thecarriage (transmission & distributionnetwork) from the content (power andenergy) thereby enabling customers tosource their requirements from the most
Power Sector in Total Plan OutlayTable - 8.2.13
Share of Power Sector Outlay in Total Plan Outlay (per cent)
Plan Period Power sector share Share of state Central power Share of centralin total outlay of power sector outlay sector outlay in power sector incentral and state in total sector total power total central
governments outlay of states sector outlay sector outlay
1991-92 18.33 26.09 38.70 13.70
1992-93 18.50 27.19 38.12 10.88
1993-94 17.15 26.24 43.83 11.52
1994-95 16.45 23.77 41.40 11.43
1995-96 15.26 23.48 39.28 10.21
1996-97 13.38 19.14 35.99 9.03
Eighth Plan Actual 15.80 23.90 39.20 12.60
Ninth Plan(Approved) 14.49 19.26 42.80 10.80
1997-98 13.36 19.30 35.30 9.70
1998-99 13.85 18.50 38.10 9.70
1999-2000 13.95 17.57 42.90 12.10
2000-2001 13.09 17.81 43.72 9.90
POWER
921
efficient source.l Strengthening the T&D system to reduce
losses, improve metering, institutingenergy audits and improving billing &collection.
l Redesigning APDP as APDRP withprovision for release of funds linked to theachievement of certain parameters andbenchmarks.
l Integrating captive generation (especiallyco-generation) into the power system.
l Stepping up public funding for the sectoreven as steps are taken to attract privateinvestment.
l Encouraging NTPC to take up projectsthrough joint ventures with private
promoters and the state governments.RENEWABLE SOURCES OF ENERGY
8.2.101. The development model followed so far,with an excessive reliance on fossil fuel resourceslike coal, oil and natural gas to meet the energyrequirement of the country, is not only unsustainablein the long-run, but also has an adverse impact onthe environment and ecology. The increase in land,water and air pollution levels during the energyconversion process in this model has become anarea of serious concern. The depleting nature ofthese fossil fuel resources compels the search forother alternatives. It is in this backdrop that non-conventional or renewable sources of energy haveattracted global attention as a viable option toachieve the goal of sustainable development. Whileit may not be possible, at this stage, to substituteconventional energy sources with renewable energysources, the latter would help in supplementingenergy supply efforts.
Table 8.2.14Renewable Energy Potential and Achievements
Source/System Achievements Potential Approximate(as on 31.12.2002)
Biogas plants (No.) 120 lakh 32.62 lakh
CBP/IBP/NBP plants (No.) - 3,520
Improved chulha (No.) 1,200 lakh 343 lakh
Biomass
a. Biomass power 19,500 MW * 358 MW
b. Biomass gasifier 42 MW
Solar Photovoltaic 20 MW/sq.km.
a. Solar street lighting systems (Nos.) - 41,403
b. Home lighting systems (Nos.) - 1,76,962
c. Solar lanterns (Nos.) - 3,83,929
d. SPV power plants - 1,172 kWp
Solar water heating system collector area 30 million sq.m. 0.59 million sq.km
8.2.102. The different renewable sources of energyinclude hydel power, wind power, solar power,biomass power and ocean energy etc. In addition,there is a significant potential to recycle theindustrial, urban and agriculture waste to extractthe energy content for useful application. Thismethod leads to environment-friendly wastedisposal and also helps to recover the energycontained in these wastes to supplement differentenergy supply options. Since the transport sectorconsumes huge quantities of hydro-carbons,alternate environment-friendly fuels such aselectricity (stored in batteries), compressed naturalgas (CNG) and fuel cells can be used.
8.2.103. The estimated potential of different non-conventional energy sources and the achievementsup to 31 December 2001 are given in Table 8.2.14:
8.2.104. The economics and other constraints facedin development of the renewable energyprogrammes are:
Hydel Power
8.2.105. India is endowed with a vast and viablehydro potential for power generation of which only17 per cent has been harnessed so far. The shareof hydro power or hydro-electricity (hydel) in thecountry has been steadily declining from over 50per cent in 1963 to 25 per cent in 2001-02. Basedon a systematic survey carried out during theSeventh Plan, the hydro-electric potential in thecountry is estimated at 600 Bkwh per year asagainst 472.15 Bkwh per year assessed earlier. Outof the total potential available, about 30 per centhas either been developed or is being developed.Greater emphasis on hydro-electricity is important,particularly to meet the peak loads. Hydro-electricityis also a clean and renewable source of energy.The long gestation of the hydro projects due todelays in forest and environment clearances,rehabilitation of the project-affected people, inter-state disputes, construction delays in civil worksetc. come in the way of accelerating hydro projects.Large hydro projects involving significant pondagehave serious environmental impacts of their ownthat need to be evaluated and mitigated. Smallhydro projects, therefore, assume importance since
they do not require large pondage and have thepotential to provide energy in remote and hilly areaswhere extension of grid systems is either notpossible or is uneconomical. Small hydro projects,especially run-of-the-river projects are economicallyviable, environmentally benign and have relativelyshort gestation periods. Hydro projects with up to25 MW station capacity are classified as small hydroprojects and are being implemented by the Ministryof Non-Conventional Energy Sources.
Wind Power
8.2.106 The harnessing of wind power for electricitygeneration in recent years has been quiteimpressive. The country has achieved an installedcapacity of 1,507 MW for electricity generationthrough wind power. The estimated potential in thecountry has been revised upwards to 45,000 MWfrom the 20,000 MW estimated earlier in view ofthe technological advances and the availability ofmore modern equipment. Works are in progress toassess the wind resource potential at differentlocations and India is fifth in the world after Germany,the United States, Denmark and Spain in terms ofwind power. The participation of the private sectorin this area is highly encouraging. The economicviability of wind power projects depends a greatdeal on the capacity factor and, therefore, verycareful site selection is called for. The unit sizeof wind turbine generators is also being enlarged.The unit size of machines has gone up from 55-100 KW in the first few projects to 750-1000 KWin recent projects. The productivity of the largermachines is higher than that of the smallermachines. The present capital cost of wind powerprojects ranges between about Rs. 4 crore toRs. 5 crore per MW including local civil, electricalworks and erection. This takes into considerationvarious central/state fiscal incentives available forwind power projects, which help to offset the lowcapacity utilisation. The life of a wind powerproject is estimated at about 20 years. Levelisedcosts over the life of the project compare quitefavourably with those for new thermal powerprojects located away from coal mining areas,as there is no recurring cost on fuel. Ifenvironment and social benefits offered by thewind power projects are also considered, theseprojects would favourably compare with
POWER
923
conventional power projects.Solar Power
8.2.107 There is abundant potential of solarradiation available during most part of the year fora tropical country like India. It has been estimatedthat a potential of 20 MW/sq.km is available throughthe Solar Photo-Voltaic (SPV) route and another35 MW/sq.km through the Solar Thermal route.There are ongoing programmes to tap this potentialboth for stand-alone applications and for gridconnected power systems. The stand-aloneapplications include the installation of solar-poweredstreet lights, domestic lights, portable solar lanterns,solar-powered water pumps and solar power packsall based on the principle of conversion of solarenergy directly into electricity through SPV cells.The cost of crystalline photo-voltaic (PV) modulesat the international level is in the range of $ 3-4 perwatt. Despite extensive efforts, the cost of thesecells and modules has not come down tocommercially viable levels of below $ 1 per watt.Other types of solar cells using amorphous silicontechnology were developed with a view to bringingdown the cost. However, the performance ofamorphous silicon-based solar cells suffers overtime. Elemental silicon continues to be the bestmaterial for PV and cost cutting is only possiblewith newer concepts and thin film materials. Withthe large scale production, the thin film PVtechnology could produce per watt cells at 5 percent at 10 per cent efficiency. The future of PVtechnology for application as a decentralised energysource mainly depends upon the cost reduction ofthe PV modules. The utilisation of the SPVtechnology to meet the energy requirement ofpeople living in far-flung areas for applications likelighting etc. is becoming attractive since extendingconventional electricity grid to these areas is notcost effective.
8.2.108 The other route is to convert the heatenergy contained in solar radiation to usefulapplications. Various types of solar thermal devicesare now available in the country which include solarwater heaters for industrial, commercial anddomestic applications, solar cookers (both domesticand community type), solar stills, solar dryers etc.Besides, solar energy is also being used for spaceheating by including solar passive features in
buildings and for agriculture through solargreenhouses. Work is in progress to set up solarthermal power plants by utilising the heat from thesun to produce high temperature/pressure steamto generate electricity. An integrated solar combinedcycle thermal plant is being set up in Rajasthan witha capacity of 140 MW. This type of plant would makeit possible to generate electricity even during non-sunshine periods with the support of a combinedcycle gas plant. However, the economic viabilityof such plants for commercial applications is yet tobe established. It is expected that these plants maybecome economically viable in the future on life-cycle cost basis and also on the basis of indigenoustechnology development. In any case, theenvironment-friendly nature of solar plants and therenewable fuel source would justify the setting upof such plants in the future.
Biomass Power
8.2.109 Bio resources, such as firewood, agro-residues and animal wastes form an importantcomponent of the energy mix of a developingcountry like India, and account for nearly 30 percent of the primary energy supply. Theseresources will continue to be used in order tomeet the increasing demand for energy, thoughwith higher end-use efficiencies. With a view topromoting efficient methods of using theseenergy resources the Ministry of Non-Conventional Energy Sources is implementingthe National Project on Biogas Development(NPBD), National Programme on ImprovedChulhas (NPIC), National Biomass GasificationProgramme and Biomass Power/Co-generationProgramme. It has been estimated that thecountry has the potential to set up 12 millionbiogas plants and install 120 million improvedchulhas. However, only around one-fourth of thepotential has been tapped so far. It has beenestimated that there is a potential to install19,500 MW capacity through biomass conversiontechnologies viz. combustion, gasification,incineration, pyrolisis and also bagasse-basedco-generation in sugar mills. So far only around381 MW of this potential has been tapped. Thereis scope for expanding the size of theseprogrammes as they directly benefit the majorityof the rural population and help them meet their
TENTH FIVE YEAR PLAN 2002-07
924
basic energy needs.8.2.110 During the Tenth Plan, biomass productionwill assume an increasing and crucial role.Strategies for encouraging energy plantations onwaste/degraded/marginal lands to feed biomass-based power projects need to be evolved. Inaddition, the technologies and projects for feedpreparation relating to various agro residues alsoneed to be encouraged.
8.2.111 Biomass offers an ideal option for ruralelectrification in remote areas and has been gettingpriority in certain areas in hilly states, islands etc.These schemes for decentralised power plants haveparticular relevance in the north-eastern states,Jammu and Kashmir and Sikkim. Someexperiments have been carried out to installcommunity-based biomass gasifier and biogasplants to meet the energy needs of a village.However, the replication of such programmes on acountry-wide scale and their success would dependon the identification of the institutions, mobilisationof the community, method of collection of usercharges etc.
Energy from waste
8.2.112. On a conservative basis, it is estimated thatabout 30 million tonnes of solid waste and 4,400million cubic meters of liquid waste are generatedevery year in urban areas from households andcommercial enterprises. In addition, themanufacturing sector also contributes a significantquantity to the country’s waste. From the estimatedavailability of garbage, there is a potential togenerate 1,700 MW of electricity — 1,000 MW fromurban and municipal waste and 700 MW fromindustrial waste. Technologies are now available totreat the garbage to meet the required pollutioncontrol standards, besides generating power. Anational programme under the Ministry of Non-Conventional Energy Sources seeks to promotesuch projects with suitable financial/fiscal incentivesto encourage private sector participation.International financial institutions also take keeninterest in these types of projects and come forwardto support them. A United Nations DevelopmentProgramme (UNDP)/Global Environment Facility(GEF) funded project called Development of HighRate Biomethenation Processes as a Means of
Reducing Green House Gases Emission is beingimplemented by the Ministry of Non-ConventionalEnergy Sources covering different waste sectors.It is expected that the demonstration projects takenup under this programme would provide thenecessary awareness among entrepreneurs to takeinitiative to set up such projects.
Alternative Fuel for Surface Transportation
8.2.113. Hydrocarbons used as fuels fortransportation are to be replaced by other eco-friendly fuels for surface transport vehicles. Manyoptions such as compressed natural gas (CNG),battery-powered vehicles and fuel cells are currentlyavailable. Some of the measures to be taken up topromote such programmes include the upgradationof the existing technology, cost reduction andcreation of an effective infrastructure network. Anoteworthy feature of the fuel cell vehicles is thatthey are truly zero-emission vehicles. Hydrogenproduced as a by product in chlor-alkali and fertiliserunits, oil refineries and several chemical industriescan be effectively used as a fuel in fuel cells. Thecost of fuel cells needs to be reduced significantlyin order to make them attractive forcommercialisation. Efforts should be made toproduce hydrogen from renewable sources suchas solar energy and water in an eco-friendly manner.Hydrogen can be produced by the electrolysis ofwater, a well-established and environmentallybenign technology. Efficient and economical storageof hydrogen is also possible. One method forstorage of hydrogen is the use of rechargeablemetal hydrides. Several metal alloys have beenidentified which are capable of storing hydrogen ina safe and environmentally clean manner. The largeenergy storing capacity in these metal hydrides perunit volume would make these storage devicescompact in size.
Ocean Energy
8.2.114. The ocean covers 71 per cent of the earth’ssurface and it acts as a natural collector and storeof solar energy. On an average day, 60 million sq.km. of tropical seas absorb an amount of solarradiation equivalent in heat content to about 245billion barrels of oil. If this energy could be tapped,a large-scale renewable source would become
POWER
925
available especially for tropical countries. Theenergy available in the ocean is clean, continuousand renewable. There are various means fortapping ocean energy such as Ocean ThermalEnergy Conversion (OTEC), wave energy, tidalenergy, salinity gradient energy, marine currents,marine biomass conversion etc. Among these, thefirst three technologies are likely to be viable forthe future.
8.2.115. Even though it is not possible to extractall the energy potential in the ocean, what can beextracted is still a vast source of power. Researchactivities are being undertaken in the areas of waveenergy and OTEC. Studies are being carried out toestablish tidal power plants in the Gulf of Kutch andin a creek in the Sunderbans area. Once thisresearch establishes the commercial viability ofocean power, significant power generation capacity
based on the country’s ocean energy potential canbe expected.REVIEW OF THE NINTH PLAN
8.2.116. The major thrust of the Ninth Planprogramme for renewable sources of energycovered the following two areas:
i. Restructuring of the existing programmesfor non-conventional energy towardsgradual commercialisation. Specialinitiatives were taken to exploit the largeco-generation potential available in thecountry. A draft Renewable Energy Policyhas been formulated which seeks theapproval of the Government for follow-upaction on this matter.
ii. Restructuring the socially-oriented
Table 8.2.15
S.No. Programmes Units Ninth Plan CumulativeTarget Likely Achiv.Fixed During Ninth Plan
1. Biogas plants Nos. in lakh 10 8.44
2. Community/Institutional/Night soil based No. 800 1,775
3. Improved chulha Nos. in lakh 150 102
4. Biomass/Gasifier MW 40 25.50
5. Integrated Rural Energy Programme Block Nos. 860 860
6. Energy Parks Nos. 200 190
7. Solar Photovoltaic Programme (SPV)
SPV Home Light Nos. 2,00,000 1,35,567
SPV Lanterns Nos. 3,00,000 3,04,528
SPV Street Lighting Systems Nos. 13,536
SPV Power Plants KWp 1,600 581
SPV Pumps Nos. 4,000 3,023
8. Solar Thermal Energy Programme
Solar water heating system m2 collector area 1,50,000 1,41,409
Solar cooker Nos. 1,50,000 1,02,000
9. Wind Pumps and Hybrid System Nos. 1,000 614
10. Wind Power MW 1,000 650
12. Small Hydro (upto 25 MW) MW 130 254
13. Biomass Power MW 314 295
14. SPV Power kW 1,500 1,475
15. Waste to Energy Programme MW 42 22.4
TENTH FIVE YEAR PLAN 2002-07
926
programmes in a manner that the directcapital subsidy provided by theGovernment is brought down. Thecontinuation of these programmes duringthe Tenth Plan requires an evaluationstudy taking into account various incentivessuch as interest subsidy in place of capitalsubsidy and the implementation of someof the programmes as a part of the otherrural development programmes. Some ofthe socially-oriented programmes whichwere continued under the central sectorfor a long period, i.e. more than two Five-Year Plans are being transferred to thestates.
8.2.117. The physical achievements of thevarious renewable energy programmes are inTable 8.2.15:
TENTH PLAN
8.2.118. In the context of the Tenth Plan, anexercise for convergence, retention, retention withmodifications, transfer, and weeding out of thecentral sector and centrally sponsored schemesunder the Ministry of Non-Conventional EnergySources was carried out jointly by the ministry andthe power and energy division of the PlanningCommission. Accordingly, 35 schemesimplemented by the ministry have been convergedunder 11 major schemes. Besides, two of the threecentrally-sponsored schemes under are to betransferred to the states. The two schemes relateto community-based plants and improved chulahs.It has been recommended that one scheme onanimal energy be discontinued since it is not makingany significant headway.
Approach for the Tenth Plan
8.2.119. There is a significant potential to meetthe basic energy requirement of people (cooking,lighting and heating) in an economically efficientmanner through non-conventional and renewablesources of energy. The emphasis has to be onpreparing a time-bound plan for progressiveelectrification covering groups of users or avillage as a whole. Wherever feasible,community systems have to be put up to meet
and manage the energy requirements in thevillages. {{People’s participation throughpanchayats, other local bodies, cooperatives andNGOs is to be secured in planning andimplementation of such programmes. conceptsas Barefoot Solar Engineers could be adopted.The approach has to be a decentralised one andbased on a judicious mix of public and privateinvestment.
8.2.120. At present, non-conventional energysources accounts for a mere 3.4 per cent of thetotal installed power generating capacity. Thestrategy to enhance the grid supply of power fromrenewable sources of energy or from co-generationhas to aim at improving the ability to despatch andcost-competitiveness. A suitable policy frameworkwould need to be introduced for providingremunerative returns and encouraging privateinvestments. Development and promotion of thissector, which is environmentally benign, should notbe constrained by intrusive regulation.
THE PATH AHEAD
8.2.121. The following steps need be taken in theTenth Plan:
Ø Identify remote areas where power supplyfrom the conventional grid will beprohibitively expensive and make it apriority to provide off-grid supply fromrenewables for these areas. Createprovisions for integrated generation anddistribution of off-grid energy supply.
Ø Conduct a comprehensive review ofprogramme objectives, achievements todate, and efficacious use of funds by allconcerned.
Ø Clarify the framework for supply to maingrid by providing regulatory certainty ontariff, off-take agreements, and direct/contracted sale to bulk users.
Ø Encourage private sector investments inrenewable energy sources by promotinga bidding process for available subsidies.Award contracts to private entrepreneurs
POWER
927
who provide maximum benefit with thelowest amount of subsidies.
Ø Promote local/private sector managementof both generation and distribution for off-grid supply from renewable sources.
Ø Integrate renewable energy technologiesin all buildings.
Ø Optimise energy plantation by raisingplants on degraded forest and communityland.
Village Electrification
8.2.122. It is proposed that around 18,000 villageslocated in remote and difficult areas will beelectrified through decentralised and non-conventional energy sources. A time frame hasbeen set to complete the electrification of all theremote villages by the end of the Eleventh Plan i.e.2012. Accordingly the Tenth Plan would accordtop priority to this activity.
8.2.123. A physical target of 3075 MW of power
generation capacity from renewables has been setfor Tenth Plan, as per the following details:Wind 1,500 MWSHP 600 MWBiomass power/co. generation 700 MWBiomass gasification 50 MWWaste to Energy 80 MWSPV Power 5 MWSolar Thermal Power 140 MWTotal 3075 MW
8.2.124. It is proposed to electrify 5,000 villagesthrough decentralised energy sources, 4,000 ofthem by solar and the remaining villages by biomassand small hydro and to install 10 lakh biogas plants,2.5 lakh domestic plus 6 lakh solar lantern SPVlighting systems, 5 MW of SPV power plants, 8,000SPV pumps and 10,000 SPV generators. Inaddition, solar water heating systems, solar cookers,solar air heating systems etc. are also proposed tobe encouraged.
8.2.125. The schemewise break-up of the TenthPlan outlay for Ministry of Non-Conventional EnergySources is given in the Appendix.
TENTH FIVE YEAR PLAN 2002-07
928
Annexure – 8.2.1
RESOLUTONS OF THE CHIEF MINISTERS/POWER MINISTERSCONFERENCE ON 3rd MARCH’ 2001.
The following Resolutions of the Chief Ministers/Power Ministers Conference held on 3rd March, 2001were adopted:-
A. COMPLETING ELECTRIFICATION OF ALL VILLAGES AND HOUSEHOLDS
i. Rural Electrification may be treated as a Basic Minimum Service under the Prime Minister’sGramodaya Yojana;
ii. Rural Electrification may be completed by the end of the Tenth Plan i.e. by year 2007;iii. Full coverage of all households may be targeted for the end of the Eleventh Plan i.e. by year
2012.iv. For the attainment of full electrification, States may be given flexibility for using funds under
Rural Development Programmes with the consent of the Village/ Block Panchayats forundertaking the task of electrification where it is required.
v. It was agreed that electrification of remote villages in the States would need a special mode offinancing including an element of grant.
B. DISTRIBUTION REFORMS
The real problem of management and the challenge of reforms lies in the distribution sector.
i. Energy audit at all 11 KV feeders must be made effective within the next 6 months andaccountability fixed at the local level.
ii. An effective Management Information System for this purpose needs to be made operation.iii. On the basis of the above, an effective programme needs to be launched for identifying and
eliminating power thefts in the next 2 years.
iv. Full metering of all consumers had been targeted for completion by December 2001. Specialefforts should be made to complete the programme.
v. The quality of power supplied especially in rural areas needs to be improved through theAPDP and other programmes quickly;
vi. Commercial viability has to be achieved in distribution in 2-3 years through any or all of thefollowing:- Creating Profit centres with full accountability
- Handing over of local distribution to Panchayats/Local Bodies/Franchisees/UsersAssociations, wherever necessary.
- Privatisation of distribution
- Or any other meansvii. Efforts by States, if necessary, at inviting private investment in the power sector need to be
focused towards the distribution sector.viii. Current operations in distribution would need to reach break even in two years and achieve
positive returns thereafter.
C. TARIFF DETERMINATION BY REGULATORY COMMISSIONS AND SUBSIDIES.
i. State Electricity Regulatory Commissions may be made functional in the next six months andtariff filings made. Tariff orders issued by Central Electricity Regulatory Commission and
POWER
929
State Electricity Regulatory Commissions need to be implemented fully unless stayed or setaside by Court order.
ii. Subsidies may be given only to the extent of State Government’s capacity to pay the subsidiesexplicitly through budget provisions.
iii. It is necessary to move away from the regime of providing free power. The past decision ofCMs of a minimum agricultural tariff of 50 paise may be implemented immediately.
D. GENERATION
i. Special efforts need to be made to increase the PLF of existing plants through Renovation &Modernisation.
ii. In the short run, there is no alternative to increase in public sector investment in generation, aslarge-scale private investment in generation would flow only after reforms succeed in restoringfinancial viability. The Centre and the States need to take suitable decisions regarding increasein outlays for the Tenth Plan. Priority should be given for investments at those locations whichproduce the cheapest power. CEA has estimated the requirement for an additional 100,000MW of generating capacity by 2012. Emphasis may be given for the development of hydroand other renewable sources.
iii. Where the States and Financial Institutions are in agreement about the need for developmentof IPPs, they need to work together to achieve financial closure at the earliest. The Centrewould facilitate the finalization of reforms based multi-partie agreements.
iv. The evolution of a National Grid for inter-regional transfer of power needs to be taken up onpriority.
v. Some provisions of the Forest Conservation Act may require to be revised for expeditiouscompletion of power and other projects.
E. ENERGY CONSERVATION AND DEMAND SIDE MANAGEMENT
An effective programme in the field of demand side management through- energy efficient bulbs, tube lights and agricultural pumpsets,- time of the day metering and differential tariff for peak and off peak hours.
needs to be implemented with suitable mass awareness and extension efforts.F. SUPPORT FROM GOVERNMENT OF INDIA
i. The Government of India would support the States in their reform efforts. This support wouldbe linked to time bound power reform initiatives in the States and achievement of definitemilestones towards restoration of financial viability.
ii. Interest rates of PFC and REC should be brought down to reflect market conditions.iii. An Expert Group would be set up to recommend one time settlement of all power sector past
dues CPSUs to State Power Utilities. This would be linked to implementation of reforms withtime bound milestones. The Group will give its report within three weeks of its constitution.
G. SUPPLY FROM CENTRAL GENERATING STATIONS
Continued supply of power from Central Generating Stations would have to be linked to demonstrationof capacity to make payments for current purchases and securitisation of past dues.
H. HIGH LEVEL EMPOWERED GROUP
A High Level Empowered Group comprising of Minister of Power and Chief Ministers of some Statesmay be set up to co-ordinate, monitor and review the implementation of Reforms.