CHAPTER SIX Income and Wealth in America Kevin M. Murphy and Emmanuel Saez In this session, Kevin Murphy and Emmanuel Saez present their research, react to each other’s presentations, and take questions from the audience. Part I: Kevin Murphy I’m going to go relatively quickly because I think the discussions are always the best part. We’ve talked a lot about the top 1 percent. I’m not going to talk about the top 1 percent. I’m going to talk about the other 99 percent almost entirely. Before I start with the facts, I want to make sure that we’re all thinking about it the same way. e most important thing, when we talk about wages and talk about inequality, is to realize that we’re talking about prices. At least when you talk about wages, it’s the price of labor that’s being determined in some marketplace out there. I think that we some- times tend to forget that. Prices matter. For example, what happens when you see the price of something go up? Why did it happen? Maybe demand went up or supply went down. How is the market going to respond? If there’s more demand for something than there was last year, people are going to produce more of it. ese are the natural kinds of supply-and-demand responses that we expect to see in the marketplace. at’s the perspective that I think is very impor- tant when thinking about the labor market. One thing at which I
Transcript
CHAPTER SIX
Income and Wealth in AmericaKevin M. Murphy and Emmanuel Saez
In this session, Kevin Murphy and Emmanuel Saez present their
research, react to each other’s presentations, and take questions from
the audience.
Part I: Kevin Murphy
I’m going to go relatively quickly because I think the discussions
are always the best part. We’ve talked a lot about the top 1 percent.
I’m not going to talk about the top 1 percent. I’m going to talk
about the other 99 percent almost entirely. Before I start with the
facts, I want to make sure that we’re all thinking about it the same
way. Th e most important thing, when we talk about wages and talk
about inequality, is to realize that we’re talking about prices. At
least when you talk about wages, it’s the price of labor that’s being
determined in some marketplace out there. I think that we some-
times tend to forget that. Prices matter. For example, what happens
when you see the price of something go up? Why did it happen?
Maybe demand went up or supply went down. How is the market
going to respond?
If there’s more demand for something than there was last year,
people are going to produce more of it. Th ese are the natural
kinds of supply-and-demand responses that we expect to see in
the market place. Th at’s the perspective that I think is very impor-
tant when thinking about the labor market. One thing at which I
H6781.indb 111H6781.indb 111 10/22/15 7:40:08 AM10/22/15 7:40:08 AM
112 Kevin M. Murphy and Emmanuel Saez
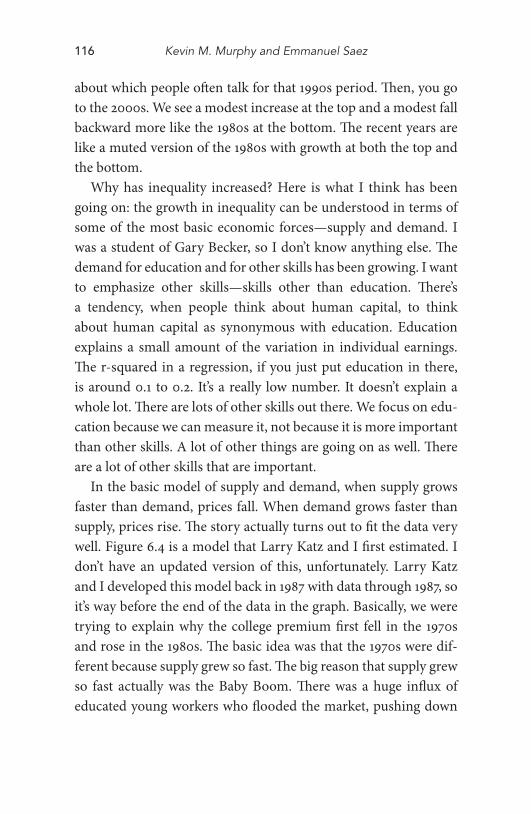
looked was returns to college. We’ve heard a lot about education
and about returns to college. Figure 6.1 is a measure of returns to
college in the United States.
Th e key feature on which you might focus is that there was a
decline in the returns to college in the 1970s, which was actually
a period where people were talking about Americans being over-
educated. Th at was followed by the dramatic rise that occurred
during the 1980s, a continued rise in the 1990s, and a relatively fl at
premium in the 2000s. What I hadn’t really fully appreciated until
the discussion over the last few days is that the timing of 1980 to
2000 as the big transition period is true for things beyond the col-
lege premium and wage inequality. A lot of the graphs that we saw
the other day and a lot of the discussions that we heard yesterday
on inequality at the top of the income distribution mirrored that
same picture. A lot of what happened at the top of the income dis-
tribution happened pre-2000. Th at’s certainly the case here when
we look at the returns to college.
FIGURE 6.1. Returns to college education, 1963–2012
Source: Based on previous work done by Katz and Murphy (1992) updated to 2012
0.04
1960 1970 1980Years of HS Graduation (Age 18)
Ave
rag
e R
etu
rn p
er Y
ear
1990 2000 2010
0.06
0.08
0.1
0.12
0.14
Returns
H6781.indb 112H6781.indb 112 10/22/15 7:40:08 AM10/22/15 7:40:08 AM
Income and Wealth in America 113
Th e other thing to note is just how dramatic that change is.
Th e early-human-capital literature of the 1960s talked about the
7 percent return. It actually fell to maybe 5 percent in the 1970s.
Th at was the “overeducated America” period. Now, you get returns
more like 13 percent. It’s really quite dramatic. Again, think about
it in terms of prices. If you think about college as an investment,
this would suggest that there’s an enormous return to investment
today—roughly triple what is was in 1980. At the same time, think
about this as a price from the point of view of driving inequality in
terms of the outcomes. It’s like when the price of oil goes up. All of
the guys who have oil are much better off than they were before,
and all of the people who need to buy gas are worse off than they
were before. Th at’s part of the story. Th e other side is that there’s
a big incentive now to go out and to fi nd more oil and to produce
more oil than you did in the past. Th at’s going to be true in the col-
lege market as well.
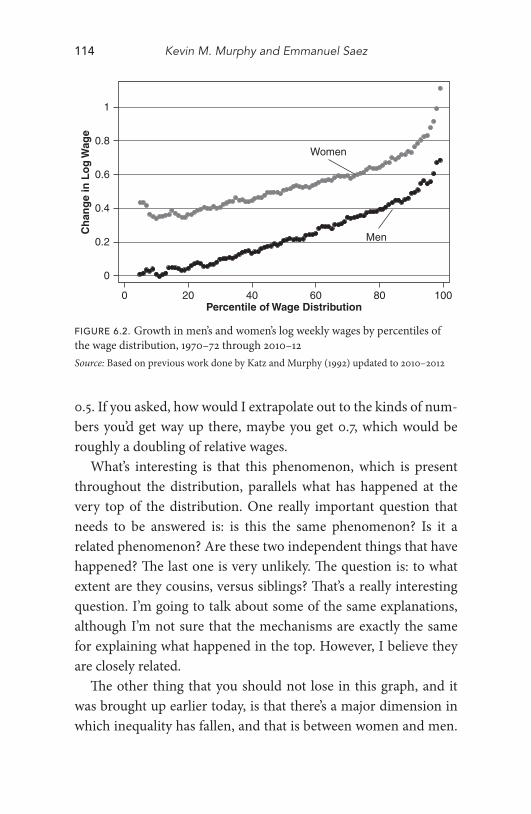
Figure 6.2 gives the change in the log wage rate over a roughly
forty-year period from 1970–72 to 2010–12 for men and women
by percentile of the wage distribution. Th ese are diff erent people
at the beginning and end, and I’m matching the median in 1970
with the median in 2010. What we are asking is: how did the wages
associated with diff erent points in that distribution change over
time? Th ere are several interesting things about a fi gure like this,
which will be part of the story when thinking about inequality.
One is to remember the timing. It’s going up. It’s not all the last
ten years. It’s been going up over time, but the other is that this
is an upward-sloping line throughout the range. Th ere’s a bigger
increase at the eightieth percentile than there was at the sixtieth
and more at the sixtieth than at the fortieth. Th ere’s been growth
in inequality throughout the distribution. Th is is not unique to the
top. In fact, if you ask, how big is the gap between the middle and
the top, the middle in the graph is about 0.2, and the top is almost
H6781.indb 113H6781.indb 113 10/22/15 7:40:08 AM10/22/15 7:40:08 AM
114 Kevin M. Murphy and Emmanuel Saez
0.5. If you asked, how would I extrapolate out to the kinds of num-
bers you’d get way up there, maybe you get 0.7, which would be
roughly a doubling of relative wages.
What’s interesting is that this phenomenon, which is present
throughout the distribution, parallels what has happened at the
very top of the distribution. One really important question that
needs to be answered is: is this the same phenomenon? Is it a
related phenomenon? Are these two independent things that have
happened? Th e last one is very unlikely. Th e question is: to what
extent are they cousins, versus siblings? Th at’s a really interesting
question. I’m going to talk about some of the same explanations,
although I’m not sure that the mechanisms are exactly the same
for explaining what happened in the top. However, I believe they
are closely related.
Th e other thing that you should not lose in this graph, and it
was brought up earlier today, is that there’s a major dimension in
which inequality has fallen, and that is between women and men.
FIGURE 6.2. Growth in men’s and women’s log weekly wages by percentiles of
the wage distribution, 1970–72 through 2010–12
Source: Based on previous work done by Katz and Murphy (1992) updated to 2010–2012
Women
Men
0
0
0.2
0.4
Ch
ang
e in
Lo
g W
age
0.6
0.8
1
20 40Percentile of Wage Distribution
60 80 100
H6781.indb 114H6781.indb 114 10/22/15 7:40:08 AM10/22/15 7:40:08 AM
Income and Wealth in America 115
Women’s wages were below men’s. In this graph you can see that
no matter whether you’re talking with low-wage women or high-
wage women, women have done much better than men over this
forty-year period to the tune of almost twenty log points. Th at’s a
big change in relative wages.
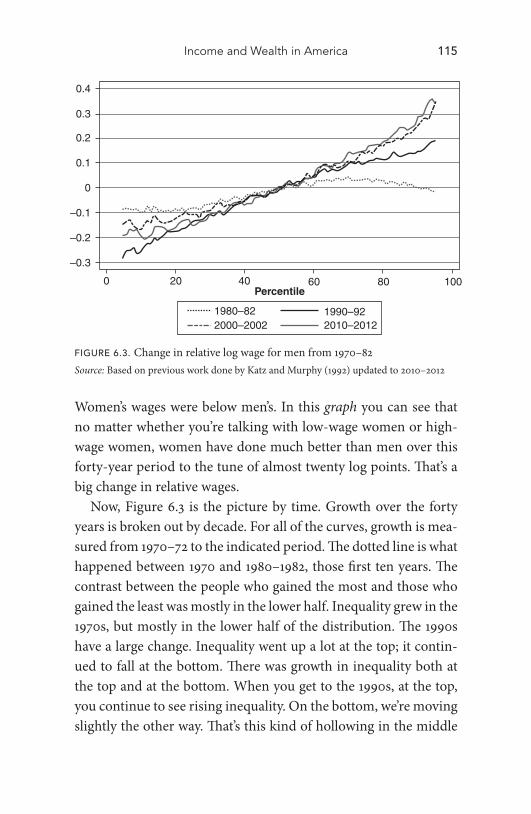
Now, Figure 6.3 is the picture by time. Growth over the forty
years is broken out by decade. For all of the curves, growth is mea-
sured from 1970–72 to the indicated period. Th e dotted line is what
happened between 1970 and 1980–1982, those fi rst ten years. Th e
contrast between the people who gained the most and those who
gained the least was mostly in the lower half. Inequality grew in the
1970s, but mostly in the lower half of the distribution. Th e 1990s
have a large change. Inequality went up a lot at the top; it contin-
ued to fall at the bottom. Th ere was growth in inequality both at
the top and at the bottom. When you get to the 1990s, at the top,
you continue to see rising inequality. On the bottom, we’re moving
slightly the other way. Th at’s this kind of hollowing in the middle
FIGURE 6.3. Change in relative log wage for men from 1970–82
Source: Based on previous work done by Katz and Murphy (1992) updated to 2010–2012
0.4
0.3
0.2
0.1
0
–0.1
–0.2
–0.3
0 20 40 60Percentile
80 100
1980–822000–2002 2010–2012
1990–92
H6781.indb 115H6781.indb 115 10/22/15 7:40:08 AM10/22/15 7:40:08 AM
116 Kevin M. Murphy and Emmanuel Saez
about which people oft en talk for that 1990s period. Th en, you go
to the 2000s. We see a modest increase at the top and a modest fall
backward more like the 1980s at the bottom. Th e recent years are
like a muted version of the 1980s with growth at both the top and
the bottom.
Why has inequality increased? Here is what I think has been
going on: the growth in inequality can be understood in terms of
some of the most basic economic forces—supply and demand. I
was a student of Gary Becker, so I don’t know anything else. Th e
demand for education and for other skills has been growing. I want
to emphasize other skills—skills other than education. Th ere’s
a tendency, when people think about human capital, to think
about human capital as synonymous with education. Education
explains a small amount of the variation in individual earnings.
Th e r-squared in a regression, if you just put education in there,
is around 0.1 to 0.2. It’s a really low number. It doesn’t explain a
whole lot. Th ere are lots of other skills out there. We focus on edu-
cation because we can measure it, not because it is more important
than other skills. A lot of other things are going on as well. Th ere
are a lot of other skills that are important.
In the basic model of supply and demand, when supply grows
faster than demand, prices fall. When demand grows faster than
supply, prices rise. Th e story actually turns out to fi t the data very
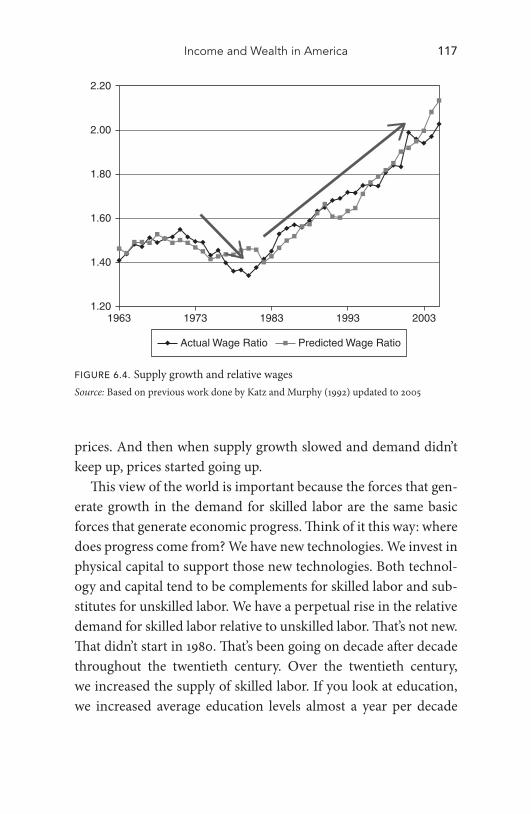
well. Figure 6.4 is a model that Larry Katz and I fi rst estimated. I
don’t have an updated version of this, unfortunately. Larry Katz
and I developed this model back in 1987 with data through 1987, so
it’s way before the end of the data in the graph. Basically, we were
trying to explain why the college premium fi rst fell in the 1970s
and rose in the 1980s. Th e basic idea was that the 1970s were dif-
ferent because supply grew so fast. Th e big reason that supply grew
so fast actually was the Baby Boom. Th ere was a huge infl ux of
educated young workers who fl ooded the market, pushing down
H6781.indb 116H6781.indb 116 10/22/15 7:40:08 AM10/22/15 7:40:08 AM
Income and Wealth in America 117
prices. And then when supply growth slowed and demand didn’t
keep up, prices started going up.
Th is view of the world is important because the forces that gen-
erate growth in the demand for skilled labor are the same basic
forces that generate economic progress. Th ink of it this way: where
does progress come from? We have new technologies. We invest in
physical capital to support those new technologies. Both technol-
ogy and capital tend to be complements for skilled labor and sub-
stitutes for unskilled labor. We have a perpetual rise in the relative
demand for skilled labor relative to unskilled labor. Th at’s not new.
Th at didn’t start in 1980. Th at’s been going on decade aft er decade
throughout the twentieth century. Over the twentieth century,
we increased the supply of skilled labor. If you look at education,
we increased average education levels almost a year per decade
19631.20
1.40
1.60
1.80
2.00
2.20
1973 1983 1993 2003
Actual Wage Ratio Predicted Wage Ratio
FIGURE 6.4. Supply growth and relative wages
Source: Based on previous work done by Katz and Murphy (1992) updated to 2005
H6781.indb 117H6781.indb 117 10/22/15 7:40:08 AM10/22/15 7:40:08 AM
118 Kevin M. Murphy and Emmanuel Saez
over that period of time. As long as supply growth was keeping
pace with the demand growth, returns to skill would not change
in spite of growing demand. What’s happened is that that relation-
ship has broken down. Supply is no longer keeping pace with the
ongoing growth in demand.
Now that’s a bit too simplifi ed, because if you look at the pattern
of the change in the growth of demand, it has become more con-
centrated. You get that concave shape in the early years and more
convex shape in the later years. Th ere are subtleties to the story. I
think that the data fi t those nuances very well, but I will leave that
aside for now. Th e key point is that this supply-and-demand view
of the world is important.
What are the lessons that come out of this? One is that sup-
ply matters. Th at is, if you have low-skilled individuals earning
low wages, if you can educate some of those people, improve their
schooling, move them up the ladder, that will benefi t them, and
it will benefi t all of the other low-skilled people by reducing the
0.04
0.06
0.08
Ave
rag
e R
etu
rn p
er Y
ear
Fra
ctio
n A
tten
din
g C
olle
ge
0.1
0.12
Fraction Attending
Returns
0.14
1960 1970 1980Year of HS Graduation (Age 18)
1990 2000 2010
0.45
0.5
0.55
0.6
0.65
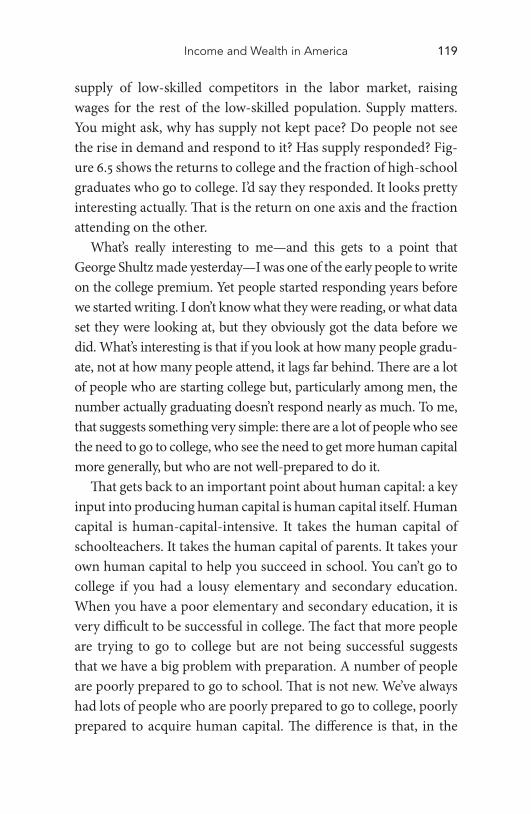
FIGURE 6.5. Returns and college attendance
Source: Based on previous work done by Katz and Murphy (1992) updated to 2012
H6781.indb 118H6781.indb 118 10/22/15 7:40:08 AM10/22/15 7:40:08 AM
Income and Wealth in America 119
supply of low-skilled competitors in the labor market, raising
wages for the rest of the low-skilled population. Supply matters.
You might ask, why has supply not kept pace? Do people not see
the rise in demand and respond to it? Has supply responded? Fig-
ure 6.5 shows the returns to college and the fraction of high-school
graduates who go to college. I’d say they responded. It looks pretty
interesting actually. Th at is the return on one axis and the fraction
attending on the other.
What’s really interesting to me—and this gets to a point that
George Shultz made yesterday—I was one of the early people to write
on the college premium. Yet people started responding years before
we started writing. I don’t know what they were reading, or what data
set they were looking at, but they obviously got the data before we
did. What’s interesting is that if you look at how many people gradu-
ate, not at how many people attend, it lags far behind. Th ere are a lot
of people who are starting college but, particularly among men, the
number actually graduating doesn’t respond nearly as much. To me,
that suggests something very simple: there are a lot of people who see
the need to go to college, who see the need to get more human capital
more generally, but who are not well-prepared to do it.
Th at gets back to an important point about human capital: a key
input into producing human capital is human capital itself. Human
capital is human-capital-intensive. It takes the human capital of
schoolteachers. It takes the human capital of parents. It takes your
own human capital to help you succeed in school. You can’t go to
college if you had a lousy elementary and secondary education.
When you have a poor elementary and secondary education, it is
very diffi cult to be successful in college. Th e fact that more people
are trying to go to college but are not being successful suggests
that we have a big problem with preparation. A number of people
are poorly prepared to go to school. Th at is not new. We’ve always
had lots of people who are poorly prepared to go to college, poorly
prepared to acquire human capital. Th e diff erence is that, in the
H6781.indb 119H6781.indb 119 10/22/15 7:40:08 AM10/22/15 7:40:08 AM
120 Kevin M. Murphy and Emmanuel Saez
past, there were lots of things for them to do. Now there are not as
many things for low-skilled workers to do, since technology has
progressed. Do we want to stop progress? No. Th e answer is that
we’ve got to respond.
Go back to fi gure 6.1, which showed the returns to college. Th ere
are two ways to look at this. One is that supply has fallen short. Th e
other is that there is an opportunity here. Th e best way to solve this
shortage is to take advantage of the high return that the shortage
has generated. Th at is, we’ve got an opportunity to get a return on
investment that’s higher than it’s been in the past. Th at’s assuming
that we can actually invest in the skills that are refl ected in these
higher prices. I don’t see any reason why we can’t.
Th e second is that because the number of people going on to
college (the extensive margin) has not kept pace with demand,
prices have risen.
Th at generates an intensive margin response that exacerbates
inequality because what happens is that the high-skilled people
are supplying more labor. Th ey’re working harder. Th ey’re working
more hours. Th ey’re investing more in themselves. Th ey’re moving
to places that demand more human capital. Th is, unlike growth in
the number of individuals completing college, actually increases
inequality. Bob Topel and I have a paper that shows why that’s the
case. You’ve got technology working to increase inequality. Th e
extensive margin is constantly pushing that back. When the exten-
sive margin falls short, the intensive margin pushes inequality up
because people are responding positively to their earnings. Th ey’re
realizing that they can earn more. Th ey’re going to work harder, to
work more, and to do things that bring more compensation.
Part II: Emmanuel Saez
I am going to talk about income and wealth and equality in Amer-
ica. I’m going to lay out the facts relatively quickly because we’ve
H6781.indb 120H6781.indb 120 10/22/15 7:40:08 AM10/22/15 7:40:08 AM
Income and Wealth in America 121
seen, over these two days, a lot of those numbers already. And
then I’ll throw in some policy ideas to stimulate the debate. I’ve
worked on top-income shares. Let me fi rst say, this is a conference
on inequality. Inequality matters because the public cares about it.
Th at is, people evaluate their own success relative to others. People
have a sense of fairness. Th at’s why the study of inequality is inter-
esting, and that’s why we need economics to provide measures that
are understandable to the public to illuminate the debate. We need
to fi nd simple ways to measure inequality, so what we’ve done is
that we’ve measured shares of total income going to the top 10 per-
cent, top 1 percent, etc. We’ve used individual income tax statistics
because they are the only source that cover long time periods and
that capture top incomes well. Th omas Piketty started this litera-
ture with the study of France, and I analyzed with him the case of
the United States.
I’m going to talk about pre-tax market income. Th at is what
people earn on the market before taxes and before transfers from
the government. As a caveat, I want to point out that the num-
bers you’ll see, and that you’ve seen yesterday, are narrower than
national income. Th ey include market income reported on tax
returns and, hence, they exclude things like employer-provided
health care benefi ts or imputed rent of homeowners. Our next goal
is to broaden the series to refl ect total income, so that we will be
able to distribute national income on a pre-tax, pre-transfer basis
and also do it on a post-tax, post-transfer basis.
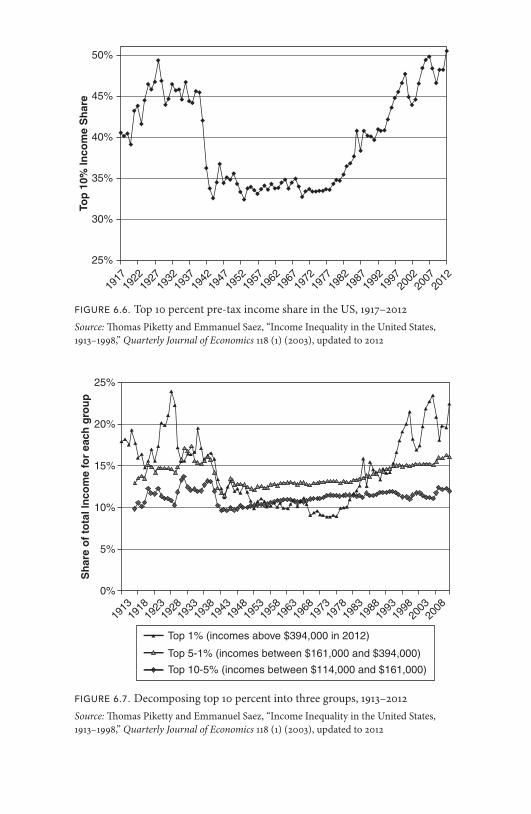
Figures 6.6 and 6.7 show the facts for the United States. If you
look at the share of income going to the top 10 percent families,
it has that big U shape over the last hundred years. Th ere was a
very high level of income concentration before World War II, with
the top 10 percent getting 45 percent of total income. Th ere was a
big fall in income concentration during World War II, and then
a period of much lower income concentration in the following
three decades. What is striking indeed has been the surge in the
H6781.indb 121H6781.indb 121 10/22/15 7:40:08 AM10/22/15 7:40:08 AM
FIGURE 6.6. Top 10 percent pre-tax income share in the US, 1917–2012
Source: Th omas Piketty and Emmanuel Saez, “Income Inequality in the United States,
1913–1998,’’ Quarterly Journal of Economics 118 (1) (2003), updated to 2012
1917
25%
30%
35%
Top
10%
Inco
me
Sh
are
40%
45%
50%
1922
1927
1932
1937
1942
1947
1952
1957
1962
1967
1972
1977
1982
1987
1992
1997
2002
2007
2012
FIGURE 6.7. Decomposing top 10 percent into three groups, 1913–2012
Source: Th omas Piketty and Emmanuel Saez, “Income Inequality in the United States,
1913–1998,’’ Quarterly Journal of Economics 118 (1) (2003), updated to 2012
1913
1918
0%
5%
10%
Sh
are
of
tota
l In
com
e fo
r ea
ch g
rou
p
15%
20%
25%
1928
1923
1933
1938
1943
1948
1953
1958
1963
1968
1973
1978
1983
1988
1998
1993
2003
2008
Top 1% (incomes above $394,000 in 2012)
Top 5-1% (incomes between $161,000 and $394,000)
Top 10-5% (incomes between $114,000 and $161,000)
H6781.indb 122H6781.indb 122 10/22/15 7:40:08 AM10/22/15 7:40:08 AM
Income and Wealth in America 123
last three or four decades where the top 10 percent income share
goes from 33 percent all the way to 50 percent, so that in recent
years we are at a level of income concentration that is as high as it’s
been over the last hundred years. Th e second fact that echoes what
Kevin Murphy was showing is that this eff ect has been really very
highly concentrated. Th e higher you go in the distribution, the big-
ger the gain. Figure 6.7 displays the top 1 percent, next 4 percent
(top 5-1), and next 5 percent (top 10-5) income shares. You can
see that out of the seventeen-point increase in the top 10 percent
income share, most of that comes from the top 1 percent, whose
income share goes from slightly below 10 percent to above 20 per-
cent in recent years with some gains in the next 4 percent and with
only a little bit of gain in the next 5 percent.
What is driving top-income shares? If you look at the worldwide
evidence that we’ve gathered, all currently rich countries had very
high levels of income concentration a hundred years ago. Th at’s
true for Sweden. Even the most equal countries today had very
high levels of income concentration a century ago. Income concen-
tration fell dramatically in all countries in the fi rst half of the twen-
tieth century. Income concentration surged back in some—but not
in all—countries since the 1970s. Chad Jones showed numbers.
In the US, you’ve seen that income concentration has increased
dramatically. In France, as well as in other continental European
countries and in Japan, the increase has been much smaller, which
tells you that globalization cannot be the sole explanation (see
Atkinson, Piketty, and Saez 2011 for international evidence on top
income shares). What matters is how globalization interacts with
institutions or with the market structure in each country.
One of the things we’ve looked at is the role of progressive taxa-
tion. What we’ve found is that the surge in pretax top incomes is
highly correlated with measures of tax progressivity measured in a
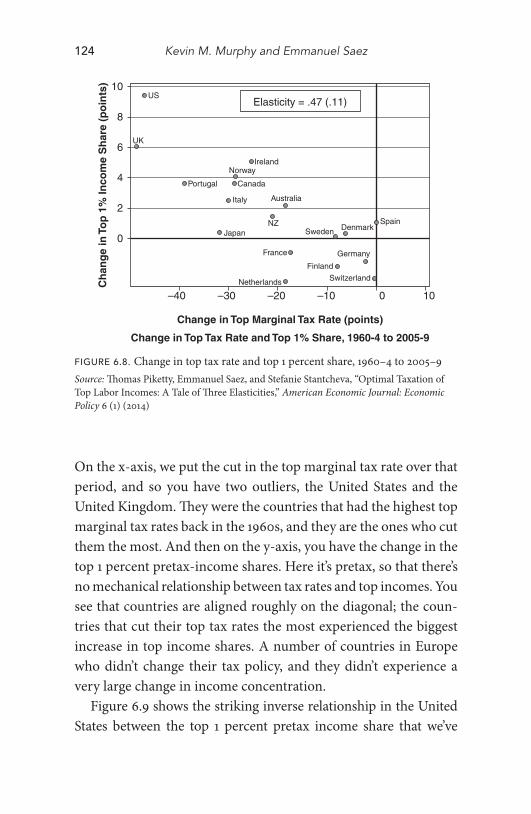
very simple way by the top marginal income tax rate. So, fi gure 6.8
is the cross-country evidence from the 1960s to the recent period.
H6781.indb 123H6781.indb 123 10/22/15 7:40:09 AM10/22/15 7:40:09 AM
124 Kevin M. Murphy and Emmanuel Saez
On the x-axis, we put the cut in the top marginal tax rate over that
period, and so you have two outliers, the United States and the
United Kingdom. Th ey were the countries that had the highest top
marginal tax rates back in the 1960s, and they are the ones who cut
them the most. And then on the y-axis, you have the change in the
top 1 percent pretax-income shares. Here it’s pretax, so that there’s
no mechanical relationship between tax rates and top incomes. You
see that countries are aligned roughly on the diagonal; the coun-
tries that cut their top tax rates the most experienced the biggest
increase in top income shares. A number of countries in Europe
who didn’t change their tax policy, and they didn’t experience a
very large change in income concentration.
Figure 6.9 shows the striking inverse relationship in the United
States between the top 1 percent pretax income share that we’ve
FIGURE 6.8. Change in top tax rate and top 1 percent share, 1960–4 to 2005–9
Source: Th omas Piketty, Emmanuel Saez, and Stefanie Stantcheva, “Optimal Taxation of
Top Labor Incomes: A Tale of Th ree Elasticities,” American Economic Journal: Economic
Policy 6 (1) (2014)
0
2
4
Ch
ang
e in
To
p 1
% In
com
e S
har
e (p
oin
ts)
6
8
10
Change in Top Marginal Tax Rate (points)
Change in Top Tax Rate and Top 1% Share, 1960-4 to 2005-9
–40 –30 –20 –10 0 10
Italy
SwitzerlandNetherlands
Denmark
Finland
SpainNZ
Australia
Canada
Sweden
Norway
Elasticity = .47 (.11)
Japan
Portugal
Ireland
France
UK
US
Germany
H6781.indb 124H6781.indb 124 10/22/15 7:40:09 AM10/22/15 7:40:09 AM
Income and Wealth in America 125
seen and, in the dotted line on the right-hand-side y-axis, the top
marginal income tax rate that has an inverse U-shape over the cen-
tury with very high top tax rates in excess of 70 percent from 1933 to
1981. Th e two curves mirror each other. How do we interpret these
strong links between top income shares and top tax rates? One view,
natural to economists, is that it refl ects a supply-side response. Th at
is, in the recent period, high earners didn’t have to pay as much
in marginal taxes, so they worked more, they generated more eco-
nomic activity, and they earned more. Another view that Josh Rauh
discussed in his presentation is that they worked more, but not in
a productive way, but rather they worked more at extracting more
pay. Th ink about academics like myself. If tax rates are low, I’m
going to chase off ers from high-paying places to increase my sal-
ary but I am not necessarily going to work more on my research. I
Top
Mar
gin
al T
ax R
ate
(%)
0
10
20
30
40
50
60
70
80
90
100
0
5
10
Top
1%
Inco
me
Sh
ares
(%
)
15
20
25
Pre-tax Top 1% share Top MTR
1913 1923 1933 1943 1953 1963Year
1973 1983 1993 2003 2013
FIGURE 6.9. Top 1 percent income share (pre-tax) and top marginal tax rate
Source: Th omas Piketty, Emmanuel Saez, and Stefanie Stantcheva, “Optimal Taxation of
Top Labor Incomes: A Tale of Th ree Elasticities,” American Economic Journal: Economic
Policy 6 (1) (2014)
H6781.indb 125H6781.indb 125 10/22/15 7:40:09 AM10/22/15 7:40:09 AM
126 Kevin M. Murphy and Emmanuel Saez
have more incentives to get a big pay increase if the tax rates are low
because I can keep a larger fraction of my pay increases.
It’s very hard to distinguish between those two stories. I’m not
going to nail it today, but I think that this is a critical question to
understand regarding what we should do about tax policy and top
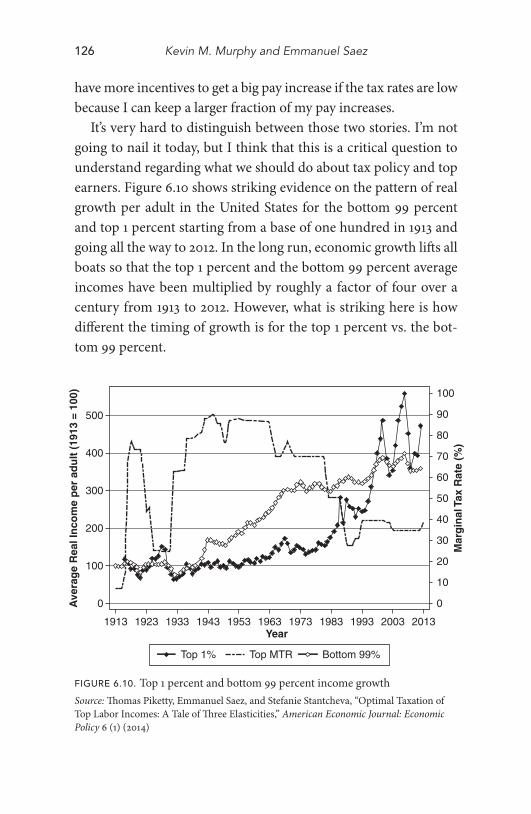
earners. Figure 6.10 shows striking evidence on the pattern of real
growth per adult in the United States for the bottom 99 percent
and top 1 percent starting from a base of one hundred in 1913 and
going all the way to 2012. In the long run, economic growth lift s all
boats so that the top 1 percent and the bottom 99 percent average
incomes have been multiplied by roughly a factor of four over a
century from 1913 to 2012. However, what is striking here is how
diff erent the timing of growth is for the top 1 percent vs. the bot-
tom 99 percent.
FIGURE 6.10. Top 1 percent and bottom 99 percent income growth
Source: Th omas Piketty, Emmanuel Saez, and Stefanie Stantcheva, “Optimal Taxation of
Top Labor Incomes: A Tale of Th ree Elasticities,” American Economic Journal: Economic
Policy 6 (1) (2014)
Mar
gin
al T
ax R
ate
(%)
0
10
20
30
40
50
60
70
80
90
100
0
100
200
Ave
rag
e R
eal I
nco
me
per
ad
ult
(19
13 =
100
)
300
400
500
Top 1% Top MTR Bottom 99%
1913 1923 1933 1943 1953 1963Year
1973 1983 1993 2003 2013
H6781.indb 126H6781.indb 126 10/22/15 7:40:09 AM10/22/15 7:40:09 AM
Income and Wealth in America 127
Th at is, if you look at the period when top tax rates were very
high, you had strong growth for the bottom 99 percent and low
growth for the top 1 percent. Th e pattern switched starting in the
1970s in the period where top tax rates went down dramatically.
You had a very large increase in top 1 percent incomes and a slow-
ing down of the bottom 99 percent income growth. Th is is a strik-
ing graph because it shows you that over a period of a few decades
the growth experienced for diff erent groups can be very diff erent.
People have talked a lot about the recent period. Th e Great Reces-
sion hit the top 1 percent and the bottom 99 percent. Coming out
of the Great Recession, we see very little growth for the bottom
99 percent and a quick recovery for the top 1 percent.
Now, let me talk briefl y about what we can say about wealth
inequality. Income and savings create wealth. I’ve done a study
recently with Gabriel Zucman using capital income-tax data to
capitalize income and to get a long-time series of wealth inequal-
ity. If you look at the bottom 90 percent wealth share in the United
States, you do see a signifi cant increase with the democratization
of wealth ownership of, fi rst, housing, then of pensions. But start-
ing in the mid-1980s, you see an erosion of middle-class wealth,
where their share goes from a peak of 36 percent down to the low
20s. And so for the top 1 percent wealth share, you get the inverse,
with a big U, and a signifi cant increase again, going from the low
20s percent in the late 1970s to 42 percent in recent years. It looks
like wealth inequality evolves similarly to income inequality. Fig-
ure 6.12 shows absolute real wealth per family from 1946 to 2012.
On the right y-axis, you have in dollars the wealth of the bottom
90 percent, and on the x-axis, multiplied by one hundred, is top
1 percent wealth. Both measures increase; but, again, the Great
Recession dramatically hit the bottom 90 percent, with no recov-
ery aft erward. Today, the bottom 90 percent fi nds itself with a
wealth level similar to the 1980s. In contrast, the top 1 percent was
hit a little bit, but then the upward trend resumed quickly.
H6781.indb 127H6781.indb 127 10/22/15 7:40:09 AM10/22/15 7:40:09 AM
FIGURE 6.11. Bottom 90 percent wealth share in the United States, 1917–2012
Source: Emmanuel Saez and Gabriel Zucman, “Wealth Inequality in the United States
since 1913: Evidence from Capitalized Income Tax Data,” National Bureau of Economic
Research, Working Paper No. 20625, 2014
0%
5%
10%
15%
20%
25%
30%
35%
40%
% o
f to
tal h
ou
seh
old
wea
lth
Year19
1719
2219
3219
2719
3719
4219
4719
5219
5719
6219
6719
7219
7719
8219
8719
9219
9720
0220
0720
12
FIGURE 6.12. Real average wealth of bottom 90 percent and top 1 percent
families
Source: Emmanuel Saez and Gabriel Zucman, “Wealth Inequality in the United States
since 1913: Evidence from Capitalized Income Tax Data,” National Bureau of Economic
Research, Working Paper No. 20625, 2014
1946
1950
0
2,000,000
4,000,000
6,000,000
8,000,000
10,000,000
12,000,000
14,000,000
0
20,000
40,000
60,000
80,000
100,000
120,000
140,000
Top
1%
rea
l ave
rag
e w
ealt
h
Bo
tto
m 9
0% r
eal a
vera
ge
wea
lth
1958
1954
1962
1966
1970
1974
1978
1982
1986
1990
1994
1998
2002
2006
2010
Top 1% (left y-axis) Bottom 90% (right y-axis)
H6781.indb 128H6781.indb 128 10/22/15 7:40:09 AM10/22/15 7:40:09 AM
Income and Wealth in America 129
By combining income and wealth, we can fi gure out what are
the savings rates that are consistent with the patterns that we fi nd.
Th e erosion of wealth of the bottom 90 percent is related to the
savings rate. It’s true that incomes didn’t do too well, but the rela-
tive decline in wealth is so large that even if you take into account
price eff ects, it has to be explained by a very low savings rate for the
bottom 90 percent. We fi nd ourselves in a world in which income
inequality is increasing, the bottom 90 percent families save less,
and, therefore, their wealth doesn’t make progress. And now, if you
look at savings rate by wealth class, the top 1 percent had very high
savings rates. At least that’s what you need to explain how their
wealth has increased so much, even taking into account that their
incomes have increased.
FIGURE 6.13. Savings rates by wealth class (decennial averages)
Source: Emmanuel Saez and Gabriel Zucman, “Wealth Inequality in the United States
since 1913: Evidence from Capitalized Income Tax Data,” National Bureau of Economic
Research, Working Paper No. 20625, 2014
–15%–10%–5%0%5%
10%15%20%25%30%35%40%45%50%55%
% o
f ea
ch g
rou
p’s
to
tal p
rim
ary
inco
me
1917
–19
1920
–29
1930
–39
1940
–49
1950
–59
1960
–69
1970
–79
1980
–89
1990
–99
2000
–09
2010
–12
Top 1% Top 10 to 1% Bottom 90%
H6781.indb 129H6781.indb 129 10/22/15 7:40:09 AM10/22/15 7:40:09 AM
130 Kevin M. Murphy and Emmanuel Saez
Th e last fact that I want to point out relates to what Josh Rauh
presented yesterday. It looks like the top wealth holders have signif-
icantly more income and, in particular, labor income. Th ey are also
younger if you look at the data. It looks like the surge in top incomes
combined with high savings rates has led to the creation of new
fortunes. We fi nd ourselves in a world where there is much more
correlation between labor income and wealth. Based on that, what
should we think about policy? If you want to prevent ever-growing
wealth and income concentration, what should you be doing? Th e
estate tax is the most direct tool to prevent self-made wealth from
becoming inherited wealth. Th at is, if we see this huge increase in
wealth concentration, and if we look at charitable- giving data, and
we don’t see the rich giving away a growing fraction of their income,
if that hasn’t changed that much over time, it has to be the case that
the fl ow of inheritance at the top is going to increase.
Another element based on Gary Becker’s work is the human
capital transmission channel. I believe it is becoming very impor-
tant because richer families can devote more resources to children’s
education. High-wealth, high-income people are going to put the
eff ort to make sure that they navigate the school system and get the
best possible education for their kids. Statistics on parental income
of students in top universities are really striking (see Chetty et al.
2015). In top universities, think about the Harvards and the Stan-
fords, over 50 percent of students come from top 10 percent fami-
lies. Over 20 percent of students come from top 1 percent families;
the human capital channel is going to be very important. We need
to fi nd ways to promote access to top schools for low-income tal-
ented kids. Caroline Hoxby and Chris Avery have fascinating work
showing that a large fraction of talented but low-income kids don’t
seem to be able to optimize the system. Th ey would be admitted
to the Stanfords and to the Harvards with very low tuition because
of fi nancial aid, and yet they don’t apply to such schools. Th ey just
don’t know how to navigate the process.
H6781.indb 130H6781.indb 130 10/22/15 7:40:09 AM10/22/15 7:40:09 AM
Income and Wealth in America 131
Rebuilding middle-class incomes is possibly the hardest prob-
lem to solve. Th ere are limits to increasing direct means-tested
transfers. First, there is the issue of marginal tax rates that Casey
Mulligan pointed out at the beginning of the conference. More
redistribution through means-tested transfers means higher mar-
ginal tax rates; and for the low-income families, high tax rates on
earnings matter in terms of their work decision. Second, I don’t
think that the US public is in favor of increased direct support for
redistribution from the government. What the public really wants
is for the market economy to deliver a more equal distribution of
income pretax. Kevin Murphy has talked a lot about schools, and I
agree with him. We can discuss that more now. Th ink about poli-
cies that can reshape the distribution of pretax income. I talked
about progressive taxes at the top. Minimum wages at the bottom,
union policies, also seem quite a bit correlated with pretax income
inequality.
In terms of rebuilding middle-class wealth, we have seen that
bottom 90 percent wealth is stagnating, mostly due to plummeting
savings rates. And now, why have savings rates fallen so much? It
could be stagnating incomes coupled with a desire to keep up your
consumption. Th at combined with fi nancial deregulation, off er-
ing ways for people to borrow, with the subprime mortgages being
the most striking example. All of that of course requires some
present-biased consumption behavior from individuals. So, how
do we think about encouraging savings of the bottom 90 percent
families? I think that here we have very good work coming out
of behavioral economics showing that default choices have much
more impact than tax incentives for savings. Th e best examples
come from the 401(k) literature. When employers make you pay
into the 401(k) with contributions, by default, we do see an enor-
mous impact on overall contributions.
Chetty et al. (2014) have done very good work in Denmark,
showing that there were higher pension contributions when that
H6781.indb 131H6781.indb 131 10/22/15 7:40:09 AM10/22/15 7:40:09 AM
132 Kevin M. Murphy and Emmanuel Saez
was made the default decision. Such defaults actually translate into
more wealth accumulation because individuals don’t off set that
with reduced savings in other accounts. In the United States, there
is a debate about expanding nudged savings through automatic
IRAs, so that this type of default savings tool is available to people
who do not have access to 401(k)s (Th aler and Sunstein 2008). Th e
fact that we observe opt-out defaults in private 401(k) plans sug-
gests that there is indeed a need here that the market is trying to
fi ll, but that might not reach the bottom 50 percent individuals
who work in jobs that don’t off er 401(k)s. Th at’s a place where we
can think about light government interventions to rebuild middle-
class wealth.
Moderator: Let me give you each a chance to comment briefl y on
what each other has said. Listening to you, it seems to me there are
kind of two diff erent views of why this has happened. Kevin has
emphasized education quite a bit. And I think that Emmanuel has
focused on marginal tax rates more. Certainly there’s a diff erence
there that’s quite clear. And, of course, there are diff erent solutions,
but that does lead you in two diff erent directions.
Murphy: I’ll go back to saying just how broad-based the growth
and inequality are. It’s hard to believe that top marginal tax rates
are really the drivers of that. One of the things that suggest a human
capital explanation is that if you look at hours by percentiles of the
distribution, you see a big steepening of the hours profi le, where
the higher-wage people are working a lot harder and lower-wage
people are working less. Even theory doesn’t say that I would see
a response mostly in the form of rent-seeking. Th ere is a greater
return to getting more income. For lots of people there isn’t a great
opportunity, I don’t think, for rent-seeking, but there is a positive-
feedback eff ect. I think that that is an important feature. Th e situ-
ation has opened up opportunities and rewards for people with
high levels of human capital. People earn more on lots of margins.
H6781.indb 132H6781.indb 132 10/22/15 7:40:09 AM10/22/15 7:40:09 AM
Income and Wealth in America 133
It’s not just hours. When we talk about labor supply, we always
think about hours, but a lot of it is eff ort, and a lot of it is occupa-
tional choice. Th ere are lots of other dimensions. I think that a key
question is: how closely tied are those things going on at the very
top with the things going on in the middle and top? Th ey’re very
coincidental time-wise.
Th e second thing that is really important is this question
of human capital. I think that we’re probably in agreement that
human capital is incredibly important. I would encourage people
to work on the human-capital area because it’s very diff erent than
physical capital. You go to work and you work with a sophisticated
piece of equipment, you go home at night, and it stays at work, and
you go home. But the human capital you take home with you. It
aff ects lots of outcomes, like your children and your health. We’ve
seen a widening of health inequality among people by education
level—partly, I think, for that same reason that human capital is a
really important ingredient.
One thing that comes up on wealth is that part of the diff erence
is that rich people and lower-income people have diff erent kinds
of wealth, so the composition of wealth can explain some of that.
Th e other thing about which we don’t talk there is of course human
wealth. And for poor people human wealth is most of the wealth
that they have by an overwhelming amount. And so you have to
leverage the picture of the world when you look at their assets. Th e
asset is a very small part of their overall budget constraint, so it’s
not surprising that they might go negative even on that one piece
of the budget constraint in terms of their behavior.
Many people talk about market failures. I think that if you
focused on markets, you’d get more discussion of how market
improvements might lead to some things which we might not like.
Th ink about credit constraints. If you have a credit constraint, it
doesn’t only apply to investing in your kids, it applies to all the
things that you would do if you could get resources today. It’s not
H6781.indb 133H6781.indb 133 10/22/15 7:40:09 AM10/22/15 7:40:09 AM
134 Kevin M. Murphy and Emmanuel Saez
surprising. If credit markets get better, guess what people who are
credit-constrained will want to do? Not save. Th ere was never a
saving constraint. It was a borrowing constraint. Th ey’re going to
borrow more than they would have otherwise. Now, you might not
like the consequences of markets getting better. I think that mar-
kets have gotten better on so many margins that would generate
the kinds of changes that we’ve seen. It doesn’t mean that we want
to make markets worse again. It just means that some of the issues
that we have are going to show up in diff erent ways.
Saez: I want to come back to the issue of human capital about
which Kevin talked. If you look historically at what has been driv-
ing college attendance rates, the role of the government seems
overwhelming here. Th at is, if you look at college graduation
rates, you see a huge increase aft er World War II because of the
GI Bill for men that you don’t see for women. Here in Califor-
nia the master plan that was decided by former Governor Brown
played a huge role in expanding access to higher education. When
we see the retreat of state funding for higher education, the market
substitutes that we get are the for-profi t colleges that don’t seem
to be working nearly as well or as eff ectively as community col-
leges. Th at’s why it’s very hard for me to believe that education is
like another good. My question is: could education ever be a good
where people see the quality and know what they are shopping
for? I’m not an expert, but of all the facts that I’ve seen, it strikes
me that there are very big diff erences. People are not able to shop
optimally for education.
Th e recent work by Hoxby and Avery (2013) was mind-boggling
to me. You have in the United States many talented kids who could
get into Stanford and Harvard, paying very little tuition, and yet
they don’t apply. Th at’s why I’m not as confi dent as Kevin that a
free market for education would improve education.
Murphy: I would say that the striking thing to me is not so much
at higher education. I agree, to navigate that market requires some
H6781.indb 134H6781.indb 134 10/22/15 7:40:09 AM10/22/15 7:40:09 AM
Income and Wealth in America 135
education. I don’t think that people from less-educated back-
grounds, with parents from less-educated backgrounds, navigate
that market as well. But at least they have the opportunity to nav-
igate that market. When it comes to elementary and secondary
education, so many people just don’t even have the opportunity to
shop. Th ey can shop in a variety of stores. Th ey maybe don’t want
to shop, and it may be hard to get to my neighborhood, and shop
in the stores in my neighborhood, but they can go there. In educa-
tion, other people can’t shop in my stores. I’ve got stores available
to me. Th ere’s a high school right next to my house to which lots of
people from the city of Chicago would love to go. Th ey do not have
the opportunity to shop in that store.
Maybe there’s 20 percent to 30 percent of those people who
wouldn’t know that that’s the store to go to, but there’s 70 percent
or 80 percent of them who know quite well that they’d rather go
to that school than to the one that they’re going to right now. In
fact, I would bet that 99 percent of them, if you asked them, do you
want to go to the one next to Kevin’s house, or do you want to go to
your school, would say, “I want to go to the one by Kevin’s house.”
Today, it’s not a market. Th ere’s a market for property, but then that
gets us into all of these other issues of how do you actually get into
that school. I think that the lack of a market in elementary and
secondary education is incredible.
We can try to tackle inequality on the back end, but that’s an
inferior solution. Transferring people money, and thinking it is
going to make up for the lack of skills and education that those
people have, is not a good solution. In a world where you’re doing
more and more health at home, you’re doing less of it in the hospi-
tal. More and more, you’re supposed to monitor your own health,
take your own drugs on time. Health, educating your kids, all of
this requires human capital. Th e tough part of this is that human
capital is an incredibly long-lived asset. It lasts a long time. Fixing
this problem is going to take a long time because we know that
H6781.indb 135H6781.indb 135 10/22/15 7:40:09 AM10/22/15 7:40:09 AM
136 Kevin M. Murphy and Emmanuel Saez
you can’t just go to all of the twelft h graders today and correct all
of the mistakes you made in the fi rst twelve years of education.
Th at’s a hard thing to do. If we fi x it for kindergartners, it’s going to
be sixteen years before they graduate from college. It’s going to be
thirty-fi ve years before they’re half of the labor force. But, we’ve got
to do it because it’s important for their labor market success and
their success in other areas like health. It’s important for individu-
als but it is also important for other low-skilled people. To me, it’s
just got to be the way to go.
Saez: I totally agree that improving human capital is fundamental.
I agree that in the current US system, public schools are too low-
quality in too many places. Th e question is: how do we improve the
schools? Th at’s what we should be debating.
Murphy: But how do we do it? By spending more money? We
already spend a lot of money. Th e Chicago schools are not cheap
schools. Th ey are not schools that lack for dollars. Th ey’ve got lots
of dollars fl owing into them. Th ey probably spend as much on that
school to which no one wants to go as they spend on the school
next to my house, maybe more. Now, maybe they need to spend
even more than that, because we’ve got defi ciencies in the house-
hold and things like that. But I’m skeptical as to whether pushing
more money into that school is really going to be the answer. Forc-
ing that school to compete for students, to me, is a much better
thing to do.
Question and Answer Session
QUESTION: Th e historical thing that I wanted to mention is that
if you look at the early nineteenth century, when industrializa-
tion began to increase in England, it had a terrible eff ect on the
lower-class peasants who were moving into cities. If you read John
Hicks, for instance, you will see that it took a while for the rest of
H6781.indb 136H6781.indb 136 10/22/15 7:40:09 AM10/22/15 7:40:09 AM
Income and Wealth in America 137
the population to benefi t. Th e early industrialists benefi ted enor-
mously but, by the middle of the century, things began to improve
for a much larger group. Now, we live in a very similar period.
Two things have happened in the last ten years or twenty years.
One is globalization. Th e other one is the high-tech revolution.
Shouldn’t we give it a bit of time? We’re only looking at a ten-
year period, and you say that these wages have really gone up.
Well, that’s because the rest of society hasn’t caught up with it. To
acquire the kind of human capital about which Kevin Murphy
is talking, takes a while. It’s not a magic wand that you can just
move, and then things will begin to catch up. We need to have
some time, so that the rest of society can also catch up with it.
SAEZ: Yes, it took a very long time for the technology progress
to translate into higher pretax income, but the second very big
transformation that you have is the increase in the size of gov-
ernment. In the nineteenth century, the government was tak-
ing in taxes around 10 percent of GDP in all countries. By the
mid-twentieth century, you’re up to 35 percent for countries
like the United States and even higher in Europe. So, by devel-
oping the big programs about which we all know—education,
health insurance, and retirement—the government changed
things dramatically in terms of the distribution of income. In
terms of wealth, I agree with you that a lot of the reason that
middle-class wealth has eroded is taking on extra debt for col-
lege through student loans.
MURPHY: One thing that I would add on the college and savings
is that this gets the stuff about which Casey talked yesterday. It’s
not just spending on college. Th ere’s an enormous tax on sav-
ings if you save to send your kids to college because of the way
that fi nancial aid is calculated. Th ey look at how much you can
aff ord to pay. Th ey factor in about 40 percent of your savings.
It’s incredible the tax rate that they put on savings and say, that’s
H6781.indb 137H6781.indb 137 10/22/15 7:40:09 AM10/22/15 7:40:09 AM
138 Kevin M. Murphy and Emmanuel Saez
how much we’re going to reduce your access to either grants or
loans, which clearly is going to have an eff ect above and beyond
just actually spending. It doesn’t pay to have it. Th e other one is
the long history. One thing I think is important to think about
is that we tend to think about steady-state models. I don’t think
the twentieth century, from the human capitalist perspective,
looks like a steady state. We’re spending more and more time,
a bigger share of income, investing in human capital. Th e ques-
tion is: was that going to keep going on forever? And was that
going to inevitably lead to the supply side falling short of the
demand side? I don’t know, but it’s something important to
think about.
QUESTION: Th ank you both, of course, for interesting papers. I have
a small question, though, about the data. And, I may be completely
wrong, but I want to take us back to the 1980s when tax rates were
very high. It almost became a national game to convert income
into capital gains. People were doing all kinds of things to do that.
Th ere were then clubs formed. One dentist, one doctor, one law-
yer, one carpenter, etc., who provided services. I wonder whether
in fact part of what you see is actually not so much an increase in
the incomes of the top as an increase in the recorded incomes once
tax rates are lower, and therefore the amount of eff ort it takes to
go into all of these activities is less profi table because you’re not
paying as much tax when you don’t do it.
SAEZ: Th ank you very much for this question, which is very impor-
tant, and indeed conservative commentators have looked at our
numbers and said: “Look! Th is doesn’t have anything to do with
inequality. It might be just an artifact of tax avoidance. When
tax rates are high, the rich are going to make sure to fi nd ways to
hide their income, so that it’s not taxable.” It is a very important
question to address. Th omas Piketty and myself are also public
economists so we are very interested in taxes and in behavioral
H6781.indb 138H6781.indb 138 10/22/15 7:40:10 AM10/22/15 7:40:10 AM
Income and Wealth in America 139
response to taxation. We’ve looked for a lot of that. It is true
that following tax episodes, you can see shift ing of income from
the corporate form to the individual form depending on which
form of organization is tax-favored. So in the series that I have
presented, indeed, we add back realized capital gains because
a lot of the games for tax avoidance were through converting
ordinary income into capital gains.
One simple piece of evidence that strongly suggests that the
rich have indeed become richer comes from charitable giving,
because charitable giving is tax-deductible. When tax rates are
high, that’s when you want to give to charities. Yet if you look
at the pattern of charitable giving of those high-income peo-
ple, the trend follows almost exactly parallel to their reported
incomes. Top 1 percent income earners were giving around
4 percent of their reported income to charities in the 1960s.
Today, they are giving about the same fraction of their reported
income. Because top reported incomes have grown so fast, the
charitable giving of the wealthy has also grown very fast. Th at
shows you that their real incomes must have increased as well.
Otherwise, how is it that they would be able to give so much
more now when the tax incentive to give is smaller?
QUESTION: I appreciate the necessity of looking at income and
wealth data, but it seems like there’s an invisible elephant in the
room that should be paid attention to. Th at is, what is happening
to consumption over time? I think a strong case can be made that,
in many areas, the equality of consumption has increased. Ordi-
nary people today, maybe in many cases poor Americans, can
consume things that only the rich could consume just a generation
or two ago. I think that it’s an important fact. It’s something that’s
oft en overlooked when we look at the monetary fi gures.
MURPHY: I think that that’s really important, and I’ve seen you
present things on that. I’ve done things like that for my class
H6781.indb 139H6781.indb 139 10/22/15 7:40:10 AM10/22/15 7:40:10 AM
140 Kevin M. Murphy and Emmanuel Saez
where you really can see that a pair of jeans cost about the same
at Wal-Mart as it did when I was a kid, to get a pair of jeans in
nominal terms. Look at lots of other goods. I used to tell the
story of the $5 iron that I bought. I bought an iron. I couldn’t
fi gure out how anybody in the world could make an iron, and
put it in a box, and ship it to Target and sell it to me for $5.
Th ose kinds of things are really amazing in terms of progress!
You’ve got to take all of these price defl ators with a grain of salt
on the aggregate. Th e more interesting question is: should we
be using diff erential defl ators for diff erent groups? I think there
is some indication that that would undo some of the inequality
that we see. However, I don’t think that anybody’s done enough
to know exactly how to do that, but I think that it’s an important
question.
SAEZ: I agree. It is extremely important to look at consumption,
but you see, with income, you pay taxes, and then you consume
or you save. Savings go into wealth, so all of those things are
linked. Our numbers suggest that the high incomes are sav-
ing a substantial fraction. In principle you could back out their
consumption. Consumption inequality must have increased
because I don’t think that the surge in top incomes goes all into
savings. Probably a signifi cant chunk goes into consumption,
but those are numbers we want to produce. I should say that,
unfortunately, data on consumption and savings in the United
States are really bad in part because we can only measure it
through surveys. Th ere’s a lot of measurement error, and you
cannot measure what happens for the top 1 percent with survey
data. Th at’s a problem if you want to evaluate serious proposals
to shift to a progressive consumption tax. What we argue is that
we should collect more. It wouldn’t take that much extra by the
US Treasury for tax enforcement purposes to collect a few more
numbers about balances that would cast a lot of light on those
issues of what is consumption inequality.
H6781.indb 140H6781.indb 140 10/22/15 7:40:10 AM10/22/15 7:40:10 AM
Income and Wealth in America 141
QUESTION: Th ank you. I just want to add a response to Kevin’s
response. If you look at, say, the price of Facebook. We know what
it all is. It’s zero. And so, when it’s introduced, and it’s introduced at
a zero price, everyone gets that. It doesn’t show up in anything. It
doesn’t show up in any consumption data, and yet it’s enormously
valuable for many people. Th e other thing I’m going to point out
is if you look at the marginal tax-rate cut, it went from 70 percent
down to 50 percent in 1982, went to 28 percent in 1987 or 1988.
And so here’s one source of income you really can’t look at, inter-
est on municipal bonds. You had high marginal tax-rate people in
the 1970s buying municipal bonds like crazy because they could
get a low rate, but it wasn’t taxed at all at the federal level. Rate
cuts happened. Th rough the 1980s, people shift ed out of munici-
pal bonds into taxable bonds. It then shows up as income on their
tax form, and it didn’t even show up as income on their tax form
before. I grant your point about charity being one of the pieces of
evidence to make me wonder on the margin. I just don’t think that
that’s strong enough evidence to go against these things.
SAEZ: Regarding municipal bonds, that’s a good one to ask because
for the wealth data, we have to distribute municipal bonds, so
you see tax-exempt interest income from municipal bonds aft er
1986. What you fi nd there is that the top 1 percent in 1987–1988,
when we started seeing the data, already had something like
75 percent of all municipal bonds. So, we assume the top 1 per-
cent wealthiest had 75 percent of all municipal bonds before
1986. At the maximum, they are going to have 100 percent of
municipal bonds. So even if you make the extreme assumption
that the top 1 percent held all of the municipal bonds, it’s not
going to have a large impact on the series, but that goes with the
line of tax avoidance, etc. We, who study taxes and the behav-
ioral responses they create, love that stuff , and we’ve been doing
studies over the years, and we’ll continue doing that. Your point
is well-taken.
H6781.indb 141H6781.indb 141 10/22/15 7:40:10 AM10/22/15 7:40:10 AM
142 Kevin M. Murphy and Emmanuel Saez
COMMENT: We know that what is upsetting the public is not the fact
that rich people are getting richer, it’s the fact that middle-class
people have taken a very substantial hit in income over the past
six years. Th ere’s only one reason for that, and that’s the crisis. If
you look at wage rates, they have stayed on their trends. You don’t
see any. Th ere’s no evidence whatsoever of the eff ect of this crisis.
It’s all on the amount of work being done, and not on the amount
that works gets per hour. I’ve done a lot of work recently on trying
to understand why those eff ects should be so large and so durable.
Th e output currently is about 13 percent below where it would
have been without the crisis.
Th at of course refl ects directly into incomes. Part of it is the loss
of the capital stock that occurred. Th at’s quite big. It’s over three
percentage points of that. But the other big chunk is that partic-
ipation in the labor force has declined. Th at coincides with an
expansion of very badly designed benefi t programs. Th is is obvi-
ously something on which Casey Mulligan is an expert, especially
food stamps. Th e design of food stamps is a great puzzle to me, but
there was a doubling in the food-stamp population, and most of
that has remained. In fact, the food-stamp dependency has risen
recently, in spite of the fact that the economy has been expanding,
even though almost everyone says that the reason for that dou-
bling was the rise in unemployment.
Th e decline in unemployment has not shown up in any signifi -
cant diminution of food stamps. Food stamps have a 30 percent
marginal tax rate, so not surprisingly, almost everyone on food
stamps does not even consider participating. We need to take this
seriously. Th e other big one of course is Social Security disability.
A lot of very good work has been done about how that program
should be changed to become a pro-work program as opposed to
an anti-work program, which is what it is now. Th e same thing
applies to food stamps. Food stamps have gotten much less atten-
tion even though the program has vastly more dependence.
H6781.indb 142H6781.indb 142 10/22/15 7:40:10 AM10/22/15 7:40:10 AM
Income and Wealth in America 143
QUESTION: I have one comment, one quick technical question, and
one broader question. Let me start with the technical question.
Emmanuel, did you guys gross up your tax-dividend data to be
consistent with the national accounts, because in addition to the
changes in the tax laws, precisely over this period, there’s been a
series of changes in reporting requirements from fi nancial institu-
tions, for example, to report dividend payments. So, the question
is, are you capturing that by trying to gross up to some non-tax-
generated estimate of dividends by fi rms, for example?
Th e second point is on price indexes. Our price indexes include
the feeding in of consumer prices into the GDP defl ator, which is a
Fisher index, so that they don’t have the substitution-bias issues,
but it has a well-documented outlet substitution bias, precisely
because the BLS (Bureau of Labor Statistics) keeps going back to
the same outlets and assumes that people don’t change where they
shop or how they shop or even when they shop. Th ey still collect
data the second week of the month. So the fact that people buy
stuff the week aft er Christmas or take advantage of sales doesn’t
get included.
My broader question is a generalization of an earlier point,
a point that other people have made about what we’re examin-
ing here. Th ere’s been an enormous increase in what some people
have called Social Security or Medicare transfer wealth—that is,
for the bottom part of the distribution. A large part of their wealth
is annuitized real benefi ts that are going to be provided by the
government. And so, I’m just wondering if you’re going to look at
that when you move to look at post-tax and transfer income. Th is
also, because of those programs, is a period where we’ve trans-
ferred huge amounts of resources, actually and then prospectively
even more from the young taxpayers to old consumers. Th at may
be part of what’s going on in the saving rate issue.
MURPHY: I agree on most of those issues. One thing that I would
say is, when it comes to wealth on the housing side, it seems
H6781.indb 143H6781.indb 143 10/22/15 7:40:10 AM10/22/15 7:40:10 AM
144 Kevin M. Murphy and Emmanuel Saez
to me that you’ve always got to remember that it’s on the other
side of the budget constraint as well. So, when your wealth
goes down because your house is worth less, particularly if
you’re a young person, it’s not clear you really are worse off in
a present-value sense because you needed a place to live for
the rest of your life anyway. So, if I’m old and going to sell my
house in ten years, that’s a diff erent story than if I’m a young
guy. We always include the housing value, but we don’t con-
sider the cost, which is mirrored on the other side of the bud-
get constraint.
SAEZ: Right now in our income measures we don’t gross up to
match national accounts, but as I said in my fi rst slide, that’s
really the next point in our agenda. We have already put in place
a lot of the elements to be able to distribute national income
where everything will fi t with the national accounts, and trans-
fers will be taken into account no longer in the static way, per-
haps in a dynamic way, perhaps along the lines you suggest.
QUESTION: I want to take a step back and ask a more general ques-
tion that pertains to Emmanuel Saez, and Chad Jones’ talk yes-
terday, and even to Kevin Murphy. By far the biggest change over
the past three decades is that a half billion people in the world
went from extreme poverty to the middle class. Th at’s a decline
in income inequality. We keep talking about how world income
inequality has gone up. Th at’s because you do it within country
rather than across the whole world. Now, that’s important for a
couple of reasons. First of all, it’s important because it’s not clear
to me that the country is the relevant unit of analysis when I’m
thinking of r – g.
It may be that the world is the appropriate unit because we
want to think about productivity for the world population growth
and so forth. Emmanuel, I think, probably gave the best reason
for why you’d want to do it within country, and that is that you
H6781.indb 144H6781.indb 144 10/22/15 7:40:10 AM10/22/15 7:40:10 AM
Income and Wealth in America 145
have policies that are country-based. But even if I think about it in
those terms, I think, “Well, what are the most important policies
that have had to do with this major transformation in raising the
incomes of the poor?”
We’re talking about India and China, and I think there is sim-
ply no denying that the market reforms that occurred in the 1980s
and 1990s in China and in the early 1990s in India are the single
most important factor for raising the incomes of the poor. So I’m
a heck of a lot more concerned about what’s happened to the low-
est 10 percent of the world than I am the upper 0.1 percent, and
I’d like for you guys to comment on it. It’s one part of the whole
inequality debate that’s been missed at this conference, and I think
to my mind the most important part of it.
MURPHY: I agree that you want to take a worldwide perspective on
these things. Th at is an important ingredient. It’s related to what
happens here. Th ere is at least some spillover from those events
to the events that we see in these countries. Th e reason that I
think you still need to care about inequality is because I think
that it will be a driver of policy. I think that you’re going to do
something. I think that Emmanuel is saying the same thing. It’s
going to push us to do something, and we’d better do something
smart. If it pushes us to do something that improves the human
capital side of things, that’s actually a good thing.
SAEZ: I agree from a development perspective, the rise of incomes
in low-income countries is the most important factor. Again,
we share a lot of our incomes at the country level. Remember,
governments in advanced economies take 35 percent to 50 per-
cent of market incomes to fund public goods and the welfare
state. Within a country, people are willing to share a substantial
fraction of their income. You compare yourself not with people
in China, but with people in your country. Th at’s why the issue
of inequality within country is for us to stay no matter what
happens to economic growth.
H6781.indb 145H6781.indb 145 10/22/15 7:40:10 AM10/22/15 7:40:10 AM
146 Kevin M. Murphy and Emmanuel Saez
References
Atkinson, Anthony, Th omas Piketty, and Emmanuel Saez. 2011. “Top Incomes in
the Long Run of History.” Journal of Economic Literature 49 (1): 3–71.
Chetty, Raj, John Friedman, Soren Leth-Petersen, Torben Nielsen, and Tore
Olsen. 2014. “Active vs. Passive Decisions and Crowd-out in Retirement Sav-
ings Accounts: Evidence from Denmark.’’ Quarterly Journal of Economics 129
(3): 1141–1219.
Chetty, Raj, John Friedman, Emmanuel Saez, Nicholas Turner, and Danny Yagan.
2015. “Does Higher Education Promote Opportunity or Maintain Privilege?
Evidence from US Tax Data.” American Economic Review: Papers and Proceed-
ings, upcoming, May.
Hoxby, Caroline, and Christopher Avery. 2013. “Th e Missing ‘One-Off s’: Th e Hid-
den Supply of High-Achieving, Low-Income Students.” Brookings Papers on
Economic Activity, Spring: 1–65.
Piketty, Th omas, and Emmanuel Saez. 2003. “Income Inequality in the United
States, 1913–1998.’’ Quarterly Journal of Economics 118 (1): 1–39.