Page 1
CHARACTERISATION OF CHONDROCYTE
MATRIX RESPONSES UNDER BIAXIAL
LOADING
ILLIDA BINTI MOHD NAWI
DISSERTATION SUBMITTED IN FULFILMENT OF
THE REQUIREMENTS FOR THE DEGREE OF
MASTER OF ENGINEERING SCIENCE
FACULTY OF ENGINEERING
UNIVERSITY OF MALAYA
KUALA LUMPUR
2011
Page 2
ii
Abstract
In vivo, during mechanical loading, articular cartilage is exposed to a complex
biophysical environment. These biophysical and biochemical concepts have not yet
been fully understood due to intricate combination of direct, shear and tensile
compressive strains on articular cartilage. Mechanical forces and deformations are
sensed by cells and turned into biochemical signals; which evolution is essential in
regulating chondrocyte function; both in metabolic and catabolic modus operandi. The
main objective of this study is to investigate the influence of biaxial loading on
chondrocytes. This thesis will also describe the strain rate influence of biaxial loading
on chondrocytes in 3D agarose scaffold in different types of waveform. Prior to the core
studies, an optimized protocol to harvest the highest numbers of viable cells was
obtained. These allow the preparation of a sufficient quantity of cells for high seeding
density, which in turn promotes the expression of normal chondrocytic phenotype and
facilitates cartilage repair. This study modulated parameters such as collagenase type,
enzymatic duration and collagenases‟ concentration in order to obtain the highest cell
yield and viability. From this study, maximum cell yield was harvested from the two-
step digestion with 1-hour digestion of protease and 16-hour in collagenase type-II,
without jeopardizing their viability. Cell yield obtained with this protocol was 14
million cells per ml (±0.41% SEM) and cell viability of 97.5% (±0.19% SEM).
Consequently, obtained chondrocytes were seeded in 4% three-dimensional agarose
constructs. Seeded constructs were exposed to cyclic loading of 10% direct compressive
and/nor 1% shear strain(s) to see the effect of biaxial and uniaxial loadings. A novel-
designed bioreactor was used to deliver the loads. The load was delivered for two 12
Page 3
iii
hours-blocks, at a frequency of 1Hz, with 12 hours resting period in the middle. The
incubator-housed bioreactor is used to give various types of waveforms to the
constructs. The suspension was analyzed for DNA content using Hoechst 33258 dye
with calf thymus DNA as a standard. GAG was measured with DMB assays and
chondroitin-4-sulphate was used as the reference solution. The need for pre-culturing
before exposure to biaxial loading was also examined. Predominantly, chondrocytes
favoured to be pre-cultured for 24 hours upon seeding before being subjected to any
load and prefer biaxial loading to increase GAG levels. Biaxial loading shows
stimulatory effect on matrix synthesis with 1.5-fold increase in GAG production of
chondrocytes upon being exposed to biaxial loading vs. uniaxial loading. Nevertheless,
chondrocytes seem to favour for sinusoidal loading when it comes to proteoglycans
synthesis.
This study has moved research into the effects of mechanical loading on cartilage
regeneration a step forward. Due to the complex structure of cartilage – anisotropy and
heterogeneity, articular cartilage subjected to mechanical loading has been shown to
activate multiple regulatory pathways; upstream signalling, transcription, post-
translational modification and vesicular transport. Mechanical loading such as
simultaneous matrix stretch and compression facilitates transportation of molecules and
nutrients. Signalling mechanisms due to cyclic loading involve the actin cytoskeleton,
stretch-activated ion channels and activation of tyrosine kinase.
Page 4
iv
Abstrak
In vivo, tulang rawan sendi terdedah kepada persekitaran biofizik yang kompleks
sepanjang beban mekanikal. Konsep biokimia dan biofizik ini belum difahami
sepenuhnya kerana kombinasi rumit antara tekanan langsung, luncuran dan ketegangan
pada tulang rawan artikular. Daya mekanik dan deformasi ini dialami oleh sel-sel dan
diubah menjadi isyarat-isyarat biokimia. Evolusi ini sangat penting dalam mengawal
fungsi sel kondrosit, baik dalam modus operandi katabolik mahupun metabolik. Tujuan
utama penyelidikan ini adalah untuk melihat pengaruh beban biaksial terhadap
kondrosit. Tesis ini juga akan menjelaskan tahap pengaruh regangan pembebanan
biaksial dalam pelbagai bentuk gelombang pada kondrosit dalam skafold 3D
agarose. Sebelum kajian tersebut, suatu protokol bagi mengoptimumkan tuai angka sel
yang hidup tertinggi diperoleh. Dengan adanya protokol ini, bilangan sel yang banyak
akan membolehkan adanya jumlah sel yang cukup untuk kultur kepadatan sel yang
tinggi, yang kemudiannya akan memupuk ekspresi fenotip chondrocytic yang normal
dan membantu proses pembaikan tulang rawan. Penyelidikan ini dimodulasi oleh
beberapa parameter seperti jenis enzim kolagenase, tempoh pendedahan terhadap enzim
dan konsentrasi kolagenase untuk mendapatkan bilangan sel yang tertinggi dan
peratusan sel hidup. Dari kajian ini, bilangan sel maksimum dituai daripada pencernaan
dwi-langkah dengan 1 jam pencernaan menggunakan enzim protease dan 16 jam dalam
kolagenase-II, tanpa mengorbankan tahap peratusan sel hidup. Bilangan sel diperolehi
dengan menggunakan protokol ini adalah 14 juta sel per ml (±0.41% SEM) dan sel
hidup sebanyak 97.5% (±0.19% SEM).
Page 5
v
Seterusnya, kondrosit yang diperolehi dikultur dalam skafold tiga dimensi yang
diperbuat daripada 4% agarose. Skafold yang mengandungi kondrosit didedahkan
kepada beban siklik yang terdiri daripada tekanan langsung sebanyak 10% dan / tanpa
regangan luncuran sebanyak 1% untuk melihat pengaruh beban uniaksial dan
biaksial. Bioreaktor rekaan nobel digunakan untuk memberikan beban. Muatan
diberikan selama dua blok 48 jam, pada frekuensi 1 Hz (12 jam beban: 12 jam tanpa
beban). Bioreaktor yang ditempatkan di dalam inkubator ini, digunakan untuk
memberikan pelbagai jenis bentuk gelombang terhadap sel. Suspensi sel kemudiannya
dianalisa untuk kandungan DNA menggunakan pewarna Hoechst 33258 dengan thymus
DNA anak lembu digunakan sebagai standard. GAG diukur dengan ujian DMB dan
chondroitin-4-sulfat digunakan sebagai rujukan. Selain itu, keperluan pra-kultur selama
24 jam selepas pencampuran sel sebelum didedahkan kepada beban biaksial juga
diperiksa. Secara dominan, pra-dikultur sel selama 24 jam selepas dimasukkan ke dalam
skafold kepada kondrosit sebelum dikenakan beban lebih memberi kebaikan. Kondrosit
juga lebih menjurus kepada beban biaksial untuk peningkatan tahap GAG yang
optimum. Beban biaksial menunjukkan kesan stimulasi pada sintesis matriks dengan
kenaikan 1.5 kali ganda dalam produksi GAG oleh kondrosit yang mengalami beban
biaksial berbanding uniaksial. Selain dari itu, kondrosit menunjukkan advokasi terhadap
pembebanan secara sinusoidal untuk sintesis proteoglycan yang lebih maksimum.
Penyelidikan ini telah membawa kajian kesan pembebanan mekanik pada regenerasi
tulang rawan setapak ke hadapan. Oleh kerana struktur kompleks tulang rawan yang
anisotropik dan heterogenitas, beban mekanikal yang dialami tulang rawan telah
mengaktifkan beberapa percaturan; yakni isyarat pertambahan, transkripsi,
pengubahsuaian pasca-translasi dan pengangkutan vesikuler. Beban mekanikal seperti
Page 6
vi
peregangan matriks serentak dengan mampatan membantu pengangkutan molekul dan
nutrisi. Mekanisma penghantaran isyarat akibat beban siklik melibatkan sitoskeleton
aktin, ion saluran aktif regangan dan pengaktifan kinase tirosin.
Page 7
vii
Acknowledgement
I would like to show my heartful thanks and appreciation to my supervisor Dr.
Belinda Murphy. She has made available her supports in a number of ways, including
the times when she told me to get out from her lab and move forward. It is her
encouragement, supervision and support from the preliminary to the concluding level
enabled me to develop an understanding of the research. I would also like to thank Mr.
Vincent Murphy, for relentlessly giving suggestion when I was stuck in the middle of
the project.
I also owe my deepest gratitude to my husband who has been helpful and
understanding throughout the process of this project. He has been struggling to balance
between listening to me nagging about this project, taking care of our son and helping
with the house chores.
This thesis is especially dedicated to my 3-year old son who had to stay at the
childcare centre until late night, waiting for me finishing up my lab work. I am deeply
sorry for the time we spent apart.
I would also like to show my gratitude to my father who constantly calling and
reminding me of my datelines. He has also provided me with necessary assistance with
my data analysis.
Thanks to Mr. John Temesi who proofread my thesis and million thanks to the lab
technician, Mr. Adhli Iskandar, my colleagues, and lab mates.
Last but surely not the least, my deepest appreciation to my family for always being
there cheering me up and stood by me through the good and bad times.
Page 8
viii
Table of Contents
Abstract ................................................................................................................. ii
Abstrak ................................................................................................................ iv
Acknowledgement ...................................................................................................... vii
Table of Contents ...................................................................................................... viii
List of Figures .............................................................................................................. x
List of Tables ............................................................................................................. xvi
List of Symbols and Abbreviations ......................................................................... xviii
Chapter 1. Introduction ............................................................................................. 1
1.1. Tissue Engineering ...................................................................................... 1
Thesis Structure ........................................................................................................ 6
1.2. Aims and Objectives ................................................................................... 6
Chapter 2. Literature Review .................................................................................... 8
2.1. Cartilage ...................................................................................................... 9
2.2. Chondrocytes ............................................................................................ 21
2.3. Tissue Engineering of Cartilage ................................................................ 26
2.4. Mechanotransduction ................................................................................ 28
Chapter 3. Methodology ......................................................................................... 39
3.1. Methods in Cell Isolation .......................................................................... 39
3.2. Methods in Culture Preparation ................................................................ 45
3.3. Methods in Biomechanical Stimulation .................................................... 50
3.4. Bioechemical Assays ................................................................................ 53
3.5. Statistical Analysis .................................................................................... 58
Chapter 4. Study 1 (Chondrocyte Isolation) ........................................................... 59
4.1. Introduction ............................................................................................... 59
Page 9
ix
4.2. Methods ..................................................................................................... 60
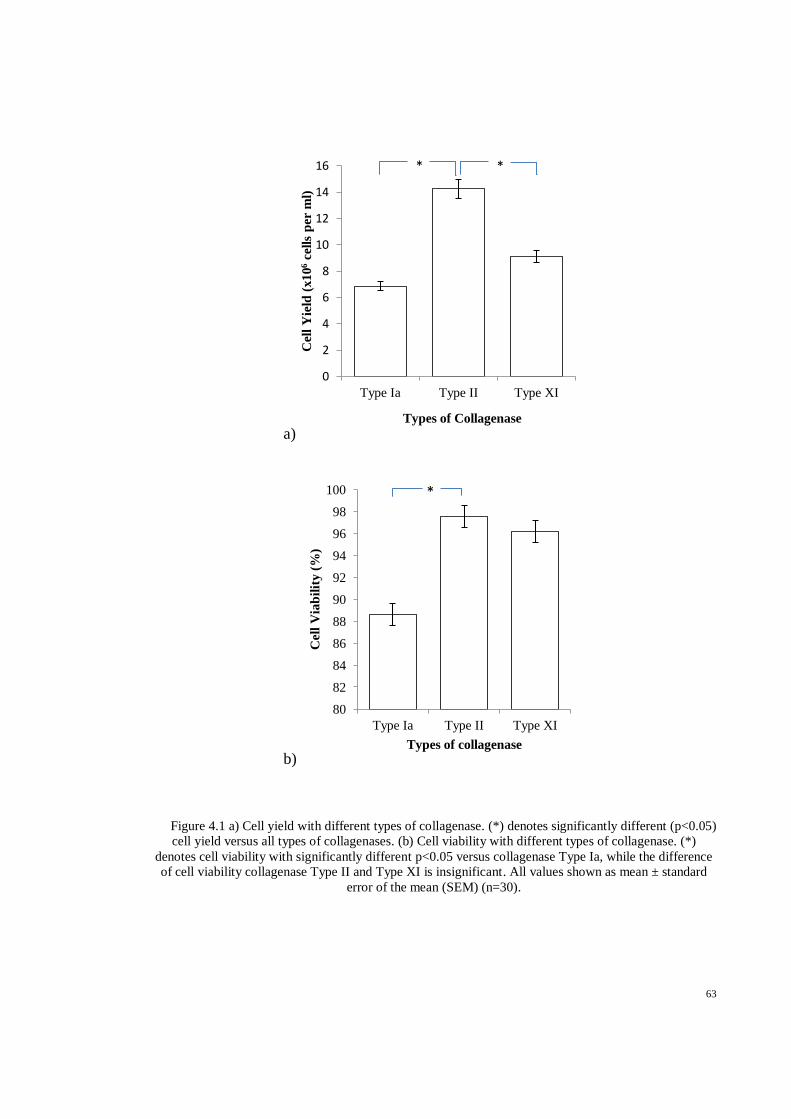
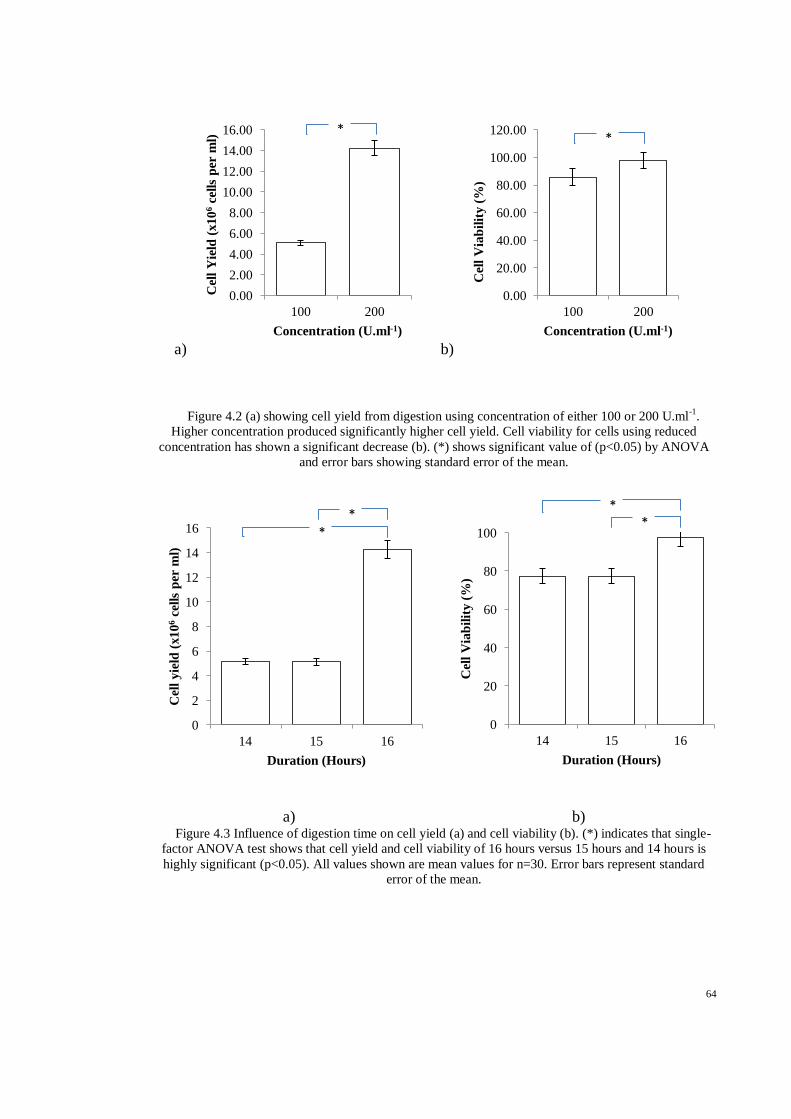
4.3. Results ....................................................................................................... 61
4.4. Discussion ................................................................................................. 65
Chapter 5. Study 2 (Effects of Dynamic Uniaxial Loading on Cellularity and ECM
Production) 69
5.1. Introduction ............................................................................................... 69
5.2. Methods ..................................................................................................... 70
5.3. Results ....................................................................................................... 71
5.4. Discussion ................................................................................................. 74
Chapter 6. Study 3 (Effects of Dynamic Biaxial Loading on Cellularity and ECM
Production) 77
6.1. Introduction ............................................................................................... 77
6.2. Methods ..................................................................................................... 78
6.3. Results ....................................................................................................... 79
6.4. Discussion ................................................................................................. 82
Chapter 7. Discussion ............................................................................................. 84
7.1. Introduction ............................................................................................... 84
7.2. Is biaxial loading beneficial to the metabolic response of chondrocytes? 84
7.3. Is Pre-Culture Advantageous To The Chondrocyte Response? ................ 92
7.4. General Data Analysis ............................................................................ 101
7.5. Experimental System .............................................................................. 108
Chapter 8. Conclusion ........................................................................................... 114
8.1. Introduction ............................................................................................. 114
8.2. Possible Mechanotransduction Pathways ............................................... 114
8.3. Future Work and Recommendation ........................................................ 117
References 120
Page 10
x
List of Figures
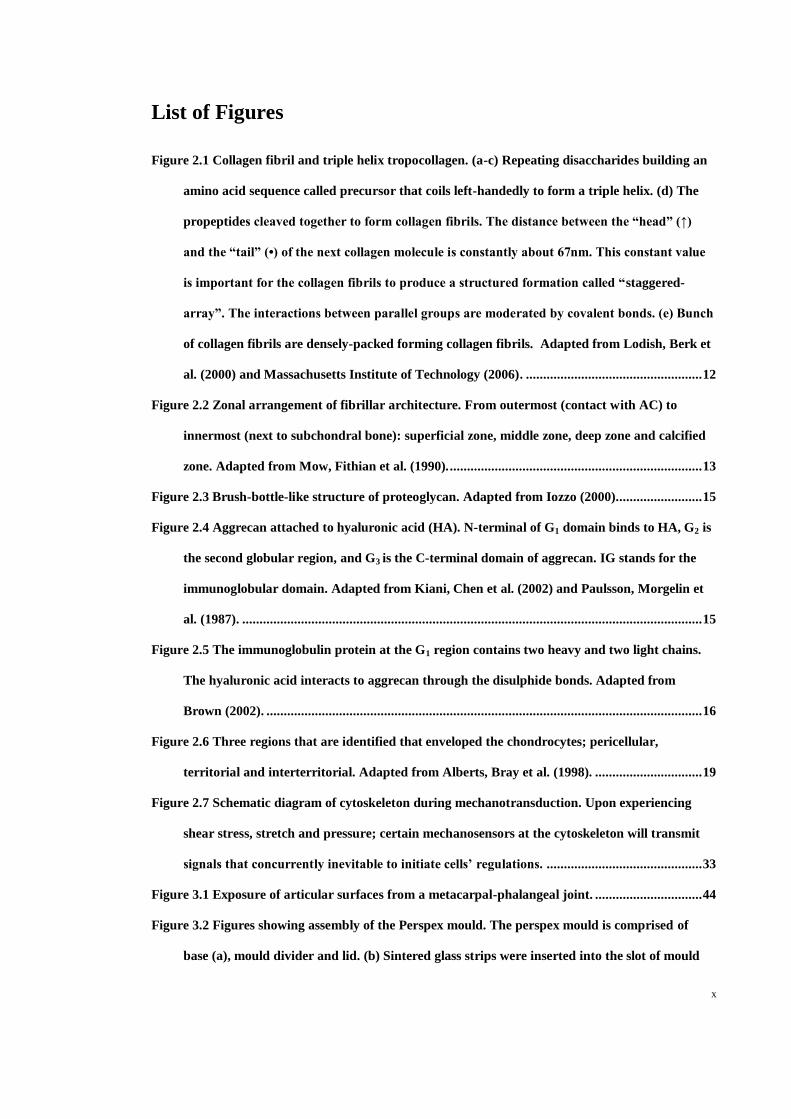
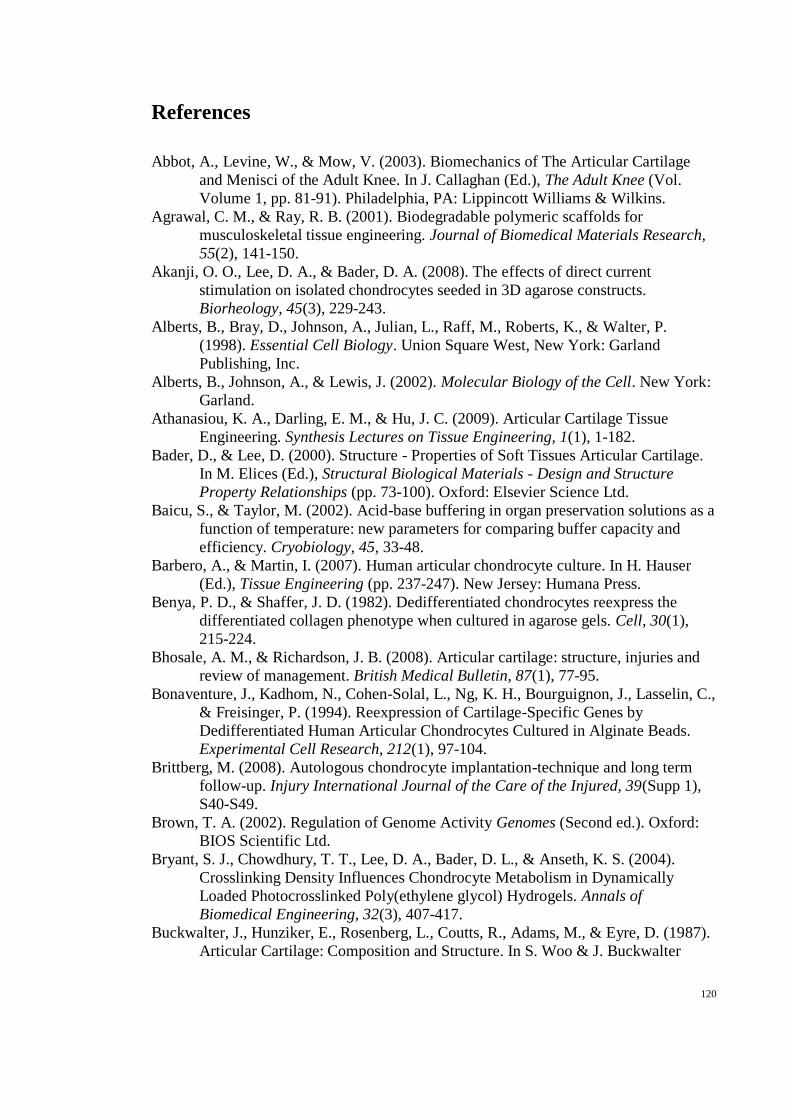
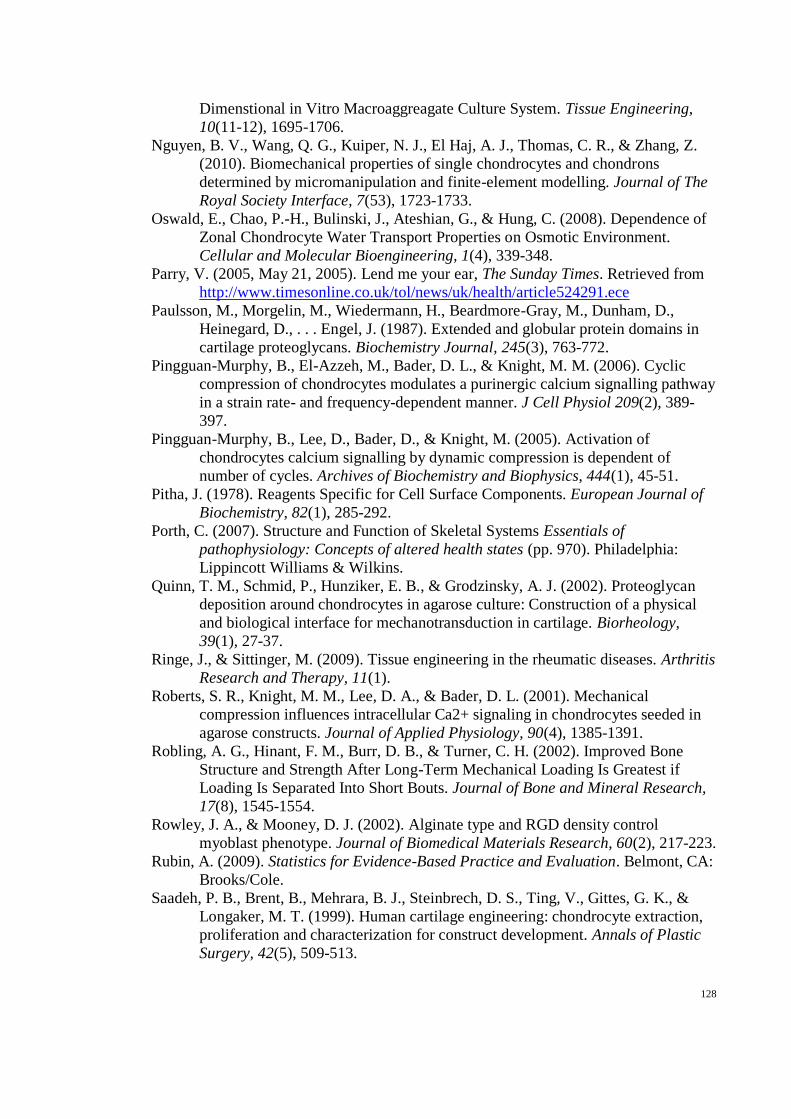
Figure 2.1 Collagen fibril and triple helix tropocollagen. (a-c) Repeating disaccharides building an
amino acid sequence called precursor that coils left-handedly to form a triple helix. (d) The
propeptides cleaved together to form collagen fibrils. The distance between the “head” (↑)
and the “tail” (•) of the next collagen molecule is constantly about 67nm. This constant value
is important for the collagen fibrils to produce a structured formation called “staggered-
array”. The interactions between parallel groups are moderated by covalent bonds. (e) Bunch
of collagen fibrils are densely-packed forming collagen fibrils. Adapted from Lodish, Berk et
al. (2000) and Massachusetts Institute of Technology (2006). ................................................... 12
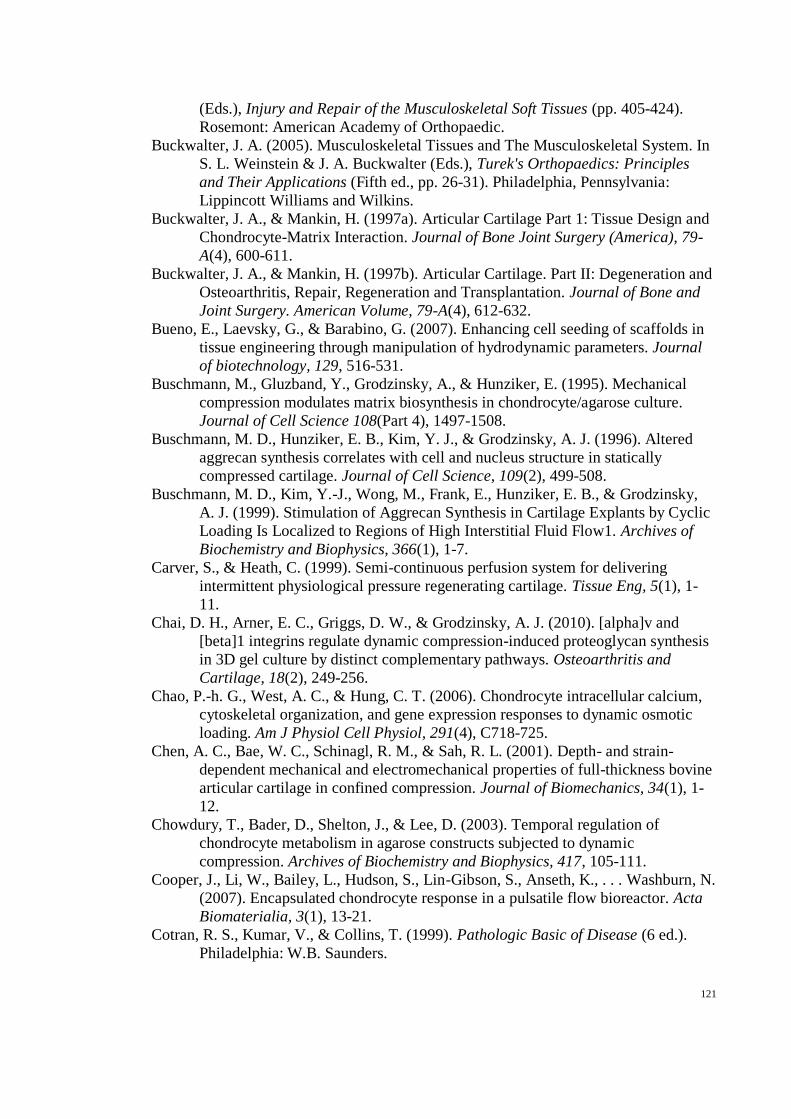
Figure 2.2 Zonal arrangement of fibrillar architecture. From outermost (contact with AC) to
innermost (next to subchondral bone): superficial zone, middle zone, deep zone and calcified
zone. Adapted from Mow, Fithian et al. (1990). ......................................................................... 13
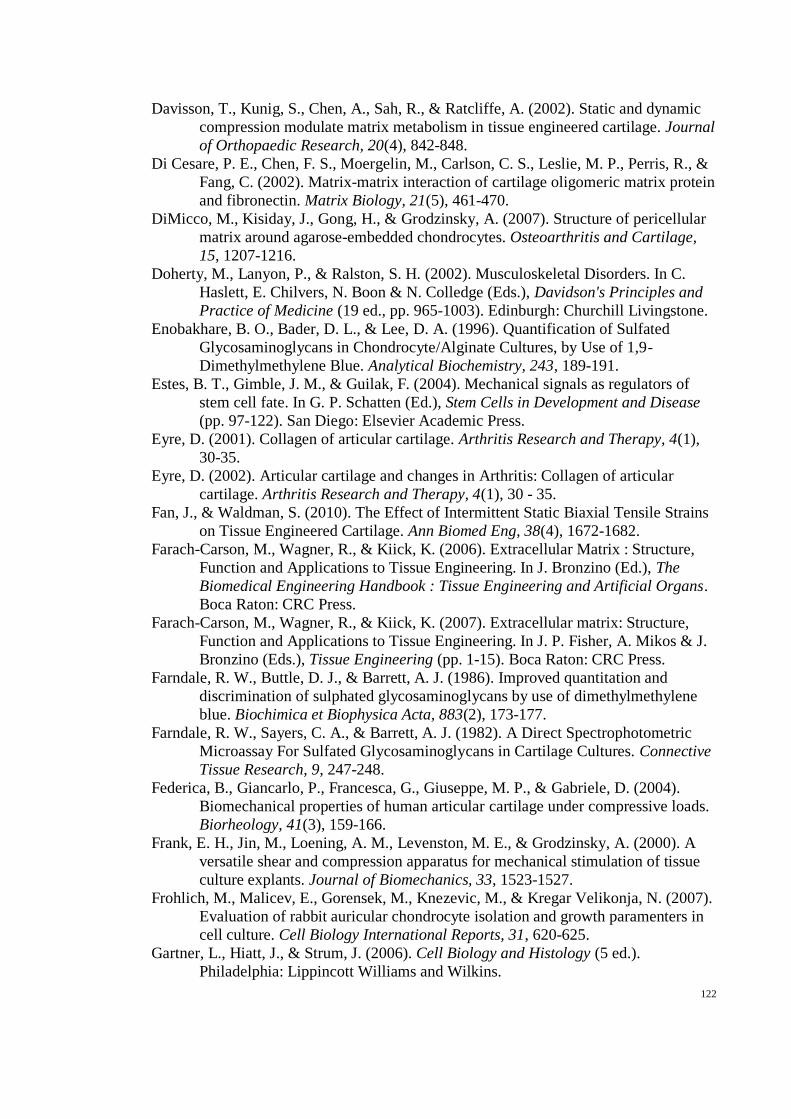
Figure 2.3 Brush-bottle-like structure of proteoglycan. Adapted from Iozzo (2000)......................... 15
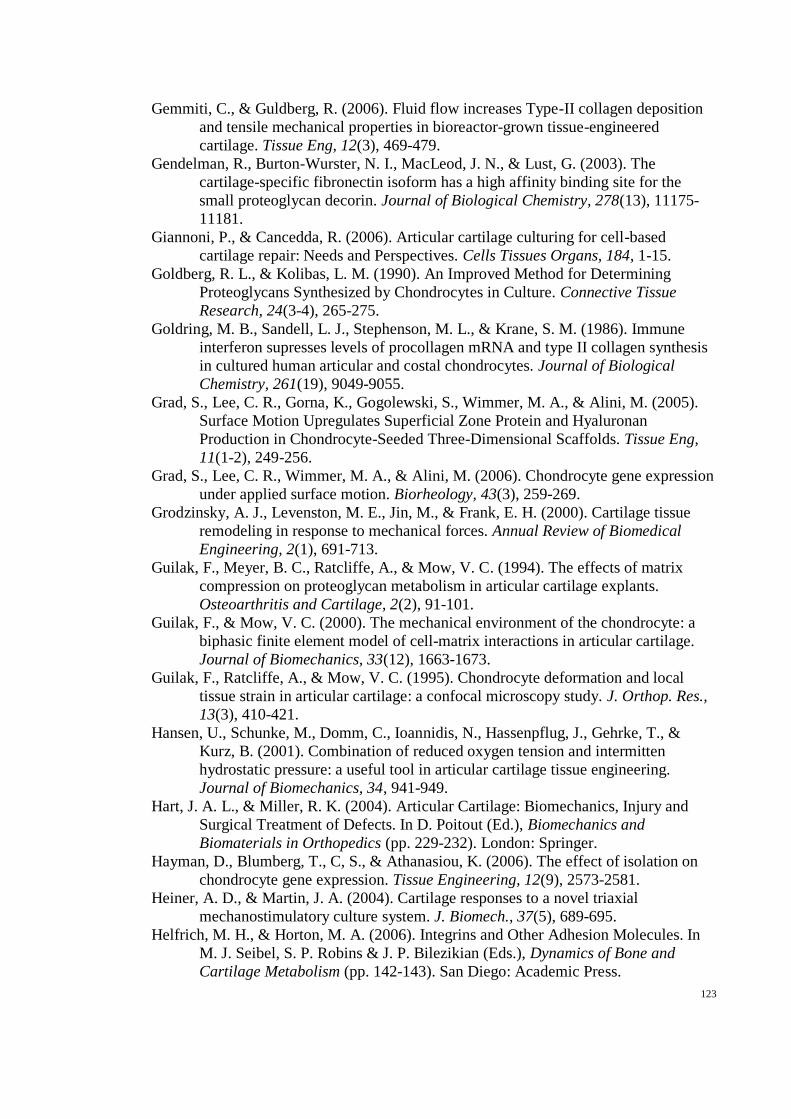
Figure 2.4 Aggrecan attached to hyaluronic acid (HA). N-terminal of G1 domain binds to HA, G2 is
the second globular region, and G3 is the C-terminal domain of aggrecan. IG stands for the
immunoglobular domain. Adapted from Kiani, Chen et al. (2002) and Paulsson, Morgelin et
al. (1987). ..................................................................................................................................... 15
Figure 2.5 The immunoglobulin protein at the G1 region contains two heavy and two light chains.
The hyaluronic acid interacts to aggrecan through the disulphide bonds. Adapted from
Brown (2002). .............................................................................................................................. 16
Figure 2.6 Three regions that are identified that enveloped the chondrocytes; pericellular,
territorial and interterritorial. Adapted from Alberts, Bray et al. (1998). ............................... 19
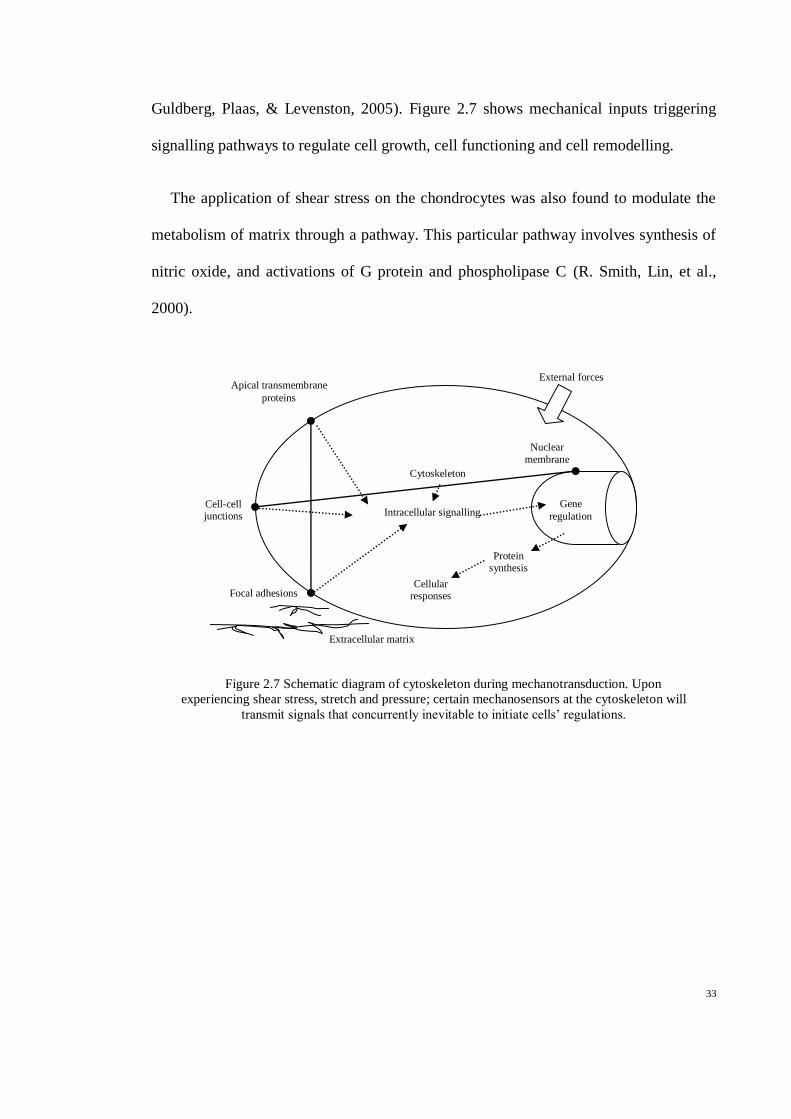
Figure 2.7 Schematic diagram of cytoskeleton during mechanotransduction. Upon experiencing
shear stress, stretch and pressure; certain mechanosensors at the cytoskeleton will transmit
signals that concurrently inevitable to initiate cells’ regulations. ............................................. 33
Figure 3.1 Exposure of articular surfaces from a metacarpal-phalangeal joint. ............................... 44
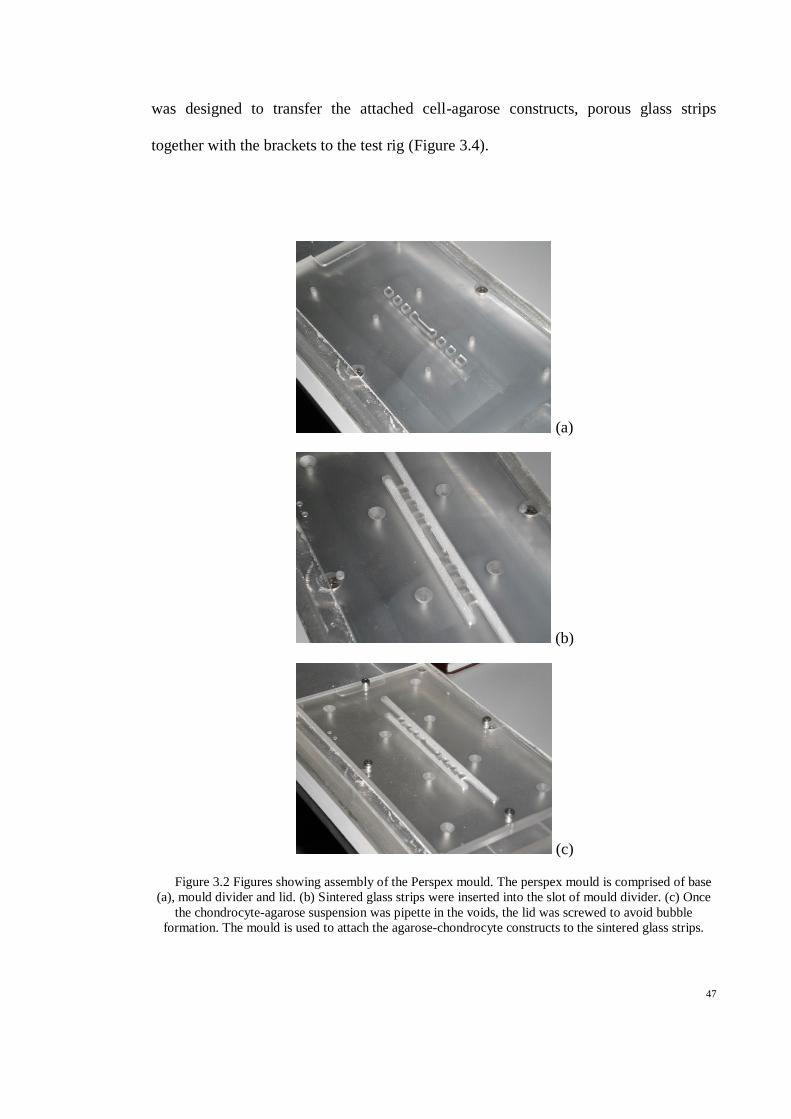
Figure 3.2 Figures showing assembly of the Perspex mould. The perspex mould is comprised of
base (a), mould divider and lid. (b) Sintered glass strips were inserted into the slot of mould
Page 11
xi
divider. (c) Once the chondrocyte-agarose suspension was pipette in the voids, the lid was
screwed to avoid bubble formation. The mould is used to attach the agarose-chondrocyte
constructs to the sintered glass strips. ........................................................................................ 47
Figure 3.3 Photo of the plated constructs structure inside the culture tray. Arrow showed the
sintered glass strips attached to the shear and compressive brackets with six samples of
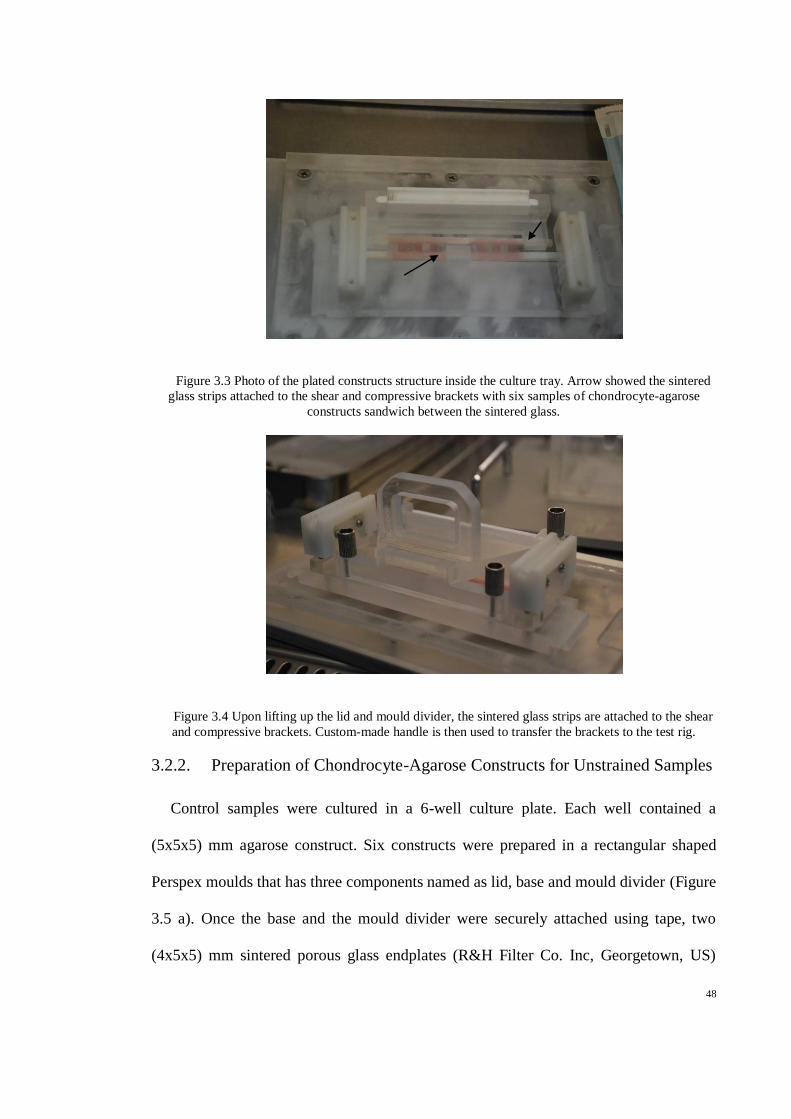
chondrocyte-agarose constructs sandwich between the sintered glass. ..................................... 48
Figure 3.4 Upon lifting up the lid and mould divider, the sintered glass strips are attached to the
shear and compressive brackets. Custom-made handle is then used to transfer the brackets to
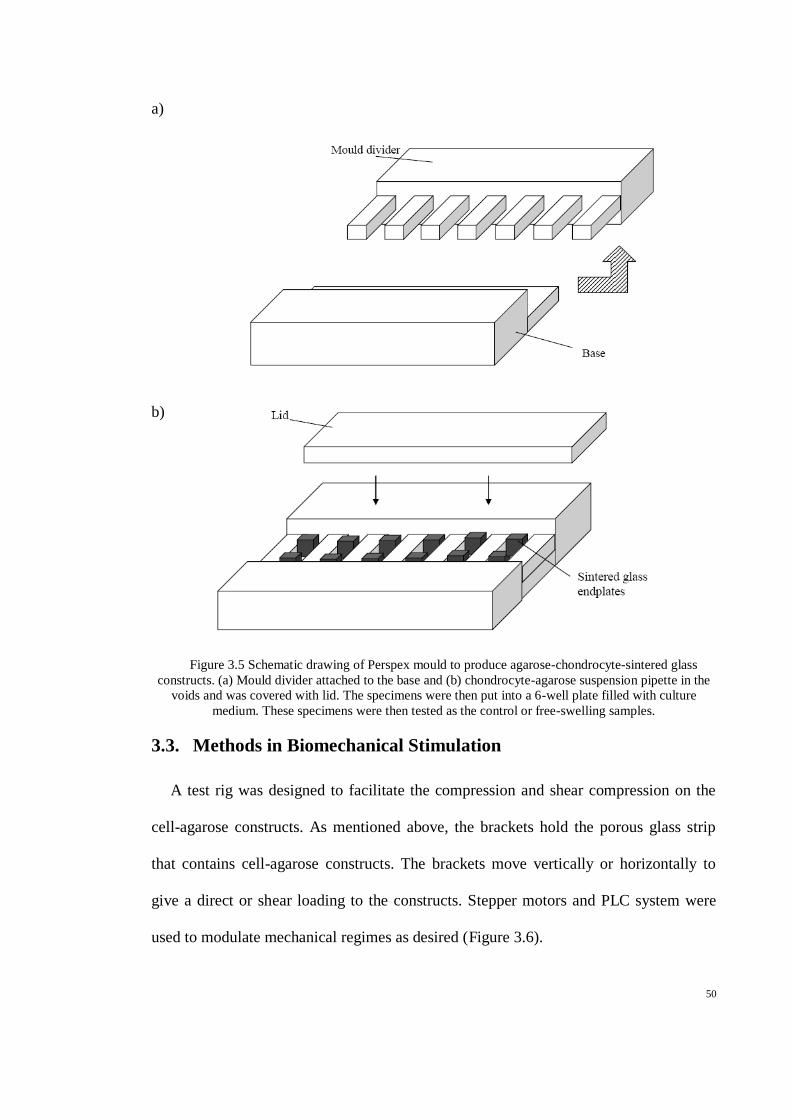
the test rig. ................................................................................................................................... 48
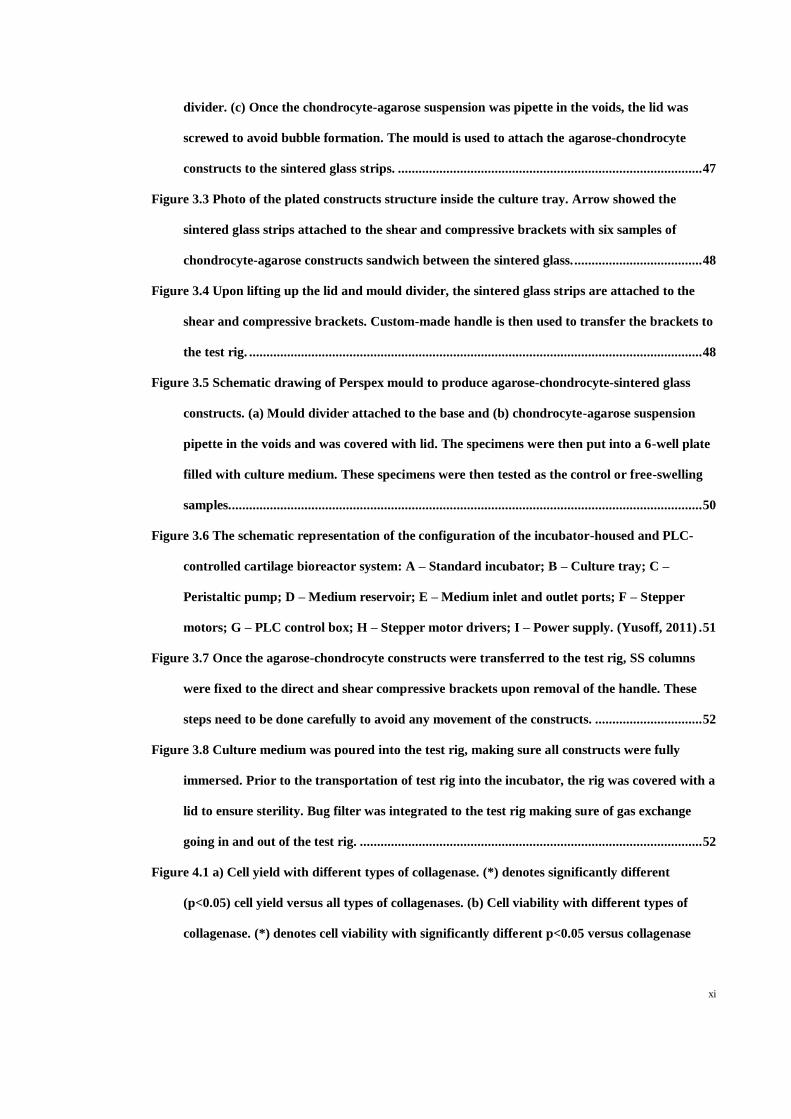
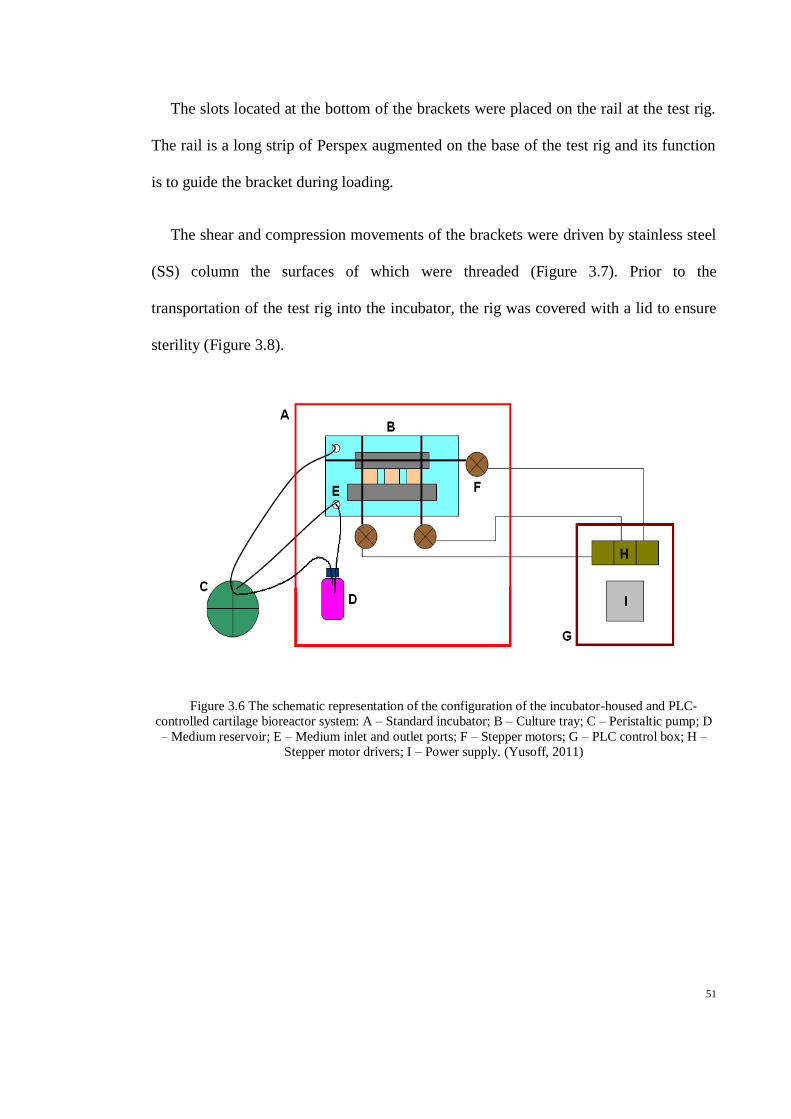
Figure 3.5 Schematic drawing of Perspex mould to produce agarose-chondrocyte-sintered glass
constructs. (a) Mould divider attached to the base and (b) chondrocyte-agarose suspension
pipette in the voids and was covered with lid. The specimens were then put into a 6-well plate
filled with culture medium. These specimens were then tested as the control or free-swelling
samples......................................................................................................................................... 50
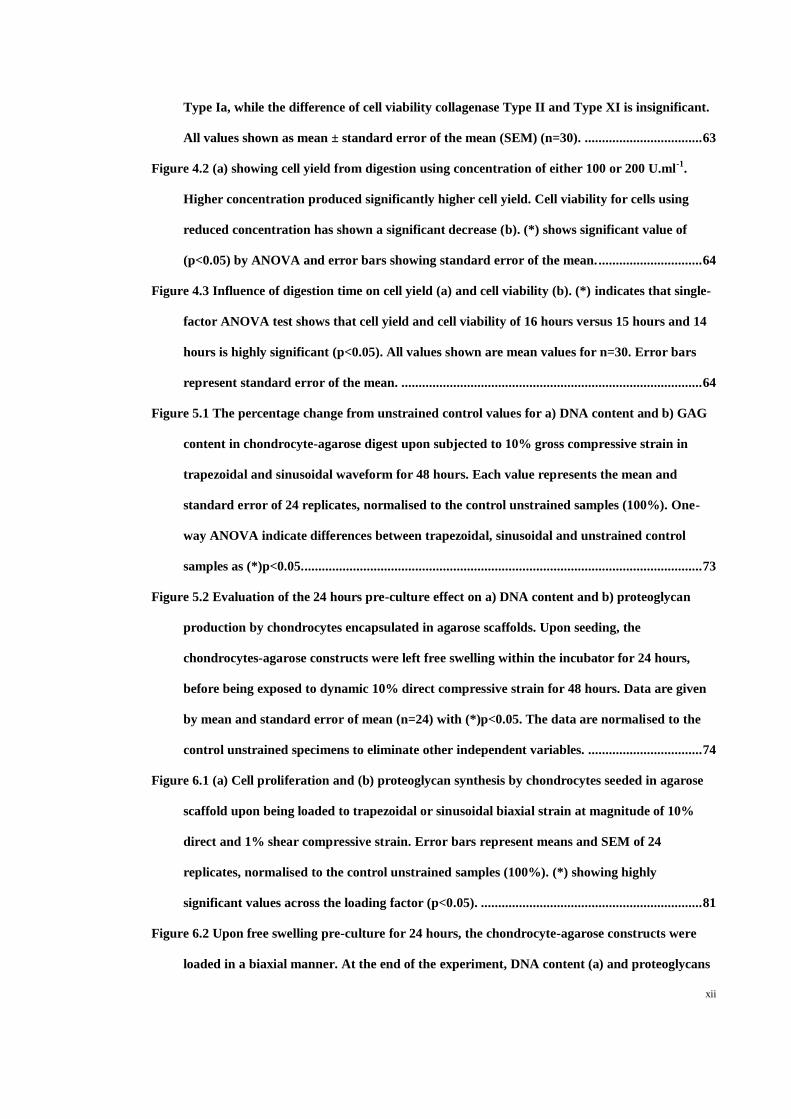
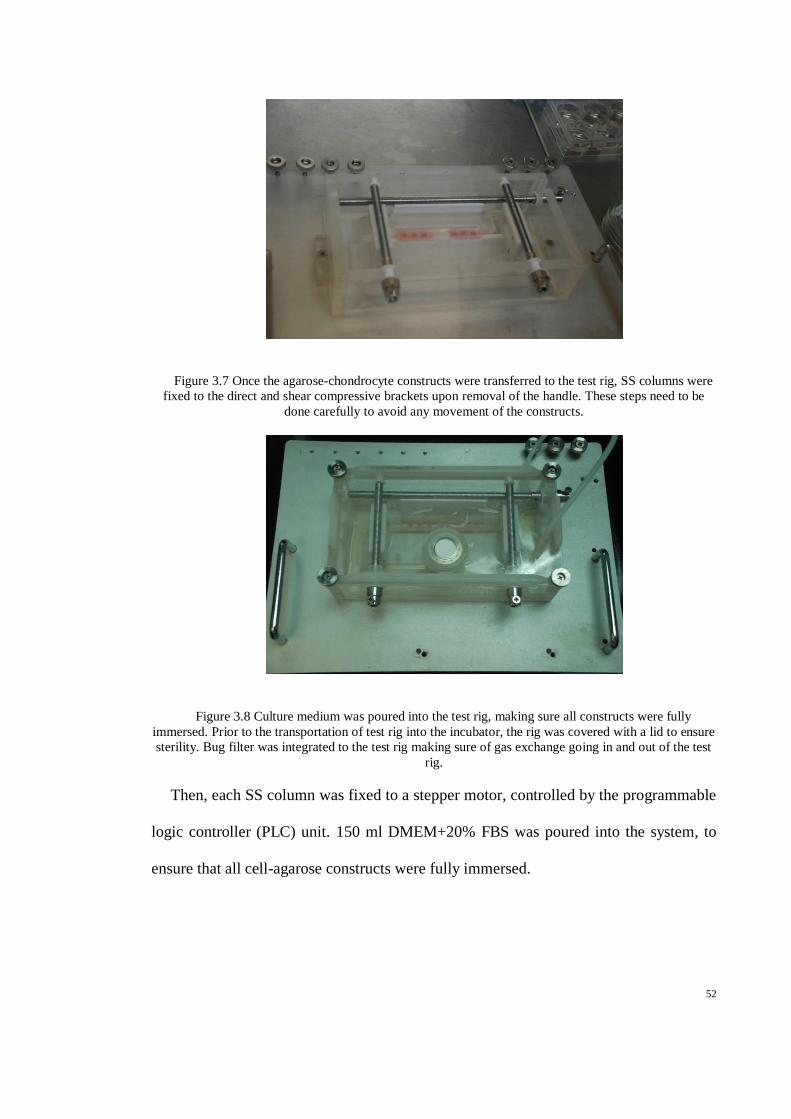
Figure 3.6 The schematic representation of the configuration of the incubator-housed and PLC-
controlled cartilage bioreactor system: A – Standard incubator; B – Culture tray; C –
Peristaltic pump; D – Medium reservoir; E – Medium inlet and outlet ports; F – Stepper
motors; G – PLC control box; H – Stepper motor drivers; I – Power supply. (Yusoff, 2011) . 51
Figure 3.7 Once the agarose-chondrocyte constructs were transferred to the test rig, SS columns
were fixed to the direct and shear compressive brackets upon removal of the handle. These
steps need to be done carefully to avoid any movement of the constructs. ............................... 52
Figure 3.8 Culture medium was poured into the test rig, making sure all constructs were fully
immersed. Prior to the transportation of test rig into the incubator, the rig was covered with a
lid to ensure sterility. Bug filter was integrated to the test rig making sure of gas exchange
going in and out of the test rig. ................................................................................................... 52
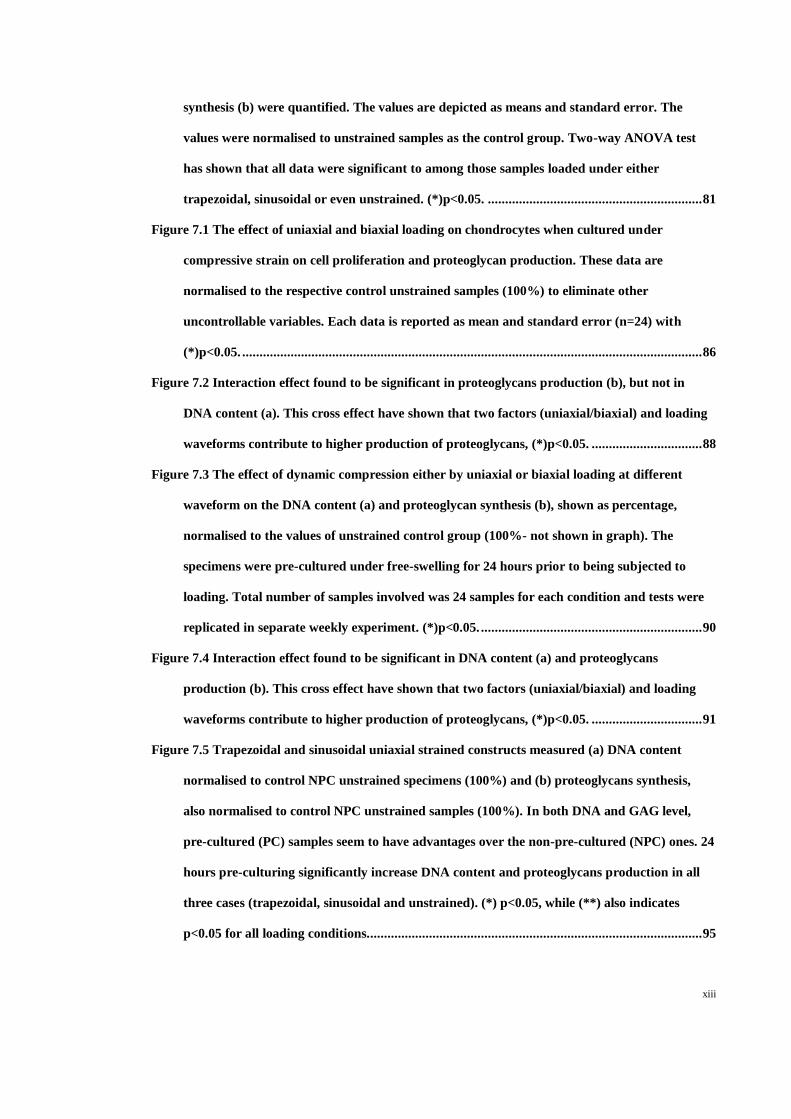
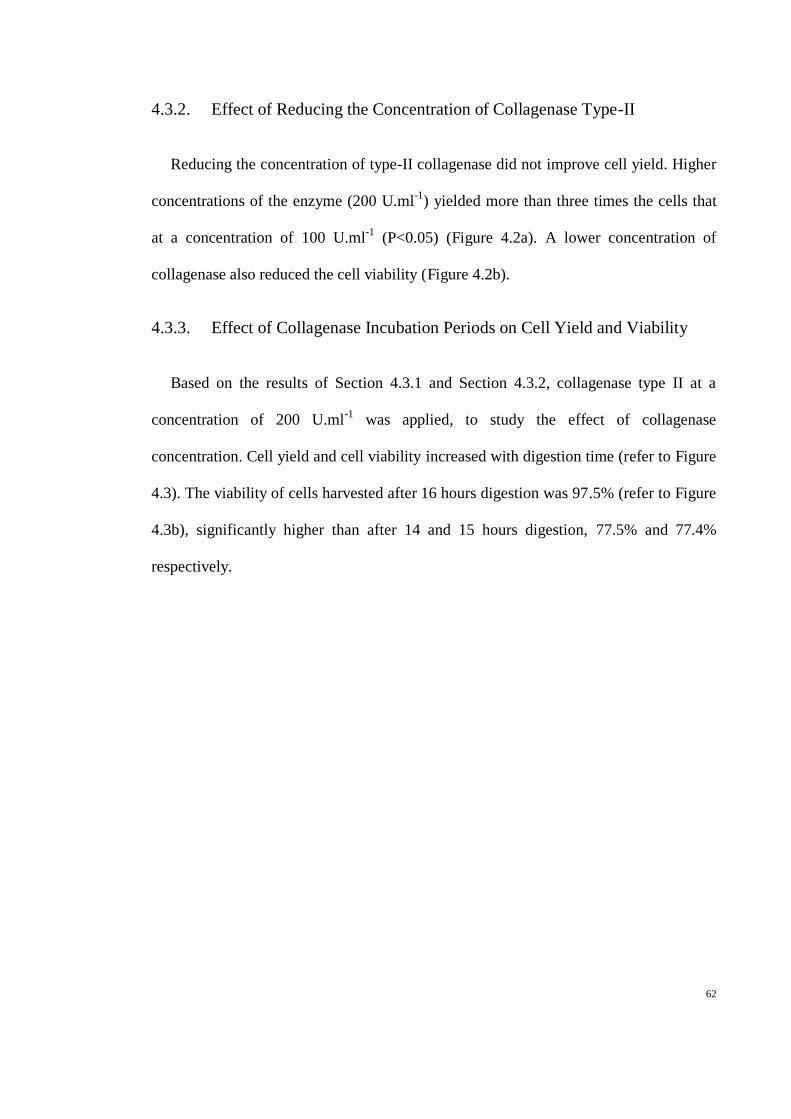
Figure 4.1 a) Cell yield with different types of collagenase. (*) denotes significantly different
(p<0.05) cell yield versus all types of collagenases. (b) Cell viability with different types of
collagenase. (*) denotes cell viability with significantly different p<0.05 versus collagenase
Page 12
xii
Type Ia, while the difference of cell viability collagenase Type II and Type XI is insignificant.
All values shown as mean ± standard error of the mean (SEM) (n=30). .................................. 63
Figure 4.2 (a) showing cell yield from digestion using concentration of either 100 or 200 U.ml-1
.
Higher concentration produced significantly higher cell yield. Cell viability for cells using
reduced concentration has shown a significant decrease (b). (*) shows significant value of
(p<0.05) by ANOVA and error bars showing standard error of the mean. .............................. 64
Figure 4.3 Influence of digestion time on cell yield (a) and cell viability (b). (*) indicates that single-
factor ANOVA test shows that cell yield and cell viability of 16 hours versus 15 hours and 14
hours is highly significant (p<0.05). All values shown are mean values for n=30. Error bars
represent standard error of the mean. ....................................................................................... 64
Figure 5.1 The percentage change from unstrained control values for a) DNA content and b) GAG
content in chondrocyte-agarose digest upon subjected to 10% gross compressive strain in
trapezoidal and sinusoidal waveform for 48 hours. Each value represents the mean and
standard error of 24 replicates, normalised to the control unstrained samples (100%). One-
way ANOVA indicate differences between trapezoidal, sinusoidal and unstrained control
samples as (*)p<0.05. ................................................................................................................... 73
Figure 5.2 Evaluation of the 24 hours pre-culture effect on a) DNA content and b) proteoglycan
production by chondrocytes encapsulated in agarose scaffolds. Upon seeding, the
chondrocytes-agarose constructs were left free swelling within the incubator for 24 hours,
before being exposed to dynamic 10% direct compressive strain for 48 hours. Data are given
by mean and standard error of mean (n=24) with (*)p<0.05. The data are normalised to the
control unstrained specimens to eliminate other independent variables. ................................. 74
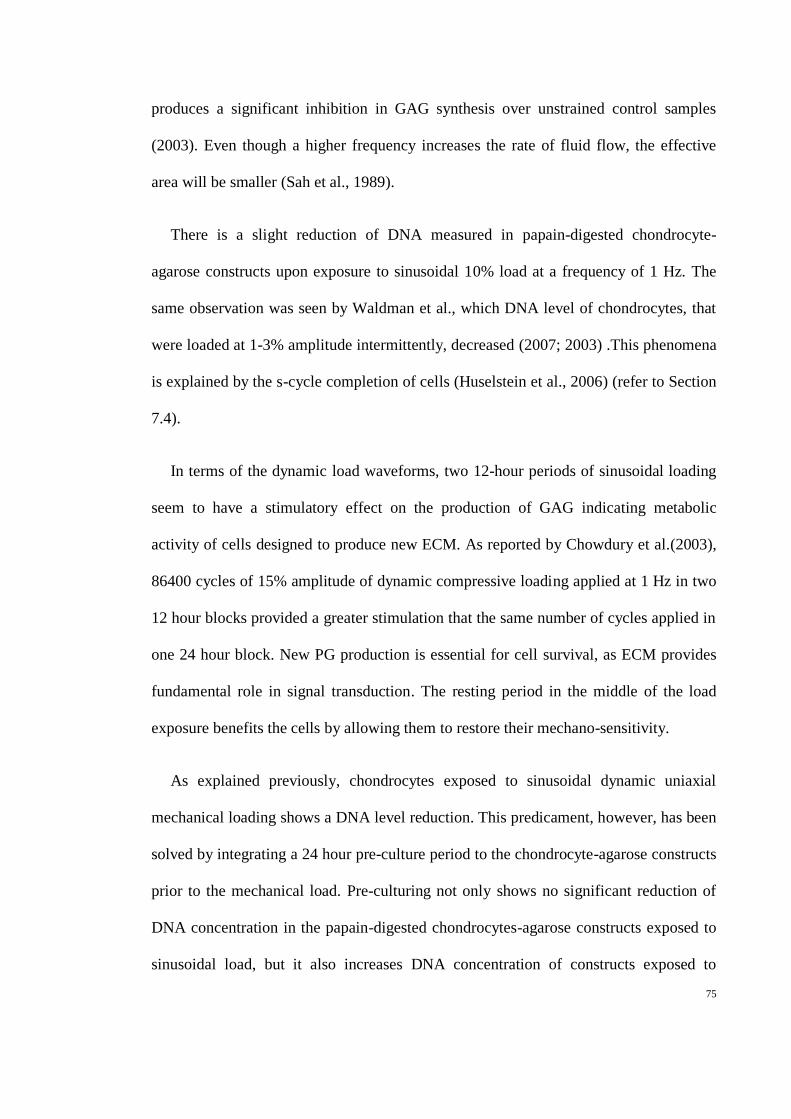
Figure 6.1 (a) Cell proliferation and (b) proteoglycan synthesis by chondrocytes seeded in agarose
scaffold upon being loaded to trapezoidal or sinusoidal biaxial strain at magnitude of 10%
direct and 1% shear compressive strain. Error bars represent means and SEM of 24
replicates, normalised to the control unstrained samples (100%). (*) showing highly
significant values across the loading factor (p<0.05). ................................................................ 81
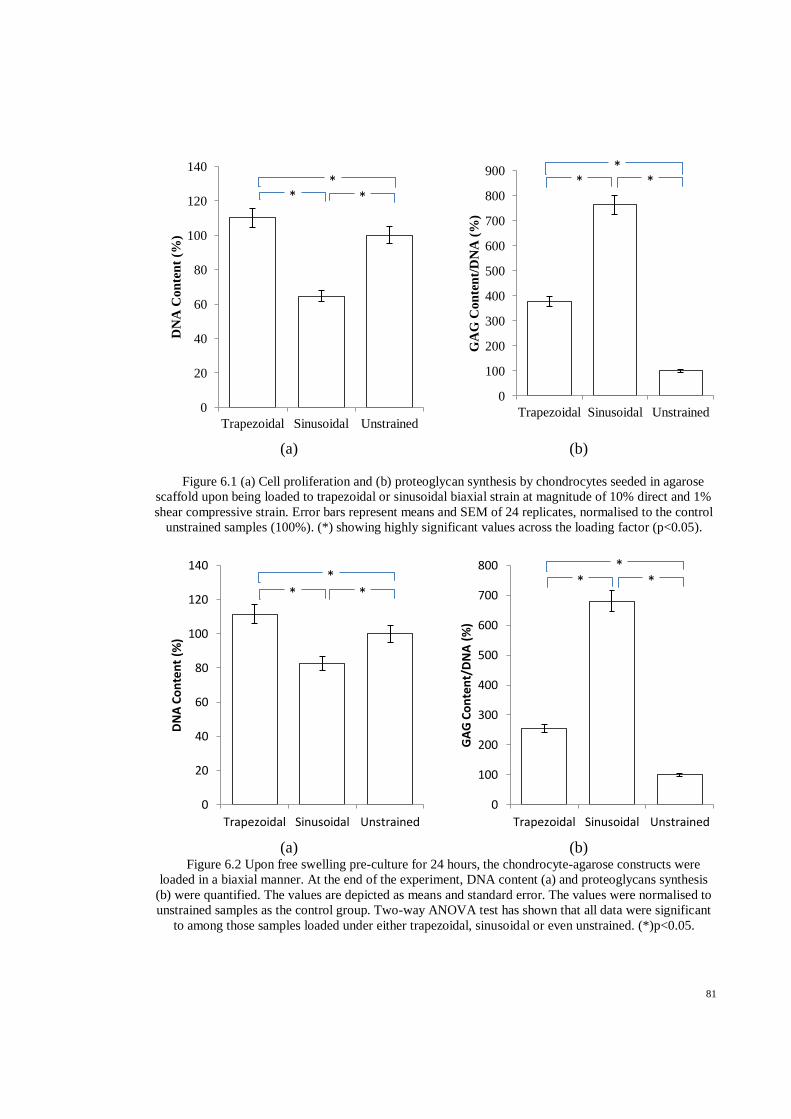
Figure 6.2 Upon free swelling pre-culture for 24 hours, the chondrocyte-agarose constructs were
loaded in a biaxial manner. At the end of the experiment, DNA content (a) and proteoglycans
Page 13
xiii
synthesis (b) were quantified. The values are depicted as means and standard error. The
values were normalised to unstrained samples as the control group. Two-way ANOVA test
has shown that all data were significant to among those samples loaded under either
trapezoidal, sinusoidal or even unstrained. (*)p<0.05. .............................................................. 81
Figure 7.1 The effect of uniaxial and biaxial loading on chondrocytes when cultured under
compressive strain on cell proliferation and proteoglycan production. These data are
normalised to the respective control unstrained samples (100%) to eliminate other
uncontrollable variables. Each data is reported as mean and standard error (n=24) with
(*)p<0.05. ..................................................................................................................................... 86
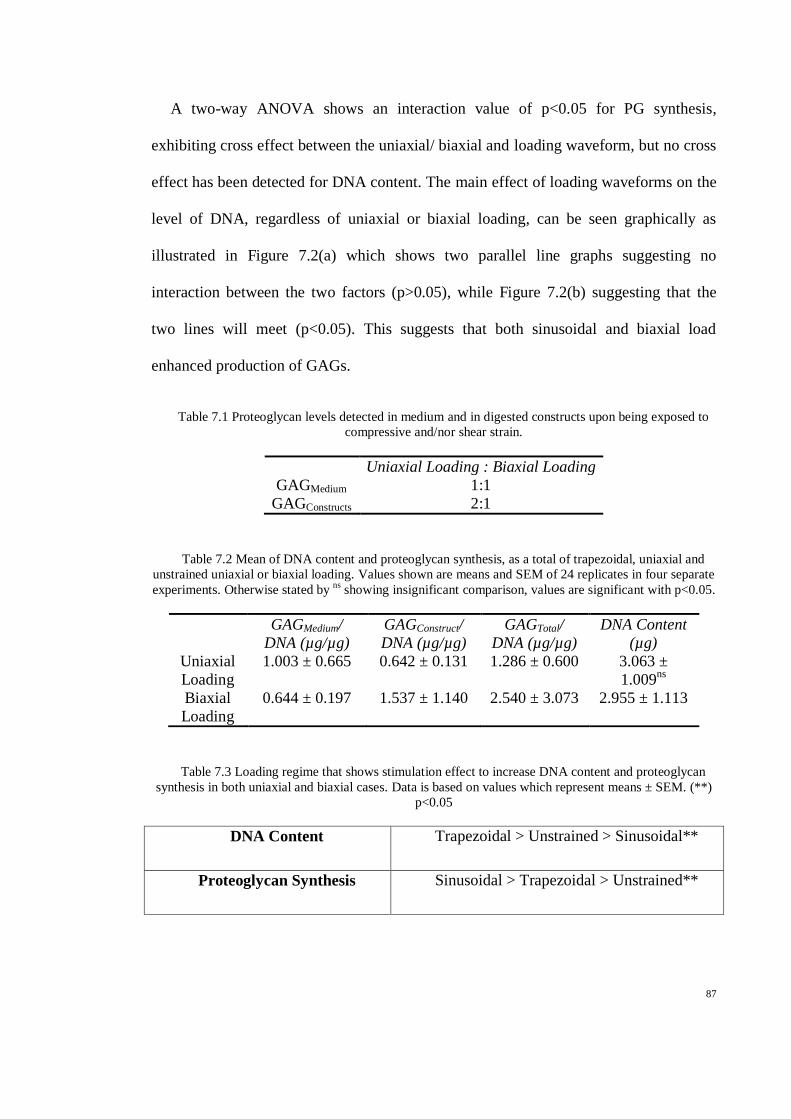
Figure 7.2 Interaction effect found to be significant in proteoglycans production (b), but not in
DNA content (a). This cross effect have shown that two factors (uniaxial/biaxial) and loading
waveforms contribute to higher production of proteoglycans, (*)p<0.05. ................................ 88
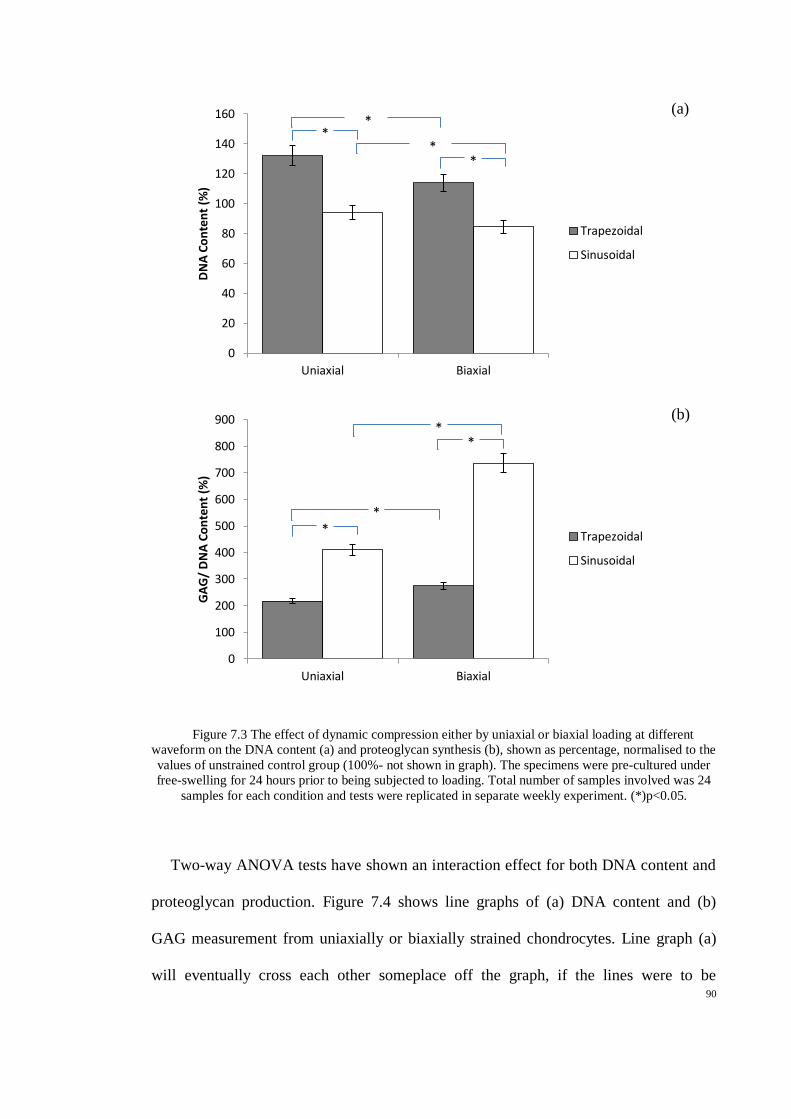
Figure 7.3 The effect of dynamic compression either by uniaxial or biaxial loading at different
waveform on the DNA content (a) and proteoglycan synthesis (b), shown as percentage,
normalised to the values of unstrained control group (100%- not shown in graph). The
specimens were pre-cultured under free-swelling for 24 hours prior to being subjected to
loading. Total number of samples involved was 24 samples for each condition and tests were
replicated in separate weekly experiment. (*)p<0.05. ................................................................ 90
Figure 7.4 Interaction effect found to be significant in DNA content (a) and proteoglycans
production (b). This cross effect have shown that two factors (uniaxial/biaxial) and loading
waveforms contribute to higher production of proteoglycans, (*)p<0.05. ................................ 91
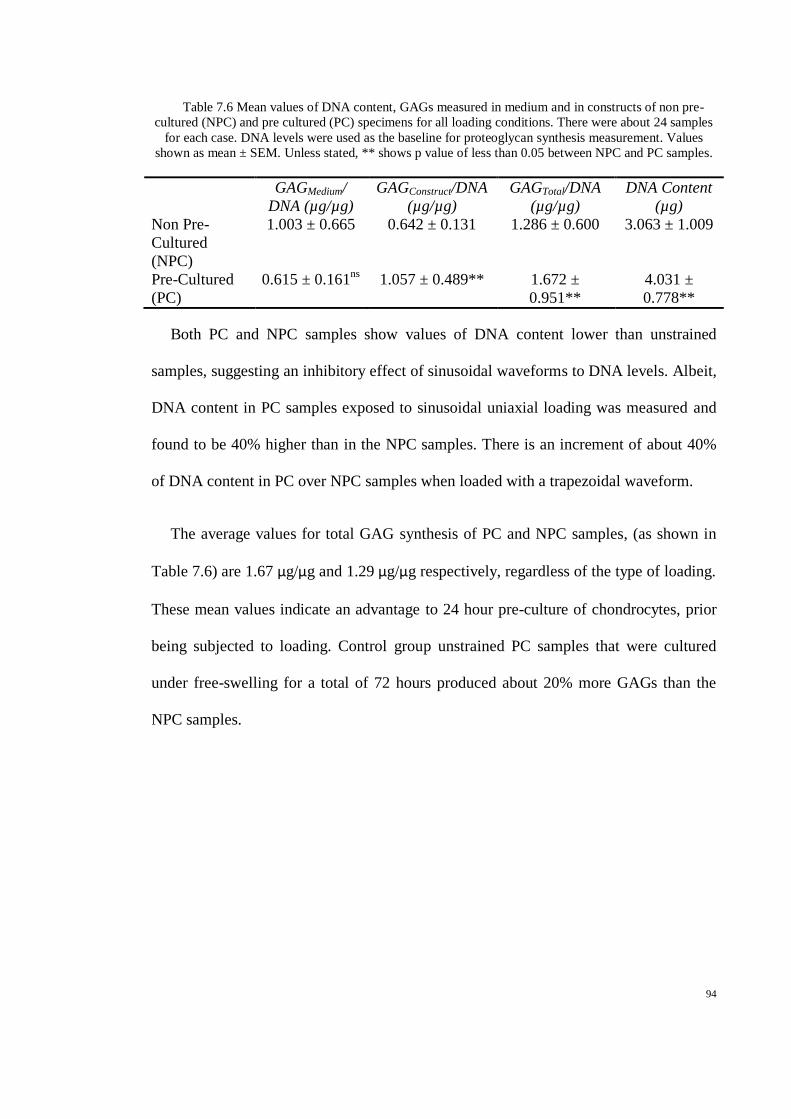
Figure 7.5 Trapezoidal and sinusoidal uniaxial strained constructs measured (a) DNA content
normalised to control NPC unstrained specimens (100%) and (b) proteoglycans synthesis,
also normalised to control NPC unstrained samples (100%). In both DNA and GAG level,
pre-cultured (PC) samples seem to have advantages over the non-pre-cultured (NPC) ones. 24
hours pre-culturing significantly increase DNA content and proteoglycans production in all
three cases (trapezoidal, sinusoidal and unstrained). (*) p<0.05, while (**) also indicates
p<0.05 for all loading conditions. ................................................................................................ 95
Page 14
xiv
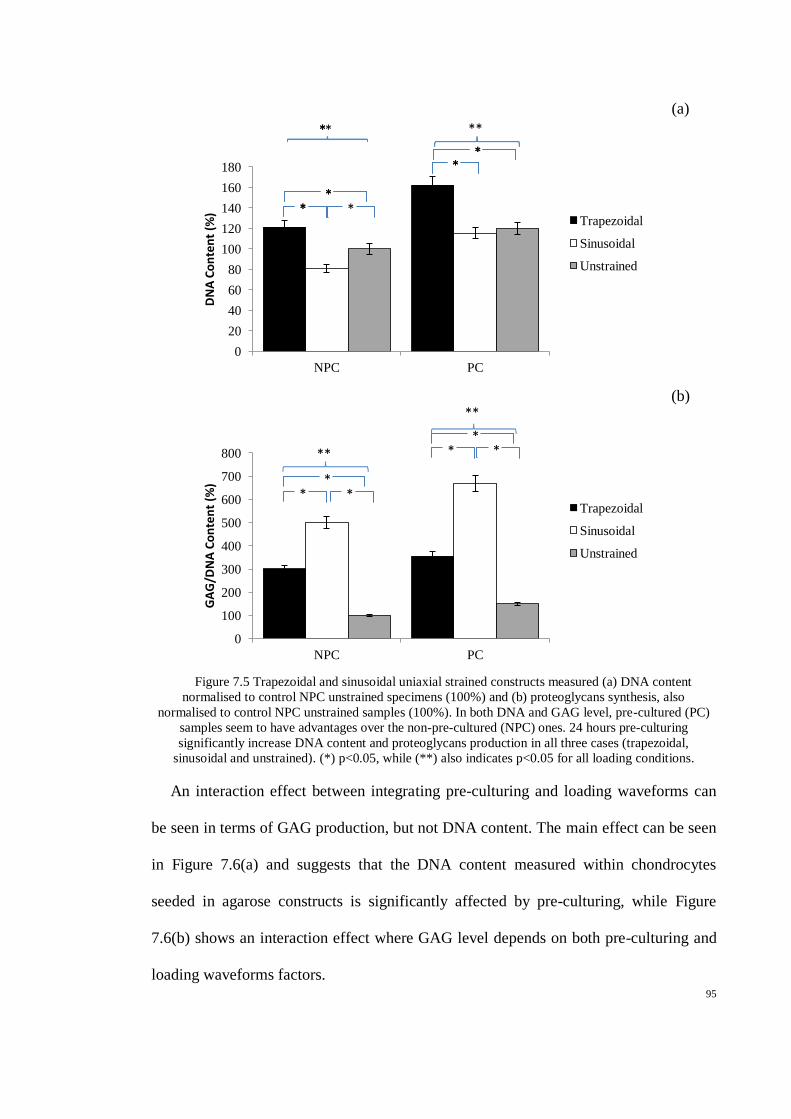
Figure 7.6 Line graphs showing interaction effect for DNA content (a) and GAG production (b). No
interaction can be seen for DNA content between NPC and PC samples (p>0.05). The graph
shows that there are cross effect for GAG production between non pre-cultured (NPC) and
pre-cultured (PC) specimens, suggesting that the results of GAG production depends on pre-
culturing factor and loading factor. (*) signifies p<0.05. ........................................................... 96
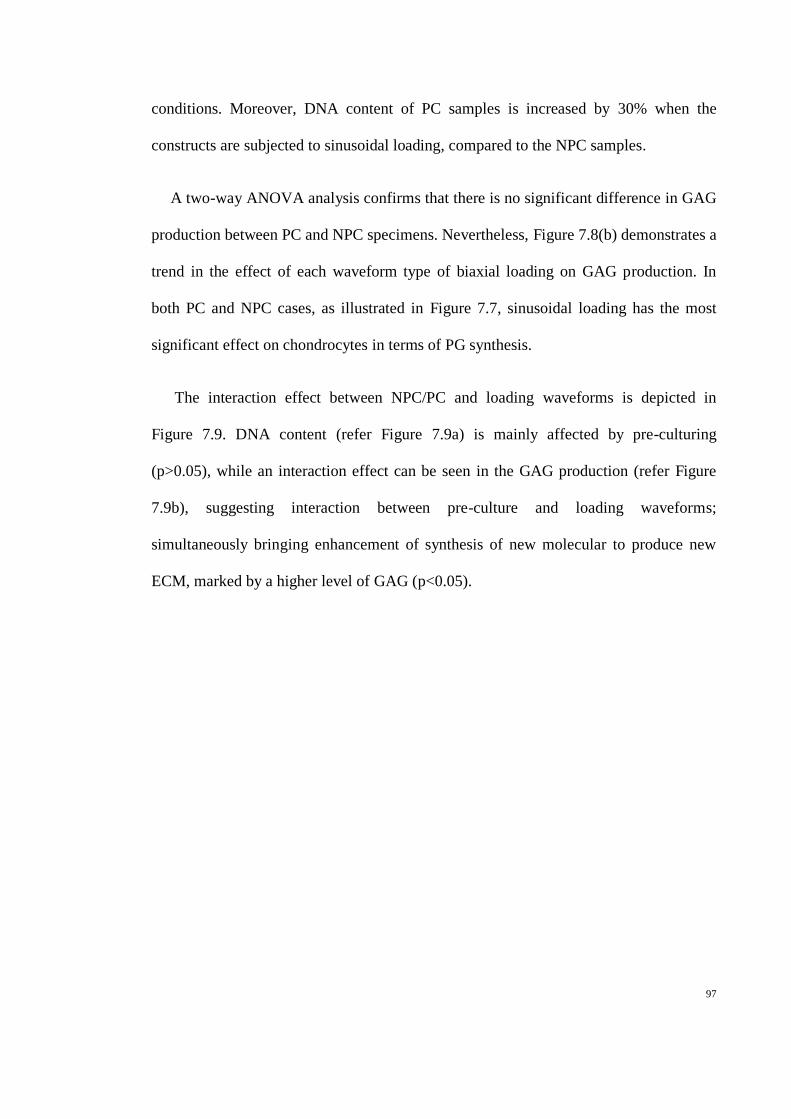
Figure 7.7 A trend of biaxial loading waveforms from the least to the most significant in terms of
producing stimulation effect on chondrocytes to proteoglycans synthesis. ............................... 98
Figure 7.8 Data were collected to see the effect of (a) DNA content, normalised to the unstrained
samples as the control group (100%) and (b) proteoglycan production by chondrocytes seeded
in agarose loaded in biaxial manner immediately after cell seeding or upon 24 hours pre-
culture under free-swelling condition. The data were taken from a total of 72 samples for each
pre-cultured (PC) and non pre-cultured (NPC) conditions. (*) p<0.05, while (**) also indicates
p<0.05 for PC samples versus NPC samples in all loading conditions. ..................................... 99
Figure 7.9 Interaction effect of non pre-cultured and pre-cultured specimens in terms of a) DNA
content and b) chondroitin sulphate incorporation using DNA content as the baseline. Graphs
show that cross effect can be seen from the level of proteoglycan synthesis (* signifies p<0.05),
but no cross effect for DNA content (p>0.05). .......................................................................... 100
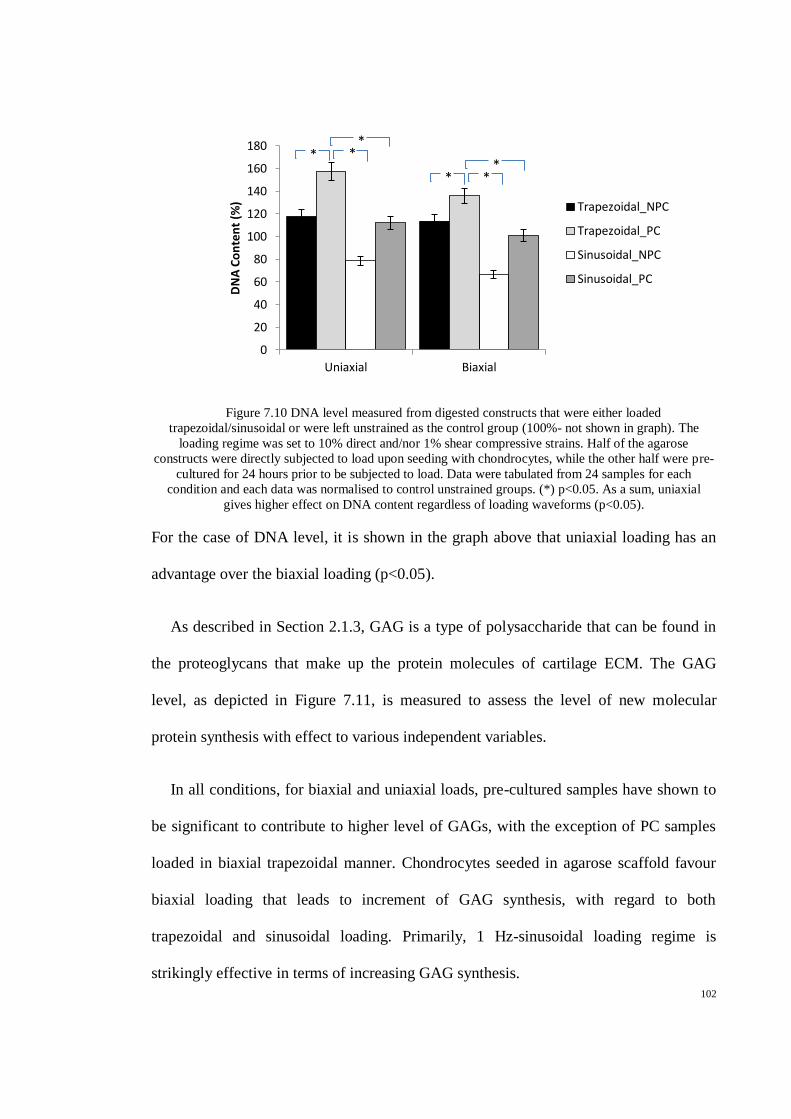
Figure 7.10 DNA level measured from digested constructs that were either loaded
trapezoidal/sinusoidal or were left unstrained as the control group (100%- not shown in
graph). The loading regime was set to 10% direct and/nor 1% shear compressive strains. Half
of the agarose constructs were directly subjected to load upon seeding with chondrocytes,
while the other half were pre-cultured for 24 hours prior to be subjected to load. Data were
tabulated from 24 samples for each condition and each data was normalised to control
unstrained groups. (*) p<0.05. As a sum, uniaxial gives higher effect on DNA content
regardless of loading waveforms (p<0.05). ............................................................................... 102
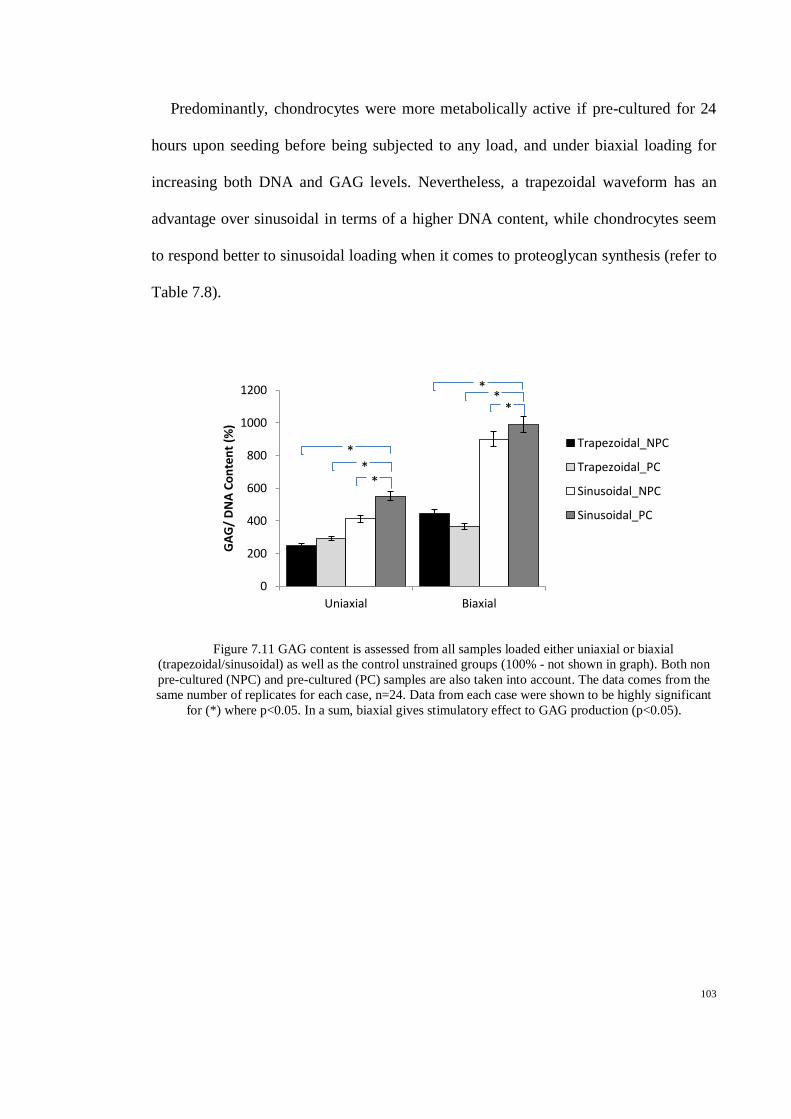
Figure 7.11 GAG content is assessed from all samples loaded either uniaxial or biaxial
(trapezoidal/sinusoidal) as well as the control unstrained groups (100% - not shown in graph).
Both non pre-cultured (NPC) and pre-cultured (PC) samples are also taken into account. The
data comes from the same number of replicates for each case, n=24. Data from each case were
Page 15
xv
shown to be highly significant for (*) where p<0.05. In a sum, biaxial gives stimulatory effect
to GAG production (p<0.05). .................................................................................................... 103
Page 16
xvi
List of Tables
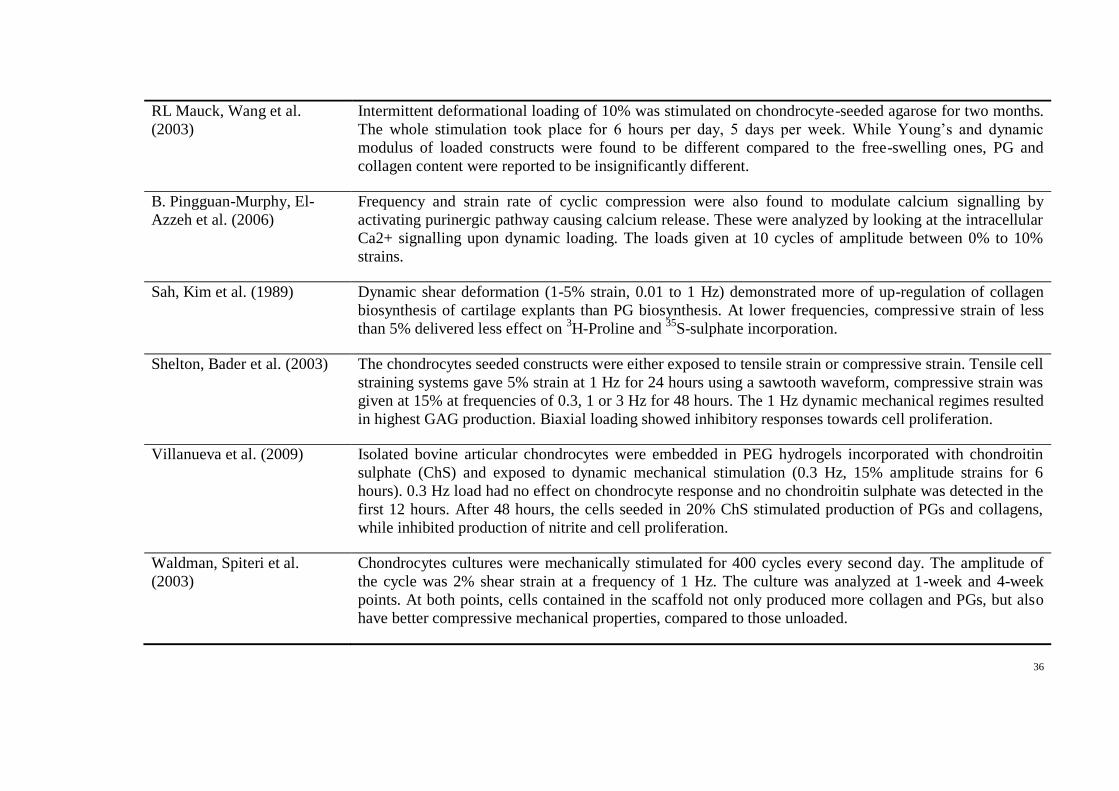
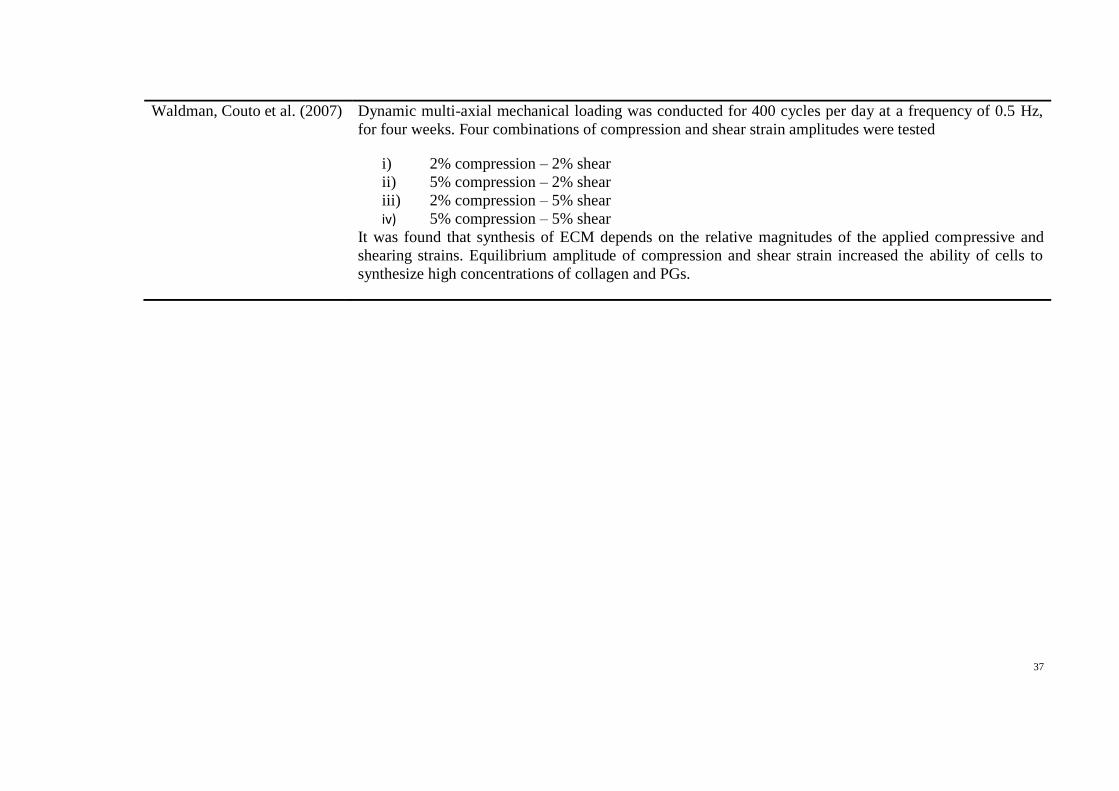
Table 2.1 Mechanical properties of articular cartilage. Adapted from Mow et al. (1990). ............... 21
Table 2.2 List of functions for each organelle found in chondrocytes. Adapted from Minuth, Strehl
et al. (2005) and Scheffler (1999). ............................................................................................... 22
Table 2.3 Summary of studies that have been done to assess response of cartilage to mechanical
load in-vitro. ................................................................................................................................. 35
Table 3.1 Summary of comparisons made between the different enzymatic digestion protocols,
showing enzymes used, their concentrations and digestion times. ............................................ 40
Table 3.2 Components of Chondrocyte Medium................................................................................. 42
Table 3.3 Types of Collagenase and Concentration used during the experimental work.................. 44
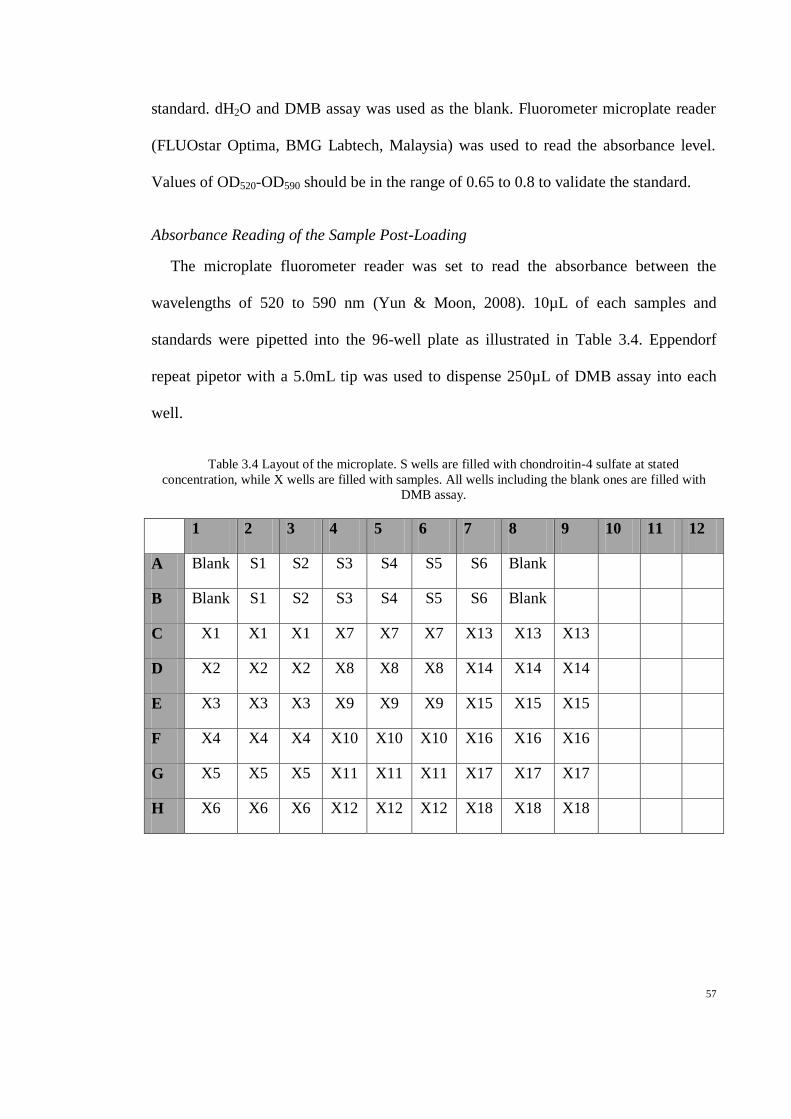
Table 3.4 Layout of the microplate. S wells are filled with chondroitin-4 sulfate at stated
concentration, while X wells are filled with samples. All wells including the blank ones are
filled with DMB assay. ................................................................................................................ 57
Table 4.1 Optimized chondrocyte isolation protocol. .......................................................................... 65
Table 5.1 Absolute values for GAG content in medium, constructs and total GAG synthesis, with
DNA content as baselines by chondrocyte/agarose constructs subjected to various waveform
uniaxial loading. The average values are taken from 24 samples from four separate
experiments. Errors shown are standard error of mean. .......................................................... 71
Table 6.1 Absolute values for GAG content in medium, constructs and total GAG synthesis, with
DNA content as baselines by chondrocyte/agarose constructs subjected to various waveform
biaxial loading. The average values are taken from 24 samples from four separate
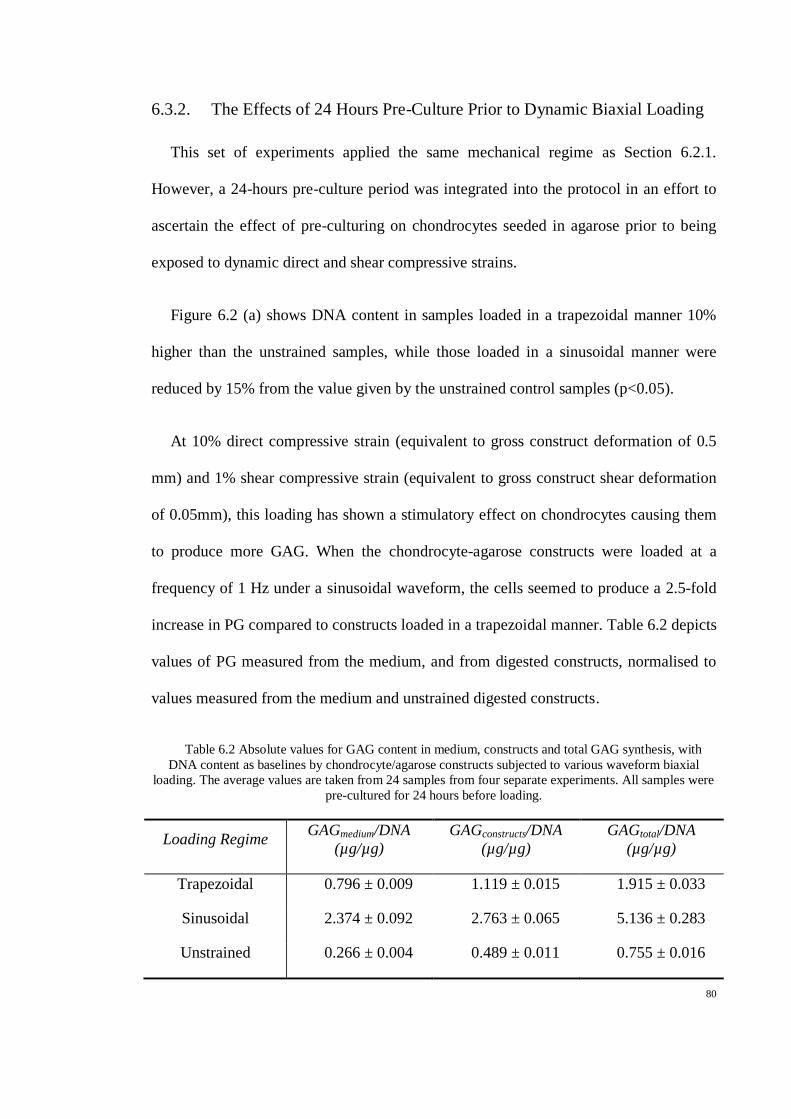
experiments. ................................................................................................................................ 79
Table 6.2 Absolute values for GAG content in medium, constructs and total GAG synthesis, with
DNA content as baselines by chondrocyte/agarose constructs subjected to various waveform
biaxial loading. The average values are taken from 24 samples from four separate
experiments. All samples were pre-cultured for 24 hours before loading. ............................... 80
Table 7.1 Proteoglycan levels detected in medium and in digested constructs upon being exposed to
compressive and/nor shear strain. .............................................................................................. 87
Page 17
xvii
Table 7.2 Mean of DNA content and proteoglycan synthesis, as a total of trapezoidal, uniaxial and
unstrained uniaxial or biaxial loading. Values shown are means and SEM of 24 replicates in
four separate experiments. Otherwise stated by ns
showing insignificant comparison, values
are significant with p<0.05. ......................................................................................................... 87
Table 7.3 Loading regime that shows stimulation effect to increase DNA content and proteoglycan
synthesis in both uniaxial and biaxial cases. Data is based on values which represent means ±
SEM. (**) p<0.05 ......................................................................................................................... 87
Table 7.4 Mean value of all 24 samples from biaxial and uniaxial loading. The samples were put to
free-swelling for the first 24 hours before subjected to loading. All values are normalised to
the control unstrained group and a two-way ANOVA has given p value of less than 0.05(**),
suggesting significant values for all measurements at all conditions. ........................................ 91
Table 7.5 Loading regime that shows stimulation effect to increase DNA content and proteoglycan
synthesis in both uniaxial and biaxial cases. (**) p<0.05. .......................................................... 91
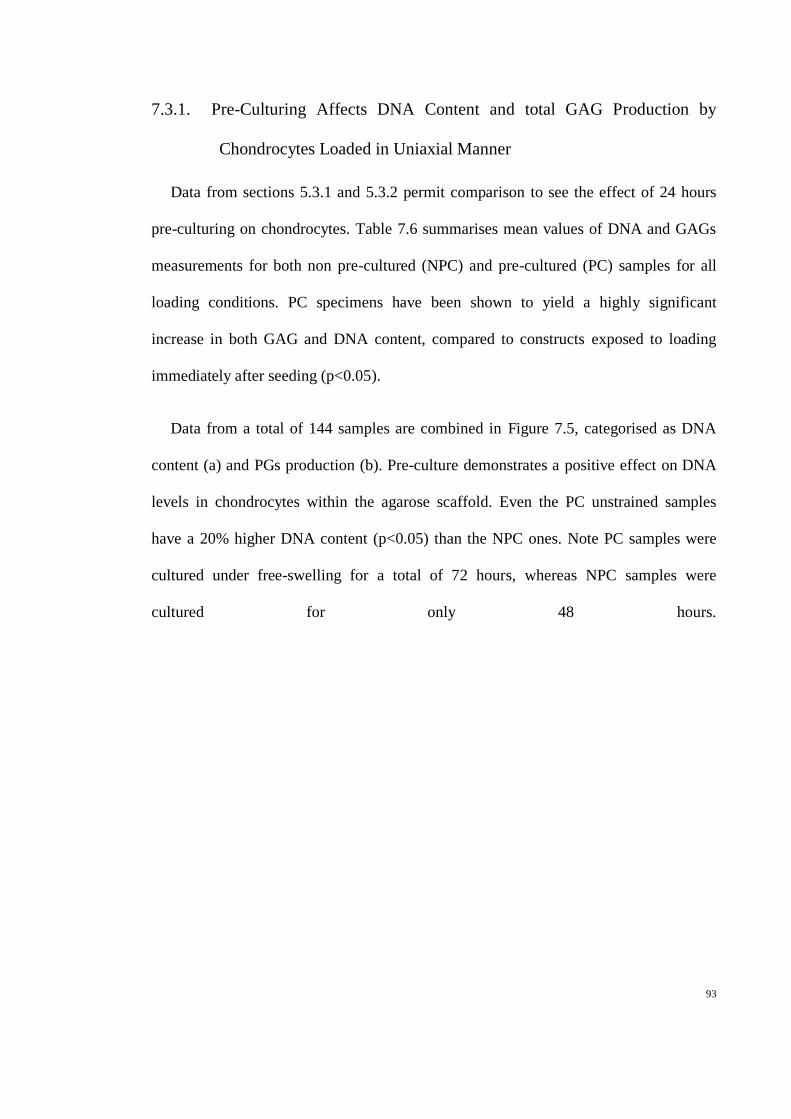
Table 7.6 Mean values of DNA content, GAGs measured in medium and in constructs of non pre-
cultured (NPC) and pre cultured (PC) specimens for all loading conditions. There were about
24 samples for each case. DNA levels were used as the baseline for proteoglycan synthesis
measurement. Values shown as mean ± SEM. Unless stated, ** shows p value of less than 0.05
between NPC and PC samples. ................................................................................................... 94
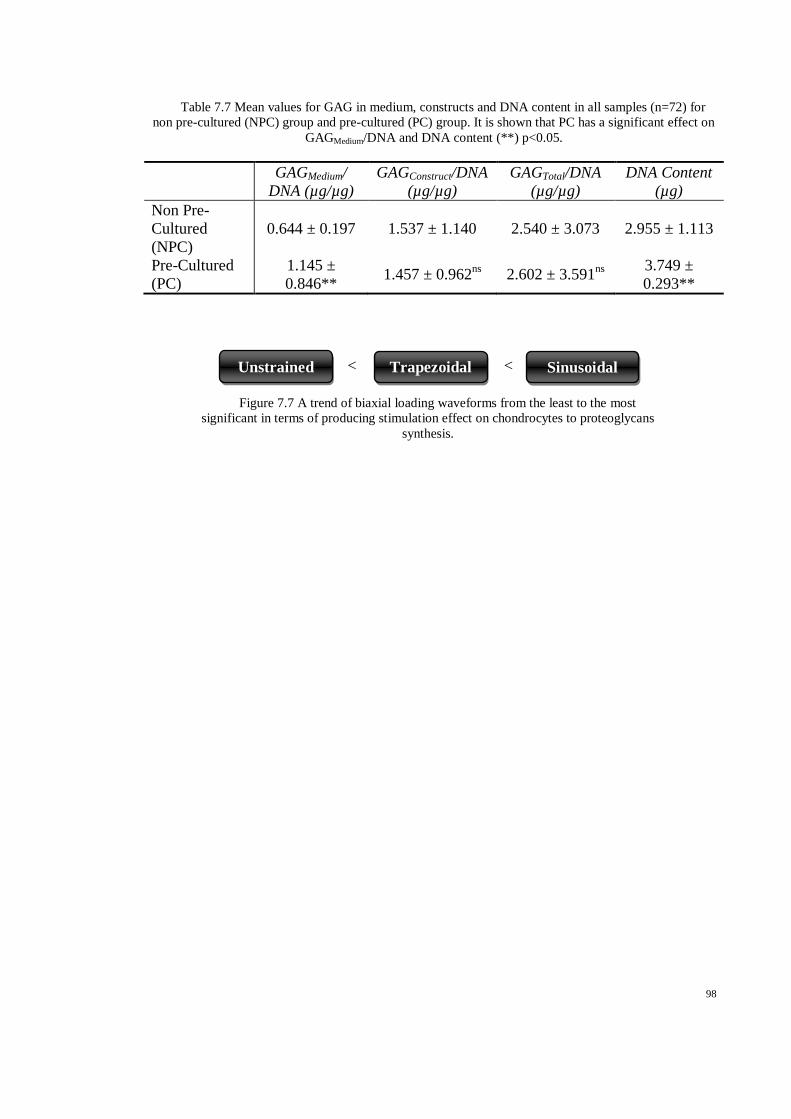
Table 7.7 Mean values for GAG in medium, constructs and DNA content in all samples (n=72) for
non pre-cultured (NPC) group and pre-cultured (PC) group. It is shown that PC has a
significant effect on GAGMedium/DNA and DNA content (**) p<0.05. ....................................... 98
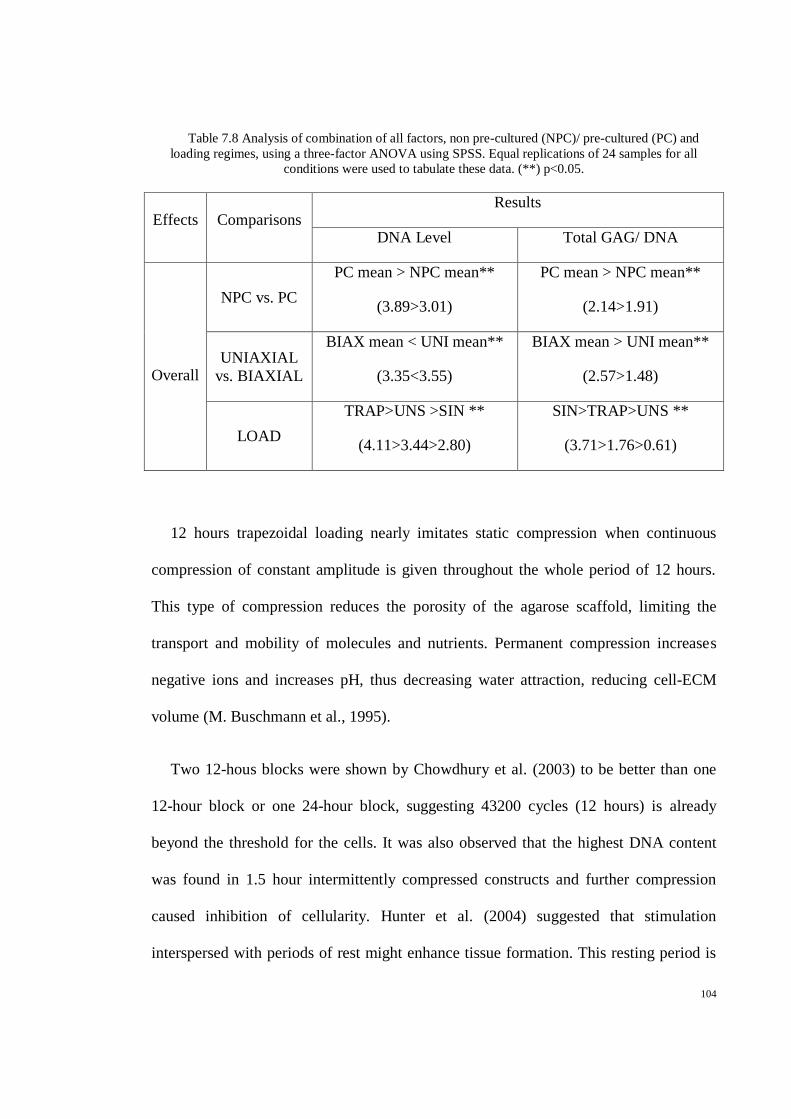
Table 7.8 Analysis of combination of all factors, non pre-cultured (NPC)/ pre-cultured (PC) and
loading regimes, using a three-factor ANOVA using SPSS. Equal replications of 24 samples
for all conditions were used to tabulate these data. (**) p<0.05. ............................................. 104
Page 18
xviii
List of Symbols and Abbreviations
Analysis of Variance ANOVA
Articular Cartilage AC
Dimethylmethylene blue DMB
Dulbecco‟s Modified Eagles Medium DMEM
Earl‟s Balanced Salt Solution EBSS
Endoplasmic Reticulum ER
Extracellular Matrix ECM
Feotal Bovine Serum FBS
Glycosaminoglycan GAG
Growth Factor GF
Hyaluronic Acid HA
Immunoglobular IG
Intermediate Filament IF
Mesenchymal Progenitor Cell MPC
Mesenchymal Stem Cell MSC
Microfilament MF
Microtubule MT
Nitric Oxide NO
Non Pre-Cultured NPC
Osteoarthritis OA
Polyethylene PE
Polyglycolic Acid PGA
Pre-cultured PC
Programmable Logic Controller PLC
Page 19
xix
Proteoglycan PG
Stainless Steel SS
Tissue Engineering TE
Page 20
1
Chapter 1. Introduction
1.1. Tissue Engineering
The aspiration of having human organs to ready order and so putting an end to organ
transplant waiting lists has given rise to high hope in tissue engineering. An interesting
research project by Dr. Charles Vacanti at the laboratory of University of Massachusetts
Medical Centre involved growing a human ear on the back of a mouse. Teams of
researchers throughout the world have managed to produce new pulmonary arteries, jaw
bones and teeth (Meyer, 2009; Parry, 2005). Tissue engineering has become a very
promising biomedical technology.
Tissue engineering is the evolution of biological substitutes through the use of living
cells and materials of synthetic or natural origin, and the fostering of tissue regeneration
and remodelling. The objective of multi-disciplinary tissue engineering is to restore
tissue structure and function that is lost due to trauma, diseases or hereditary
abnormalities. Three main components of tissue engineering are cells, matrix and
signalling molecules (Yang & Elisseeff, 2007).
In tissue engineering, cells are the architects of all types of tissues. Tissue
engineering approaches are initiated by acquiring large numbers of cells from tissues.
Cells are the biological sources of components for the extracellular matrix (ECM)
(Muir, 1995). The potential availability of primary cells that can be implanted at the
impaired regions is very limited due to immunological rejection. While
immunosuppressive drugs or autologous cells can be used to solve the rejection
problem, long term results remain unsatisfactory (M. Buschmann, Gluzband,
Page 21
2
Grodzinsky, & Hunziker, 1995; Estes, Gimble, & Guilak, 2004; McMahon, Reid,
Campbell, & Prendergast, 2008). Besides primary cells, multipotent progenitor cells
such as mesenchymal stem cells and embryonic stem cells are also capable of
differentiating into connective tissue cells (Yang & Elisseeff, 2007).
Cells alter their internal forces when a change in external loading is sensed. It is
believed that this mechanism has a role in regulating cell functioning, growth and
remodelling. Studies have shown that mechanical stimuli are capable of initiating
biochemical signalling (Michael D. Buschmann et al., 1999; Y. Kim, Bonassar, &
Grodzinsky, 1995; Seidel et al., 2004; Shiu, 2007; Waldman, Spiteri, Grynpas, Pilliar,
& Kandel, 2004).
Signalling molecules can also be triggered by growth factors (GFs). Insulin like
growth factors (IGFs), fibroblast growth factors (FGFs) and platelet-derived growth
factors (PDGFs) are some of the growth factors used in tissue engineering. Initially,
GFs were injected directly into the tissues. However, this method is unfavourable since
GFs have very short half-lives in vivo. Encapsulation of GFs into scaffold results in
stabilization of GFs in the matrix and controlled release of GFs into the cell
microenvironment (Farach-Carson, Wagner, & Kiick, 2007).
Besides cells and signalling molecules, a scaffold that works as temporary matrix is
also essential. Cell-seeded scaffolds act as structural supports for cells at the primitive
stage of tissue development, both in terms of promoting desired phenotype and
regeneration of cartilage. Cells attach to the matrix of the scaffold temporarily and the
matrix eventually degrades to provide more space for the newly synthesized ECM.
Besides being biodegradable, a three dimensional scaffold must also be non-toxic,
Page 22
3
biocompatible and non-immunogenic. Higher porosity of the scaffold results in better
nutrient and waste diffusion into the scaffold and cells (Yang & Elisseeff, 2007).
Both natural and synthetic polymers can be used as scaffolds. Used individually or in
combination, their selection depends on the purpose, location and type of cells. Natural
polymers such as collagens and hyaluronan are widely used as these two components
are found in cells, besides agarose and alginate that are widely used in most studies
(Chai, Arner, Griggs, & Grodzinsky, 2010; Kock et al., 2009; R. M. Schulz, Wustneck,
Donkelaar, Shelton, & Bader, 2008; Zeiter, der Werf, & Ito, 2009). Synthetic polymers
such as polylactic acid (PLA), polyglycolic acid (PGA) and polylactic-co-glycolic acid
have shown positive results when seeded with cells (Agrawal & Ray, 2001; Ivan.
Martin et al., 2001). Further developments have enhanced the biocompatibity,
bioresponsiveness and biodegrability of synthetic polymers (Hern & Hubbell, 1998;
Rowley & Mooney, 2002).
1.1.1. Cartilage Tissue Engineering
The reason for the interest in cartilage within the present study emerges from the
high prevalence of joint ailments and the difficult there is in treating them effectively.
One in ten people worldwide have osteoarthritis, a recurring progressive degenerative
disease which is usually caused by trauma or overuse of the joints (Lohmander, 2003).
To gain an estimate of the scale of the problem, consider that treatment of arthritis costs
the British National Health Service more than £560 million annually, mainly drug and
rehabilitation costs (Morse, 2009). Medical costs, when added to lost productivity and a
degraded quality of life, make this a major and increasing expense in nations with
ageing populations.
Page 23
4
Cartilage as a tissue presents some unique challenges for orthopaedic medicine. At
the heart of the difficulty is a low turnover and self-repair ability which means that even
normal wear-and-tear over a lifetime can overpower the natural repair characteristics of
the surface and permit progressive degeneration. Whereas some tissues might be
expected to repair when given appropriate support and rest, this is rarely the case for
articular cartilage.
Because the root of the problem is an inability to effect natural repair, tissue
engineering (TE) is a solution of high potential. The concept of being able to create an
environment conducive to effective tissue re-growth and integration by means of a TE
strategy theoretically allows for a side-stepping of the ineffective natural repair process.
It will be noted that the two factors which most keenly influence the effectiveness of
a TE solution for articular cartilage are the extent to which a functional matrix can be
produced and the ability to stimulate and sustain cell proliferation. These are both the
product of the signalling strategy, the way in which the cells are manipulated by the
sending and triggering of signals such that they respond in the most advantageous
manner.
A typical TE strategy for cartilage repair involves functional cartilage grown in-vitro
on bioresorbable artificial scaffold, or osteochondral grafts delivered to the defect site
(Hyun & Chang, 2000).
1.1.2. Mechanical Load in Cartilage Tissue Engineering
Articular cartilage itself is remarkable for its load-bearing location, being subjected
to complex loading patterns which help to define, refine and remodel the tissue.
Page 24
5
Mechanical loading is thus a part of the normal physiological environment for articular
chondrocytes, and something which is of particular importance to the signalling
strategy. That there is a role of mechanical load in cartilage tissue remodelling and
chondrocyte signalling has been clearly established (Lucchinetti, Bhargava, & Torzilli,
2004; Macdonald, 2002; J.K. Mouw, Imler, & Levenston, 2007). What remains
unanswered is what this role is, and most specifically, the route in which the mechanical
environment used within a TE strategy influences matrix synthesis and cell
proliferation.
There are a number of ways to investigate this interrelation. One approach is to use
methods from cellular physiology to understand the mechanisms used by the cell to
sense and respond to mechanical loading. This has brought significant understanding to
the field (Wang & Thampatty, 2006), however it is rare for such an approach to produce
results directly applicable to a TE strategy. Another important form of research
involves engineering optimisation of the process, which takes the form of a structured
analysis of the way in which the input parameters influence the output variables. This
leads to a practical understanding of the way in which a TE strategy can be designed,
optimised and implemented – and both supports and is supported by cellular
physiology.
Within this present work, the second of these approaches is to be applied. The
differential response of articular cartilage (AC) derived chondrocytes to a progressive
optimisation and modification of mechanical loading will be analysed in terms of cell
proliferation and matrix synthesis. The work thus aims to bring about a greater level of
Page 25
6
understanding such that TE strategies for articular cartilage might be better guided by
confirmed results demonstrating what has been shown to bring about optimal results.
Thesis Structure
The work is structured such that the current state of scientific knowledge across the
field is reviewed. Following this, the general methods and background theories which
support the investigation to follow are described and specific constraints and limitations
described.
The experimental work is reported as three successive studies. The first outlines
crucial work undertaken in the optimisation of experimental methods, specifically in the
isolation of viable articular chondrocytes. The next two studies are a progressive
investigation into the response of articular chondrocytes to a variety of loading regimes:
the influence of static and dynamic uniaxial loading; the differential effect of biaxial
loading; and, the extent to which pre-culture time modulation effects change in output
metabolism.
The studies are brought together with a general discussion of the interrelation of
results obtained and reflections upon comparable studies from other researchers. The
present work ends with a general conclusion which reiterates the points determined
through the research study as a whole and points to their applicability both in terms of
clinical or research practice, and as a foundation for further investigative studies.
1.2. Aims and Objectives
Physiological loading patterns produced by gait and walking activities comprise a
combination of loading forms, varying in terms of approximately equivalent to
Page 26
7
frequency, force, waveform and duration, and including a variable mix of static,
compressive and shear loading components.
Studies have shown that mechanical stimuli are capable to initiate biochemical
signalling, which subsequently direct and mediate both anabolic and catabolic
processes. This study is designed to characterize the response of tissue engineered
chondrocytes to being exposed to complex biaxial mechanical loading regimes. A
correlation between mechanical loading and mechanotransduction through the effect of
compression and shear strains on cytoskeleton of chondrocytes will later be explained at
the end of this study.
The aim of this study is to see the effect of mechanical stimulation on chondrocytes.
Secondary objectives are:
To optimize isolation protocols to obtain the highest cell yield and greatest
cell viability
To analyze the reaction of chondrocytes towards dynamic mechanical
loading
To assess the effect of various mechanical loading patterns (uniaxial and
biaxial) on chondrocyte proliferation and GAG synthesis, using established
biochemical assays.
Page 27
8
Chapter 2. Literature Review
In order to properly investigate the chosen topic it is important to have a detailed
understanding of the underlying biological and scientific fields. Of particular centrality
is cartilage itself, and this is treated first – in terms of its anatomy, physiology,
biomechanics and common forms of pathology. The second section focuses upon the
chondrocyte, the most prevalent cell within cartilage and the biological entity
responsible for cartilage maintenance, repair, turnover and remodelling.
Next, the specific challenge of TE of cartilage is addressed. This involves first a
review of forms, methods and results obtained through existing strategies for TE of
cartilage. Following this a detailed review section is presented focused upon the
specific role of mechanotransduction within cartilage signalling and tissue engineering
strategies. Particular attention is given to the contribution of a wide range of
investigational techniques to the current state of knowledge regarding this
mechanotransduction such that a comprehensive picture is built through the literature
review process. The state of current scientific knowledge, and proper consideration of
established methodologies and protocols, allows for the study to be well designed and to
be focused upon answering questions in such a way that they contribute to the leading
edge of research in the field.
Page 28
9
2.1. Cartilage
Cartilage is a specialised type of connective tissue that is semi-transparent, flexible
and elastic. Like other connective tissues, cartilage consists of cells, collagen fibres and
matrix. There are three distinctive types of cartilage; 1) elastic cartilage, 2)
fibrocartilage and 3) hyaline cartilage.
The properties of elastic cartilage are a result of the combination of high
concentrations of elastin and low density of collagen fibres (Porth, 2007).
Microscopically, this yellowish cartilage can be recognized by its chondrons that
contain few cells (Gartner, Hiatt, & Strum, 2006). This tissue type is less vulnerable to
degenerative changes, due to the perichondrium encircling the elastic cartilage and its
location being at non-loading areas such as the epiglottis, the wall of Eustachian tubes
and the small bronchi (Porth, 2007). Fibrocartilage, on the other hands, contains
longitudinal, circumferential oriented collagen fibres, making it suitable to withstand
compression at the intervertebral discs and pelvis. Besides elastic cartilage and
fibrocartilage, hyaline cartilage is a type of cartilage that can be found abundantly in
human body. During early stages of life, hyaline cartilage forms the embryonic
skeleton. Hyaline cartilage inside bones serves as the centre of ossification. A special
type of hyaline cartilage, articular cartilage (AC) covers articulating joint surfaces at the
ends of long bones (Porth, 2007).
Within this thesis, the focus will be exclusively on AC and references to cartilage
which are unqualified should be understood as referring to AC.
Page 29
10
2.1.1. Gross Anatomy
Articular cartilage is a glassy, smooth and glistening cartilage that covers the bone at
the diarthrodial joints. AC is an inhomogeneous tissue that has a very complex
composition and architecture. Being biphasic, 70-80% of its ECM is comprised of
water, whilst the solid phase of the ECM contains collagens, proteoglycans (PGs), non-
collagenous proteins and glycoproteins. ECM supplies each cell with architectural cues,
growth factors, differentiation factors, cytokines and ion gradients (Farach-Carson,
Wagner, & Kiick, 2006).
AC minimizes the friction produced between joints at rigid bones and it distributes
contact pressure to the subchondral region of the trabecular region. It can be found at
the articulating joints such as knee, hip and shoulder. AC with thickness at a range of 2
to 5 mm caps the ends of bone that form synovial joints (Athanasiou, Darling, & Hu,
2009; Shindle, Li, Kelly, & Potter, 2010).
2.1.2. Collagen
An important component that makes up one-third of the total weight of cartilage in
humans is collagen. Collagen is an insoluble fibrous protein in the ECM that serves as a
framework or internal scaffolding where chondrocytes anchor. The basic structural unit
of collagen is a triple helix. Three left-handed coiled precursor polypeptides α-chains,
consequent to the huge quantities of proline and glycine, twist together to form a triple
helix that coils right-handedly. The triple helix is stabilized by many hydrogen bonds.
The amino acid sequences of the triple helix collagen are generally Gly-X-Pro and Gly-
X-Hyp. The third residue of the triple helices is glycine. The steric hindrance requires
that glycine be the third residue. The interior axis of the helix can only fit the single
Page 30
11
functional group of glycine; the hydrogen atom (Mankin, Mow, Buckwalter, Lannotti,
& Ratcliffe, 1994).
The triple helix of α-chains undergoes modification before being secreted from the
endoplasmic reticulum (ER). Selected proline and lysine amino acids are subjected to
hydroxylation followed by glycosylation. Hydroxyproline is essential for constituting a
helical structure, while the process of adding galactose and glucose to the hydroxylysine
determines the size of the collagen fibrils (Stockwell, 1979).
Post-translational modification then takes place extracellularly, where crosslinking of
enzymes initiates collagen molecules to self-assemble into D-staggered-arrays with
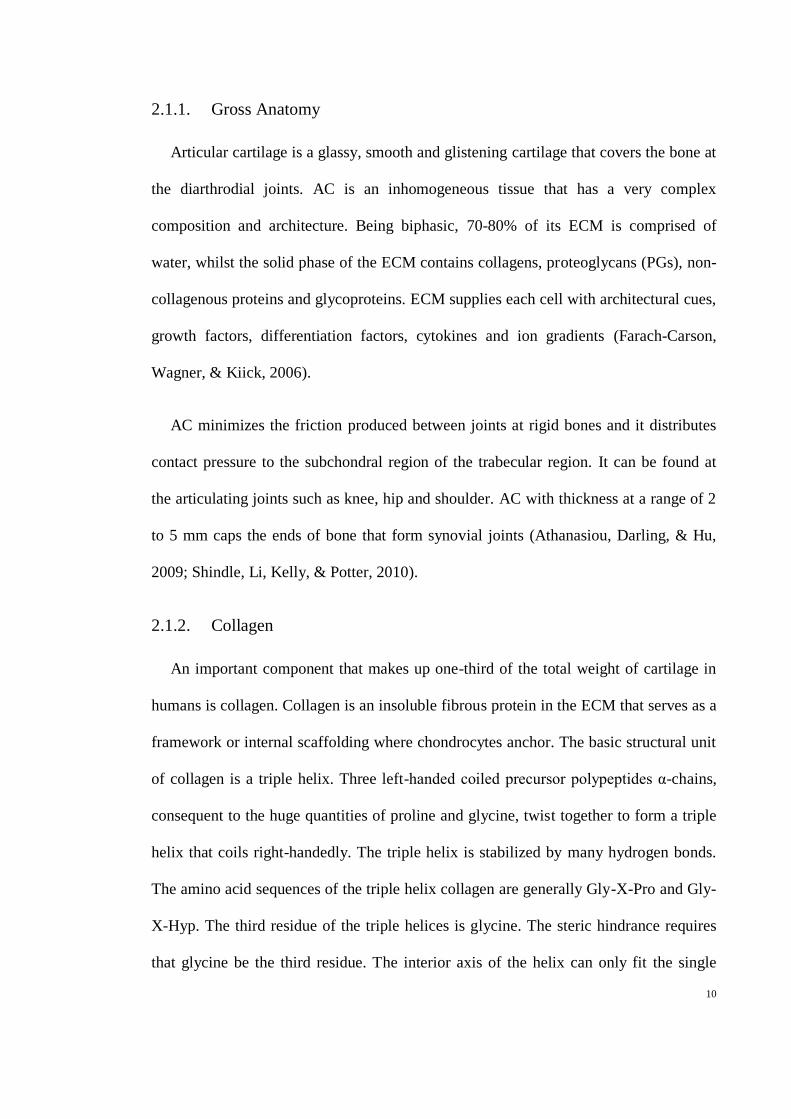
unique patterns of bands repeated every 67 nm (Refer Figure 2.1) (J. Buckwalter et al.,
1987).
There are a few types of collagen in articular cartilage. Those that form the basic
architecture are type II (about 90-95%) and a member in the subgroup Fibril Associated
Collagens with Interrupted Triple helices (FACITs), type IX and type XI collagen that
can be found within the fibrils. Besides these, small amounts of types III, VI, XII and
XIV collagen can be found in this tissue (Eyre, 2002).
Page 31
12
Three chains
assemble
Procollagen
peptidase
Assembly Assembly
Collagen fiber
10µm x 50nm
Collagen fibril
1µm
67 nm
Collagen molecule
Tropocollagen
(triple helix with
loose ends)
300nm x 1.5nm
Precursor α
chain
~1nm
Amino-acid
sequence
Gly
Gly
Gly
X
Y
X
Y
X
Y
a b c d e
tail
head
Figure 2.1 Collagen fibril and triple helix tropocollagen. (a-c) Repeating disaccharides building an amino acid sequence called precursor that coils left-
handedly to form a triple helix. (d) The propeptides cleaved together to form collagen fibrils. The distance between the “head” (↑) and the “tail” (•) of the
next collagen molecule is constantly about 67nm. This constant value is important for the collagen fibrils to produce a structured formation called “staggered-
array”. The interactions between parallel groups are moderated by covalent bonds. (e) Bunch of collagen fibrils are densely-packed forming collagen fibrils.
Adapted from Lodish, Berk et al. (2000) and Massachusetts Institute of Technology (2006).
Page 32
13
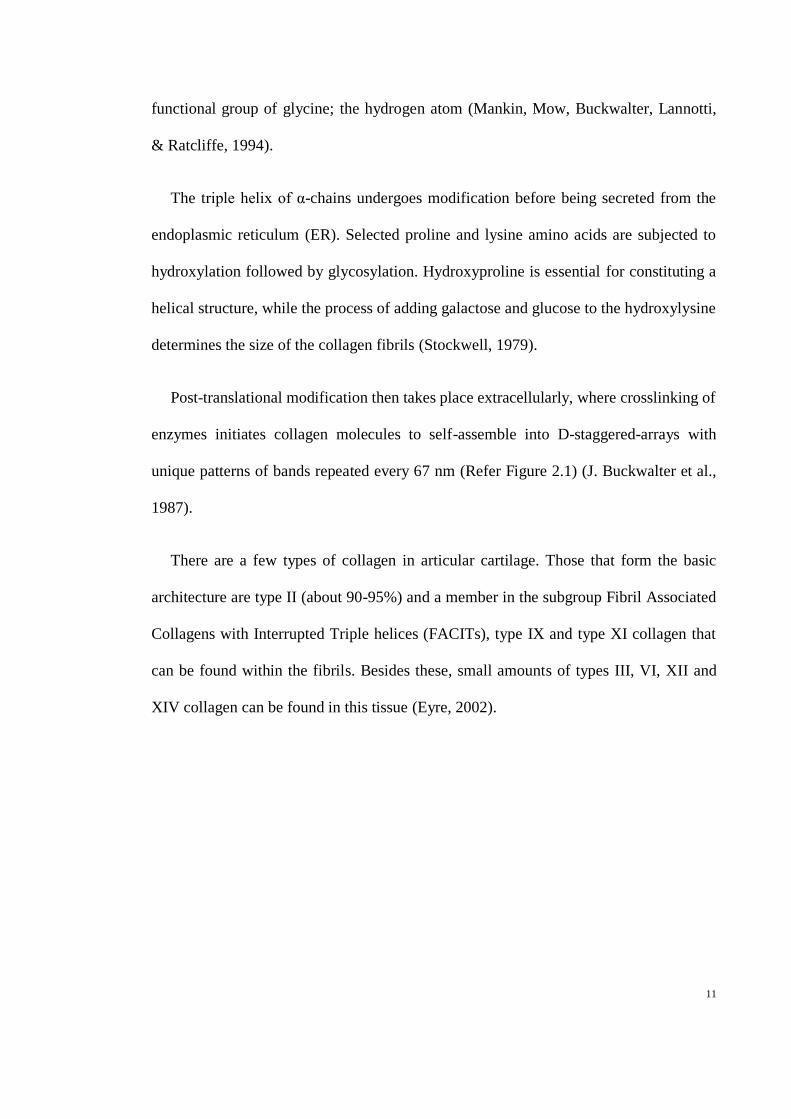
Generally, collagen in articular cartilage provides the dominantly tensile behaviour
of the tissue. Collagen also immobilizes the proteoglycans within the ECM (Mankin et
al., 1994; Mow et al., 1990; R. Schulz & Bader, 2007; Yang & Elisseeff, 2006). This
characteristic is due to the formation of collagen fibres (due to the triple-helical
structure of collagen molecules) and zonal arrangement (Figure 2.2); in terms of
fibrillar architecture with tissue depth.
The structure and protein distribution of cartilage can be signified in four zones of
cartilage (Figure 2.2). The four zones are superficial, middle, deep and calcified
cartilage. The collagen fibrils in the superficial zone are thin, condensed and lie parallel
to the plane of the articular surface. The highly ordered collagen fibres are essential in
providing AC with shear stress resistance, as this region of cartilage embraces
tangential tensile stress (Mow et al., 1990).
Superficial
zone
Middle
zone
Deep zone
Calcified
cartilage
Tide mark
Figure 2.2 Zonal arrangement of fibrillar architecture. From outermost (contact with
AC) to innermost (next to subchondral bone): superficial zone, middle zone, deep zone and
calcified zone. Adapted from Mow, Fithian et al. (1990).
Page 33
14
The scanning electron microscopy (SEM) shows that collagen fibrils in the deep
zone are structured orthogonally to the surface of the articular cartilage (Eyre, 2002; R.
Schulz & Bader, 2007). In this region, fibre diameters are bigger than the fibres in other
regions to provide compressive strength (Stockwell, 1979). About 5-10% of the matrix
volume in the calcified region is occupied with collagen fibrils aligned radially (Bader
& Lee, 2000).
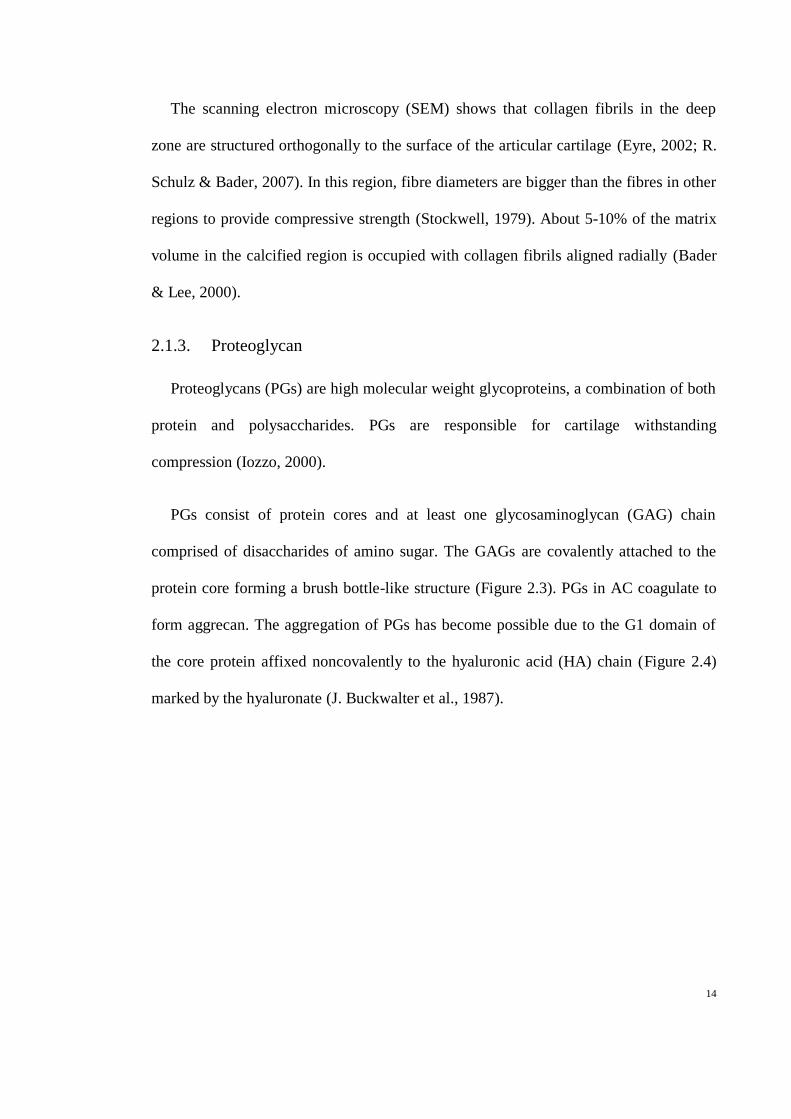
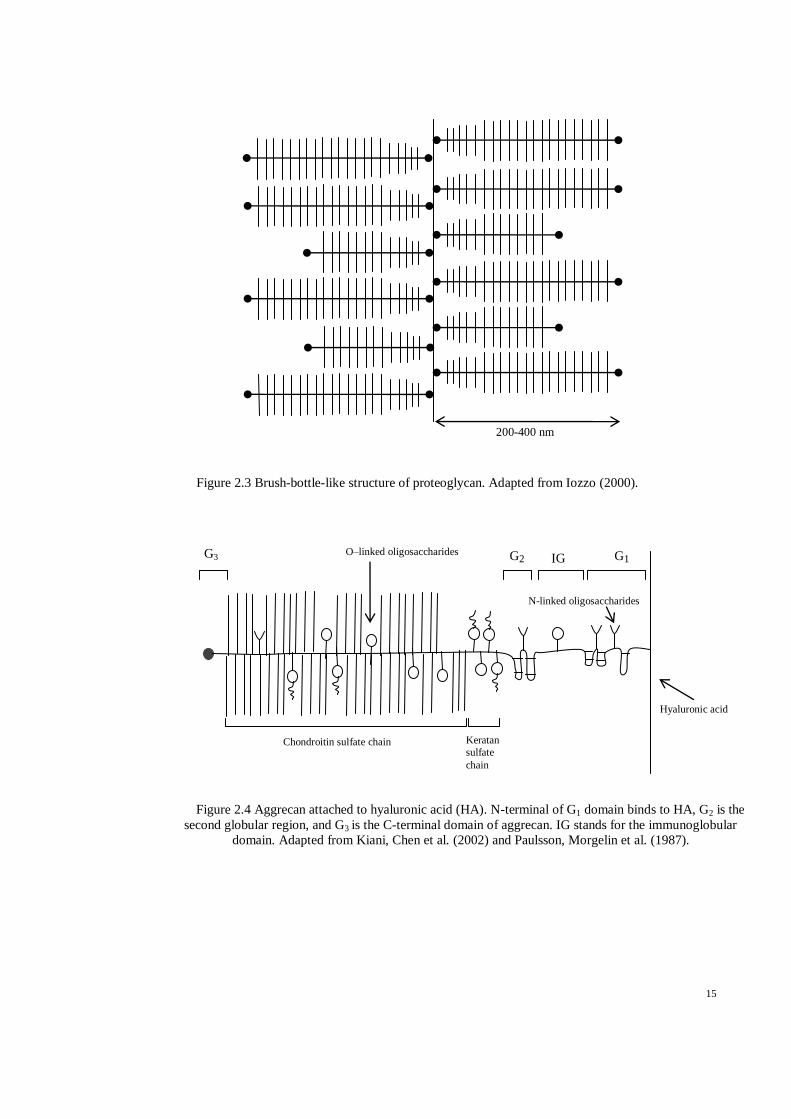
2.1.3. Proteoglycan
Proteoglycans (PGs) are high molecular weight glycoproteins, a combination of both
protein and polysaccharides. PGs are responsible for cartilage withstanding
compression (Iozzo, 2000).
PGs consist of protein cores and at least one glycosaminoglycan (GAG) chain
comprised of disaccharides of amino sugar. The GAGs are covalently attached to the
protein core forming a brush bottle-like structure (Figure 2.3). PGs in AC coagulate to
form aggrecan. The aggregation of PGs has become possible due to the G1 domain of
the core protein affixed noncovalently to the hyaluronic acid (HA) chain (Figure 2.4)
marked by the hyaluronate (J. Buckwalter et al., 1987).
Page 34
15
O–linked oligosaccharides
Chondroitin sulfate chain
N-linked oligosaccharides
G2 G1 G3 IG
D
Keratan
sulfate
chain
Hyaluronic acid
200-400 nm
Figure 2.3 Brush-bottle-like structure of proteoglycan. Adapted from Iozzo (2000).
Figure 2.4 Aggrecan attached to hyaluronic acid (HA). N-terminal of G1 domain binds to HA, G2 is the
second globular region, and G3 is the C-terminal domain of aggrecan. IG stands for the immunoglobular
domain. Adapted from Kiani, Chen et al. (2002) and Paulsson, Morgelin et al. (1987).
Page 35
16
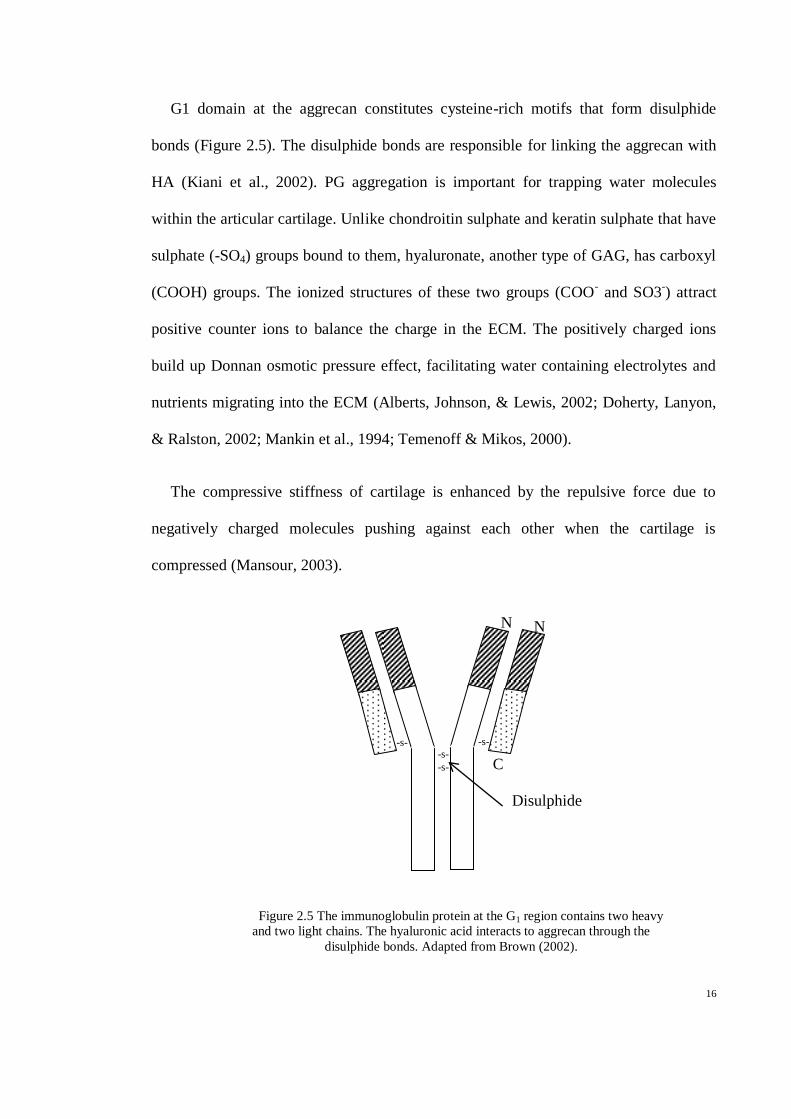
G1 domain at the aggrecan constitutes cysteine-rich motifs that form disulphide
bonds (Figure 2.5). The disulphide bonds are responsible for linking the aggrecan with
HA (Kiani et al., 2002). PG aggregation is important for trapping water molecules
within the articular cartilage. Unlike chondroitin sulphate and keratin sulphate that have
sulphate (-SO4) groups bound to them, hyaluronate, another type of GAG, has carboxyl
(COOH) groups. The ionized structures of these two groups (COO- and SO3
-) attract
positive counter ions to balance the charge in the ECM. The positively charged ions
build up Donnan osmotic pressure effect, facilitating water containing electrolytes and
nutrients migrating into the ECM (Alberts, Johnson, & Lewis, 2002; Doherty, Lanyon,
& Ralston, 2002; Mankin et al., 1994; Temenoff & Mikos, 2000).
The compressive stiffness of cartilage is enhanced by the repulsive force due to
negatively charged molecules pushing against each other when the cartilage is
compressed (Mansour, 2003).
N N
C
Disulphide
bonds
-s-
s- -s-
s-
-s-
s-
-s-
s-
Figure 2.5 The immunoglobulin protein at the G1 region contains two heavy
and two light chains. The hyaluronic acid interacts to aggrecan through the
disulphide bonds. Adapted from Brown (2002).
Page 36
17
2.1.4. Other Extracellular Matrix Molecules
Glycoproteins help to sustain the ECM and are involved in the chondrocyte-matrix
interaction. The physical properties of cartilage and its cellular function are influenced
by the supramolecular assembly of the cartilage matrix, coordinated by a group of small
molecules called non-collagenous proteins, such as integrin, chondronectin, fibronectin
and cartilage oligomeric matrix protein (COMP).
Integrins are found transversely aligned at the cell membrane with two glycoprotein
subunits on the extracellular side, serving as binding sites for cell-ECM and cell-cell
adherence. Integrin receptors act as the adhesion sites between chondrocytes and
fibronectins. This complex integration is mediated by COMP (Di Cesare et al., 2002).
Intracellularly, environmental and mechanical stimuli signalling are sent to the
cytoskeleton protein through the integrins (Mankin et al., 1994).
Cartilage-specific fibronectin isoform has high affinity for decorin. Decorin is a
small leucine-rich PG that has chondroitin sulphate GAG attached (Gendelman, Burton-
Wurster, MacLeod, & Lust, 2003). An interaction between the C-terminal domain of
COMP and the non-collagenous domain of type-XI collagen has been observed (Holden
et al., 2001).
2.1.5. Matrix Water
Water comprises about 80% of the volume of cartilage ECM, resultant to the
hydrophilic properties of the proteoglycans. The fluid is driven from the synovial fluid
to provide nutrients and oxygen to the AC and function as a lubricant to the joint
(Wooley, Michele, & Radin, 2005). In the ECM, the water is entrapped within the bulky
Page 37
18
aggrecans, making it very difficult to travel within the ECM. This impermeability along
with high frictional forces enables AC to support high loads (Mankin et al., 1994).
The amount of water depends on the fixed charge density and an organization of
collagen that brings to resistance to swelling due to the strength or stiffness of the
collagen network.
2.1.6. Cartilage Physiology
Whilst other types of cartilage depend on perichondrium for nutrients and growth
factors, the lack of a perichondrium surrounding AC means it has to rely on the synovial
fluids entrapped within the AC capsule for nutrients. Nutrient in adequacy is worsened
by AC being avascular.
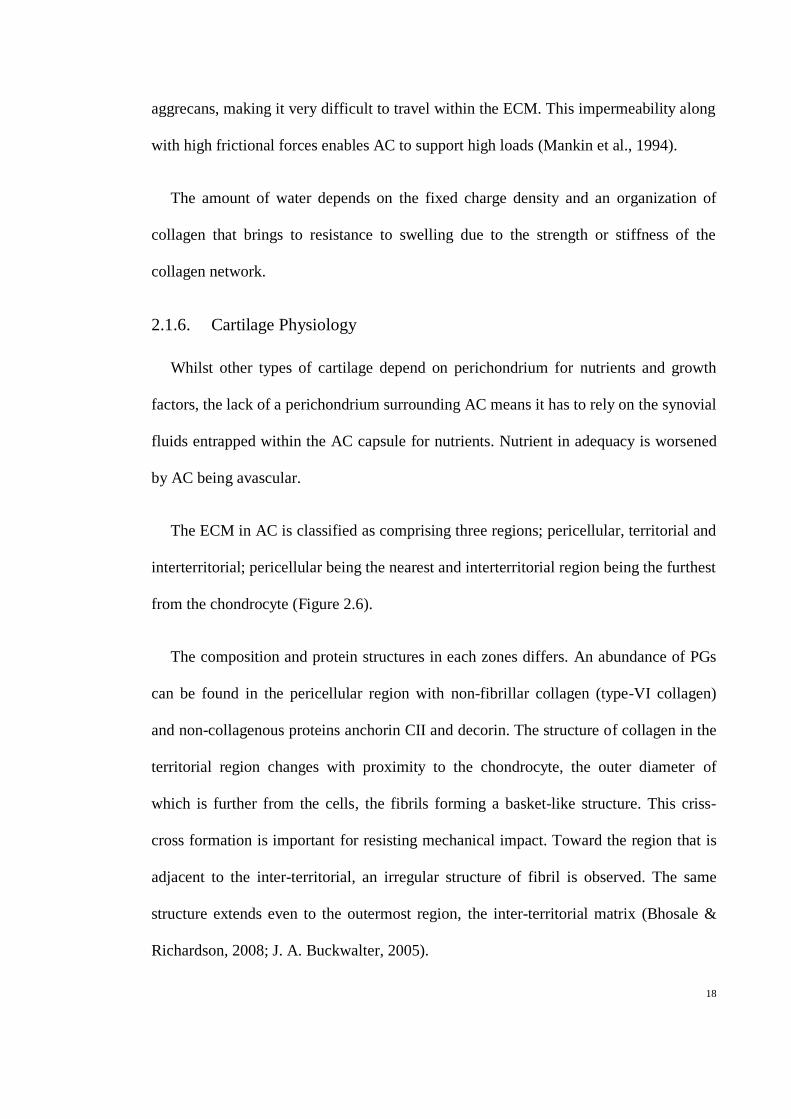
The ECM in AC is classified as comprising three regions; pericellular, territorial and
interterritorial; pericellular being the nearest and interterritorial region being the furthest
from the chondrocyte (Figure 2.6).
The composition and protein structures in each zones differs. An abundance of PGs
can be found in the pericellular region with non-fibrillar collagen (type-VI collagen)
and non-collagenous proteins anchorin CII and decorin. The structure of collagen in the
territorial region changes with proximity to the chondrocyte, the outer diameter of
which is further from the cells, the fibrils forming a basket-like structure. This criss-
cross formation is important for resisting mechanical impact. Toward the region that is
adjacent to the inter-territorial, an irregular structure of fibril is observed. The same
structure extends even to the outermost region, the inter-territorial matrix (Bhosale &
Richardson, 2008; J. A. Buckwalter, 2005).
Page 38
19
The pericellular and territorial regions are responsible for protecting the cell during
loading, functioning as an attachment medium for chondrocytes, and facilitate the
transmission of mechanical signals to chondrocytes. The mechanical strength of the
cartilage is believed to be caused by the large fibril diameter in the interterritorial area
(J. A. Buckwalter & Mankin, 1997a; Mankin et al., 1994). ECM stores cytokines and
growth factors that are important to regulate chondrocytes. Type of nutrient,
concentration and rate of nutrient diffusion are all profoundly controlled within the
ECM (Bhosale & Richardson, 2008).
Pericellular
Territorial
Interterritorial
Figure 2.6 Three regions that are identified that enveloped the chondrocytes; pericellular,
territorial and interterritorial. Adapted from Alberts, Bray et al. (1998).
Page 39
20
2.1.7. Cartilage Biomechanics
AC minimizes the frictional effects between joints at rigid bones and it distributes
contact pressure to the subchondral region of the trabecular region.
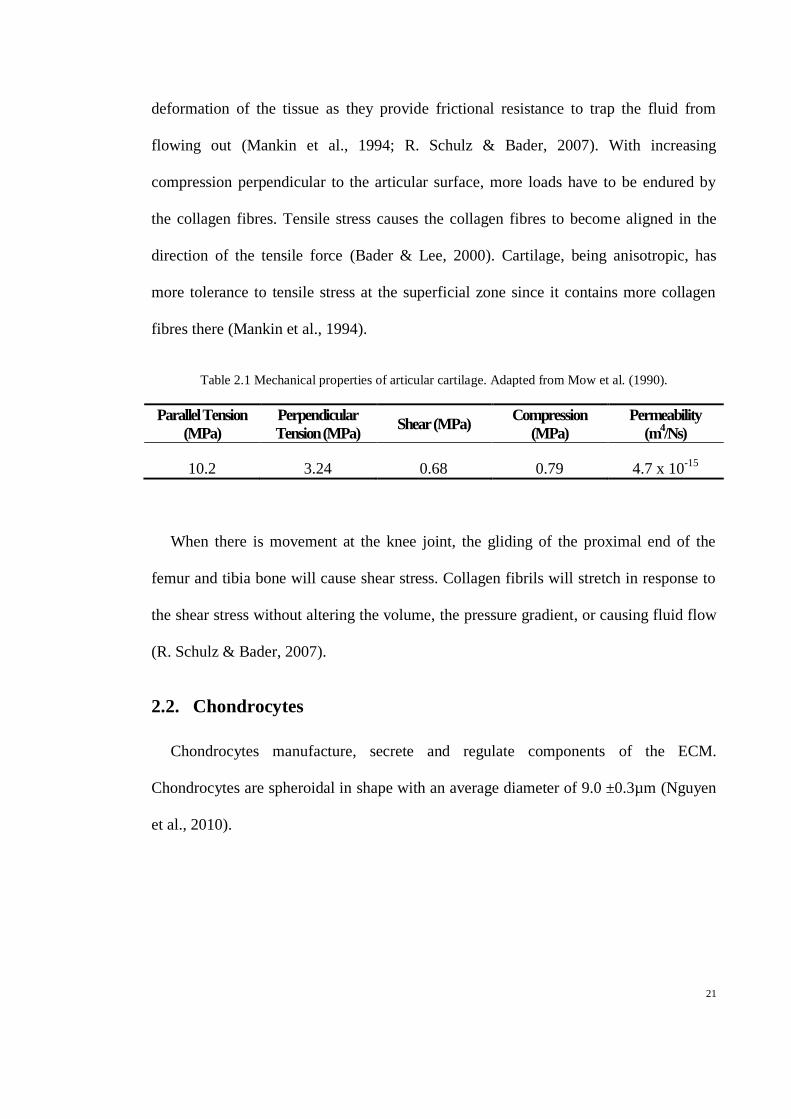
AC is known to have excellent mechanical properties. The unique mechanical
properties revealed by the AC are attributable to the variant composition and structure
including cell shape and collagen fibril orientation throughout the depth of AC (Mankin
et al., 1994). The tensile and shear stiffnesses of AC are contributed by the collagen
fibril structure. The tensile modulus of the articular surface of the cartilage being
exposed to 0 to 5% strains varies from 3.24 to 10.2 MPa. Shear strain of 0.001
administered at 1.0 Hz and 10% compressive strain gives shear modulus of 0.68 MPa.
When AC is given 0.17 MPa pressure gradients and 10% compressive strain, it shows
compressive modulus of 0.79 MPa (Table 2.1). In order for the cartilage to bear high
compressive loads, the collagen Type II fibres are structured in web-like structures
besides dense concentration of PGs. Besides, PGs also trap fluid within the ECM that is
responsible for the stress-relaxation behaviours of AC. The fluid in the cartilage
sustains osmotic forces that can bear up to 0.2 MPa or 2 atm of hydrostatic pressure (J.
Urban, 2000).
The superior biomechanical properties of AC are understood best when viewed as a
biphasic material. The solid phase constitutes collagens and PGs. This phase is porous
and permeable to the interstitial fluid that comprises the fluid phase. The fluid embodies
nutrients and ions that are distributed to the chondrocytes throughout AC for the sake of
maintenance of ECM. Fluid flow is induced by matrix compaction and pressure
gradients. High concentrations of PGs and negatively-charged ions slow the
Page 40
21
deformation of the tissue as they provide frictional resistance to trap the fluid from
flowing out (Mankin et al., 1994; R. Schulz & Bader, 2007). With increasing
compression perpendicular to the articular surface, more loads have to be endured by
the collagen fibres. Tensile stress causes the collagen fibres to become aligned in the
direction of the tensile force (Bader & Lee, 2000). Cartilage, being anisotropic, has
more tolerance to tensile stress at the superficial zone since it contains more collagen
fibres there (Mankin et al., 1994).
Table 2.1 Mechanical properties of articular cartilage. Adapted from Mow et al. (1990).
Parallel Tension
(MPa)
Perpendicular
Tension (MPa) Shear (MPa)
Compression
(MPa)
Permeability
(m4/Ns)
10.2 3.24 0.68 0.79 4.7 x 10⁻¹⁵
When there is movement at the knee joint, the gliding of the proximal end of the
femur and tibia bone will cause shear stress. Collagen fibrils will stretch in response to
the shear stress without altering the volume, the pressure gradient, or causing fluid flow
(R. Schulz & Bader, 2007).
2.2. Chondrocytes
Chondrocytes manufacture, secrete and regulate components of the ECM.
Chondrocytes are spheroidal in shape with an average diameter of 9.0 ±0.3µm (Nguyen
et al., 2010).
Page 41
22
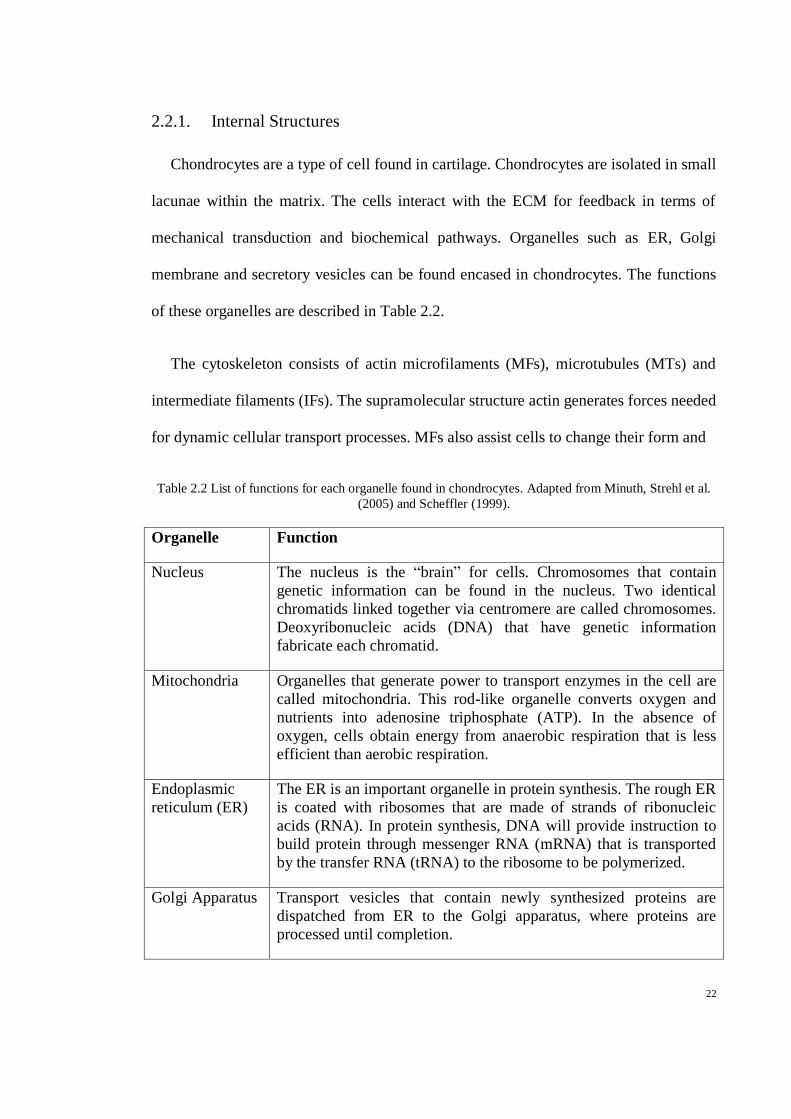
2.2.1. Internal Structures
Chondrocytes are a type of cell found in cartilage. Chondrocytes are isolated in small
lacunae within the matrix. The cells interact with the ECM for feedback in terms of
mechanical transduction and biochemical pathways. Organelles such as ER, Golgi
membrane and secretory vesicles can be found encased in chondrocytes. The functions
of these organelles are described in Table 2.2.
The cytoskeleton consists of actin microfilaments (MFs), microtubules (MTs) and
intermediate filaments (IFs). The supramolecular structure actin generates forces needed
for dynamic cellular transport processes. MFs also assist cells to change their form and
Table 2.2 List of functions for each organelle found in chondrocytes. Adapted from Minuth, Strehl et al.
(2005) and Scheffler (1999).
Organelle Function
Nucleus The nucleus is the “brain” for cells. Chromosomes that contain
genetic information can be found in the nucleus. Two identical
chromatids linked together via centromere are called chromosomes.
Deoxyribonucleic acids (DNA) that have genetic information
fabricate each chromatid.
Mitochondria Organelles that generate power to transport enzymes in the cell are
called mitochondria. This rod-like organelle converts oxygen and
nutrients into adenosine triphosphate (ATP). In the absence of
oxygen, cells obtain energy from anaerobic respiration that is less
efficient than aerobic respiration.
Endoplasmic
reticulum (ER)
The ER is an important organelle in protein synthesis. The rough ER
is coated with ribosomes that are made of strands of ribonucleic
acids (RNA). In protein synthesis, DNA will provide instruction to
build protein through messenger RNA (mRNA) that is transported
by the transfer RNA (tRNA) to the ribosome to be polymerized.
Golgi Apparatus Transport vesicles that contain newly synthesized proteins are
dispatched from ER to the Golgi apparatus, where proteins are
processed until completion.
Page 42
23
migrate (Schuler, Karlsson, Schutt, & Lindberg, 2006). MTs consist of two highly-
homologous proteins called α-tubulin and β-tubulin that are arranged to form a loose,
basket-like structure. MTs serve as tracks which manoeuvre transport vesicles
(Langelier, Suetterlin, Hoemann, Aebi, & Buschmann, 2000; Michels, 2002). Fibres
with a diameter of about 10nm form a rope-like structure constituting the IFs. Each
fibre consists of an amino-terminal globular head, a carboxyl-terminal globular tail and
a central elongated rod domain. The rope-like structure is initiated by α-helical dimers
of the rod domain (Alberts et al., 1998). IFs enable cells to withstand the stress of cell
stretching. IFs directly send signals for cell deformation, making them essential for
mechanotransduction. It was also found that IFs are abundant at the weight-bearing
region of cartilage (Langelier et al., 2000).
2.2.2. Chondrocytes Metabolism
It is believed that cilia extending from the cell assist sensing mechanical changes in
the ECM. Chondrocytes are initially differentiated from MSC (Tuan, Boland, & Tuli,
2003; R. Tuli et al., 2003). The cell then divides and produces two zones of matrix;
peripheral and central. The function of the matrix is to expand the articular surface,
while the central matrix serves as the centre of endochondral ossification of the
epiphysis. Maintenance of the ECM is the responsibility of chondrocytes by continuing
to synthesize proteins, despite the inability of chondrocytes to proliferate once matured.
Hence, cell capacity degrades with age and the remaining chondrocytes can no longer
compensate for the catabolic activity of the AC (J. A. Buckwalter & Mankin, 1997b).
The final stage of the development of growth plate cartilage is conveyed by the turnover
of matrix, mineralization, marrow vasculature and chondrocyte apoptosis (Farach-
Carson et al., 2006).
Page 43
24
In addition, the reduced cell capacity is also impaired by the limited nutrients that
can reach the chondrocyte due to the double diffusion barrier and charges. The low
permeability of the cartilage forces it to depend solely on anaerobic metabolism due to
the low concentration of oxygen in the chondrocytes (J. A. Buckwalter & Mankin,
1997a).
2.2.3. Zonal Variation in Chondrocyte Morphology
Referring to Figure 2.2, the uppermost zone of cartilage, the superficial zone is
bathed in the synovial fluid. Elongated chondrocytes lie parallel to the articular surface
at the bottom of the superficial layer, adjacent to the middle layer. The properties are
vital to accommodate the prolonged gliding motion of the articular joint as well as to
absorb mechanical shock. The superficial zone of the AC is capable to merge to the
surface of the proximal end of the femur, due to the low glycosaminoglycan content and
compressive modulus (Yang & Elisseeff, 2006).
The middle zone appears as rounded chondrocytes aligned in the same arrangement
as the collagen fibrils. Further, chondrocytes in the deep zone are spherical in shape and
each cytoplasm is stocked with ER, Golgi apparatus and mitochondria (J. A.
Buckwalter, 2005). The deep and calcified zones are distinctively separated by the
tidemark (Mankin et al., 1994). The cells in the calcified zone have nearly no
endoplasmic reticulum (J. A. Buckwalter, 2005).
2.2.4. Chondrocyte-ECM Interaction
Dynamic reciprocity between the ECM and the chondrocytes to regulate adhesion,
migration, cell division, differentiation, dedifferentiation and apoptosis is modulated by
the signalling cascade sent via the cytoskeleton.
Page 44
25
Chondrocyte adhesion molecules are the means to transmit signals from the
extracellular region to the cell. Some of the adhesion molecules that have been
identified are integrin, CD44 and human melanoma proteoglycan (HMPG/NG2).
Fibronectin adhesion to α5β1 integrin, in association with mechanical stimulus leads to
phospholyration of signalling molecules in the MAP kinase pathway, while α2β1
integrin provides adhesion site for the type-II and type-VI collagen (Helfrich & Horton,
2006).
2.2.5. Articular Cartilage Pathology
As the natural turnover level of cartilage and its ability to repair itself are both
relatively slow, minor injuries or lesions may lead to progressive damage of cartilage.
Unlike other types of tissues that can regenerate or heal intrinsically, cartilage, being
avascular, has a confined supply of nutrients because the fluid that contains nutrients
can only diffuse through the matrix, not being brought directly through blood vessels.
Its limited regenerative potentialities are also due to the dense composition of cartilage
(R. L. Mauck, Seyhan, Ateshian, & Hung, 2002).
Under normal conditions, low levels of degradative and synthetic enzyme activities
are balanced in order to maintain the volume of cartilage. In osteoarthritis (OA)
phenomena, matrix degrading enzymes are over-expressed compared to the constructive
enzyme, resulting in loss of collagen and PGs from the ECM.
OA is a degenerative joint disease that mainly arises from the cumulative effect of
joint wear and tear, especially at weight-bearing joints areas. Enzymatic degradation by
aggrecanase, collagenase and stromelysin reduces the concentration of aggrecan and
collagen. As a result, the water concentration and swelling pressure in cartilage
Page 45
26
increases and disrupts type-II collagen fibres. Destruction of the framework exposes the
cartilage to risk of load-bearing injury, since the PGs are not substantially contained
(Doherty et al., 2002).
Besides OA, rheumatoid arthritis is a joint autoimmune disease (Cotran, Kumar, &
Collins, 1999). It starts with swelling, followed by lymphocytes and macrophages
entrapped within the synovial membrane. These antigens initiate the chronic
inflammatory process where inflammatory granulation tissue is replaced by fibrous or
bony ankylosis (Doherty et al., 2002).
2.3. Tissue Engineering of Cartilage
Current treatments for degraded AC include cartilage transplantation and the
implantation of artificial polymers or metal prostheses. Transplantation is dependent on
limited donor tissue, while some studies on artificial prostheses have shown insufficient
mechanical strength and damage to the prosthesis, leading to chronic tissue
inflammation (Langer & Vacanti, 1993).
The US Food and Drug Administration (FDA) approved autologous chondrocyte
implantation (ACI) as a two-step procedure. Initially, chondrocytes are isolated from a
cartilage biopsy taken from a joint that is low-weight-bearing. The cells are then
expanded in-vitro to obtain sufficient numbers of cells. The cells, aspirated into a
syringe are then transferred to the cleaned lesion and covered with a periosteal flap.
Low to non-weight bearing active movement of the joint commences a few days after
surgery for rehabilitation purposes (Lindahl, Brittberg, & Peterson, 2003). The
mechanical strength of the resulting cartilage is debatable. Decline in mechanical
strength is believed to result from the non-uniform spatial distribution of chondrocytes
Page 46
27
and that the cells injected originated from non-weight bearing areas (Ringe & Sittinger,
2009; Temenoff & Mikos, 2000). However, a recent study has shown that the
distribution of cultured cells can be well distributed by attaching an angiocatheter onto
the syringe that contains cell suspension (Brittberg, 2008). Furthermore, the
fibrocartilage-like structure that was alleged to have low mechanical strength was
observed to eventually transform into hyaline cartilage due to loading (Lindahl et al.,
2003).
As explained in Chapter 1, the three main components of TE are cells, matrix and
signalling molecules. By far, chondrocytes are the best cellular candidates for cartilage
TE. Initial problems faced in getting sufficient chondrocytes are solved by expanding
cells in-vitro. However, cartilage cells cultured in monolayer for extended periods have
shown to change to the dedifferentiated fibroblastic phenotype and their function
change as they synthesize cartilage more fibrous-like in structure (H. W. Kim & Han,
2000). Besides cell dedifferentiation, there are also concerns related to donor site
morbidity and the limited life span of cells once extracted. These drawbacks have
motivated research into the possibility of using mesenchymal stem cells (MSCs) or
mesenchymal progenitor cells (MPCs) for such applications (Tuan et al., 2003; Tuli, Li,
& Tuan, 2003).
The biggest challenge in cartilage TE is to engineer weight-bearing tissue with
multiphasic cellular architechture. An effort to tackle this problem is to modify matrices
used to hold the structure of the cell seeded construct called the scaffolds. Increasingly
favoured porous 3D scaffolds that provide superior mechanical properties have been
used to assist cellular attachment. Besides mechanical properties, bonding to the host
Page 47
28
tissue, biocompatibility and internal cohesiveness need to be considered. In an attempt
to avoid the need for invasive surgery injectable, biocompatible and biodegradable
scaffolds have been used to encapsulate isolated chondrocyte at the defect. Yet, being
biodegradable, the material used is inferior in terms of its mechanical properties (Sims
et al., 1996). Most current endeavours to come up with heterogeneous scaffolds to
mimic multiphasic cartilaginous tissue have given positive results and currently these
scaffolds are at the stage of lab testing (Richard Tuli et al., 2003).
Besides cells and scaffolds, research has been carried out to integrate the applications
of bioreactors to cartilage TE. The use of bioreactors has enabled uniform distribution
of cells, efficient transport of biochemical initiators (i.e. growth factors) and precise
control of mass transfer rate, nutrient levels and pH. Besides, literature reports the
application of bioreactors to deliver physical stimuli to mimic in-vivo chondrogenesis
(Cooper et al., 2007; R. M. Schulz et al., 2008; R. Smith, Trindade, et al., 2000).
2.4. Mechanotransduction
The study of mechanical effects on cartilage metabolism has evolved since
osteoarthritis was associated with mechanical stress (Wilkins, Browning, & Urban,
2000).
Mechanical forces and deformations are sensed by cells and turned into biochemical
signals. The transduction of mechanical stress into biochemical signals by cells is
known as mechanotransduction. Signals are essential to adjust cellular and extracellular
structure. This evolution is essential in regulating chondrocyte function; both in
metabolic and catabolic modus operandi. The regulation can either be by proliferation,
differentiation, migration or apoptosis of cells. The organization and distribution of
Page 48
29
structural elements and organelles within cells adapt to the static and dynamic physical
stimuli; depending on the amplitude, frequency and duration of load given (Jennifer,
John, & Alan, 2003; Mobasheri et al., 2005).
2.4.1. Mechanical Signal Transduction at Multiple Levels
Tissue Level
Research has shown that a series of consequences such as extraction of fluid from
the cartilage ECM, the increase in cation concentration and extracellular osmolarity and
decrease in extracellular pH in ECM result from exposure of static loading of the
cartilage (Hart & Miller, 2004; Sharma, Saxena, & Mishra, 2007). On the other hand,
when cartilage is subjected to cyclic loading, the occurrence of hydrostatic pressure and
interstitial fluid flow have been observed in ECM (Chao, West, & Hung, 2006; Wilkins
et al., 2000; Wolf, Ackermann, & Steinmeyer, 2007).
Dynamic loading derives interstitial fluid flow. Fluid effusion exerts shear stress to
chondrocytes and their surrounding, since the permeability of the ECM is limited due to
the frictional drag force. The drag force can be contravened by the large speed of
interstitial fluid flow due to the compressive loads on cartilage. Therefore, interstitial
fluid flow not only accelerates transportation of low-infused macromolecules, it also
mobilizes the cation. When fluid exudates during compression, leaving negatively
charge PGs, cations will be drawn into the ECM (Hart & Miller, 2004). Furthermore,
this convective motion facilitates the transport of larger molecules such as growth
factors, cytokines and enzymes. The membrane transport process works better with the
aid of convective transport since it must counteract the small void between
glycosaminoglycan chains. The void size is around 30-40Ǻ (J. Urban, 1994).
Page 49
30
Being biphasic, cartilage needs equilibrium in terms of its solid and fluid contents in
order to withstand mechanical stress. Under prolonged exposure to static loading, fluid
loss increases the osmolarity of the ECM of cartilage as the ratio of PGs to fluid
increases. This change activates osmotically-gated ion channels that send signals to
chondrocytes to stop producing PGs (Oswald, Chao, Bulinski, Ateshian, & Hung, 2008;
J. Urban, 1994; Villanueva, Gladem, Kessler, & Bryant, 2009).
Anabolic and catabolic processes in cartilage happen anaerobically due to low
oxygen content at the ECM. This produces lactic acid. In healthy joints, high
concentrations of cations are attracted to the matrix to balance the negatively charge
PGs. The cations facilitate reduction the extracellular pH to 6.9 (Loret & Simões, 2007).
Static loading also reduces the pH of the cartilage, as interstitial fluid flows out of the
tissue. As a result, protons are attracted to balance the fixed negative charges of PGs.
These events of increment in lactic acid and protons do not contribute to normal growth
of cartilage (Wilkins et al., 2000).
In the phenomena of applying cyclic loading on chondrocytes, the interstitial fluid
flows in and out of the ECM. This movement causes streaming potentials that activate
voltage-gated ion channels to up-regulate GAG synthesis, which has been proven
through research that applies electrical current to chondrocytes (Akanji, Lee, & Bader,
2008).
Page 50
31
Cellular Level
Chondrocytes reciprocate to deformational changes of cartilage. Isolated
chondrocytes in high-density monolayer culture were exposed to intermittent
hydrostatic pressure at a modulus of 10 MPa for 4 hours per day for 4 days. The
hydrostatic pressure was given at a frequency of a normal walking motion, 1 Hz. It was
observed that there was an increase in the PGs and type II collagen mRNA production
(R. Smith, Lin, et al., 2000). Another study by Carver and Heath (1999) showed
intermittent hydrostatic pressure applied to cells seeded in PGA scaffold exhibited a
two-fold increase in the concentration of sulphated GAG than unloaded cells.
MacDonald (2002) suggests that hydrostatic pressure affects the kinetics of ion
channels as it was shown that there was an uptake of intracellular calcium through the
reaction of the Ca2+
dependent Na+ and K
+ channels.
It has been demonstrated that higher concentrations of PGs, larger cells and more
intracellular organelles can be found at the load-bearing areas of cartilage (J. Urban,
1994).
Guilak et al. (1995) studied chondrocytes‟ shapes and volume under compression.
They found that chondrocytes react differently to loading depending on their depth
through the cartilage. In unstrained conditions, chondrocytes are spherical. However,
when exposed to static and cyclic deformation, chondrocytes seeded in agarose/alginate
gels change to oblate ellipsoid morphology (F. Guilak et al., 1995; Knight, Ghori, Lee,
& Bader, 1998).
Page 51
32
Chondrocyte volume decreases as cartilage is deformed. This might be due to fluid
that is expelled from the tissue and cytoplasm. It was also found that when cartilage is
loaded vertically, the vertical radii of the cartilage decreases, but its horizontal radii are
unchanged (M. D. Buschmann, Hunziker, Kim, & Grodzinsky, 1996; Szafranski et al.,
2004).
Intracellular Level
A study on the effects of chondrocyte compression on intracellular organelles has
shown that the volume of the nucleus and other organelles change proportionally to the
cell volume, except for the Golgi apparatus. Even though the shape of the nucleus is
mediated by the cytoskeleton, it was concluded that intracellular osmotic gradients
influence the nucleus volume. Golgi is rather incompressible. It is known that
transcription process of aggrecan GAG happens in the Golgi. High density of GAG
facilitates Golgi‟s to conserve fluid and withstand compression (Szafranski et al., 2004).
Mechanochemical transduction arises at the focal adhesion that serves as the
integrin-binding site. The impulse is sent in both directions between the cytoskeleton
and the ECM. This eventually activates signalling pathways and transcript the gene
expression, leading to protein synthesis, cell proliferation and differentiation (Korossis,
Bolland, Kearny, Fisher, & Ingham, 2005; Lucchinetti et al., 2004)
External mechanical loads such as direct compression, tensile and shear force caused
cells to activate K+ channels, increase concentrations of free Ca
2+ intracellularly,
phosphorylate protein kinases and activate transcription factors (J. K. Mouw, Case,
Page 52
33
Guldberg, Plaas, & Levenston, 2005). Figure 2.7 shows mechanical inputs triggering
signalling pathways to regulate cell growth, cell functioning and cell remodelling.
The application of shear stress on the chondrocytes was also found to modulate the
metabolism of matrix through a pathway. This particular pathway involves synthesis of
nitric oxide, and activations of G protein and phospholipase C (R. Smith, Lin, et al.,
2000).
Intracellular signalling
Cytoskeleton
Gene
regulation
Protein synthesis
Cellular responses
Nuclear
membrane
Apical transmembrane
proteins
Cell-cell junctions
Focal adhesions
Extracellular matrix
External forces
Figure 2.7 Schematic diagram of cytoskeleton during mechanotransduction. Upon
experiencing shear stress, stretch and pressure; certain mechanosensors at the cytoskeleton will
transmit signals that concurrently inevitable to initiate cells‟ regulations.
Page 53
34
2.4.2. In-Vitro Mechanical Loading Studies
In vivo, AC is subjected to complex loading consisting of a combination of both
compressive and shearing forces under normal physiological condition (Mankin et al.,
1994). This complex mechanical loading was studied by multiple groups of researcher
using rotating ball, however the studies applying multi-directional load were hardly
quantified due to independent measures such as experimental setup (Grad et al., 2005;
Grad, Lee, Wimmer, & Alini, 2006; Heiner & Martin, 2004; Stoddart, Ettinger, &
Häuselmann, 2006; Wimmer et al., 2004).
Other studies that look into the effect of load to chondrocytes or cartilage explants
are summarised in Table 2.3. To summarise these literature reviews, dynamic
compression seems favourable for chondrocytes as dynamic compression caused
increased protein deposition. A range of values from 0.1 to 1 Hz is most common when
it comes to cyclic loading frequency, similar to normal human walking speed. On the
other hand, physiological physical load withstood by joint cartilage is a complex load
combination of compression and shear strains. The magnitudes of compression extend
from 10% to 15%, while shear strains range from 1% to 5%. These figures are closely
related to the weight an adult human has to withstand during walking and normal
physical activities.
Page 54
35
Table 2.3 Summary of studies that have been done to assess response of cartilage to mechanical load in-vitro.
References Mechanical Regimes
M. Buschmann, Gluzband et
al. (1995)
Static mechanical compression was delivered until final compressed thickness of the construct was
between 0.4 mm and 1 mm. Static compression was removed after 16 hours. Dynamic compression of 0.73
mm was delivered to each disk at frequencies of 0.001, 0.01, 0.1 and 1 Hz. Compression lasted for 10
hours. It was found that dynamic compression between 0.01 to 1 Hz caused increased protein deposition
with time.
Chowdury, Bader et al.
(2003)
The amplitude of the mechanical compression was 15%, given at a rate of 1 Hz. A longer duration of
compression (12 hours) was found to increase the PGs production, whereas a shorter intermittent
compression (1.5 hours) was essential to induce cell proliferation.
Davisson, Kunig et al. (2002) After 24 hours, GAG level of constructs subjected to 10% amplitude dynamic loading showed 80-100%
increase compared to the constructs that was loaded statically. The effect was more vivid when the
constructs were stimulated at 0.1Hz.
Hunter, Mouw et al. (2004) Dynamic compression of 10% amplitude with a frequency of 0.1Hz has shown significant effect on
chondrocytes that have been seeded in fibrin gels. Inhibition of GAG and hydroxyproline and simulation
of nitrite were observed in samples loaded dynamically. It was also found that DNA content among
samples under different conditions was not showing any significant difference.
D. Lee, Noguchi et al. (2000) Different frequencies (0.3, 1 and 3 Hz) of 15% compression were stimulated on chondrocyte/agarose
constructs for 48 hours. Compression at 0.3 Hz reduced GAG synthesis, at 1 Hz increased GAG synthesis
by 40%, while at 3 Hz no significant change occurred in GAG synthesis.
Robert Mauck, Soltz et al.
(2000)
After four weeks, it was found that isolated chondrocytes seeded in agarose constructs increased GAG and
hydroxyproline content after compression with strain amplitude of 10% at a frequency of 1 Hz, three times
a day (1 hour on and 1 hour off).
Page 55
36
RL Mauck, Wang et al.
(2003)
Intermittent deformational loading of 10% was stimulated on chondrocyte-seeded agarose for two months.
The whole stimulation took place for 6 hours per day, 5 days per week. While Young‟s and dynamic
modulus of loaded constructs were found to be different compared to the free-swelling ones, PG and
collagen content were reported to be insignificantly different.
B. Pingguan-Murphy, El-
Azzeh et al. (2006)
Frequency and strain rate of cyclic compression were also found to modulate calcium signalling by
activating purinergic pathway causing calcium release. These were analyzed by looking at the intracellular
Ca2+ signalling upon dynamic loading. The loads given at 10 cycles of amplitude between 0% to 10%
strains.
Sah, Kim et al. (1989) Dynamic shear deformation (1-5% strain, 0.01 to 1 Hz) demonstrated more of up-regulation of collagen
biosynthesis of cartilage explants than PG biosynthesis. At lower frequencies, compressive strain of less
than 5% delivered less effect on 3H-Proline and
35S-sulphate incorporation.
Shelton, Bader et al. (2003) The chondrocytes seeded constructs were either exposed to tensile strain or compressive strain. Tensile cell
straining systems gave 5% strain at 1 Hz for 24 hours using a sawtooth waveform, compressive strain was
given at 15% at frequencies of 0.3, 1 or 3 Hz for 48 hours. The 1 Hz dynamic mechanical regimes resulted
in highest GAG production. Biaxial loading showed inhibitory responses towards cell proliferation.
Villanueva et al. (2009) Isolated bovine articular chondrocytes were embedded in PEG hydrogels incorporated with chondroitin
sulphate (ChS) and exposed to dynamic mechanical stimulation (0.3 Hz, 15% amplitude strains for 6
hours). 0.3 Hz load had no effect on chondrocyte response and no chondroitin sulphate was detected in the
first 12 hours. After 48 hours, the cells seeded in 20% ChS stimulated production of PGs and collagens,
while inhibited production of nitrite and cell proliferation.
Waldman, Spiteri et al.
(2003)
Chondrocytes cultures were mechanically stimulated for 400 cycles every second day. The amplitude of
the cycle was 2% shear strain at a frequency of 1 Hz. The culture was analyzed at 1-week and 4-week
points. At both points, cells contained in the scaffold not only produced more collagen and PGs, but also
have better compressive mechanical properties, compared to those unloaded.
Page 56
37
Waldman, Couto et al. (2007) Dynamic multi-axial mechanical loading was conducted for 400 cycles per day at a frequency of 0.5 Hz,
for four weeks. Four combinations of compression and shear strain amplitudes were tested
i) 2% compression – 2% shear
ii) 5% compression – 2% shear
iii) 2% compression – 5% shear
iv) 5% compression – 5% shear
It was found that synthesis of ECM depends on the relative magnitudes of the applied compressive and
shearing strains. Equilibrium amplitude of compression and shear strain increased the ability of cells to
synthesize high concentrations of collagen and PGs.
Page 57
38
Other studies evaluated the effect of shear stress on chondrocytes via hydrodynamic
shear (Ikenoue et al., 2003; G. Jin et al., 2000; Y. Kim et al., 1995). Direct shear stress
on cartilage explants (Frank, Jin, Loening, Levenston, & Grodzinsky, 2000; M. Jin,
Frank, Quinn, Hunziker, & Grodzinsky, 2001) and shear stress produced by laminar
fluid flow in rotatic cone viscometer (R. Smith, Lin, et al., 2000), the latter that
increased the concentration of sulphated glycosaminoglycan in monolayer cultured
chondrocytes. However, there is not yet any study which assesses the influence of direct
shear stress on chondrocytes in 3D scaffolds.
Page 58
39
Chapter 3. Methodology
In this section the methods used within the studies presented are set out and
explained. The first section relates to the protocols used to obtain chondrocyte cells for
research purposes; the second to the specific culture system used and the way in which
it is prepared; the third, the methods used in biomechanical stimulation through the use
of a bioreactor.
Following these is presented details of the biochemical assays used, with their
limitations; and, the statistical and study design methods employed to ensure reliable
analysis and fair study design.
3.1. Methods in Cell Isolation
There are a few techniques to isolate cells from tissues for ex vivo culture (Refer to
Table 3.1). Enzymes such as collagenase, trypsin or protease can be used to release
mononuclear cells from soft tissues. This technique is called enzymatic digestion and
cells are isolated as the ECM holding the cells is degraded by the enzymatic action.
Most research has applied two-stage digestion (DiMicco, Kisiday, Gong, &
Grodzinsky, 2007; Hayman, Blumberg, C, & Athanasiou, 2006; Hidvegi et al., 2006),
even though some groups do not run the pre-digestion step. Bueno et al. (2007), for
example, immediately exposed the dissected cartilage to collagenase type-II for 16
hours, skipping the pre-digestion stage.
According to Hayman et al. (2006) digesting the cartilage tissue in protease (0.010 g
ml-1
) for 1.5 hours followed by collagenase (0.004 g.ml-1
) for 3 hours yielded the
highest
Page 59
40
Table 3.1 Summary of comparisons made between the different enzymatic digestion protocols,
showing enzymes used, their concentrations and digestion times.
Pre-digestion Overnight digestion
Reference
Enzyme Concentration
(U.ml-1
)
Time
(min)
Enzyme
(Collagenase)
Concentration
(U.ml-1
)
Time
(min)
Protease
(Sigma)
10 60
Type-Ia 800 960
(Hidvegi et
al., 2006; D.
Lee et al.,
2000)
Type-II 800 960
Type-XI 800 960
20 60 Type-XI 200 960 (DiMicco et
al., 2007)
Not specified 90 Type-II Not specified 180 (Hayman et
al., 2006)
700 60 Type-XI 100 960 (Chowdury
et al., 2003)
Pronase +
Hyaluronid
ase
Not specified 60 Type-II Not specified 360 (Hansen et
al., 2001)
Collagenase Type-II 960 (Bueno et al.,
2007)
total cell number. In another study, sliced cartilage was incubated at 37°C on rollers for
one hour in 700 U.ml-1
protease followed by 16 hours at 37°C in Dulbecco‟s Modified
Eagle Medium (DMEM) and 20% Foetal Bovine Serum (FBS) supplemented with 100
U.ml-1
collagenase type-XI. At the end of the experiment, the cells were resuspended in
medium giving a cell concentration of 8x10⁵ cells.ml
-1 (Chowdury et al., 2003).
Degradation of type-XI collagen destructs type-II collagen fibril meshwork, eventually
disrupting the matrix components (J. A. Buckwalter & Mankin, 1997b). Gemmiti and
Guldberg (2006) digested minced cartilage in 0.2% type-II collagenase in DMEM
Page 60
41
solution in the 37°C incubator for 48 hours, yielding 10 x 105
cells.ml-1
, while Fröhlich
et al. (2007) found that the cell yield was reduced if the cartilage was exposed to
collagenase for more than 21 hours.
It was also reported that the addition of hyaluronidase along with protease in the pre-
digestion stage. digests hyaluronan, a non-sulphated GAG that aids proliferation and
migration of chondrocytes (Hansen et al., 2001).
3.1.1. Protocol
A standard protocol was used throughout the studies, other than in the case of the
first study in which the reagents and parameters used for chondrocyte isolation were
optimised. The manner in which the parameters used were established is presented
within Chapter 4.
3.1.2. Reagent preparation
Standard chondrocyte culture medium was used at all stages. The culture medium
contained Dulbecco‟s Modified Eagles Medium (DMEM) supplemented with 20%
Foetal Bovine Serum (FBS). DMEM + 20% FBS was prepared by adding 100 ml of
FBS and 20 ml of other components in 500 ml of DMEM. Table 3.2 shows the detailed
composition of DMEM + 20% FBS.
All components were mixed and filtered through a 0.22 µm pore cellulose acetate
filter, prior to being aliquoted and stored at -20°C.
Page 61
42
Table 3.2 Components of Chondrocyte Medium
Components Stock
Concentration
Quantity Final
Concentration
Supplier
Dulbecco‟s
Modified Eagle
Medium
(DMEM)
NA 500ml NA Sigma-
Aldrich,
Malaysia
Penincilin/
Streptomycin
10,000units.ml-1
/ 10mg.ml-1
5ml 100 units.ml- /
10 mg.ml-1
Sigma-
Aldrich,
Malaysia
L-Glutamine 200mM 5ml 2mM Sigma-
Aldrich,
Malaysia
Hepes buffer 1M 10ml 2mM Sigma-
Aldrich,
Malaysia
L-Ascorbic
Acid
NA 0.075g 0.85µM Sigma-
Aldrich,
Malaysia
Foetal Bovine
Serum (FBS)
NA 100ml 16.1% (v/v) Sigma-
Aldrich,
Malaysia
Buffers
Earl‟s Balanced Salt Solution (EBSS) (Sigma-Aldrich, Malaysia, E2888) with
sodium bicarbonate was used for chondrocyte culture.
Types of Digestion Enzymes
Protease
Protease from Streptomyces griseus at 20 U.ml-1
in DMEM + 20% FBS was used as
the pre-digestion enzyme. Upon mixing, the solution was passed through a 0.22 µm
pore cellulose-acetate filter, aliquoted into 20 ml vials and stored at -20°C.
Page 62
43
Collagenase
Types of collagenases which were used for the purposes of optimisation of matrix
digestion are presented in Table 3.3.
All the collagenases were supplied as a lyophilised powder and each type was
dissolved in DMEM + 20% FBS at an activity of 200 U.ml-1
. This solution was then
filtered through a 0.22 µm pore cellulose-acetate filter, aliquoted into 20 ml vials and
stored at -20°C For the study of the effect of collagenase concentration; collagenase
Type II was prepared at 100 U.ml-1
. All the collagenases were purchased from Sigma,
Malaysia.
3.1.3. Bovine Chondrocytes Isolation
Bovine articular cartilage was obtained from cow joints taken from the abattoir at the
Department of Veterinary Services, Shah Alam, Selangor. The cells were isolated on
the same day the 18-24 months old Bos indicus calf was slaughtered. AC was dissected
from this fresh metacarpalphalangeal joint having been immersed in 70% Industrial
Methylated Spirits (IMS) for about 15 minutes. The full thickness of cartilage from the
entire proximal surface of the joint was removed in the class II laminar hood (see Figure
3.1). The dissected cartilage was immersed in a 60 mm petri-dish containing
DMEM+20% FBS to replenish the cartilage with nutrients.
Page 63
44
Table 3.3 Types of Collagenase and Concentration used during the experimental work.
Collagenase Type Specific Activity (U.ml-1
)
Type Ia 200
Type XI 200
Type II 100 200
Figure 3.1 Exposure of articular surfaces from a metacarpal-phalangeal joint.
Subsequently, the medium was aspirated and the explant cartilage was transferred
into Falcon tubes. The explant was immersed in protease (Sigma-Aldrich, Malaysia)
that had been diluted to 20 U.ml-1
in DMEM + 20% FBS. The first stage of digestion
proceeded for one hour in the incubator at 37 °C and 5% CO2, followed by the second
stage where the cartilage fragments were immersed in collagenase with DMEM + 20%
FBS. To ensure that all cartilage fragments were fully exposed to the enzymes, the
Falcon tubes containing cartilage fragments were left for 14, 15 or 16 hours in a
hybridization oven (LabNet, Malaysia).
Page 64
45
After overnight digestion, the supernatant containing released chondrocytes was
passed through a 70 µm cell sieve (BD Bioscience, Malaysia) into sterile Falcon tubes.
The supernatant was washed twice with DMEM + 20% FBS to stop the reaction of any
remaining proteolytic enzyme. It was centrifuged at 2000 RPM for 5 minutes. Finally,
the cell pellet was resuspended in 10 ml of DMEM + 20% FBS.
Prior to the cell count, the cells were mixed with syringes and 21 gauge needles. The
use of syringes and needles is believed to disaggregate the cells and distribute them
throughout the suspension.
3.1.4. Cell Count and Cell Viability
Cell count and cell viability were ascertained using haemocytometer and trypan blue
dye exclusion. 20 µl samples of the cell suspension were micropipetted and mixed with
trypan blue solution at the ratio of 1:1 (v/v). Trypan blue (Sigma-Aldrich, Poole, UK)
stain is commonly used to trace non-viable cells as nucleus from dead cells absorb the
dye and appear blue in colour. Equation 3.1 explains the method to calculate number of
cells in a one ml volume from the 20µl sample. Cell counting was performed three
times and a mean value was calculated to reduce errors.
Equation 3.1 Neubauer Ruling
3.2. Methods in Culture Preparation
After the cell counting using Trypan blue exclusion, chondrocytes are finally
resuspended in medium to give a total cell concentration of about 8x10⁶cells.ml
-1. EBSS
that contains sodium bicarbonate was added into low gelling agarose (Type VII, Sigma-
Page 65
46
Aldrich, Malaysia) at 8% (w/v) following the method of Knight et al.(2006) and
autoclaved. The autoclaving procedure was to make sure the proper mixing of agarose
with EBSS and sterilisation of the agarose powder. Consequently, the mixture was left
on the roller mixer until the temperature of the gel reduced to about 37°C. Cell
suspension was added to an equal volume of 8% agarose. The final concentration of
cell-agarose mixture would be 4x10⁶cells.ml
-1. For mixing purposes, the glass bijou
tube containing the cell-agarose mixture was placed on the rollers again and allowed to
mix thoroughly.
3.2.1. Preparation of Chondrocyte-Agarose Constructs with Porous Glass
Endplates
The Perspex mould consists of three parts; base, mould divider and lid (Figure 3.2).
The middle part was attached to the base with two strips of 5 mm thickness porous glass
(R&H Filter Co. Inc, Georgetown, US) inserted into the slot of the mould divider
(Figure 3.2b). The porous glass was autoclaved prior to use while the Perspex parts
were immersed in 70% IMS overnight. Then, the cell-agarose suspension was pipetted
into the sterile mould, in between the two strips of porous glass. The lid was then
carefully fixed on top of the mould divider to restrain from bubble formation in the
agarose gels (Figure 3.2c). The whole mould was kept in the chiller at 7°C for a few
minutes.
Once the agarose was fixed, the lid and mould divider were carefully lifted up. One
mould will produce six samples of (5x5x5) mm of chondrocytes-agarose constructs in
cubic shapes. Mini polyethylene (PE) screws were used to fasten the end parts of the
porous glass strips to the shear and compression brackets (Figure 3.3). A custom handle
Page 66
47
was designed to transfer the attached cell-agarose constructs, porous glass strips
together with the brackets to the test rig (Figure 3.4).
(a)
(b)
(c)
Figure 3.2 Figures showing assembly of the Perspex mould. The perspex mould is comprised of base
(a), mould divider and lid. (b) Sintered glass strips were inserted into the slot of mould divider. (c) Once
the chondrocyte-agarose suspension was pipette in the voids, the lid was screwed to avoid bubble
formation. The mould is used to attach the agarose-chondrocyte constructs to the sintered glass strips.
Page 67
48
Figure 3.3 Photo of the plated constructs structure inside the culture tray. Arrow showed the sintered
glass strips attached to the shear and compressive brackets with six samples of chondrocyte-agarose
constructs sandwich between the sintered glass.
Figure 3.4 Upon lifting up the lid and mould divider, the sintered glass strips are attached to the shear
and compressive brackets. Custom-made handle is then used to transfer the brackets to the test rig.
3.2.2. Preparation of Chondrocyte-Agarose Constructs for Unstrained Samples
Control samples were cultured in a 6-well culture plate. Each well contained a
(5x5x5) mm agarose construct. Six constructs were prepared in a rectangular shaped
Perspex moulds that has three components named as lid, base and mould divider (Figure
3.5 a). Once the base and the mould divider were securely attached using tape, two
(4x5x5) mm sintered porous glass endplates (R&H Filter Co. Inc, Georgetown, US)
Page 68
49
were laid into each individual mould using sterile forceps. The porous glass endplates
were autoclaved prior to use and the Perspex parts were immersed in 70% IMS
overnight. The void between the two endplates was filled with molten cell-agarose
suspension, using a Pasteur pipette. The lid was placed on top to avoid bubble formation
(Figure 3.5b).
Hardened constructs fixed to the porous glass endplates were transferred to the 6-
well culture plate which was pre-filled with DMEM+20%FBS.
Page 69
50
a)
b)
Figure 3.5 Schematic drawing of Perspex mould to produce agarose-chondrocyte-sintered glass
constructs. (a) Mould divider attached to the base and (b) chondrocyte-agarose suspension pipette in the
voids and was covered with lid. The specimens were then put into a 6-well plate filled with culture
medium. These specimens were then tested as the control or free-swelling samples.
3.3. Methods in Biomechanical Stimulation
A test rig was designed to facilitate the compression and shear compression on the
cell-agarose constructs. As mentioned above, the brackets hold the porous glass strip
that contains cell-agarose constructs. The brackets move vertically or horizontally to
give a direct or shear loading to the constructs. Stepper motors and PLC system were
used to modulate mechanical regimes as desired (Figure 3.6).
Page 70
51
The slots located at the bottom of the brackets were placed on the rail at the test rig.
The rail is a long strip of Perspex augmented on the base of the test rig and its function
is to guide the bracket during loading.
The shear and compression movements of the brackets were driven by stainless steel
(SS) column the surfaces of which were threaded (Figure 3.7). Prior to the
transportation of the test rig into the incubator, the rig was covered with a lid to ensure
sterility (Figure 3.8).
Figure 3.6 The schematic representation of the configuration of the incubator-housed and PLC-
controlled cartilage bioreactor system: A – Standard incubator; B – Culture tray; C – Peristaltic pump; D
– Medium reservoir; E – Medium inlet and outlet ports; F – Stepper motors; G – PLC control box; H –
Stepper motor drivers; I – Power supply. (Yusoff, 2011)
Page 71
52
Figure 3.7 Once the agarose-chondrocyte constructs were transferred to the test rig, SS columns were
fixed to the direct and shear compressive brackets upon removal of the handle. These steps need to be
done carefully to avoid any movement of the constructs.
Figure 3.8 Culture medium was poured into the test rig, making sure all constructs were fully
immersed. Prior to the transportation of test rig into the incubator, the rig was covered with a lid to ensure
sterility. Bug filter was integrated to the test rig making sure of gas exchange going in and out of the test
rig.
Then, each SS column was fixed to a stepper motor, controlled by the programmable
logic controller (PLC) unit. 150 ml DMEM+20% FBS was poured into the system, to
ensure that all cell-agarose constructs were fully immersed.
Page 72
53
3.4. Bioechemical Assays
3.4.1. Digest of Chondrocyte-Agarose Constructs
Once the mechanical loading had ended, the SS columns were removed from the
stepper motor and the test rig was taken into the laminar hood for removal of agarose
constructs for further characterization and analysis. Control groups were also removed
from the incubator. Each sample was carefully separated from the porous glass platens
using a sterile spatula.
Prior to the GAG and DNA quantification, the chondrocyte-agarose constructs were
digested.
In a small bijou tube containing one construct, 1 ml of digest buffer was added and
kept for one hour in 70°C oven. Prior to adding 10 U.ml-1
of agarase and 2.8 U.ml-1
of
papain to each construct, the sample was cooled to about 37°C. After an overnight
agarase digestion, the sample needed to undergo further digestion at 60°C for one hour
(Chowdury et al., 2003).
Portions of the digest were centrifuged for 10000g for 5 minutes at room
temperature. The suspension was analyzed for DNA content using Hoechst 33258 dye
with calf thymus DNA as a standard. Total DNA was used as a baseline for GAG
synthesis.
GAG content was assessed immediately to prevent the agarose digest from re-
solidifying. If needed, the melted constructs could be stored at -20°C. Total synthesis of
GAG is the sum of the deposition into the matrix and the release into the medium.
Page 73
54
3.4.2. Deoxyribonucleic (DNA) content
Hoescht 33258 Assay
Generally, DNA content is used to estimate tissue cellularity and Hoescht 33258 is
often used to measure DNA (McGowan, Kurtis, Lottman, Watson, & Sah, 2002; M. R.
Urban, Fermor, Lee, & Urban, 1998). Hoescht 33258 is a DNA-specific dye that
fluoresces on binding to DNA. Hoescht 33258 consists of two consecutive
benzimidazole rings, with a phenolic and an N-methyl-piperizine group at either end of
the elongated molecule (Teng, Usman, Frederick, & Wang, 1988). This dye binds to the
AT-rich region of the double helical DNA (Pitha, 1978; Teng et al., 1988). The use of
this type of dye is preferable as it has low affinity to RNA and other proteins that might
influence the reading of DNA content (Mülhardt, 2007).
The Hoescht 33258 assay protocol was adapted from Hoemann (2004). 2 mg
Hoechst 33258 was added into each ml of dH2O to make the Hoechst stock solution
and stored at 4°C in a light-tight bottle. Just before use, a working solution was made by
dilution of the 10000x stock solution to 0.1µg/ml in TEN buffer (10mM Tris-HCL,
1mM EDTA and 100mM NaCl, pH 7.5). The working solution was held in and
dispensed from a light-tight container.
Calf Thymus DNA Standard
The DNA standard serves as a one-point reference for DNA quantifications. DNA
standard isolated from the nuclei of calf thymus cells are mainly utilized for plant and
animal DNA measurement as they are double-stranded and highly polymerized with
58% AT content (Y.-J. Kim, Sah, Doong, & Grodzinsky, 1988; Mülhardt, 2007).
Page 74
55
Calf thymus DNA (D1501, Sigma-Aldrich, Malaysia) was dissolved in PBE buffer
(100mM phosphate buffer, 10mM EDTA, pH 6.5) to 50µg/ml concentration, stored as
100µL frozen aliquots at -20°C. A serial double dilution of standard was anticipated by
diluting the 0.5mg/ml stock solution of calf thymus DNA standard to 25 to 0.781 µg/ml
in PBE buffer.
A standard curve was generated prior to the DNA measurement using serial dilution
of calf thymus DNA standard. This was done to validate the standard. PBE buffer and
Hoechst 33258 assay was used as the blank. A microplate fluorometer (FLUOstar
Optima, BMG Labtech, Malaysia) was used to read the fluorescence level at 355 nm
excitation and 460 nm emission (Hoemann, 2004; McGowan et al., 2002). Using a 96-
well plate (TPP, Malaysia), the first two columns were filled with 10 µl PBE buffer for
blanks, while 10µl of each samples was pipetted into each well as triplicates. 200µl
working solution was dispensed into each well prior to the fluorescence reading, using
the multi-channel pipette.
3.4.3. Synthesis of Sulphated Glycosaminoglycans
DMB Assay
Dimethylmethylene blue (DMB) is a dye that produces metachromasia upon cationic
dye binding to sulphate and carboxyl groups present in GAG chains. Metachromasia or
colour change from blue to purple is produced by pH and salt concentration of the dye
(Enobakhare, Bader, & Lee, 1996; Goldberg & Kolibas, 1990).
1,9 dimethylmethylene blue (DMB) assay was prepared prior to glycosaminoglycan
quantification. 0.016 g DMB (Sigma-Aldrich, Malaysia) was dissolved in 5.0ml 99.7%
Page 75
56
Ethanol (Sigma-Aldrich, Malaysia) in a foil-wrapped capped glass scintillation vial. A
magnetic stirrer (WiseStir MSH10, Daihan Sci., Malaysia) was used to ensure mixing.
In another clean bottle, 2.00 g of sodium formate was dissolved in 950mL of
autoclaved double-distilled H2O (R.W. Farndale, Sayers, & Barrett, 1982). The DMB
solution was mixed with the NaCl-glycine solution. The DMB solution residual was
rinsed with 200µL ethanol. Concentrated formic acid (99%) was used to reach pH 3.00
(Enobakhare et al., 1996). The solution was topped up with ddH2O until 1L. The assay
was then stored at room temperature in a foil-covered bottle.
Chondroitin-4-sulphate standard
GAG content in the samples was quantified by comparing the obtained fluorescence
values with those of a curve generated from standards of known amounts of chondroitin
sulphate.
Besides DMB assay, bovine chondroitin-4-sulphate (C6737, Sigma-Aldrich,
Malaysia) was used as the reference solution. The chondroitin-4-sulphate was
reconstituted in dH20 at a concentration of 0.5mg/ml, stored in the -20°C freezer in
500µL aliquots.
Upon usage, the chondroitin-4-sulphate was thawed and a vortex mixer (VTX
3000L, LMS Scientific, Malaysia) was used to ensure good distribution of the solution.
A serial double dilution of standard was anticipated by diluting the 0.5mg/ml stock
solution of bovine chondroitin-4-sulphate standard to 25 to 0.781 µg/ml.
A standard curve was generated prior to the GAG measurement using serial dilution
of chondroitin-4-sulphate standard. This was done to validate the chondroitin-4-sulphate
Page 76
57
standard. dH2O and DMB assay was used as the blank. Fluorometer microplate reader
(FLUOstar Optima, BMG Labtech, Malaysia) was used to read the absorbance level.
Values of OD520-OD590 should be in the range of 0.65 to 0.8 to validate the standard.
Absorbance Reading of the Sample Post-Loading
The microplate fluorometer reader was set to read the absorbance between the
wavelengths of 520 to 590 nm (Yun & Moon, 2008). 10µL of each samples and
standards were pipetted into the 96-well plate as illustrated in Table 3.4. Eppendorf
repeat pipetor with a 5.0mL tip was used to dispense 250µL of DMB assay into each
well.
Table 3.4 Layout of the microplate. S wells are filled with chondroitin-4 sulfate at stated
concentration, while X wells are filled with samples. All wells including the blank ones are filled with
DMB assay.
1 2 3 4 5 6 7 8 9 10 11 12
A Blank S1 S2 S3 S4 S5 S6 Blank
B Blank S1 S2 S3 S4 S5 S6 Blank
C X1 X1 X1 X7 X7 X7 X13 X13 X13
D X2 X2 X2 X8 X8 X8 X14 X14 X14
E X3 X3 X3 X9 X9 X9 X15 X15 X15
F X4 X4 X4 X10 X10 X10 X16 X16 X16
G X5 X5 X5 X11 X11 X11 X17 X17 X17
H X6 X6 X6 X12 X12 X12 X18 X18 X18
Page 77
58
3.5. Statistical Analysis
A one-way analysis of variance (ANOVA) was used to compare the cell yield and
cell viability under the influence of different types of collagenase. In all cases, p<0.05
was used to indicate statistical significance. A two-sample t-test was run to determine
validity of digestion in different concentration of enzymes.
A two-way analysis of variance (ANOVA) considering types of waveforms
(trapezoidal or sinusoidal) or 24 hours pre-culturing effect were utilised to determine
the statistical significance of the data analyzed in terms of uniaxial or biaxial
mechanical loading.
The two-way ANOVA was also computed to obtain information to assess the main
effect and interaction effect between two independent variables. When there is a main
effect, one independent variable has a significant effect on the dependent variable,
regardless of the condition of the other independent variable. While, when there is an
interaction effect, the lines in the line graph connecting the group means are not
parallel. The lines cross at some point, either within the graph or, if the lines were to be
extended, someplace offs the graph (Johnson & Christensen, 2010; Rubin, 2009).
Page 78
59
Chapter 4. Study 1 (Chondrocyte Isolation)
4.1. Introduction
Limitations to the natural repair process of cartilage have motivated the development
of tissue-engineered constructs for cartilage replacement. These strategies typically
involve the incorporation of the tedious process of isolating chondrocytes through
various protocols. Primary cell cultures of articular chondrocytes is typically isolated
from mice, rat, rabbit and sometimes bigger size animal such as porcine, cattle and even
human (Sabatini, Pastoureau, Ceuninck, Thirion, & Berenbaum, 2004). In our current
study, AC from the calf joint has been used for several reasons. Bigger sized animals
are more preferable due to the larger area of AC available to be harvested, so more
chondrocytes can be yielded when calf joints are used. Further, for religious reasons,
bovine joints are preferred to porcine joints. Moreover, the mechano-physical
conditions of the calf joint approximate well to the human joint (Abbot, Levine, &
Mow, 2003; Chen, Bae, Schinagl, & Sah, 2001; Federica, Giancarlo, Francesca,
Giuseppe, & Gabriele, 2004; Jurvelin, Buschmann, & Hunziker, 1997).
Currently, there is not yet any paper published that investigate the optimization of
cell isolation from the articular cartilage of Bos indicus, a species of cow raised in
Malaysia (in contrast to Bos taurus, typically reared in temperate climates). It is
believed that differences between genetic and environmental influences of the
respective sources, including the effect of diet and size of animal species affect the
content of the tissue. A local source is important as cartilage needs to be extracted
within a few hours of slaughter (Barbero & Martin, 2007; Giannoni & Cancedda, 2006;
Thonney, 2005).
Page 79
60
A secondary objective of this research is to optimize cell isolation from the primary
tissue of AC from local bovine sources, without risking the viability of the cells. In
order to obtain a higher number of viable cells with fewer contaminating cells, the
isolation procedures need to be optimized. This chapter describes an optimised method
of chondrocyte isolation from the bovine joint. The chapter explains in detail the
parameters of digestion enzymes used in this study. Isolated chondrocytes with high
counts of viable cells will be used in further studies involving the effects of mechanical
stimulation on the proliferation and differentiation of chondrocytes.
In this particular chapter, the study on isolation of local bovine articular
chondrocytes was initially conducted following the protocol of Chowdury et al. (2003)
and Pingguan-Murphy et al. (2005) who utilized a two-stage digestion using protease
and collagenase type-XI. However, cell yield was insufficient, at 2.99x10⁵ ±1.71 cells
per ml. An initial alteration was made to the digestion protocol in order to get a higher
cell yield, by increasing the concentration of collagenase type-XI from 100 to 800 U.ml-
1(results not shown). Even though cell yield then increased by about 49%, cell viability
reduced from 90% to 45%.
4.2. Methods
Primary cells from AC were extracted from the bovine metacarpal-phalangeal joint.
The chondrocytes were obtained using the protocol as given in Section 3.1.3.
Different Type of Collagenase
After pre-digestion, the cartilage fragments were immersed to collagenase. Either
Type-Ia, type-II or type-XI collagenase was reconstituted using DMEM + 20% FBS to
Page 80
61
an activity of 200 U.ml-1
. This solution was then filtered through a 0.22 µm pore
cellulose-acetate filter, aliquoted into 20 ml samples and stored at -20°C.
Different Concentration of Collagenase Type II
The viability and cell yield were compared using two different concentrations of
collagenase; 100 and 200 U.ml-1
.
Incubation Duration
The duration of collagenase exposure to cartilage extracts were examined. These
durations were 14, 15 and 16 hours.
Statistical Analysis
As mentioned in Section 3.5, statistical analysis was carried out with single factor
ANOVA. A two-sample t-test was used to determine the effect of digestion by different
concentrations of enzymes.
4.3. Results
4.3.1. Effect of Collagenase Types on Cell Yield and Viability
The effect of using different types of collagenase for chondrocytes isolation is shown
in Figure 4.1. There is evidence of the effect of collagenase type on cell yield (Figure
4.1a) and viability (Figure 4.1b). There is a statistically significant difference between
the type of collagenase in terms of cell yield obtained; collagenase type I yielded fewer
cells than collagenase type XI or Collagenase type II (p<0.05). Collagenase type II
digest yielded the highest total cell count (14.2x10⁶ cells.ml
-1) and the highest viability
(97.5%).
Page 81
62
4.3.2. Effect of Reducing the Concentration of Collagenase Type-II
Reducing the concentration of type-II collagenase did not improve cell yield. Higher
concentrations of the enzyme (200 U.ml-1
) yielded more than three times the cells that
at a concentration of 100 U.ml-1
(P<0.05) (Figure 4.2a). A lower concentration of
collagenase also reduced the cell viability (Figure 4.2b).
4.3.3. Effect of Collagenase Incubation Periods on Cell Yield and Viability
Based on the results of Section 4.3.1 and Section 4.3.2, collagenase type II at a
concentration of 200 U.ml-1
was applied, to study the effect of collagenase
concentration. Cell yield and cell viability increased with digestion time (refer to Figure
4.3). The viability of cells harvested after 16 hours digestion was 97.5% (refer to Figure
4.3b), significantly higher than after 14 and 15 hours digestion, 77.5% and 77.4%
respectively.
Page 82
63
a)
b)
Figure 4.1 a) Cell yield with different types of collagenase. (*) denotes significantly different (p<0.05)
cell yield versus all types of collagenases. (b) Cell viability with different types of collagenase. (*)
denotes cell viability with significantly different p<0.05 versus collagenase Type Ia, while the difference
of cell viability collagenase Type II and Type XI is insignificant. All values shown as mean ± standard
error of the mean (SEM) (n=30).
0
2
4
6
8
10
12
14
16
Type Ia Type II Type XI
Cel
l Y
ield
(x10
6 c
ells
per
ml)
Types of Collagenase
* *
80
82
84
86
88
90
92
94
96
98
100
Type Ia Type II Type XI
Cel
l V
iab
ilit
y (
%)
Types of collagenase
*
Page 83
64
a) b)
Figure 4.2 (a) showing cell yield from digestion using concentration of either 100 or 200 U.ml-1
.
Higher concentration produced significantly higher cell yield. Cell viability for cells using reduced
concentration has shown a significant decrease (b). (*) shows significant value of (p<0.05) by ANOVA
and error bars showing standard error of the mean.
a) b) Figure 4.3 Influence of digestion time on cell yield (a) and cell viability (b). (*) indicates that single-
factor ANOVA test shows that cell yield and cell viability of 16 hours versus 15 hours and 14 hours is
highly significant (p<0.05). All values shown are mean values for n=30. Error bars represent standard
error of the mean.
0.00
2.00
4.00
6.00
8.00
10.00
12.00
14.00
16.00
100 200
Cel
l Y
ield
(x10
6 c
ells
per
ml)
Concentration (U.ml-1)
*
0.00
20.00
40.00
60.00
80.00
100.00
120.00
100 200
Cel
l V
iab
ilit
y (
%)
Concentration (U.ml-1)
*
0
2
4
6
8
10
12
14
16
14 15 16
Cel
l yie
ld (
x10
6 c
ells
per
ml)
Duration (Hours)
* *
0
20
40
60
80
100
14 15 16
Cel
l V
iab
ilit
y (
%)
Duration (Hours)
* *
Page 84
65
This study has shown optimized chondrocyte isolation protocol is as Table 4.1.
Table 4.1 Optimized chondrocyte isolation protocol.
Pre-digestion (not included in study) Overnight digestion
Enzyme Concentration
(U/ml)
Time (min) Enzyme
(Collagenase)
Concentration
(U/ml)
Time (min)
Protease 20 60 Type-II 200 960
4.4. Discussion
The chondrocyte isolation procedure is optimised to obtain a high number of viable
cells. Chondrocytes that have been isolated are essential to ensure sufficient viable cells
to be seeded in hydrogel constructs for further studies involving the physiology and
biomechanics of chondrocytes. Initially, a chondrocyte isolation protocol used within
Bader‟s group and elsewhere (Bryant, Chowdhury, Lee, Bader, & Anseth, 2004;
Chowdury et al., 2003; D. Lee et al., 2000; Roberts, Knight, Lee, & Bader, 2001) that
uses collagenase type-XI was adopted in our laboratory. However, we believe that for
local Malaysian bovine tissues (Bos indicus), the use of collagenase type-II is
preferential.
Having highly complex composition and architecture, the protein crosslinking and
microstructure of cartilage is poorly understood and researchers do not have a standard
method of isolating chondrocytes from the ECM. Isolation of locally sourced bovine
chondrocytes has been assessed using different types of collagenase, using protease as
the pre-digestion enzyme. Protease partially degrades PG to expose the collagen fibres
to collagenase for further digestion. This additional step decreases the exposure time
and overall digestion time (Hayman et al., 2006). There is also a literature that added
Page 85
66
hyaluronidase into protease in the pre-digestion stage. Hyaluronidase digests
hyaluronan, a non-sulphated glycosaminoglycan that aids proliferation and migration of
chondrocytes (Hansen et al., 2001).
About half of the dry weight of cartilage is collagen. Collagen is an insoluble fibrous
protein in the ECM that serves as a framework or internal scaffolding. Collagen needs
to be degraded in order to break the ECM. On the grounds that collagen is fully
hydroxylated and in a triple helical structure, collagen is insusceptible to most proteases
except for collagenase, an enzyme that belongs to the family of metalloproteinases or
MMPs. Collagenolysis begins with cleavage of the collagenase enzyme at the triple-
helical molecules about three-quarters of the molecular length from the amino-terminal
end at neutral pH (Stockwell, 1979).
Different types of collagenase act to digest the corresponding type of collagen in the
collagenase network of cartilage, resulting in the release of the chondrocytes. Bovine
cartilage, as in other mammals has core fibrillar network of cross-linked copolymer of
collagens II, IX and XI, with type II collagen being the principal molecular component
(Eyre, 2001). Thus, when Collagenase type II was used, highest cell yield was obtained.
Collagenase type II cleaves the most abundant type of collagen in cartilage; type-II
collagen. This type of collagen has major interactions with water that is attracted to the
carbohydrate group.
Cell yield was found to increase as the isolation process was subjected to longer
enzymatic duration. A longer enzymatic duration enabled a more complete digestion of
the collagenous network of bovine articular cartilage, thus more chondrocytes were
released to contribute to a higher cell yield.
Page 86
67
As for the viability of cells, a value higher than 90% is considered excellent. It was
also found that 200 U.ml-1
of collagenase yielded a higher cell count than cartilage that
was exposed to 100 U.ml-1
of collagenase. This showed that a higher concentration of
enzyme yields a higher number of cells.
On the other hand, the use of a syringe and needle to detach and distribute the cells
in the suspension increased the cell yield up to 74%. This additional step has
contributed towards the disaggregation of cells that tend to adhere to each other. Viable
cells tend to adhere to other cells through integrins and cadherins. For cell counting
purposes, the cells need to be detached before the counting. Results of the cell yield
tests show that there is a 4-fold increase of cells. A single chondrocyte diameter is
measured as about 9µm (Nguyen et al., 2010). However, our group has observed that an
application of syringe needle smaller than 21 gauge (19.5 µm) led to higher cell death.
It is evidently shown that dedifferentiation of cartilage cells occurs under monolayer
culture (Frohlich et al., 2007). Instead of expressing type II collagen which is cartilage-
specific collagen, cartilage cells tend to express types I and III collagen, when the cells
were dismantled from their three-dimensional environment (Goldring, Sandell,
Stephenson, & Krane, 1986; Saadeh et al., 1999). Other studies found cartilage cells in
3D culture systems with certain growth factors do not change its phenotypic properties
(Benya & Shaffer, 1982; Bonaventure et al., 1994; Naumann et al., 2004; van Osch, van
der Veen, & Verwoerd-Verhoef, 2001). Subsequent to this optimised isolation protocol
and 3D constructs seeding, further study should be done to determine its morphology
and expression of cartilage specific genes such as collagen type II and aggrecan.
Page 87
68
Metabolism of cells will result in an increased carbon dioxide concentration, thus
will change the pH of the cell surroundings. In our study, culture medium needs to be
maintained at a neutral pH as the enzymes work best in that level of pH. In cell culture,
pH can be maintained by the zwitterionic organic chemical buffering agent, 4-(2-
Hydroxyethyl)piperazine-1-ethanesulfonic acid (HEPES) (Baicu & Taylor, 2002).
Besides supplying nitrogen for molecular transportation purposes, the amino acid L-
glutamine contained in culture medium, can be used to provide energy to the rapidly
dividing cells. While penicillin combined with streptomycin acts as an antibacterial
agent, ascorbic acid is known to participate in the hydroxylation of proline and lysine.
The addition of –OH is essential to stabilize the crosslinking of the collagen fibrils
(Giannoni & Cancedda, 2006).
Page 88
69
Chapter 5. Study 2 (Effects of Dynamic Uniaxial Loading
on Cellularity and ECM Production)
5.1. Introduction
As illustrated in Table 2.3, there are multiple studies that assess the influence of
mechanical loading on cartilage. Physiologically, cartilage experiences a complex array
of physical stimuli due to interstitial compressive, tensile and shear stresses within its
ECM (Mankin et al., 1994).
This chapter will generally describe the experimental work that has been undertaken
to examine the influence of uniaxial mechanical compression on chondrocytes. The
chapter starts with a section describing the experimental model of isolated bovine
articular chondrocytes seeded into a 4% agarose gel. Then, the model will be integrated
to the test-rig. In this chapter, the test rig will be used to deliver direct compressive
strain to the agarose-chondrocyte specimens.
5.1.1. With and without 24 hours preculture
Other studies have also indicated a role for a pre-culturing period prior to exposure
of any mechanical loading to chondrocytes (M. Buschmann et al., 1995; Knight et al.,
1998). This study will evaluate the need of pre-culturing for chondrocytes before being
subjected to the uniaxial loading (10% direct compressive + 0% shear compressive
strains).
Page 89
70
5.2. Methods
5.2.1. Effects of Dynamic Uniaxial Loading on Cellularity and ECM
Production
Upon seeding the constructs with isolated chondrocytes and setting up the test rig as
depicted in section 3.2.1. The cell-agarose constructs were subjected to 10% dynamic
direct compression at 1 Hz (sinusoidal) for 48 hours, intermittently (12 hours on; 12
hours off). Trapezoidal or sinusoidal waveform dynamic direct compression was
applied by one of two bioreactors for a period of 12 hours. The bioreactors then set to
rest and restarted on the next day (t=24 hours). Throughout the experiment, all loaded
and unstrained samples (control group) were maintained in a 37°C, 5% humidity
controlled environment.
5.2.2. Effects of 24 Hour Pre-Culture Prior to Dynamic Uniaxial Loading
Section 5.2.1 explained protocols utilised to deliver uniaxial loading to agarose
three-dimension scaffolds that have been seeded with isolated chondrocytes. This part
of the study integrates a 24 hour pre-culture period into the experimental protocol. Upon
seeding and moulding, the six agarose constructs in each bioreactor cassette were left
under free-swelling conditions for 24 hours in the 37°C, 5% humidity controlled
incubator. The bioreactor then commenced delivery of uniaxial (trapezoidal/sinusoidal)
compression as previously described. A control group is described as 6 samples kept on
a culture plate, unstrained, within the bioreactor for a total of 72 hours (refer to Section
3.2.2).
Page 90
71
5.3. Results
5.3.1. Effects of Dynamic Uniaxial Loading on Cellularity and ECM
Production
The influences of trapezoidal and sinusoidal uniaxial strain on DNA content in cell-
agarose digests are presented in Figure 5.1 (a). DNA values are normalised to
unstrained control levels. 1 Hz dynamic sinusoidal strain inhibited cell proliferation by
20% (p<0.05), while trapezoidal strain showing increase of DNA content in comparison
to the unstrained samples, by 20% (p<0.05), across 48 samples. The samples in this data
set were not pre-cultured; instead they were immediately exposed to uniaxial loading
upon seeding with chondrocytes.
Mean sulphated GAG incorporation by chondrocytes after being loaded in sinusoidal
uniaxial regime averaged 1.137 µg/µg in medium and 1.004 µg/µg in construct
respectively. The mean values of GAG content for all samples using DNA content as
baselines are summarised in Table 5.1, and Figure 5.1(b) depicting these values
normalised to unstrained control levels (100%).
Table 5.1 Absolute values for GAG content in medium, constructs and total GAG synthesis, with
DNA content as baselines by chondrocyte/agarose constructs subjected to various waveform uniaxial
loading. The average values are taken from 24 samples from four separate experiments. Errors shown are
standard error of mean.
Loading Regime GAGmedium /
DNA(µg/µg)
GAGconstruct/DNA
(µg/µg)
GAGtotal/DNA
(µg/µg)
Trapezoidal 0.598 ± 0.035 0.691 ± 0.013 1.289 ± 0.045
Sinusoidal 1.137 ± 0.079 1.004 ± 0.028 2.141 ± 0.139
Unstrained 0.196 ± 0.029 0.231 ± 0.048 0.427 ± 0.137
Page 91
72
5.3.2. The Effects of 24 Hours Pre-Culture Prior to Dynamic Uniaxial Loading
After overnight digestion, 8 million cells.ml-1
were mixed into 8% agarose and
moulded for the bioreactor. Upon setting up the specimens into the bioreactor,
uncompressed control and dynamically loaded specimens were cultured for 24 hours
before the actual loading period. After the 48 hours loading regime ended, the
specimens were immediately removed, underwent papain/agarase digestion, and were
measured for DNA content (Figure 5.2a) and PG synthesis (Figure 5.2b).
No significant changes can be seen in DNA content of samples loaded in a
sinusoidal manner compared to unstrained control samples (p>0.05). On the other hand,
a 35% increase of DNA content was observed in samples loaded in trapezoidal manner
over control.
For proteoglycan synthesis, one-way ANOVA indicates p value of less than 0.05
between the higher values of sGAG incorporation within chondrocyte seeded agarose
scaffolds upon being exposed to compressive strain; and control unstrained samples. A
higher proteoglycans production can be observed from the medium contained in a 1 Hz
sinusoidally and uniaxially loaded specimen - twice as much as the total proteoglycans
measured from both medium and digested constructs that were exposed under
trapezoidal uniaxial loading. Distinguished difference between GAG productions of
samples being loaded in sinusoidal waveform was also contributed by high
concentration of GAG detected within the constructs.
Page 92
73
(a) (b)
Figure 5.1 The percentage change from unstrained control values for a) DNA content and b) GAG
content in chondrocyte-agarose digest upon subjected to 10% gross compressive strain in trapezoidal and
sinusoidal waveform for 48 hours. Each value represents the mean and standard error of 24 replicates,
normalised to the control unstrained samples (100%). One-way ANOVA indicate differences between
trapezoidal, sinusoidal and unstrained control samples as (*)p<0.05.
0
20
40
60
80
100
120
140
Trapezoidal Sinusoidal Unstrained
DN
A C
on
ten
t (%
) *
* *
0
100
200
300
400
500
600
Trapezoidal Sinusoidal Unstrained
GA
G c
on
ten
t (%
)
* * *
Page 93
74
(a) (b)
Figure 5.2 Evaluation of the 24 hours pre-culture effect on a) DNA content and b) proteoglycan
production by chondrocytes encapsulated in agarose scaffolds. Upon seeding, the chondrocytes-agarose
constructs were left free swelling within the incubator for 24 hours, before being exposed to dynamic
10% direct compressive strain for 48 hours. Data are given by mean and standard error of mean (n=24)
with (*)p<0.05. The data are normalised to the control unstrained specimens to eliminate other
independent variables.
5.4. Discussion
Dynamic mechanical load is essential to induce cell proliferation and cell
metabolism. Our finding is parallel to other scientific studies that see dynamic
mechanical load as somehow stimulating chondrocyte metabolism through increased
GAG production compared to static compression or unstrained specimens (M.
Buschmann et al., 1995; Chowdury et al., 2003; Davisson et al., 2002; RL Mauck et al.,
2003; Shelton et al., 2003).
In another study, 5% amplitude of sawtooth compressive load was given to
chondrocytes seeded in scaffold. It was found that more s-GAG incorporation was
observed on chondrocytes that was given 50% offset compression at 0.1 Hz over 0.001
Hz. (Davisson et al., 2002). In addition, Shelton et al. found dynamic strain at 0.3 Hz
0
20
40
60
80
100
120
140
160
Trapezoidal Sinusoidal Unstrained
DN
A C
on
ten
t (%
)
* *
0
50
100
150
200
250
300
350
400
450
500
Trapezoidal Sinusoidal Unstrained
GA
G c
on
ten
t (%
)
* * *
Page 94
75
produces a significant inhibition in GAG synthesis over unstrained control samples
(2003). Even though a higher frequency increases the rate of fluid flow, the effective
area will be smaller (Sah et al., 1989).
There is a slight reduction of DNA measured in papain-digested chondrocyte-
agarose constructs upon exposure to sinusoidal 10% load at a frequency of 1 Hz. The
same observation was seen by Waldman et al., which DNA level of chondrocytes, that
were loaded at 1-3% amplitude intermittently, decreased (2007; 2003) .This phenomena
is explained by the s-cycle completion of cells (Huselstein et al., 2006) (refer to Section
7.4).
In terms of the dynamic load waveforms, two 12-hour periods of sinusoidal loading
seem to have a stimulatory effect on the production of GAG indicating metabolic
activity of cells designed to produce new ECM. As reported by Chowdury et al.(2003),
86400 cycles of 15% amplitude of dynamic compressive loading applied at 1 Hz in two
12 hour blocks provided a greater stimulation that the same number of cycles applied in
one 24 hour block. New PG production is essential for cell survival, as ECM provides
fundamental role in signal transduction. The resting period in the middle of the load
exposure benefits the cells by allowing them to restore their mechano-sensitivity.
As explained previously, chondrocytes exposed to sinusoidal dynamic uniaxial
mechanical loading shows a DNA level reduction. This predicament, however, has been
solved by integrating a 24 hour pre-culture period to the chondrocyte-agarose constructs
prior to the mechanical load. Pre-culturing not only shows no significant reduction of
DNA concentration in the papain-digested chondrocytes-agarose constructs exposed to
sinusoidal load, but it also increases DNA concentration of constructs exposed to
Page 95
76
trapezoidal load up to 30%. In a study carried out by Davisson et al., the chondrocytes
seeded scaffolds were left free swelling for up to three weeks prior to load exposure
(Davisson et al., 2002).
Throughout the data analysis, all measurements were normalized to unstrained
control samples to eliminate other external factors such as medium that might affect cell
proliferation and GAG production.
As a summary, the findings from this chapter show that dynamic mechanical loading
has potential to facilitate the culture of functional tissues in vitro, by modulating the
proliferation and metabolism in a manner dependent on the nature of the loading regime
applied.
Page 96
77
Chapter 6. Study 3 (Effects of Dynamic Biaxial Loading
on Cellularity and ECM Production)
6.1. Introduction
Mechanical forces and deformations are sensed by cells and turned into biochemical
signals. This evolution is essential in regulating chondrocyte function; both in metabolic
and catabolic modus operandi. The main objective of this current study is to see the
influence of biaxial loading on chondrocytes.
This chapter will be outlined as the previous chapter, describing experimental
works that have been used throughout this thesis. While the previous chapter is on the
influence of uniaxial mechanical strain on chondrocytes, this current chapter will
describe experimental works to see the influence of biaxial mechanical strain on
chondrocytes. The chondrocyte-agarose constructs will be integrated into the bioreactor.
The test rig is designed to be capable of delivering both direct and/nor shear
compressive strain(s) to the agarose-chondrocyte specimens.
6.1.1. With/ without preculture
Previous findings reported by Buschmann (1995) have shown pronounced response
of chondrocytes to static and dynamic mechanical compressive loads when exposed at a
later stage of culture. The effects of direct compressive load on chondrocyte metabolism
appear to depend on the amount of pericellular matrix formed after a minimum of 1 day
culture. Thus, the need of pre-culturing upon exposure to biaxial loading was also
examined.
Page 97
78
6.2. Methods
6.2.1. Effects of Dynamic Biaxial Loading on Cellularity and ECM Production
In the previous chapter, only two stepper motors arranged in parallel were used to
deliver dynamic direct compression. In order to have the chondrocyte-agarose
constructs loaded bi-axially, a third perpendicular motor was also used. This stepper
motor drove the shear bracket (refer to Figure 3.6) at 1 Hz (sinusoidal) for 48 hours,
intermittently (12 hours on; 12 hours off). The magnitude of shear strain was set at 1%,
direct compression at 10%. The systems were set up as described in Section 3.3.
Another bioreactor cassette was used to deliver trapezoidal biaxial intermittent loading
at the same magnitude as the sinusoidal mechanical regime for two 12 hour periods of
time for a total of 48 hours including two12 hour resting periods. Throughout the
experiment, all loaded and unstrained samples (refer to Section 3.2.2) were held in a
37°C, 5% humidity controlled environment. Unstrained samples were placed within the
bioreactor and were used as the control group.
6.2.2. Effects of 24 Hours Pre-Culture Prior to Dynamic Biaxial Loading
In a second series of experiments, the loading protocol as described in Section 3.3,
was initiated after an additional period during which the constructs were left under free
swelling conditions for 24 hours in the 37°C, 5% humidity controlled environment.
Cell-agarose constructs were subjected to 10% direct compression and 1% shear
compression (sinusoidal) at a frequency of 1 Hz for a total of 48 hours, including two
12-hours resting periods as above (Section 6.2.1). Another set of experiments put the
chondrocyte-agarose constructs under trapezoidal loading at the same magnitude as the
sinusoidal loading for the same duration. The unstrained samples were used as a control
Page 98
79
group. The control group was put in a 6-well plate and placed in the same incubator as
the bioreactor throughout the experiment, including the 24 hour pre-culture period.
6.3. Results
6.3.1. Effects of Dynamic Biaxial Loading on Cellularity and ECM Production
Cell proliferation and PG synthesis were measured using calf thymus DNA and
bovine chondroitin sulphate as standards (see Sections 3.4.2 and 3.4.3). While 1 Hz
sinusoidal biaxial strain showed a significant inhibitory effect on cell proliferation
(Figure 6.1a), this mechanical regime stimulates up to 7.5-fold production of
proteoglycans (Figure 6.1b), marked by a high content of sulphated glycosaminoglycans
in both the medium and the constructs (Table 6.1). It also shows that when constructs
were loaded in a biaxial manner, PG content in constructs was seen to be double that in
the medium. The values given are significantly different (one-way ANOVA test, P<0.05
among trapezoidal, sinusoidal and unstrained samples). The values have been
normalized to control unstrained samples, aiding batch-to-batch comparison.
Table 6.1 Absolute values for GAG content in medium, constructs and total GAG synthesis, with
DNA content as baselines by chondrocyte/agarose constructs subjected to various waveform biaxial
loading. The average values are taken from 24 samples from four separate experiments.
Loading Regime GAGmedium/DNA
(µg/µg)
GAGconstructs/DNA
(µg/µg)
GAGtotal/DNA
(µg/µg)
Trapezoidal 0.804 ± 0.121 1.513 ± 0.101 2.316 ± 0.321
Sinusoidal 1.907 ± 0.501 2.784 ± 0.194 4.691 ± 0.375
Unstrained 0.301 ± 0.023 0.313 ± 0.038 0.614 ± 0.040
Page 99
80
6.3.2. The Effects of 24 Hours Pre-Culture Prior to Dynamic Biaxial Loading
This set of experiments applied the same mechanical regime as Section 6.2.1.
However, a 24-hours pre-culture period was integrated into the protocol in an effort to
ascertain the effect of pre-culturing on chondrocytes seeded in agarose prior to being
exposed to dynamic direct and shear compressive strains.
Figure 6.2 (a) shows DNA content in samples loaded in a trapezoidal manner 10%
higher than the unstrained samples, while those loaded in a sinusoidal manner were
reduced by 15% from the value given by the unstrained control samples (p<0.05).
At 10% direct compressive strain (equivalent to gross construct deformation of 0.5
mm) and 1% shear compressive strain (equivalent to gross construct shear deformation
of 0.05mm), this loading has shown a stimulatory effect on chondrocytes causing them
to produce more GAG. When the chondrocyte-agarose constructs were loaded at a
frequency of 1 Hz under a sinusoidal waveform, the cells seemed to produce a 2.5-fold
increase in PG compared to constructs loaded in a trapezoidal manner. Table 6.2 depicts
values of PG measured from the medium, and from digested constructs, normalised to
values measured from the medium and unstrained digested constructs.
Table 6.2 Absolute values for GAG content in medium, constructs and total GAG synthesis, with
DNA content as baselines by chondrocyte/agarose constructs subjected to various waveform biaxial
loading. The average values are taken from 24 samples from four separate experiments. All samples were
pre-cultured for 24 hours before loading.
Loading Regime GAGmedium/DNA
(µg/µg)
GAGconstructs/DNA
(µg/µg)
GAGtotal/DNA
(µg/µg)
Trapezoidal 0.796 ± 0.009 1.119 ± 0.015 1.915 ± 0.033
Sinusoidal 2.374 ± 0.092 2.763 ± 0.065 5.136 ± 0.283
Unstrained 0.266 ± 0.004 0.489 ± 0.011 0.755 ± 0.016
Page 100
81
(a) (b)
Figure 6.1 (a) Cell proliferation and (b) proteoglycan synthesis by chondrocytes seeded in agarose
scaffold upon being loaded to trapezoidal or sinusoidal biaxial strain at magnitude of 10% direct and 1%
shear compressive strain. Error bars represent means and SEM of 24 replicates, normalised to the control
unstrained samples (100%). (*) showing highly significant values across the loading factor (p<0.05).
(a) (b)
Figure 6.2 Upon free swelling pre-culture for 24 hours, the chondrocyte-agarose constructs were
loaded in a biaxial manner. At the end of the experiment, DNA content (a) and proteoglycans synthesis
(b) were quantified. The values are depicted as means and standard error. The values were normalised to
unstrained samples as the control group. Two-way ANOVA test has shown that all data were significant
to among those samples loaded under either trapezoidal, sinusoidal or even unstrained. (*)p<0.05.
0
20
40
60
80
100
120
140
Trapezoidal Sinusoidal Unstrained
DN
A C
on
ten
t (%
)
* * *
0
100
200
300
400
500
600
700
800
900
Trapezoidal Sinusoidal Unstrained
GA
G C
on
ten
t/D
NA
(%
)
* * *
0
20
40
60
80
100
120
140
Trapezoidal Sinusoidal Unstrained
DN
A C
on
ten
t (%
)
* * *
0
100
200
300
400
500
600
700
800
Trapezoidal Sinusoidal Unstrained
GA
G C
on
ten
t/D
NA
(%
)
* * *
Page 101
82
6.4. Discussion
Previous studies have shown that low amplitude dynamic compression induced
stimulation of GAG synthesis in cartilage explants (Farshid Guilak, Meyer, Ratcliffe, &
Mow, 1994; M. Jin et al., 2001; Wolf et al., 2007; M. Wong, Siegrist, & Cao, 1999) and
in isolated chondrocytes cultured in three dimensional structures (M. Buschmann et al.,
1995; Chowdury et al., 2003; Davisson et al., 2002; D. Lee et al., 2000; Shelton et al.,
2003; Villanueva et al., 2009). Physiologically, articular cartilage in the load bearing
joints experiences complex mechanical loading consisting of compressive, shearing and
tensile forces in combination (Mankin et al., 1994). Studies on the effect of fluid-flow
induced shear on monolayer cultured chondrocytes have shown up-regulation of nitric
oxide (M. S. Lee et al., 2002). Exhibition of NO was reported to inhibit PG synthesis
and cell proliferation in chondrocytes. Thus, this chapter which analyses the effect of
direct compressive and shear loading on chondrocyte metabolic response, without
incorporating any fluid shear is essential.
As described extensively in Section 8.2, some of the possible mechanisms involved
in the transduction of dynamic compression are altered fluid pressure, enhanced fluid
flow, and induced streaming potential, cell-matrix interactions, and growth factor
release.
This particular chapter has shown that integration of direct shear strain to the
mechanical loading regime causes a 7-fold increase GAG content in chondrocyte-
agarose constructs compared to control samples. This result is parallel to another study
which found increment in both collagen and PG concentration after 2% intermittent
shear stimulation at 1 Hz for 400 cycles every second day, with 5% off-set compression
Page 102
83
(Waldman et al., 2003). This increment in GAG content is more obvious in the
constructs than in the medium. This stimulatory effect can be seen from both loading
waveforms; sinusoidal and trapezoidal.
An inhibitory effect of sinusoidal dynamic biaxial load on chondrocytes is explained
by the same reason as outlined in Section 7.4.
As outlined in Section 6.3.2, integration of 24 hours pre-culture of chondrocyte-
agarose constructs before 48 hours sinusoidal mechanical load exposure at a frequency
of 1 Hz, exhibits three-fold GAG production compared to the trapezoidal loaded
chondrocyte-agarose constructs. Waldman et al. incorporates four weeks free-swelling
pre-culture to the chondrocyte seeded constructs (2003). Sinusoidal dynamic
mechanical load assimilates normal activity of human joints (i.e. walking).
In summary, chondrocytes seeded in 3D scaffolds and subjected to bi-axial loading
incorporating superimposed compressive and shear strain responds with significant
level of matrix synthesis. In agreement with previous studies, this chapter also shows
that pre-culture of chondrocytes is an important pre-requisite for effective 3D culture,
specifically in terms of cell proliferation.
Page 103
84
Chapter 7. Discussion
7.1. Introduction
This chapter integrates all work described in the previous chapters of the thesis. It
first illustrates the influence of biaxial mechanical load compared to the more widely
investigated uniaxial mechanical loading of chondrocytes. Then, the benefit of pre-
culture will be explained and discussed in detail.
Further sections draw on the general data analysis based on these results and these
data will be discussed extensively. At the end of the chapter, an analysis of the
experimental system utilized in this thesis is outlined as cell model, relevance of
mechanical regimes, DNA and GAG quantification protocols.
7.2. Is biaxial loading beneficial to the metabolic response of
chondrocytes?
Physiological loading patterns produced by gait and walking activities comprise a
combination of loading forms, varying in terms approximately equivalent to frequency,
force, waveform and duration, and including a variable mix of static, compressive, and
shear loading components (Jennifer et al., 2003). The present study makes use of the
well-established chondrocyte-seeded-agarose model and a bioreactor capable of highly
flexible combinations of compressive and shear loading over a sustained period.
Page 104
85
7.2.1. Comparing DNA Content and Proteoglycan Synthesis between Uniaxial
and Biaxial Loading without 24 Hours Pre-Culture.
Data from sections 5.3.1 and 6.3.1 show the response of chondrocytes to uniaxial and
biaxial loading. These values obtained from 48 samples are tabulated in Figure 7.1,
given as a percentage difference to respective control unstrained samples. In both cases,
direct with/without shear strains were applied to chondrocyte-agarose constructs
immediately after being seeded.
Figure 7.1(a) shows that uniaxial loading with a trapezoidal waveform increased
DNA content by 17% over the unstrained samples, compared to biaxial trapezoidal
loading that increased DNA content by only 13% (p>0.05). No significant difference in
value between the unstrained control specimens from these two experiments was
observed (p>0.05).
An interesting effect of biaxial loading is that the sGAG incorporation of samples
loaded under trapezoidal loading is higher compared to the control samples, even
though the respective DNA levels are lower than those loaded uniaxially. In addition,
sGAG incorporation measured from medium loaded under uniaxial to biaxial regimes is
approximately 1:1. Table 7.1 summarises the level of PG detected in medium and in
digested constructs upon being loaded. PG measurements in constructs (when loaded in
a biaxial manner) were twice as high as of uniaxially loaded samples. This might
suggest that biaxial loading increases sGAG incorporation within the constructs.
As summarised in Table 7.2, biaxial loading is more effective with respect to total
GAG synthesis. However, biaxial loading has been statistically shown to be
insignificant as to its effect on the DNA content of loaded constructs. As depicted in
Page 105
86
Table 7.3, chondrocytes responded most to the trapezoidal waveform in terms of
increasing DNA content, while sinusoidal waveform proved the least effective. Yet,
sinusoidal waveforms give the highest PG production, in both uniaxial and biaxial
loading systems.
(a)
(b)
Figure 7.1 The effect of uniaxial and biaxial loading on chondrocytes when cultured under
compressive strain on cell proliferation and proteoglycan production. These data are normalised to the
respective control unstrained samples (100%) to eliminate other uncontrollable variables. Each data is
reported as mean and standard error (n=24) with (*)p<0.05.
0
20
40
60
80
100
120
140
Uniaxial Biaxial
DN
A C
on
ten
t (%
)
Trapezoidal
Sinusoidal
* *
*
0
100
200
300
400
500
600
700
800
900
1000
Uniaxial Biaxial
GA
G/
DN
A C
on
ten
t (%
)
Trapezoidal
Sinusoidal *
* *
*
Page 106
87
A two-way ANOVA shows an interaction value of p<0.05 for PG synthesis,
exhibiting cross effect between the uniaxial/ biaxial and loading waveform, but no cross
effect has been detected for DNA content. The main effect of loading waveforms on the
level of DNA, regardless of uniaxial or biaxial loading, can be seen graphically as
illustrated in Figure 7.2(a) which shows two parallel line graphs suggesting no
interaction between the two factors (p>0.05), while Figure 7.2(b) suggesting that the
two lines will meet (p<0.05). This suggests that both sinusoidal and biaxial load
enhanced production of GAGs.
Table 7.1 Proteoglycan levels detected in medium and in digested constructs upon being exposed to
compressive and/nor shear strain.
Uniaxial Loading : Biaxial Loading
GAGMedium 1:1
GAGConstructs 2:1
Table 7.2 Mean of DNA content and proteoglycan synthesis, as a total of trapezoidal, uniaxial and
unstrained uniaxial or biaxial loading. Values shown are means and SEM of 24 replicates in four separate
experiments. Otherwise stated by ns
showing insignificant comparison, values are significant with p<0.05.
GAGMedium/
DNA (µg/µg)
GAGConstruct/
DNA (µg/µg)
GAGTotal/
DNA (µg/µg)
DNA Content
(µg)
Uniaxial
Loading
1.003 ± 0.665 0.642 ± 0.131 1.286 ± 0.600 3.063 ±
1.009ns
Biaxial
Loading
0.644 ± 0.197 1.537 ± 1.140 2.540 ± 3.073 2.955 ± 1.113
Table 7.3 Loading regime that shows stimulation effect to increase DNA content and proteoglycan
synthesis in both uniaxial and biaxial cases. Data is based on values which represent means ± SEM. (**)
p<0.05
DNA Content Trapezoidal > Unstrained > Sinusoidal**
Proteoglycan Synthesis Sinusoidal > Trapezoidal > Unstrained**
Page 107
88
(a) (b)
Figure 7.2 Interaction effect found to be significant in proteoglycans production (b), but not in DNA
content (a). This cross effect have shown that two factors (uniaxial/biaxial) and loading waveforms
contribute to higher production of proteoglycans, (*)p<0.05.
7.2.2. Comparing DNA Level and GAG Synthesis between Uniaxial and
Biaxial Loading Upon Pre-Culturing for 24 Hours
The mean percentage of cellular DNA and GAG levels upon exposure to 10% direct
with/ without 1% shear compressive strain(s) is tabulated in Figure 7.3. A total of 24
samples for each condition were used to tabulate these data, samples being subjected to
either uniaxial or biaxial loading protocols separately in weekly experiments. Potential
batch variations and environmental condition differences were addressed by
normalising each value to its respective control unstrained condition. In addition, the
values from unstrained groups done by biaxial and uniaxial loading were compared and
found not to be significantly different. This comparison is essential to provide
confirmation that all experiments were set up in controlled environments and that other
factors were constant, besides mechanical loading regimes (waveform/ multi- or uni-
directional). The samples were also subjected to a free-swelling pre-culturing period for
24 hours prior to exposure to uniaxial loading, biaxial loading, or being held unstrained.
0 1 2 3 4 5 6 7 8
DN
A C
on
ten
t (µ
g)
Loading Waveforms
Uniaxial Biaxial
0 1 2 3 4 5 6 7 8
GA
G/D
NA
Con
ten
t (µ
g/µ
g)
Loading Waveforms
Uniaxial Biaxial
*
Page 108
89
Thus, all control groups from both set of experiments (uniaxial and biaxial) were
cultured without strain for a total of 72 hours.
Upon 24 hours pre-culture, chondrocytes seeded within agarose constructs were
subjected to 10% direct compression for uniaxial loading, while half of the samples
were subjected to 10% direct and 1% shear compression for biaxial loading. Table 7.4
indicates that biaxial loading gives stimulatory effects to the production of
glycosaminoglycan, both in medium and in digested constructs. Using DNA as the
baseline, GAGTotal/DNA in constructs loaded in biaxial manner was found to be 55%
higher than the uniaxial loaded constructs (p<0.05). However, biaxial loading gives the
reverse effect on the DNA content in digested constructs. The DNA level in uniaxial
loaded constructs was slightly higher in comparison to DNA level within chondrocytes
that were subjected to biaxial loading (p<0.05).
Table 7.5 summarises the stimulatory effects of loading waveforms on DNA content
and proteoglycan synthesis in both uniaxial and biaxial cases, in terms of the degree of
response. The values measured for DNA content and PG synthesis are statistically
distinctive (p<0.05).
In terms of loading, trapezoidal and sinusoidal waveforms for both uniaxial and
biaxial phenomena give different stimulatory effects onto chondrocytes within agarose
constructs. It was found that sinusoidal loading, regardless of uniaxial or biaxial
loading affects chondrocytes such in a way that chondrocytes exhibit GAG synthesis.
On the other hand, sinusoidal loading has the lowest affirmative effect on DNA content,
while trapezoidal loading stimulates the highest DNA content among all specimens.
Page 109
90
(a)
(b)
Figure 7.3 The effect of dynamic compression either by uniaxial or biaxial loading at different
waveform on the DNA content (a) and proteoglycan synthesis (b), shown as percentage, normalised to the
values of unstrained control group (100%- not shown in graph). The specimens were pre-cultured under
free-swelling for 24 hours prior to being subjected to loading. Total number of samples involved was 24
samples for each condition and tests were replicated in separate weekly experiment. (*)p<0.05.
Two-way ANOVA tests have shown an interaction effect for both DNA content and
proteoglycan production. Figure 7.4 shows line graphs of (a) DNA content and (b)
GAG measurement from uniaxially or biaxially strained chondrocytes. Line graph (a)
will eventually cross each other someplace off the graph, if the lines were to be
0
20
40
60
80
100
120
140
160
Uniaxial Biaxial
DN
A C
on
ten
t (%
)
Trapezoidal
Sinusoidal
*
* *
*
0
100
200
300
400
500
600
700
800
900
Uniaxial Biaxial
GA
G/
DN
A C
on
ten
t (%
)
Trapezoidal
Sinusoidal
*
*
*
*
Page 110
91
extended, while line graph (b) shows two lines meet near the unstrained values,
indicating that, upon pre-culturing, both loading waveform and uni/multi-directional
loading gives interaction effects to DNA and GAG content.
Table 7.4 Mean value of all 24 samples from biaxial and uniaxial loading. The samples were put to
free-swelling for the first 24 hours before subjected to loading. All values are normalised to the control
unstrained group and a two-way ANOVA has given p value of less than 0.05(**), suggesting significant
values for all measurements at all conditions.
GAGMedium/
DNA (µg/µg)
GAGConstruct/DNA
(µg/µg)
GAGTotal/DNA
(µg/µg)
DNA Content
(µg)
Uniaxial
Loading 0.615 ± 0.161 1.057 ± 0.489 1.672 ± 0.951
4.031 ±
0.778**
Biaxial
Loading
1.145 ±
0.846** 1.457 ± 0.962**
2.602 ±
3.591** 3.749 ± 0.293
Table 7.5 Loading regime that shows stimulation effect to increase DNA content and proteoglycan
synthesis in both uniaxial and biaxial cases. (**) p<0.05.
DNA Content Trapezoidal > Unstrained > Sinusoidal**
Proteoglycan Synthesis Sinusoidal > Trapezoidal > Unstrained**
(a) (b) Figure 7.4 Interaction effect found to be significant in DNA content (a) and proteoglycans production
(b). This cross effect have shown that two factors (uniaxial/biaxial) and loading waveforms contribute to
higher production of proteoglycans, (*)p<0.05.
0
2
4
6
8
10
DN
A C
on
ten
t (µ
g)
Loading Waveforms
Uniaxial Biaxial
*
0
2
4
6
8
10
GA
G/D
NA
Co
nte
nt
(µg/
µg)
Loading Waveforms
Uniaxial Biaxial
*
Page 111
92
In the present study, investigation into the effect of uniaxial and biaxial loading on
chondrocytes has shown that biaxial loading has an advantage over uniaxial loading in
terms of synthesis of ECM. Our findings are in parallel to other studies that
contemplated that shear strains at a low range (1-3% strains) stimulated matrix synthesis
in cartilage explants (Frank et al., 2000; M. Jin et al., 2001). An application of simple
shear strains was observed to induce local pressure gradients and relative fluid flow at
the thin peripheral edge regions (M. Jin et al., 2001). Compression on the surface of
cartilage has shown compaction of the pericellular, territorial and interterritorial matrix
around the cells (M. Buschmann et al., 1995; F. Guilak et al., 1995). Load on cartilage
has also shown changes to the cell and nucleus surface area (M. Buschmann et al.,
1995; F. Guilak et al., 1995; J. Urban, 1994). The multiple regulatory pathways initiated
by the direct and shear compression are explained in detail in Section 8.2.
On the other hand, a study on the effect of shear deformation on full-thickness
explant cartilage has found that maximal shear strain was experienced by the
chondrocytes at the articulating surface. The effect decreased monotonously with depth
(B. L. Wong et al., 2008).
7.3. Is Pre-Culture Advantageous To The Chondrocyte Response?
This sub-chapter will assess the differential effect of a period of free-swelling
recovery upon subsequent mechanotransduction by chondrocytes. Buschmann et al.
(1995) suggests this pre-culture period to be a beneficial step.
Page 112
93
7.3.1. Pre-Culturing Affects DNA Content and total GAG Production by
Chondrocytes Loaded in Uniaxial Manner
Data from sections 5.3.1 and 5.3.2 permit comparison to see the effect of 24 hours
pre-culturing on chondrocytes. Table 7.6 summarises mean values of DNA and GAGs
measurements for both non pre-cultured (NPC) and pre-cultured (PC) samples for all
loading conditions. PC specimens have been shown to yield a highly significant
increase in both GAG and DNA content, compared to constructs exposed to loading
immediately after seeding (p<0.05).
Data from a total of 144 samples are combined in Figure 7.5, categorised as DNA
content (a) and PGs production (b). Pre-culture demonstrates a positive effect on DNA
levels in chondrocytes within the agarose scaffold. Even the PC unstrained samples
have a 20% higher DNA content (p<0.05) than the NPC ones. Note PC samples were
cultured under free-swelling for a total of 72 hours, whereas NPC samples were
cultured for only 48 hours.
Page 113
94
Table 7.6 Mean values of DNA content, GAGs measured in medium and in constructs of non pre-
cultured (NPC) and pre cultured (PC) specimens for all loading conditions. There were about 24 samples
for each case. DNA levels were used as the baseline for proteoglycan synthesis measurement. Values
shown as mean ± SEM. Unless stated, ** shows p value of less than 0.05 between NPC and PC samples.
GAGMedium/
DNA (µg/µg)
GAGConstruct/DNA
(µg/µg)
GAGTotal/DNA
(µg/µg)
DNA Content
(µg)
Non Pre-
Cultured
(NPC)
1.003 ± 0.665 0.642 ± 0.131 1.286 ± 0.600 3.063 ± 1.009
Pre-Cultured
(PC)
0.615 ± 0.161ns
1.057 ± 0.489** 1.672 ±
0.951**
4.031 ±
0.778**
Both PC and NPC samples show values of DNA content lower than unstrained
samples, suggesting an inhibitory effect of sinusoidal waveforms to DNA levels. Albeit,
DNA content in PC samples exposed to sinusoidal uniaxial loading was measured and
found to be 40% higher than in the NPC samples. There is an increment of about 40%
of DNA content in PC over NPC samples when loaded with a trapezoidal waveform.
The average values for total GAG synthesis of PC and NPC samples, (as shown in
Table 7.6) are 1.67 µg/µg and 1.29 µg/µg respectively, regardless of the type of loading.
These mean values indicate an advantage to 24 hour pre-culture of chondrocytes, prior
being subjected to loading. Control group unstrained PC samples that were cultured
under free-swelling for a total of 72 hours produced about 20% more GAGs than the
NPC samples.
Page 114
95
(a)
(b)
Figure 7.5 Trapezoidal and sinusoidal uniaxial strained constructs measured (a) DNA content
normalised to control NPC unstrained specimens (100%) and (b) proteoglycans synthesis, also
normalised to control NPC unstrained samples (100%). In both DNA and GAG level, pre-cultured (PC)
samples seem to have advantages over the non-pre-cultured (NPC) ones. 24 hours pre-culturing
significantly increase DNA content and proteoglycans production in all three cases (trapezoidal,
sinusoidal and unstrained). (*) p<0.05, while (**) also indicates p<0.05 for all loading conditions.
An interaction effect between integrating pre-culturing and loading waveforms can
be seen in terms of GAG production, but not DNA content. The main effect can be seen
in Figure 7.6(a) and suggests that the DNA content measured within chondrocytes
seeded in agarose constructs is significantly affected by pre-culturing, while Figure
7.6(b) shows an interaction effect where GAG level depends on both pre-culturing and
loading waveforms factors.
0
20
40
60
80
100
120
140
160
180
NPC PC
DN
A C
on
ten
t (%
) Trapezoidal
Sinusoidal
Unstrained
*
*
*
*
**
*
*
*
*
* **
*
0
100
200
300
400
500
600
700
800
NPC PC
GA
G/D
NA
Co
nte
nt
(%)
Trapezoidal
Sinusoidal
Unstrained
*
*
*
* **
**
*
*
Page 115
96
(a) (b) Figure 7.6 Line graphs showing interaction effect for DNA content (a) and GAG production (b). No
interaction can be seen for DNA content between NPC and PC samples (p>0.05). The graph shows that
there are cross effect for GAG production between non pre-cultured (NPC) and pre-cultured (PC)
specimens, suggesting that the results of GAG production depends on pre-culturing factor and loading
factor. (*) signifies p<0.05.
7.3.2. Pre-culturing Affects DNA Content Measured within Chondrocytes
Loaded in Biaxial Manner.
Table 7.7 summarises mean values of data from a total of 144 samples, half of which
were left under free swelling for 24 hours prior to exposure to biaxial loading, the other
half being subjected to load immediately after the chondrocytes were seeded in the
agarose scaffold. Pre-cultured (PC) samples have an advantage over non pre-cultured
(NPC) in terms of stimulating higher cellularity, but no obvious difference is observed
in GAG production.
Taking all three types of biaxial loading (sinusoidal/ trapezoidal/ unstrained) into
consideration, data from each type of loading shows pre-cultured (PC) is beneficial for
all loading waveforms. Figure 7.8(a) shows a 20% increase of DNA content, which can
be seen from the PC samples against NPC samples in trapezoidal and unstrained
0
2
4
6
8
10
DN
A C
on
ten
t (µ
g)
Loading Waveforms
NPC PC
0 1 2 3 4 5 6
GA
G/
DN
A C
on
ten
t (µ
g/µ
g)
Loading Waveforms
NPC PC
*
Page 116
97
conditions. Moreover, DNA content of PC samples is increased by 30% when the
constructs are subjected to sinusoidal loading, compared to the NPC samples.
A two-way ANOVA analysis confirms that there is no significant difference in GAG
production between PC and NPC specimens. Nevertheless, Figure 7.8(b) demonstrates a
trend in the effect of each waveform type of biaxial loading on GAG production. In
both PC and NPC cases, as illustrated in Figure 7.7, sinusoidal loading has the most
significant effect on chondrocytes in terms of PG synthesis.
The interaction effect between NPC/PC and loading waveforms is depicted in
Figure 7.9. DNA content (refer Figure 7.9a) is mainly affected by pre-culturing
(p>0.05), while an interaction effect can be seen in the GAG production (refer Figure
7.9b), suggesting interaction between pre-culture and loading waveforms;
simultaneously bringing enhancement of synthesis of new molecular to produce new
ECM, marked by a higher level of GAG (p<0.05).
Page 117
98
Table 7.7 Mean values for GAG in medium, constructs and DNA content in all samples (n=72) for
non pre-cultured (NPC) group and pre-cultured (PC) group. It is shown that PC has a significant effect on
GAGMedium/DNA and DNA content (**) p<0.05.
GAGMedium/
DNA (µg/µg)
GAGConstruct/DNA
(µg/µg)
GAGTotal/DNA
(µg/µg)
DNA Content
(µg)
Non Pre-
Cultured
(NPC)
0.644 ± 0.197 1.537 ± 1.140 2.540 ± 3.073 2.955 ± 1.113
Pre-Cultured
(PC)
1.145 ±
0.846** 1.457 ± 0.962
ns 2.602 ± 3.591
ns
3.749 ±
0.293**
< < Unstrained Trapezoidal Sinusoidal
Figure 7.7 A trend of biaxial loading waveforms from the least to the most
significant in terms of producing stimulation effect on chondrocytes to proteoglycans
synthesis.
Page 118
99
(a)
(b)
Figure 7.8 Data were collected to see the effect of (a) DNA content, normalised to the unstrained
samples as the control group (100%) and (b) proteoglycan production by chondrocytes seeded in agarose
loaded in biaxial manner immediately after cell seeding or upon 24 hours pre-culture under free-swelling
condition. The data were taken from a total of 72 samples for each pre-cultured (PC) and non pre-cultured
(NPC) conditions. (*) p<0.05, while (**) also indicates p<0.05 for PC samples versus NPC samples in all
loading conditions.
0
20
40
60
80
100
120
140
160
NPC PC
DN
A C
on
ten
t (%
) Trapezoidal
Sinusoidal
Unstrained
*
* *
* **
**
0
100
200
300
400
500
600
700
800
900
1000
NPC PC
GA
G/ D
NA
Con
ten
t (%
)
Trapezoidal
Sinusoidal
Unstrained
* * * * *
*
Page 119
100
(a) (b) Figure 7.9 Interaction effect of non pre-cultured and pre-cultured specimens in terms of a) DNA
content and b) chondroitin sulphate incorporation using DNA content as the baseline. Graphs show that
cross effect can be seen from the level of proteoglycan synthesis (* signifies p<0.05), but no cross effect
for DNA content (p>0.05).
Subsequently, cell proliferation and matrix production was found to be significantly
higher in pre-cultured chondrocyte-agarose constructs. The samples were left free-
swelling for 24 hours upon seeding. The newly-formed pericellular matrix around
chondrocytes within the agarose has a higher elastic modulus than agarose/chondrocyte
constructs (Knight et al., 1998). Buschmann (1995) shows the readiness of cells after
one day, by measuring hyaluronan and integrin. Within the scaffold, the cells proliferate
and synthesize matrix molecules, which are subsequently deposited within the construct
and/or released into the growth medium (M. Buschmann et al., 1995). The release of
GAG to the medium may be due to the aggregability, catabolism of IG matrix or
„washing out‟ of unincorporated GAG due to convective transport (Hunter et al., 2004).
As suggested by Hunter et al. (2004), the mechanical signals transmitted to cells may
vary substantially between different scaffold environments. While chondrocytes in
native tissue bound to the ECM via cell adhesion, which can transfer matrix strains to
mechanosensitive ion channels directly to the cytoskeleton; in agarose, cells adhere to
0 1 2 3 4 5 6 7 8 9
DN
A C
on
ten
t (µ
g)
Loading Waveforms
NPC PC
0
2
4
6
8
10
12
GA
G/
DN
A C
on
ten
t (µ
g/µ
g)
Loading Waveforms
NPC PC
*
Page 120
101
polysaccharide molecules. That is why pre-culture is also essential when polysaccharide
matrices such as agarose or alginate is used. With pre-culturing, cells are able to bind to
the new pericellular matrix as it is deposited, thus providing biomechanical interaction
between the pericellular environment and the chondrocytes (Farshid Guilak & Mow,
2000; Hunter et al., 2004). Besides providing structural support, mechanical strength
and attachment sites, ECM also envelopes signalling molecules that modulate cellular
functions such as proliferation, migration and differentiation (Wang & Thampatty,
2006).
7.4. General Data Analysis
In the final analysis, data from samples either used instantaneously or following 24
hours pre-culture, then subjected to uniaxial or biaxial loading (trapezoidal/sinusoidal),
were gathered to assess their effect on DNA and GAG production (refer Figure 7.10 and
Figure 7.11).
DNA content was extracted from papain-digested agarose constructs containing
chondrocytes. The DNA level was quantified as explained in Section 3.4.2. DNA is
contained within the chondrocyte nucleus, and ECM is broken down by papain
activated enzymes.
Overall, trapezoidal mechanical load has the highest proliferation stimulatory effect
for both uniaxial and biaxial loading types, regardless of being pre-cultured or not.
Among all samples that were subjected to trapezoidal uniaxial or trapezoidal biaxial
loading, the pre-cultured group gives a higher reading for DNA level.
Page 121
102
Figure 7.10 DNA level measured from digested constructs that were either loaded
trapezoidal/sinusoidal or were left unstrained as the control group (100%- not shown in graph). The
loading regime was set to 10% direct and/nor 1% shear compressive strains. Half of the agarose
constructs were directly subjected to load upon seeding with chondrocytes, while the other half were pre-
cultured for 24 hours prior to be subjected to load. Data were tabulated from 24 samples for each
condition and each data was normalised to control unstrained groups. (*) p<0.05. As a sum, uniaxial
gives higher effect on DNA content regardless of loading waveforms (p<0.05).
For the case of DNA level, it is shown in the graph above that uniaxial loading has an
advantage over the biaxial loading (p<0.05).
As described in Section 2.1.3, GAG is a type of polysaccharide that can be found in
the proteoglycans that make up the protein molecules of cartilage ECM. The GAG
level, as depicted in Figure 7.11, is measured to assess the level of new molecular
protein synthesis with effect to various independent variables.
In all conditions, for biaxial and uniaxial loads, pre-cultured samples have shown to
be significant to contribute to higher level of GAGs, with the exception of PC samples
loaded in biaxial trapezoidal manner. Chondrocytes seeded in agarose scaffold favour
biaxial loading that leads to increment of GAG synthesis, with regard to both
trapezoidal and sinusoidal loading. Primarily, 1 Hz-sinusoidal loading regime is
strikingly effective in terms of increasing GAG synthesis.
0
20
40
60
80
100
120
140
160
180
Uniaxial Biaxial
DN
A C
on
ten
t (%
) Trapezoidal_NPC
Trapezoidal_PC
Sinusoidal_NPC
Sinusoidal_PC
* *
* *
*
*
Page 122
103
Predominantly, chondrocytes were more metabolically active if pre-cultured for 24
hours upon seeding before being subjected to any load, and under biaxial loading for
increasing both DNA and GAG levels. Nevertheless, a trapezoidal waveform has an
advantage over sinusoidal in terms of a higher DNA content, while chondrocytes seem
to respond better to sinusoidal loading when it comes to proteoglycan synthesis (refer to
Table 7.8).
Figure 7.11 GAG content is assessed from all samples loaded either uniaxial or biaxial
(trapezoidal/sinusoidal) as well as the control unstrained groups (100% - not shown in graph). Both non
pre-cultured (NPC) and pre-cultured (PC) samples are also taken into account. The data comes from the
same number of replicates for each case, n=24. Data from each case were shown to be highly significant
for (*) where p<0.05. In a sum, biaxial gives stimulatory effect to GAG production (p<0.05).
0
200
400
600
800
1000
1200
Uniaxial Biaxial
GA
G/
DN
A C
on
ten
t (%
)
Trapezoidal_NPC
Trapezoidal_PC
Sinusoidal_NPC
Sinusoidal_PC
* *
*
* *
*
Page 123
104
Table 7.8 Analysis of combination of all factors, non pre-cultured (NPC)/ pre-cultured (PC) and
loading regimes, using a three-factor ANOVA using SPSS. Equal replications of 24 samples for all
conditions were used to tabulate these data. (**) p<0.05.
Effects Comparisons Results
DNA Level Total GAG/ DNA
Overall
NPC vs. PC
PC mean > NPC mean**
(3.89>3.01)
PC mean > NPC mean**
(2.14>1.91)
UNIAXIAL
vs. BIAXIAL
BIAX mean < UNI mean**
(3.35<3.55)
BIAX mean > UNI mean**
(2.57>1.48)
LOAD
TRAP>UNS >SIN **
(4.11>3.44>2.80)
SIN>TRAP>UNS **
(3.71>1.76>0.61)
12 hours trapezoidal loading nearly imitates static compression when continuous
compression of constant amplitude is given throughout the whole period of 12 hours.
This type of compression reduces the porosity of the agarose scaffold, limiting the
transport and mobility of molecules and nutrients. Permanent compression increases
negative ions and increases pH, thus decreasing water attraction, reducing cell-ECM
volume (M. Buschmann et al., 1995).
Two 12-hous blocks were shown by Chowdhury et al. (2003) to be better than one
12-hour block or one 24-hour block, suggesting 43200 cycles (12 hours) is already
beyond the threshold for the cells. It was also observed that the highest DNA content
was found in 1.5 hour intermittently compressed constructs and further compression
caused inhibition of cellularity. Hunter et al. (2004) suggested that stimulation
interspersed with periods of rest might enhance tissue formation. This resting period is
Page 124
105
essential to give way to the cells to restore its sensitivity. Continued compression might
have caused mechanosensory saturation that would cause decreasing sensitivity of cells
to mechanical stimuli with further loading (Hunter et al., 2004; Robling, Hinant, Burr,
& Turner, 2002).
The effect of compression of a cartilage explant has also shown that after being left
stress-relaxed for an hour, the explant samples were observed to depressurize and
eventually approach a steady-state condition. However, the cartilage explant
continuously experiences shear stress effects, which are believed to result from
interstitial fluid pressures and kinetic friction (B. L. Wong et al., 2008).
Joint immobilization or disuse of joints leads to modification of the cartilage matrix.
In the worst cases the cartilage eventually loses its mechanical functionality. When the
cell-seeded constructs are exposed to static compression, the fluid will be drawn out of
the matrices and charge instability caused by the fixed negative charge of the
proteoglycan will entice the ions from the medium. This phenomenon will affect the pH
of the tissue. The pH alteration will trigger transforming growth factor (TGF-β) that will
lead to the apoptosis of chondrocytes and production of bone morphogenetic protein
(BMP) that will initiate the calcification of cartilage. This will indirectly result in joint
immobilization. The cartilage depends on the biphasic properties of its ECM to
withstand the compression and prolonged static compression will force the collagen
fibres to align parallel to the force vector. The modification to the physical structure of
the ECM will reduce the matrix pore size and limit mass transport of nutrients to and
wastes from cells. To conclude, static compression will depress the production of matrix
synthesis that is essential for the survival of chondrocytes (McMahon et al., 2008).
Page 125
106
Lee (2000) assessed the effect of dynamic loading on chondrocytes isolated from
superficial and deep zones of cartilage. Unstrained specimens show higher DNA
content for deep cells than superficial cells. Dynamic loading shows an increased DNA
content in superficial cells but does not have any effect on deep cells. Dynamic loading
increased PG by 50% in deep cells, with deep zones having greater overall activity, but
limited ability to proliferate. This might suggest full-thickness cartilage is essential in
load research as mentioned in Section 2.1.2 and Section 2.2.3; each zone has its own
mechanical properties with varied collagen orientation and cell shape throughout the
depth. The heterogeneity in composition and structure is responsible for the resistance
of cartilage to different types of load.
Throughout this study, the load was delivered at a frequency of 1 Hz. Previous
studies have found that 1 Hz is an optimal frequency, compared to 0.3 or 3 Hz (Shelton
et al., 2003). It has been shown that increased frequency will affect the effective width
of the peripheral ring negatively (D. Lee et al., 2000; Sah et al., 1989). Besides, Fan and
Waldman (2010) suggested that the rate of acidification of the media accelerates with
increasing frequency of loading. A change in medium pH is contributed by post-
production of glucose metabolisation anaerobically. Deep cells loaded dynamically at
0.3 Hz show a stimulatory effect to [3H]-thymidine incorporation compared to other
frequency regimes (Shelton et al., 2003).
This study has also shown that 1 Hz-sinusoidal mechanical regime inhibits DNA
synthesis in chondrocytes. Considering multiple phase of cell cycle, it might take a
while for cells to complete one cell cycle. Freshly isolated chondrocytes are highly
metabolically active until they have had time to deposit some of their own matrix
Page 126
107
(Quinn, Schmid, Hunziker, & Grodzinsky, 2002). Subsequent studies by Waldman et al.
(2007; 2003) have shown that intermittent multi-axial loading on chondrocytes caused a
decline in total DNA content of stimulated samples. It is believed that this might be
caused by either cell death or inhibition of the cell cycle. Stimulation of cell
proliferation was found to be maximal for chondrocytes subjected to 1.5 hours of
dynamic continuous compression. Further cycles of dynamic strain reduced the
probability of the cell entering s-phase during the 48 hours period (Chowdury et al.,
2003). An initial study into cell viability and cell cycle progression was seen to be
inhibited by mechanical stimulation. However, once a proper ECM is built, the
stimulation starts to show a positive effect. In a study by Huselstein (2006) the positive
effect is only seen after 21 days.
Some of the possible mechanisms involved in the transduction of dynamic
compression are; altered fluid pressure, enhanced fluid flow, induced streaming
potentials, cell-matrix interactions and growth factor release. Besides cell and nucleus
deformation, dynamic loading enhances convective transportation of mobile solute,
especially on the transport of larger molecules such as ADP and growth factors; and
fluid flow convecting mobile counterions past ionized charge groups on immobilized
macromolecules generates streaming potentials (M. Buschmann et al., 1995).
Page 127
108
7.5. Experimental System
7.5.1. Cell Model
Cell Source
The ultimate goal of research in tissue engineering is to enhance the quality of
human lives by offering an option to recreate cells and tissues that are capable of
restoring lost function. In this present study, a bovine cell source was preferred over a
human cell source for various reasons. The bovine cell source was readily available and
its size makes it yields large numbers of cells following isolation. Cell yield is essential
as a head start in this study as otherwise the work would require an additional step of
expansion in monolayer culture. It was reported that chondrocytes which underwent
monolayer culture experienced dedifferentiation (Frohlich et al., 2007).
Cell Seeding Density
Initial high cell seeding and uniform cell distribution has been proved to increase the
rate of cartilage matrix formation (Ivan Martin, Wendt, & Heberer, 2004). Mauck et
al.(2003) seeded chondrocytes in agarose scaffold at concentrations of 10 million
cells.ml-1
and 60 million cells.ml-1
. It was found that there was more than twice the
increase in mechanical properties of higher density seeded agarose constructs, and the
GAG analysis has also been shown to be significantly higher than those construct under
free-swelling.
There was another study that manipulates seeding density and distributions of
chondrocytes in polyglycolic acid (PGA) scaffolds. Chondrocytes were seeded at 2.5, 5
or 10 million cells.ml-1
. Even though cell viability and GAG content per constructs have
Page 128
109
shown to be excellent in the highest density chondrocytes, the spatial distribution of the
cells was found to be more reflective when only intermediate concentration of
chondrocytes were applied (Bueno et al., 2007).
Thus, it is suggested that a lower cell seeding density is preferential for constructs
where mechanical stimulation is applied. There were only 8 million cells.ml-1
and 10
million cells.ml-1
chondrocytes seeded in agarose constructs prior to mechanical loading
(Chowdury et al., 2003; B Pingguan-Murphy et al., 2005).
Scaffold
An ideal scaffold must be three-dimensional, highly porous with an interconnected
pore network, be biocompatible and have a controlled degradation rate. The scaffold
must be compatible while enveloping the cells and it must also not produce toxic post
degradation particles (Yun & Moon, 2008).
The dimensions of the construct were (5x5x5) mm. This thickness is similar to the
thickness of native cartilage, which ranges from 1 to 5 mm (Heywood, Sembi, Lee, &
Bader, 2004).
Agarose is a biocompatible natural material that has a low degree of branch
complexity. Agarose was chosen as the scaffold as it was proven that agarose offers a
uniform environment and it does not contain any ionic charge (Kelly, Ng, Wang,
Ateshian, & Hung, 2006). For this particular study that evaluates the effect of
mechanical loading, it is important that the construct does not provide any additional
factors (such as growth factors or anionic charges) besides the constructional matrix to
hold the chondrocytes while their own ECM is produced as a results of the mechanical
stimulation given.
Page 129
110
Besides, Saris et al. (2000) has proven that dynamic pressure conduction through the
agarose gel was thorough and prompt. In subsequent study run for 20 to 40 days on
matrix composition and fine GAG structure by chondrocytes seeded in various type of
scaffold that are commonly used in cartilage tissue engineering, chondrocytes were
either seeded in degradable synthetic polymers- PGA, fibrillar protein gels- Collagen I
and fibrin; agarose or alginate that is classified as polysaccharide gels. Due to the
distinctive microstructure of molecular proteins and components in each scaffold used,
chondrocytes seem to favour agarose. The highest sGAG to DNA ratio was produced by
chondrocytes seeded in agarose, while those in alginate and collagen I had the lowest
levels. In addition, agarose has shown an advantage over other types of scaffold in
terms of the highest fraction of disulphated residues and the lowest amount of
unsulfated residues, which nearly match the native articular cartilage (J.K. Mouw et al.,
2007).
On the other hand, Hunter et al. (2004) has found that there is also a disadvantage of
using a natural polymer as a scaffold. Using fibrin has shown an adverse effect on cells
in their response to loading. This might be caused by different pathways or
mechanotransduction resulting from the interaction between the newly-synthesized
ECM molecular proteins and molecules readily available in the scaffold. It was
suggested that using agarose would encourage the cells to produce/synthesize natural
new pericellular matrix, which the cells can interact with. This natural/normal matrix
will induce physiologically ECM receptors (α2β1 integrins and CD44). When fibrins
were used, collagens and hyaluronan bind to other type or molecules causing activation
of other receptors (α5β1 or αvβ3 integrins). This paranormal integrins activation might
affect cellular response to mechanical stimuli.
Page 130
111
Another similar study was designed based on the fact that cartilage contains
abundant negatively charged aggrecan molecules such as Chondroitin-4-Sulphate,
Chondroitin-6-Sulfate and Keratan Sulphate incorporation with positive ions in
interstitial fluid give rise to osmotic swelling pressure. Villanueva (2009) adopt these
natural properties of cartilage by integrating chondroitin sulphate to the scaffold.
However, a negative effect was seen from this incorporation due to changes to the
osmotic environment. It is essential to culture chondrocytes in the physiological osmotic
environment of native cartilage, about 400mosM.
7.5.2. Relevance of Mechanical Loading Regimes
Research has been carried out to determine contact pressures experienced by human
hip joint. During standing for a period of time, the pressure felt by the joint was
measured to be 1MPa. While walking, the contact pressure ranging from 0.1 to 4MPa
(J. Urban, 1994).
These values are translated to 10-20% compressive strain. There are some literatures
published with 10% and 15% compressive strains (M. Buschmann et al., 1995;
Chowdury et al., 2003; Davisson et al., 2002; D. Lee et al., 2000; RL Mauck et al.,
2003; Shelton et al., 2003; Villanueva et al., 2009).
Despite high compressive amplitude done by other groups, for this particular study,
amplitude of 5% compressive and shear strains was initially set to the test rig. This
strain was less extensive than other studies stated previously, due to a study done by
Waldman et al. (2007) that depicts equilibrium amplitude of compression and shear
strain amplified the cells‟ ability to produce collagen and proteoglycan. Physiologically,
the contact pressure experienced by human joint is not more than 5%.
Page 131
112
However, considering the whole experiment that will take up to only 48 hours, as
reported by Sah et al. (Sah et al., 1989), low frequency, low amplitude loading
demonstrated less effect to the cells; amplitude of 10% compressive and 1% shear
strains will be conveyed using the novel-design bioreactor.
The frequency was rationalized by studies that exposed chondrocytes to
compressive strains at different frequencies (0.3, 1 or 3Hz). The results turn out to be
highest GAG production by chondrocytes when exposed to 1Hz of stimulation (D. Lee
et al., 2000; Shelton et al., 2003).
It was also found that repetitive cyclic compression applied in two 12 hours region
gave better stimulation effect to the chondrocytes in comparison to chondrocytes that
were subjected to continuous 24 hours of 15% (1Hz) compression (Chowdury et al.,
2003).
7.5.3. DNA Measurement Protocol
A deoxyribonucleic acid (DNA) assay was utilized in the DNA analysis to determine
cellular content. DNA measurement protocol were optimized to eliminate the difficulty
of quantifying DNA content due to low cell density in articular cartilage and
interference of other matrix components with DNA analysis (Hoemann, 2004; Y.-J.
Kim et al., 1988; McGowan et al., 2002; M. R. Urban et al., 1998).
These studies have augmented a few ranges of excitation (355-365nm) and emission
(450-460nm) wavelengths to detect the DNA content within the samples. It was also
concluded that RNA level in the samples was not interfering the DNA content
Page 132
113
quantification as the concentration of RNA was 400 times lower than that of DNA
(McGowan et al., 2002).
7.5.4. Glycosaminoglycan Quantification Protocol
GAG is one of the earliest indications of chondrocyte metabolism. An optimised
DMB assay was produced by Farndale (1982) to eliminate the instability of the assay
where the GAG-DMB complexes tend to precipitate. The dye was stabilized by
replacing the dibasic phosphate buffer with a formate buffer. The sGAG-DMB complex
precipitation was impeded by its preparation without vigorous mixing and turbulence.
Furthermore, a modified form of DMB assay has improved its specificity towards
sulphated GAGs. The specificity characteristic is attributed by lower pH and higher salt
concentration of the new formulation of DMB, as it suppressed weak interactions
between hyaluronic acid and DNA to DMB molecules. Besides, DMB analysis which
previously almost always interfered by protein or glycoproteins in the ECM, can be
avoided by sample digestion with papain prior to measuring (Richard W. Farndale,
Buttle, & Barrett, 1986).
Page 133
114
Chapter 8. Conclusion
8.1. Introduction
The chapter will suggest some possible mechanotransduction pathways activated by
biaxial mechanical loads on chondrocytes. Some recommended future work on the cell
system and mechanical loading regimes concludes this chapter.
8.2. Possible Mechanotransduction Pathways
Throughout the human body, there are various kinds of mechanical forces
experienced by human beings, including gravity, tensile muscular forces, compressive
loads, shear stresses and cyclically stretched (Wang & Thampatty, 2006). Cell
behaviour and phenotype are governed by responses to mechanical forces, electrical
stimuli and other physical cues. Transduction of mechanical stress into biochemical
signals by cells is known as mechanotransduction. As explained in detail in Section
2.4.1, mechanotransduction may be studied at the molecular, cellular or the tissue level.
Cell proliferation, ECM gene, protein expression and production of soluble factors are
some of the responses of cells towards mechanical loading. However, it remains unclear
how cells sense the forces and convert them to biological responses thereupon. There
are many cellular components involved in mechanotransduction; the cytoskeleton,
integrins, G proteins, receptor tyrosine kinases, mitogen-activated protein kinases and
stretch-activated ion channels, to name a few.
Due to the complex structure of cartilage – anisotropic and heterogenic, there are
multiple regulatory pathways activated by mechanical loading subjected to articular
cartilage; upstream signalling, transcription, post-translational modification and
Page 134
115
vesicular transport. Transcription and post-translational modifications of ECM
molecules are affected as these processes involving ER and Golgi apparatus were seen
to have changed their morphology and structure due to the load applied (Grodzinsky,
Levenston, Jin, & Frank, 2000). Mechanical loading, such as simultaneous matrix
stretch and compression, facilitates transportation of molecules and nutrients (M.
Buschmann et al., 1995; M. Jin et al., 2001).
Signalling mechanisms due to cyclic loading involve actin cytoskeleton, stretch-
activated ion channels and activation of tyrosine kinase (M. Jin et al., 2001; Millward-
Sadler, Wright, Davies, Nuki, & Salter, 2000). Mechanical loads have shown to cause
changes in cell shape and nucleus structure due to deformation of chondrocyte
cytoskeletal components such as microtubules (MTs) and vimentin intermediate
filaments (IFs) (C. Lee, Grad, Wimmer, & Alini, 2006). As mentioned in Section 1.1.1,
MTs which forms basket-like mesh throughout cytoplasm is held responsible of
intracytoplasmic transport. Organization of Golgi apparatus depends on MTs as
depolymerisation of MTs leads to restructuring of Golgi membrane in ER. IFs were
abundantly found at the weight bearing region of articular cartilage, indicating their
involvement in mechanical as well as transport and signalling functions (Jortikka et al.,
2000). Both MTs and vimentin IFs were detected even at the initial stage of culture
period, suggesting that these structures retain during the isolation procedure (D. A. Lee
et al., 2000).
In addition, vimentin IFs which can be found transverse from plasma membrane to
the nuclear membrane are believed to mediate transcription for genomic DNA via
nucleus deformation and sequence-specific DNA interactions (Langelier et al., 2000; C.
Page 135
116
Lee et al., 2006; D. A. Lee et al., 2000). Besides IFs and MTs, the finest cytoskeletal
component, actin microfilaments play roles in secretion and endocytosis. Actin
microfilaments also provide structural protection to ECM proteins against shear stress
(Langelier et al., 2000).
As a result of mechanical compression, matrix and chondrocytes go through
deformation. This causes changes of cells and nucleus volume and surface area.
However, dynamic compressions of specific mechanical regimes given with a resting
period have caused the least deformation due to osmotic properties of cartilage tissue.
Hydrodynamic forces results to individual chondrocytes to elongate and align tangential
to the direction of fluid shear. Even the length of the GAG chains in human and bovine
cartilage increased; thus enhanced its water retention capability (R. L. Smith et al.,
1995). Collagen fibres entrapped the water molecules. Further compression will cause
some of the fluid to be exudated. With less water content, the matrix is negatively
charged due to the proteoglycan. This ionic difference has caused positive ion
molecules such as Na+ and Ca
2+ to travel into the matrix. These ions have been shown
to be essential to induce some metabolic behaviour of chondrocytes.
In addition, mechanical shear loading which leads to membrane stretch also change
the orientation of collagen bundles which in turn rearrange cell, cytoskeletal actin
microfilaments, microtubules and intermediate filaments and nucleus (Ingber, 2006;
Mobasheri et al., 2010; Salter & Lee, 2010). Cytoskeletal deformations may have
triggered stretch-activated ion channels and integrin-cytoskeleton machinery which
activates kinase cascades leading to changes in transcriptional regulation (Millward-
Sadler & Salter, 2004). Hyperpolarisation of chondrocyte cell membranes actuates
Page 136
117
stretch-activated ion channels that initiate the activation of Ca2+
-dependent K+ ion
channels (Wright, Jobanputra, Bavington, Salter, & Nuki, 1996). Membrane distortion
due to shear loading is either directly affecting cytoskeletal distortion of transmembrane
molecules or stretch-activated ion channels are linked to cytoskeleton via ß1 integrin
(Ingber, 2006; Mobasheri et al., 2010). As stated in Section 2.2.4, integrin receptors act
as the adhesion sites between chondrocytes and fibronectin. Fibronectin promotes cell
attachment to the matrix and play an important role in cell motility and differentiation
(Wang & Thampatty, 2006). Integrins are essential in regulating activation of a number
of intracellular cascades that induce changes in gene expression and tissue remodelling.
This is enhanced by the α5ß1 integrin-fibronectin binding via RGD (Arg-Gly-Asp)
motifs, which specifically activate the mitogen-activated protein (MAP) kinase pathway
(Kock et al., 2009; Millward-Sadler et al., 2000). There upon, activation of integrins
due to shear loading leads to tyrosine phospholyration of regulatory proteins and
secretion of autocrine and paracrine acting solubme mediators, interleukin-4 (IL-4)
(Millward-Sadler & Salter, 2004).
8.3. Future Work and Recommendation
8.3.1. Cell Work
Digestion Enzyme
Further study can be done to incorporate hyaluronidase to digest the hyaluronan,
a type of GAG found in cartilage. Two-stage cartilage digestion using protease and a
combination of type-XI and type-II collagenase can also be tested as it is known that
type-XI collagen acts as the nucleation site for the deposition of type II collagen.
Page 137
118
Protease will partially degrade the ECM, while degradation by type-XI collagenase will
expose type-II collagen for better degradation.
Incubation Temperature
Each enzyme has an optimum temperature at which it works best. Increasing the
enzyme concentration (at 37°C) would jeopardize the cell viability and enzyme activity.
High temperature will also break some of the weak bonds in the cells and enzyme. This
will induce thermal denaturation and eventually inactivate some of the proteins in the
enzyme.
8.3.2. Mechanical Regimes
Long-Term Compression of Cell
A series of studies can be conducted to see the prolonged effect of mechanical
stimulation on chondrocytes seeded in agarose constructs. Long-term experiments are
needed to see the reaction of chondrocytes in terms of GAG production, DNA
quantification, NO level and collagen production. Longer durations of mechanical
loading exposure ranging from four to eight months should be used (RL Mauck et al.,
2003; Waldman et al., 2007).
Besides, the mechanical regimes can be differentiated in terms of duration of
exposure, waveform, frequency and strain magnitude. We recommend the normative
use of 1 Hz trapezoidal loading for better cell proliferation and sinusoidal loading for
high GAG production.
Page 138
119
Real-time Imaging
To date, there have not been single studies that assess the metabolic and
catabolic process of chondrocytes both temporally and spatially. Thus, it is crucial to
incorporate an imaging apparatus to see the phenomena of the chondrocytes matrix
during loading. Real-time imaging can be used to give some idea of cell processes
chronologically. Besides, this additional characteristic can be enhanced with
fluorescence imaging to examine signalling in a cartilage matrix that contributes to
cartilage survival, and to scrutinize the interaction of organelles intracellularly (or
perhaps intercellularly). Besides, matrix metalloproteinases (MMPs) should be assessed
to confirm that these catabolic enzymes are not inhibiting metabolism process of
articular cartilage while being exposed to biaxial compression.
Page 139
120
References
Abbot, A., Levine, W., & Mow, V. (2003). Biomechanics of The Articular Cartilage
and Menisci of the Adult Knee. In J. Callaghan (Ed.), The Adult Knee (Vol.
Volume 1, pp. 81-91). Philadelphia, PA: Lippincott Williams & Wilkins.
Agrawal, C. M., & Ray, R. B. (2001). Biodegradable polymeric scaffolds for
musculoskeletal tissue engineering. Journal of Biomedical Materials Research,
55(2), 141-150.
Akanji, O. O., Lee, D. A., & Bader, D. A. (2008). The effects of direct current
stimulation on isolated chondrocytes seeded in 3D agarose constructs.
Biorheology, 45(3), 229-243.
Alberts, B., Bray, D., Johnson, A., Julian, L., Raff, M., Roberts, K., & Walter, P.
(1998). Essential Cell Biology. Union Square West, New York: Garland
Publishing, Inc.
Alberts, B., Johnson, A., & Lewis, J. (2002). Molecular Biology of the Cell. New York:
Garland.
Athanasiou, K. A., Darling, E. M., & Hu, J. C. (2009). Articular Cartilage Tissue
Engineering. Synthesis Lectures on Tissue Engineering, 1(1), 1-182.
Bader, D., & Lee, D. (2000). Structure - Properties of Soft Tissues Articular Cartilage.
In M. Elices (Ed.), Structural Biological Materials - Design and Structure
Property Relationships (pp. 73-100). Oxford: Elsevier Science Ltd.
Baicu, S., & Taylor, M. (2002). Acid-base buffering in organ preservation solutions as a
function of temperature: new parameters for comparing buffer capacity and
efficiency. Cryobiology, 45, 33-48.
Barbero, A., & Martin, I. (2007). Human articular chondrocyte culture. In H. Hauser
(Ed.), Tissue Engineering (pp. 237-247). New Jersey: Humana Press.
Benya, P. D., & Shaffer, J. D. (1982). Dedifferentiated chondrocytes reexpress the
differentiated collagen phenotype when cultured in agarose gels. Cell, 30(1),
215-224.
Bhosale, A. M., & Richardson, J. B. (2008). Articular cartilage: structure, injuries and
review of management. British Medical Bulletin, 87(1), 77-95.
Bonaventure, J., Kadhom, N., Cohen-Solal, L., Ng, K. H., Bourguignon, J., Lasselin, C.,
& Freisinger, P. (1994). Reexpression of Cartilage-Specific Genes by
Dedifferentiated Human Articular Chondrocytes Cultured in Alginate Beads.
Experimental Cell Research, 212(1), 97-104.
Brittberg, M. (2008). Autologous chondrocyte implantation-technique and long term
follow-up. Injury International Journal of the Care of the Injured, 39(Supp 1),
S40-S49.
Brown, T. A. (2002). Regulation of Genome Activity Genomes (Second ed.). Oxford:
BIOS Scientific Ltd.
Bryant, S. J., Chowdhury, T. T., Lee, D. A., Bader, D. L., & Anseth, K. S. (2004).
Crosslinking Density Influences Chondrocyte Metabolism in Dynamically
Loaded Photocrosslinked Poly(ethylene glycol) Hydrogels. Annals of
Biomedical Engineering, 32(3), 407-417.
Buckwalter, J., Hunziker, E., Rosenberg, L., Coutts, R., Adams, M., & Eyre, D. (1987).
Articular Cartilage: Composition and Structure. In S. Woo & J. Buckwalter
Page 140
121
(Eds.), Injury and Repair of the Musculoskeletal Soft Tissues (pp. 405-424).
Rosemont: American Academy of Orthopaedic.
Buckwalter, J. A. (2005). Musculoskeletal Tissues and The Musculoskeletal System. In
S. L. Weinstein & J. A. Buckwalter (Eds.), Turek's Orthopaedics: Principles
and Their Applications (Fifth ed., pp. 26-31). Philadelphia, Pennsylvania:
Lippincott Williams and Wilkins.
Buckwalter, J. A., & Mankin, H. (1997a). Articular Cartilage Part 1: Tissue Design and
Chondrocyte-Matrix Interaction. Journal of Bone Joint Surgery (America), 79-
A(4), 600-611.
Buckwalter, J. A., & Mankin, H. (1997b). Articular Cartilage. Part II: Degeneration and
Osteoarthritis, Repair, Regeneration and Transplantation. Journal of Bone and
Joint Surgery. American Volume, 79-A(4), 612-632.
Bueno, E., Laevsky, G., & Barabino, G. (2007). Enhancing cell seeding of scaffolds in
tissue engineering through manipulation of hydrodynamic parameters. Journal
of biotechnology, 129, 516-531.
Buschmann, M., Gluzband, Y., Grodzinsky, A., & Hunziker, E. (1995). Mechanical
compression modulates matrix biosynthesis in chondrocyte/agarose culture.
Journal of Cell Science 108(Part 4), 1497-1508.
Buschmann, M. D., Hunziker, E. B., Kim, Y. J., & Grodzinsky, A. J. (1996). Altered
aggrecan synthesis correlates with cell and nucleus structure in statically
compressed cartilage. Journal of Cell Science, 109(2), 499-508.
Buschmann, M. D., Kim, Y.-J., Wong, M., Frank, E., Hunziker, E. B., & Grodzinsky,
A. J. (1999). Stimulation of Aggrecan Synthesis in Cartilage Explants by Cyclic
Loading Is Localized to Regions of High Interstitial Fluid Flow1. Archives of
Biochemistry and Biophysics, 366(1), 1-7.
Carver, S., & Heath, C. (1999). Semi-continuous perfusion system for delivering
intermittent physiological pressure regenerating cartilage. Tissue Eng, 5(1), 1-
11.
Chai, D. H., Arner, E. C., Griggs, D. W., & Grodzinsky, A. J. (2010). [alpha]v and
[beta]1 integrins regulate dynamic compression-induced proteoglycan synthesis
in 3D gel culture by distinct complementary pathways. Osteoarthritis and
Cartilage, 18(2), 249-256.
Chao, P.-h. G., West, A. C., & Hung, C. T. (2006). Chondrocyte intracellular calcium,
cytoskeletal organization, and gene expression responses to dynamic osmotic
loading. Am J Physiol Cell Physiol, 291(4), C718-725.
Chen, A. C., Bae, W. C., Schinagl, R. M., & Sah, R. L. (2001). Depth- and strain-
dependent mechanical and electromechanical properties of full-thickness bovine
articular cartilage in confined compression. Journal of Biomechanics, 34(1), 1-
12.
Chowdury, T., Bader, D., Shelton, J., & Lee, D. (2003). Temporal regulation of
chondrocyte metabolism in agarose constructs subjected to dynamic
compression. Archives of Biochemistry and Biophysics, 417, 105-111.
Cooper, J., Li, W., Bailey, L., Hudson, S., Lin-Gibson, S., Anseth, K., . . . Washburn, N.
(2007). Encapsulated chondrocyte response in a pulsatile flow bioreactor. Acta
Biomaterialia, 3(1), 13-21.
Cotran, R. S., Kumar, V., & Collins, T. (1999). Pathologic Basic of Disease (6 ed.).
Philadelphia: W.B. Saunders.
Page 141
122
Davisson, T., Kunig, S., Chen, A., Sah, R., & Ratcliffe, A. (2002). Static and dynamic
compression modulate matrix metabolism in tissue engineered cartilage. Journal
of Orthopaedic Research, 20(4), 842-848.
Di Cesare, P. E., Chen, F. S., Moergelin, M., Carlson, C. S., Leslie, M. P., Perris, R., &
Fang, C. (2002). Matrix-matrix interaction of cartilage oligomeric matrix protein
and fibronectin. Matrix Biology, 21(5), 461-470.
DiMicco, M., Kisiday, J., Gong, H., & Grodzinsky, A. (2007). Structure of pericellular
matrix around agarose-embedded chondrocytes. Osteoarthritis and Cartilage,
15, 1207-1216.
Doherty, M., Lanyon, P., & Ralston, S. H. (2002). Musculoskeletal Disorders. In C.
Haslett, E. Chilvers, N. Boon & N. Colledge (Eds.), Davidson's Principles and
Practice of Medicine (19 ed., pp. 965-1003). Edinburgh: Churchill Livingstone.
Enobakhare, B. O., Bader, D. L., & Lee, D. A. (1996). Quantification of Sulfated
Glycosaminoglycans in Chondrocyte/Alginate Cultures, by Use of 1,9-
Dimethylmethylene Blue. Analytical Biochemistry, 243, 189-191.
Estes, B. T., Gimble, J. M., & Guilak, F. (2004). Mechanical signals as regulators of
stem cell fate. In G. P. Schatten (Ed.), Stem Cells in Development and Disease
(pp. 97-122). San Diego: Elsevier Academic Press.
Eyre, D. (2001). Collagen of articular cartilage. Arthritis Research and Therapy, 4(1),
30-35.
Eyre, D. (2002). Articular cartilage and changes in Arthritis: Collagen of articular
cartilage. Arthritis Research and Therapy, 4(1), 30 - 35.
Fan, J., & Waldman, S. (2010). The Effect of Intermittent Static Biaxial Tensile Strains
on Tissue Engineered Cartilage. Ann Biomed Eng, 38(4), 1672-1682.
Farach-Carson, M., Wagner, R., & Kiick, K. (2006). Extracellular Matrix : Structure,
Function and Applications to Tissue Engineering. In J. Bronzino (Ed.), The
Biomedical Engineering Handbook : Tissue Engineering and Artificial Organs.
Boca Raton: CRC Press.
Farach-Carson, M., Wagner, R., & Kiick, K. (2007). Extracellular matrix: Structure,
Function and Applications to Tissue Engineering. In J. P. Fisher, A. Mikos & J.
Bronzino (Eds.), Tissue Engineering (pp. 1-15). Boca Raton: CRC Press.
Farndale, R. W., Buttle, D. J., & Barrett, A. J. (1986). Improved quantitation and
discrimination of sulphated glycosaminoglycans by use of dimethylmethylene
blue. Biochimica et Biophysica Acta, 883(2), 173-177.
Farndale, R. W., Sayers, C. A., & Barrett, A. J. (1982). A Direct Spectrophotometric
Microassay For Sulfated Glycosaminoglycans in Cartilage Cultures. Connective
Tissue Research, 9, 247-248.
Federica, B., Giancarlo, P., Francesca, G., Giuseppe, M. P., & Gabriele, D. (2004).
Biomechanical properties of human articular cartilage under compressive loads.
Biorheology, 41(3), 159-166.
Frank, E. H., Jin, M., Loening, A. M., Levenston, M. E., & Grodzinsky, A. (2000). A
versatile shear and compression apparatus for mechanical stimulation of tissue
culture explants. Journal of Biomechanics, 33, 1523-1527.
Frohlich, M., Malicev, E., Gorensek, M., Knezevic, M., & Kregar Velikonja, N. (2007).
Evaluation of rabbit auricular chondrocyte isolation and growth paramenters in
cell culture. Cell Biology International Reports, 31, 620-625.
Gartner, L., Hiatt, J., & Strum, J. (2006). Cell Biology and Histology (5 ed.).
Philadelphia: Lippincott Williams and Wilkins.
Page 142
123
Gemmiti, C., & Guldberg, R. (2006). Fluid flow increases Type-II collagen deposition
and tensile mechanical properties in bioreactor-grown tissue-engineered
cartilage. Tissue Eng, 12(3), 469-479.
Gendelman, R., Burton-Wurster, N. I., MacLeod, J. N., & Lust, G. (2003). The
cartilage-specific fibronectin isoform has a high affinity binding site for the
small proteoglycan decorin. Journal of Biological Chemistry, 278(13), 11175-
11181.
Giannoni, P., & Cancedda, R. (2006). Articular cartilage culturing for cell-based
cartilage repair: Needs and Perspectives. Cells Tissues Organs, 184, 1-15.
Goldberg, R. L., & Kolibas, L. M. (1990). An Improved Method for Determining
Proteoglycans Synthesized by Chondrocytes in Culture. Connective Tissue
Research, 24(3-4), 265-275.
Goldring, M. B., Sandell, L. J., Stephenson, M. L., & Krane, S. M. (1986). Immune
interferon supresses levels of procollagen mRNA and type II collagen synthesis
in cultured human articular and costal chondrocytes. Journal of Biological
Chemistry, 261(19), 9049-9055.
Grad, S., Lee, C. R., Gorna, K., Gogolewski, S., Wimmer, M. A., & Alini, M. (2005).
Surface Motion Upregulates Superficial Zone Protein and Hyaluronan
Production in Chondrocyte-Seeded Three-Dimensional Scaffolds. Tissue Eng,
11(1-2), 249-256.
Grad, S., Lee, C. R., Wimmer, M. A., & Alini, M. (2006). Chondrocyte gene expression
under applied surface motion. Biorheology, 43(3), 259-269.
Grodzinsky, A. J., Levenston, M. E., Jin, M., & Frank, E. H. (2000). Cartilage tissue
remodeling in response to mechanical forces. Annual Review of Biomedical
Engineering, 2(1), 691-713.
Guilak, F., Meyer, B. C., Ratcliffe, A., & Mow, V. C. (1994). The effects of matrix
compression on proteoglycan metabolism in articular cartilage explants.
Osteoarthritis and Cartilage, 2(2), 91-101.
Guilak, F., & Mow, V. C. (2000). The mechanical environment of the chondrocyte: a
biphasic finite element model of cell-matrix interactions in articular cartilage.
Journal of Biomechanics, 33(12), 1663-1673.
Guilak, F., Ratcliffe, A., & Mow, V. C. (1995). Chondrocyte deformation and local
tissue strain in articular cartilage: a confocal microscopy study. J. Orthop. Res.,
13(3), 410-421.
Hansen, U., Schunke, M., Domm, C., Ioannidis, N., Hassenpflug, J., Gehrke, T., &
Kurz, B. (2001). Combination of reduced oxygen tension and intermitten
hydrostatic pressure: a useful tool in articular cartilage tissue engineering.
Journal of Biomechanics, 34, 941-949.
Hart, J. A. L., & Miller, R. K. (2004). Articular Cartilage: Biomechanics, Injury and
Surgical Treatment of Defects. In D. Poitout (Ed.), Biomechanics and
Biomaterials in Orthopedics (pp. 229-232). London: Springer.
Hayman, D., Blumberg, T., C, S., & Athanasiou, K. (2006). The effect of isolation on
chondrocyte gene expression. Tissue Engineering, 12(9), 2573-2581.
Heiner, A. D., & Martin, J. A. (2004). Cartilage responses to a novel triaxial
mechanostimulatory culture system. J. Biomech., 37(5), 689-695.
Helfrich, M. H., & Horton, M. A. (2006). Integrins and Other Adhesion Molecules. In
M. J. Seibel, S. P. Robins & J. P. Bilezikian (Eds.), Dynamics of Bone and
Cartilage Metabolism (pp. 142-143). San Diego: Academic Press.
Page 143
124
Hern, D. L., & Hubbell, J. A. (1998). Incorporation of adhesion peptides into
nonadhesive hydrogels useful for tissue resurfacing. Journal of Biomedical
Materials Research, 39(2), 266-276.
Heywood, H. K., Sembi, P. K., Lee, D. A., & Bader, D. L. (2004). Cellular Utilization
Determines Viability and Matrix Distribution Profiles in Chondrocyte-Seeded
Alginate Constructs. Tissue Eng, 10(9-10), 1467-1479.
Hidvegi, N., Sales, K., Izadi, D., Ong, J., Kellam, P., Eastwood, D., & Butler, P. (2006).
A low temperature method of isolating normal human articular chondrocytes.
Osteoarthritis and Cartilage, 14, 89-93.
Hoemann, C. (2004). Molecular and Biochemical Assays of Cartilage Components. In
D. F. Ceuninck, M. Sabatini & P. Pastoureau (Eds.), Methods in Molecular
Medicine: Cartilage and Osteoarthritis (Vol. Volume 2: Structure and In Vivo
Analysis, pp. 127-152). Totowa, NJ: Humana Press Inc.
Holden, P., Meadows, R., Chapman, K., Grant, M., Kadler, K., & Briggs, M. (2001).
Cartilage oligomeric matrix protain interacts with type-XI collagen, and
disruptions to these interactions identify a pathogenetic mechanism in a bone
dysplasia family. Journal of Biological Chemistry, 276, 6046-6055.
Hunter, C. J., Mouw, J. K., & Levenston, M. E. (2004). Dynamic compression of
chondrocyte-seeded fibrin gels: effects on matrix accumulation and mechanical
stiffness. Osteoarthritis and Cartilage 12(2), 117-130.
Huselstein, C., de Isla, N., Kolopp-Sarda, M. N., Kerdjoudj, H., Muller, S., & Stoltz, J.
F. (2006). Influence of mechanical stress on cell viability. Biorheology, 43(3),
371-375.
Hyun, W. K., & Chang, D. H. (2000). An Overview of Cartilage Tissue Engineering.
Yonsei Medical Journal, 41(6), 766-773.
Ikenoue, T., Trindade, M., Lee, M. S., Lin, E. Y., Schurman, D., Goodman, S., &
Smith, R. (2003). Mechanoregulation of human articular chondrocyte aggrecan
and type II collagen expression by intermittent hydrostatic pressure in vitro. J.
Orthop. Res., 21(1), 110-116.
Ingber, D. E. (2006). Cellular mechanotransduction: putting all the pieces together
again. The FASEB Journal, 20(7), 811-827.
Iozzo, R. (2000). Introductory Remarks and Overview. In R. Iozzo (Ed.),
Proteoglycans: Structure, Biology and Molecular Interactions (pp. 1). New
York: Marcel Dekker Inc.
Jennifer, H. L., John, K., & Alan, J. G. (2003). Tissue-Engineered Versus Native
Cartilage: Linkage between Cellular Mechano-Transduction and Biomechanical
Properties. In G. Bock & J. Goode (Eds.), Tissue Engineering of Cartilage and
Bone (pp. 52-69).
Jin, G., Sah, R. L., Li, Y. S., Lotz, M., Shyy, J. Y. J., & Chien, S. (2000).
Biomechanical regulation of matrix metalloproteinase-9 in cultured
chondrocytes. Journal of Orthopaedic Research, 18(6), 899-908.
Jin, M., Frank, E. H., Quinn, T. M., Hunziker, E., & Grodzinsky, A. (2001). Tissue
shear deformation stimulates proteoglycan and protein biosynthesis in bovine
cartilage explants. Archives of Biochemistry and Biophysics, 395, 41-48.
Johnson, B., & Christensen, L. (2010). Educational Research: Quantitative, Qualitative
and Mixed Approaches. Thousand Oaks, CA: SAGE Publications Inc.
Jortikka, M. O., Parkkinen, J. J., Inkinen, R. I., Kärner, J., Järveläinen, H. T.,
Nelimarkka, L. O., . . . Lammi, M. J. (2000). The Role of Microtubules in the
Page 144
125
Regulation of Proteoglycan Synthesis in Chondrocytes under Hydrostatic
Pressure. Arch. Biochem. Biophys., 374(2), 172-180.
Jurvelin, J. S., Buschmann, M. D., & Hunziker, E. B. (1997). Optical and mechanical
determination of poisson's ratio of adult bovine humeral articular cartilage.
Journal of Biomechanics, 30(3), 235-241.
Kelly, T.-A. N., Ng, K. W., Wang, C. C. B., Ateshian, G. A., & Hung, C. T. (2006).
Spatial and temporal development of chondrocyte-seeded agarose constructs in
free-swelling and dynamically loaded cultures. Journal of Biomechanics, 39(8),
1489-1497.
Kiani, C., Chen, L., Wu, Y.-J., Yee, A., & Yang, B. (2002). Structure and function of
aggrecan. Cell Research, 12(1), 19-32.
Kim, H. W., & Han, C. D. (2000). An overview of cartilage tissue engineering. Yonsei
Medical Journal, 41(6), 766-773.
Kim, Y.-J., Sah, R. L. Y., Doong, J.-Y. H., & Grodzinsky, A. J. (1988). Fluorometric
assay of DNA in cartilage explants using Hoechst 33258. Analytical
Biochemistry, 174(1), 168-176.
Kim, Y., Bonassar, L. J., & Grodzinsky, A. (1995). The role of cartilage streaming
potential, fluid flow and pressure in the stimulation of chondrocyte biosynthesis
during dynamic compression. Journal of Biomechanics, 28(9), 1055-1066.
Knight, M. M., Ghori, S. A., Lee, D. A., & Bader, D. L. (1998). Measurement of the
deformation of isolated chondrocytes in agarose subjected to cyclic
compression. Medical Engineering and Physics, 20(9), 684-688.
Knight, M. M., Toyoda, T., Lee, D. A., & Bader, D. L. (2006). Mechanical compression
and hydrostatic pressure induce reversible changes in actin cytoskeletal
organisation in chondrocytes in agarose. Journal of Biomechanics, 39(8), 1547-
1551.
Kock, L. M., Schulz, R. M., van Donkelaar, C. C., Thümmler, C. B., Bader, A., & Ito,
K. (2009). RGD-dependent integrins are mechanotransducers in dynamically
compressed tissue-engineered cartilage constructs. Journal of Biomechanics,
42(13), 2177-2182.
Korossis, S., Bolland, F., Kearny, J., Fisher, J., & Ingham, E. (2005). Bioreactors in
tissue engineering. In N. Ashammakhi, R. Reis & E. Chiellini (Eds.), Topics in
tissue engineering (Vol. 3, pp. 1-23). Finland: University of Oulu.
Langelier, E., Suetterlin, R., Hoemann, C. D., Aebi, U., & Buschmann, M. D. (2000).
The Chondrocyte Cytoskeleton in Mature Articular Cartilage: Structure and
Distribution of Actin, Tubulin, and Vimentin Filaments. J. Histochem.
Cytochem., 48(10), 1307-1320.
Langer, R., & Vacanti, J. P. (1993). Tissue Engineering. Science, 260(5110), 920-923.
Lee, C., Grad, S., Wimmer, M., & Alini, M. (2006). The Influence of Mechanical
Stimuli on Articular Cartilage Tissue Engineering. In N. Ashammakhi & R. L.
Reis (Eds.), Topics in Tissue Engineering (Vol. 2, pp. 1-32). Finland: University
of Oulu.
Lee, D., Noguchi, T., Frean, S., Lees, P., & Bader, D. (2000). The influence of
mechanical loading on isolated chondrocytes seeded in agarose constructs.
Biorheology, 37, 149-161.
Lee, D. A., Knight, M. M., F. Bolton, J., Idowu, B. D., Kayser, M. V., & Bader, D. L.
(2000). Chondrocyte deformation within compressed agarose constructs at the
cellular and sub-cellular levels. J Biomech 33(1), 81-95.
Page 145
126
Lee, M. S., Trindade, M. C. D., Ikenoue, T., Schurman, D. J., Goodman, S. B., &
Smith, R. L. (2002). Effects of shear stress on nitric oxide and matrix protein
gene expression in human osteoarthritic chondrocytes in vitro. J Orthop Res,
20(3), 556-561.
Lindahl, A., Brittberg, M., & Peterson, L. (2003). Cartilage Repair with Chondrocytes:
Clinical and Cellular Aspects. In G. Bock & J. Goode (Eds.), Tissue
Engineering of Cartilage and Bone (pp. 175-184). West Sussex: John Wiley &
Sons Ltd.
Lodish, H., Berk, A., Baltimore, D., Zipursky, S. L., Matsudaira, P., & Darnell, J.
(2000). Integrating Cells into Tissues Molecular Cell Biology. San Francisco:
W.H.Freeman and Co.
Lohmander, S. (2003). Tissue Engineering of Cartilage: Do we need it, can we do it, is
it good and can we prove it? Tissue Engineering of Cartilage and Bone (1 ed.,
pp. 2-9). West Sussex: John Wiley & Sons Ltd.
Loret, B., & Simões, F. M. F. (2007). Articular cartilage with intra- and extrafibrillar
waters - mass transfer and generalized diffusion. European Journal of
Mechanics - A/Solids, 26(5), 759-788.
Lucchinetti, E., Bhargava, M., & Torzilli, P. (2004). The effect of mechanical load on
integrin subunits a5 and ß1 in chondrocytes from mature and immature cartilage
explants. Cell and Tissue Research, 315(3), 385-391.
Macdonald, A. G. (2002). Ion channels under high pressure. Comparative Biochemistry
and Physiology 131(3), 587-593.
Mankin, H., Mow, V., Buckwalter, J., Lannotti, J., & Ratcliffe, A. (1994). Form and
Function of Articular Cartilage. In S. Simon (Ed.), Orthopaedic Basic Science
(pp. 3-44). Iowa City: American Academy of Orthopaedic Surgeons.
Mansour, J. M. (2003). Biomechanics of Cartialge. In C. A. Oatis (Ed.), Kinesiology:
The Mechanics and Pathomechanics of Human Movement (pp. 66-79).
Philadelphia: Lippincott Williams and Wilkins.
Martin, I., Shastri, V. P., Padera, R. F., Yang, J., Mackay, A. J., Langer, R., . . . Freed,
L. E. (2001). Selective differentiation of mammalian bone marrow stromal cells
cultured on three-dimensional polymer foams. Journal of Biomedical Materials
Research, 55(2), 229-235.
Martin, I., Wendt, D., & Heberer, M. (2004). The role of bioreactors in tissue
engineering. Trends in Biotechnology, 22(2), 80-86.
Massachusetts Institute of Technology, M. (2006). Math Model Could Aid Study of
Collagen Ailments. ScienceDaily Retrieved Jan 22, 2010, 2010, from
http://www.sciencedaily.com/releases/2006/11/061114190020.htm
Mauck, R., Soltz, M., Wang, C., Wong, D., Chao, P.-H., Valhmu, W., . . . Gerard, A.
(2000). Functional Tissue Engineering of Articular Cartilage Through Dynamic
Loading of Chondrocyte-Seeded Agarose. Journal of Biomechanical
Engineering, 122(3), 252-260.
Mauck, R., Wang, C., Oswald, E., Atheshian, G., & Hung, C. (2003). The role of cell
seeding density and nutrient supply for articular cartilage tissue engineering with
deformational loading. Osteoarthritis Cartilage, 11, 879-890.
Mauck, R. L., Seyhan, S. L., Ateshian, G. A., & Hung, C. T. (2002). Influence of
Seeding Density and Dynamic Deformational Loading on the Developing
Structure/Function Relationships of Chondrocyte-Seeded Agarose Hydrogels.
Annals of Biomedical Engineering, 30(8), 1046-1056.
Page 146
127
McGowan, K. B., Kurtis, M. S., Lottman, L. M., Watson, D., & Sah, R. L. (2002).
Bioechemical quantification of DNA in Human Articular and Septal Cartilage
using PicoGreen and Hoechst 33258. Osteoarthritis and Cartilage, 10, 580-587.
McMahon, L., Reid, A., Campbell, V., & Prendergast, P. (2008). Regulatory Effects of
Mechanical Strain on the Chondrogenic Differentiation of MSCs in a Collagen-
GAG Scaffold: Experimental and Computational Analysis. Annals of
Biomedical Engineering, 36(2), 185-194.
Meyer, U. (2009). The History of Tissue Engineering and Regenerative Medicine in
Perspective. In U. Meyer, J. Handschel, T. Meyer & H. P. Wiesmann (Eds.),
Fundamentals of Tissue Engineering and Regenerative Medicine (pp. 5-10).
Berlin Heidelberg: Springer-Verlag.
Michels, C. (2002). Genetic Techniques for Biological Research: A Case Study
Approach. West Sussex: John Wiley & Sones, Ltd.
Millward-Sadler, S. J., & Salter, D. M. (2004). Integrin-Dependent Signal Cascades in
Chondrocyte Mechanotransduction. Annals of Biomedical Engineering, 32(3),
435-446.
Millward-Sadler, S. J., Wright, M. O., Davies, L. W., Nuki, G., & Salter, D. M. (2000).
Mechanotransduction via integrins and interleukin-4 results in altered aggrecan
and matrix metalloproteinase 3 gene expression in normal, but not osteoarthritic,
human articular chondrocytes. Arthritis Rheum 43(9), 2091-2099.
Minuth, W. W., Strehl, R., & Schumacher, K. (2005). Tissue Engineering. Weinheim:
Wiley-VCH Verlag GnBH & Co.
Mobasheri, A., Barret-Jolley, R., Carter, S. D., Martin-Vasallo, P., Schulze-Tanzil, G.,
& Shakibaei, M. (2005). Functional Roles of Mechanosensitive Ion Channels,
ß1 Integrins and Kinase Cascades. In A. Kamkin & I. Kiseleva (Eds.),
Chondrocyte Mechanotransduction, Mechanosensitivity in Cells and Tissues.
Moscow: Academia Publishing House Ltd.
Mobasheri, A., Lewis, R., Maxwell, J. E. J., Hill, C., Womack, M., & Barrett-Jolley, R.
(2010). Characterization of a stretch-activated potassium channel in
chondrocytes. Journal of Cellular Physiology, 223(2), 511-518.
Morse, A. (2009). Services for People with Rheumatoid Arthritis (H. o. Commons,
Trans.) (pp. 14). London: Naitonal Audit Office.
Mouw, J. K., Case, N. D., Guldberg, R. E., Plaas, A. H. K., & Levenston, M. E. (2005).
Variations in matrix composition and GAG fine structure among scaffolds for
cartilage tissue engineering. Osteoarthritis and Cartilage, 13(9), 828-836.
Mouw, J. K., Imler, S. M., & Levenston, M. E. (2007). Ion-channel regulation of
chondrocyte matrix synthesis in 3D culture under static and dynamic
compression. Biomechanics and Modeling in Mechanobiology, 6(1-2), 33-41.
Mow, V., Fithian, D., & M, K. (1990). Fundamentals of Articular Cartilage and
Meniscus Biomechanics. In J. Ewing (Ed.), Articular Cartilage and Knee Joint
Function: Basic Science and Arthroscopy. New York: Raven Press Ltd.
Mülhardt, C. (2007). Fundamental Methods Molecular biology and genomics (pp. 25).
Burlington, MA: Academic Press.
Muir, H. (1995). The chondrocyte, architect of cartilage. Biomechanics, structure,
function and molecular biology of cartilage matrix macromolecules. Bioessays,
17(12), 1039-1048.
Naumann, A., Dennis, J., Aigner, J., Coticchia, J., Arnold, J., Berghaus, A., . . . Caplan,
A. (2004). Tissue Engineering of Autologous Cartilage Grafts in Three-
Page 147
128
Dimenstional in Vitro Macroaggreagate Culture System. Tissue Engineering,
10(11-12), 1695-1706.
Nguyen, B. V., Wang, Q. G., Kuiper, N. J., El Haj, A. J., Thomas, C. R., & Zhang, Z.
(2010). Biomechanical properties of single chondrocytes and chondrons
determined by micromanipulation and finite-element modelling. Journal of The
Royal Society Interface, 7(53), 1723-1733.
Oswald, E., Chao, P.-H., Bulinski, J., Ateshian, G., & Hung, C. (2008). Dependence of
Zonal Chondrocyte Water Transport Properties on Osmotic Environment.
Cellular and Molecular Bioengineering, 1(4), 339-348.
Parry, V. (2005, May 21, 2005). Lend me your ear, The Sunday Times. Retrieved from
http://www.timesonline.co.uk/tol/news/uk/health/article524291.ece
Paulsson, M., Morgelin, M., Wiedermann, H., Beardmore-Gray, M., Dunham, D.,
Heinegard, D., . . . Engel, J. (1987). Extended and globular protein domains in
cartilage proteoglycans. Biochemistry Journal, 245(3), 763-772.
Pingguan-Murphy, B., El-Azzeh, M., Bader, D. L., & Knight, M. M. (2006). Cyclic
compression of chondrocytes modulates a purinergic calcium signalling pathway
in a strain rate- and frequency-dependent manner. J Cell Physiol 209(2), 389-
397.
Pingguan-Murphy, B., Lee, D., Bader, D., & Knight, M. (2005). Activation of
chondrocytes calcium signalling by dynamic compression is dependent of
number of cycles. Archives of Biochemistry and Biophysics, 444(1), 45-51.
Pitha, J. (1978). Reagents Specific for Cell Surface Components. European Journal of
Biochemistry, 82(1), 285-292.
Porth, C. (2007). Structure and Function of Skeletal Systems Essentials of
pathophysiology: Concepts of altered health states (pp. 970). Philadelphia:
Lippincott Williams & Wilkins.
Quinn, T. M., Schmid, P., Hunziker, E. B., & Grodzinsky, A. J. (2002). Proteoglycan
deposition around chondrocytes in agarose culture: Construction of a physical
and biological interface for mechanotransduction in cartilage. Biorheology,
39(1), 27-37.
Ringe, J., & Sittinger, M. (2009). Tissue engineering in the rheumatic diseases. Arthritis
Research and Therapy, 11(1).
Roberts, S. R., Knight, M. M., Lee, D. A., & Bader, D. L. (2001). Mechanical
compression influences intracellular Ca2+ signaling in chondrocytes seeded in
agarose constructs. Journal of Applied Physiology, 90(4), 1385-1391.
Robling, A. G., Hinant, F. M., Burr, D. B., & Turner, C. H. (2002). Improved Bone
Structure and Strength After Long-Term Mechanical Loading Is Greatest if
Loading Is Separated Into Short Bouts. Journal of Bone and Mineral Research,
17(8), 1545-1554.
Rowley, J. A., & Mooney, D. J. (2002). Alginate type and RGD density control
myoblast phenotype. Journal of Biomedical Materials Research, 60(2), 217-223.
Rubin, A. (2009). Statistics for Evidence-Based Practice and Evaluation. Belmont, CA:
Brooks/Cole.
Saadeh, P. B., Brent, B., Mehrara, B. J., Steinbrech, D. S., Ting, V., Gittes, G. K., &
Longaker, M. T. (1999). Human cartilage engineering: chondrocyte extraction,
proliferation and characterization for construct development. Annals of Plastic
Surgery, 42(5), 509-513.
Page 148
129
Sabatini, M., Pastoureau, P., Ceuninck, F., Thirion, S., & Berenbaum, F. (2004).
Culture and Phenotyping of Chondrocytes in Primary Culture. In J. M. Walker
(Ed.), Cartilage and Osteoarthritis (Vol. 100, pp. 1-14): Humana Press.
Sah, R., Kim, Y., Doong, J., Grodzinsky, A., Plaas, A., & Sandy, J. (1989). Biosynthetic
response of cartilage explants to dynamic compression. J. Orthop. Res., 7, 619-
636.
Salter, D. M., & Lee, H.-S. (2010). Mechanical Signalling in Osteoarticular Tissues.
Journal of Medical Science, 30(4), 141-147.
Saris, D. B. F., Mukherjee, N., Berglund, L. J., Schultz, F. M., An, K.-N., & O'Driscoll,
S. W. (2000). Dynamic Pressure Transmission Through Agarose Gels. Tissue
Eng, 6(5), 531-537.
Scheffler, I. (1999). Mitochondria. New York: John Wiley & Sons, Inc.
Schuler, H., Karlsson, R., Schutt, C., & Lindberg, U. (2006). The Connection Between
Actin ATPase and Polymerization. In S. Khurana (Ed.), Aspects of the
Cytoskeleton (Vol. 37, pp. 49-50). San Diego: Elsevier.
Schulz, R., & Bader, A. (2007). Cartilage tissue engineering and bioreactor systems for
the cultivation and stimulation of chondrocytes. European Biophysics Journal,
36, 539-568.
Schulz, R. M., Wustneck, N., Donkelaar, C. C. v., Shelton, J. C., & Bader, A. (2008).
Development and validation of a novel bioreactor system for load- and
perfusion-controlled tissue engineering of chondrocyte-construct. Biotechnology
and Bioengineering, 101(4), 714-728.
Seidel, J. O., Pei, M., Gray, M. L., Langer, R., Freed, L. E., & Vunjak-Novakovic, G.
(2004). Long-term culture of tissue engineered cartilage in a perfused chamber
with mechanical stimulation. Biorheology, 41(3), 445-458.
Sharma, G., Saxena, R. K., & Mishra, P. (2007). Differential effects of cyclic and static
pressure on biochemical and morphological properties of chondrocytes from
articular cartilage. Clinical Biomechanics, 22(2), 248-255.
Shelton, J. C., Bader, D. L., & Lee, D. A. (2003). Mechanical conditioning influences
the metabolic response of cell-seeded constructs. Cells, Tissues, Organs, 175(3),
140-150.
Shindle, M. K., Li, F. F., Kelly, B. T., & Potter, H. G. (2010). Articular Cartilage. In A.
J. Khanna (Ed.), MRI for Orthopaedic Surgeons (pp. 353). New York: Thieme
Publisher.
Shiu, Y.-T. (2007). Mechanical forces on cells. In J. P. Fisher, A. Mikos & J. Bronzino
(Eds.), Tissue Engineering (pp. 1-15). Boca Raton: CRC Press.
Sims, C. D., Butler, P. E., Casanova, R., Lee, B. T., Randolph, M. A., Lee, W. P., . . .
Yaremchuk, M. J. (1996). Injectable cartilage using polyethylene oxide polymer
substrates. Plastic and Reconstructive Surgery, 98, 843 - 850.
Smith, R., Lin, J., Trindade, M., Shida, J., Kajiyama, G., Vu, T., . . . Carter, D. (2000).
Time-dependent effects of intermittent hydrostatic pressure on articular
chondrocyte type II collagen and aggrecan mRNA expression. Journal of
Rehabilitation Research and Development, 37(2), 153-161.
Smith, R., Trindade, M., Ikenoue, T., Mohtai, M., Das, P., Carter, D., . . . Schurman, D.
(2000). Effects of shear stress on articular cartilage metabolism. Biorheology,
37, 95-107.
Smith, R. L., Donlon, B. S., Gupta, M. K., Mohtai, M., Das, P., Carter, D. R., . . .
Schurman, D. J. (1995). Effects of fluid-induced shear on articular chondrocyte
Page 149
130
morphology and metabolism in vitro. Journal of Orthopaedic Research, 13(6),
824-831.
Stockwell, R. (1979). Biology of Cartilage Cells. In R. Harrisson & R. McMinn (Eds.),
Biological Structure and Function (Vol. 7, pp. 101-102). Cambridge:
Cambridge University Press.
Stoddart, M. J., Ettinger, L., & Häuselmann, H. J. (2006). Enhanced matrix synthesis in
de novo, scaffold free cartilage-like tissue subjected to compression and shear.
Biotechnology and Bioengineering, 95(6), 1043-1051.
Szafranski, J. D., Grodzinsky, A. J., Burger, E., Gaschen, V., Hung, H.-H., & Hunziker,
E. B. (2004). Chondrocyte mechanotransduction: effects of compression on
deformation of intracellular organelles and relevance to cellular biosynthesis.
Osteoarthritis and Cartilage, 12(12), 937-946.
Temenoff, J., & Mikos, A. (2000). Review: tissue engineering for regeneration of
articular cartilage. Biomaterials, 21, 431-440.
Teng, M.-k., Usman, N., Frederick, C. A., & Wang, A. H. J. (1988). The molecular
structure of the complex of Hoechst 33258 and the DNA dodecamer
d(CGCGAATTCGCG). Nucleic Acids Research, 16(6), 2671-2690.
Thonney, M. (2005). Body Composition: Breed and Species. In W. Pond & A. Bell
(Eds.), Encyclopedia of Animal Science (pp. 155-160). New York: Marcel
Dekker.
Tuan, R., Boland, G., & Tuli, R. (2003). Adult mesenchymal stem cells and cell-based
tissue engineering. Arthritis Research and Therapy, 5, 32 - 45.
Tuli, R., Li, W.-J., & Tuan, R. (2003). Current state of cartilage tissue engineering.
Arthritis Research and Therapy, 5(5), 235 - 238.
Tuli, R., Seghatoleslami, M. R., Tuli, S., Wang, M. L., Hozack, W. J., Manner, P. A., . .
. Tuan, R. S. (2003). A simple, high-yield method for obtaining multipotential
mesenchymal progenitor cells from trabecular bone. Molecular Biotechnology,
23, 37 - 49.
Urban, J. (1994). The chondrocyte: A cell under pressure. Br J Rheumatol 33, 901-908.
Urban, J. (2000). Present perspectives on cartilage and chondrocyte mechanobiology.
Biorheology, 37, 185-190.
Urban, M. R., Fermor, B., Lee, R. B., & Urban, J. P. G. (1998). Measurement of DNA
in Intervertebral Disc and Other Autofluorescent Cartilages Using the Dye
Hoechst 33258. Analytical Biochemistry, 262(1), 85-88.
van Osch, G., van der Veen, S., & Verwoerd-Verhoef, H. (2001). In vitro
redifferentiation of culture-expanded rabbit and human auricular chondrocytes
for cartilage reconstruction. Plastic and Reconstructive Surgery, 107(2), 433-
440.
Villanueva, I., Gladem, S. K., Kessler, J., & Bryant, S. J. (2009). Dynamic loading
stimulates chondrocyte biosynthesis when encapsulated in charged hydrogels
prepared from poly(ethylene glycol) and chondroitin sulfate. Matrix Biology,
29(1), 51-62.
Waldman, S. D., Couto, D. C., Grynpas, M. D., Pilliar, R. M., & Kandel, R. A. (2007).
Multi-axial Mechanical Stimulation of Tissue Engineered Cartilage. European
Cells and Materials, 13, 66-75.
Waldman, S. D., Spiteri, C. G., Grynpas, M. D., Pilliar, R. M., & Kandel, R. A. (2003).
Long-term intermittent shear deformation improves the quality of cartilaginous
tissue formed in vitro. Journal of Orthopaedic Research, 21(4), 590-596.
Page 150
131
Waldman, S. D., Spiteri, C. G., Grynpas, M. D., Pilliar, R. M., & Kandel, R. A. (2004).
Long-Term Intermittent Compressive Stimulation Improves the Composition
and Mechanical Properties of Tissue-Engineered Cartilage. Tissue Engineering,
10(9-10), 1323-1331.
Wang, J. H. C., & Thampatty, B. P. (2006). An introductory review of cell
mechanobiology. Biomechanics and Modeling in Mechanobiology, 5, 1-16.
Wilkins, R. J., Browning, J. A., & Urban, J. P. G. (2000). Chondrocyte regulation by
mechanical load. Biorheology, 37(1), 67-74.
Wimmer, M. A., Grad, S., Kaup, T., Hänni, M., Schneider, E., Gogolewski, S., &
Alini, M. (2004). Tribology Approach to the Engineering and Study of Articular
Cartilage. Tissue Eng, 10(9-10), 1436-1445.
Wolf, A., Ackermann, B., & Steinmeyer, J. (2007). Collagen synthesis of articular
cartilage explants in response to frequency of cyclic mechanical loading. Cell
and Tissue Research, 327(1), 155-166.
Wong, B. L., Bae, W. C., Chun, J., Gratz, K. R., Lotz, M., & Sah, R. L. (2008).
Biomechanics of Cartilage Articulation: Effects of Lubrication and
Degeneration on Shear Deformation. Arthritis and Rheumatism, 58(7), 2065-
2074.
Wong, M., Siegrist, M., & Cao, X. (1999). Cyclic compression of articular cartilage
explants is associated with progressive consolidation and altered expression
pattern of extracellular matrix proteins. Matrix Biology, 18(4), 391-399.
Wooley, P. H., Michele, G. J., & Radin, E. L. (2005). The Structure and Function of
Joints. In W. J. Koopman & L. W. Moreland (Eds.), Arthritis & Allied
Conditions (15 ed., pp. 150-200). Philadelphia, Pennsylvania: Lippincott
Williams and Wilkins.
Wright, M., Jobanputra, P., Bavington, C., Salter, D. M., & Nuki, G. (1996). Effects of
intermittent pressure-induced strain on the electrophysiology of cultured human
chondrocytes: evidence for the presence of stretch-activated membrane ion
channels. Clinical Science, 90(1), 61-71.
Yang, F., & Elisseeff, J. (2006). Cartilage Tissue Engineering. In J. Bronzino (Ed.), The
Biomedical Engineering Handbook: Tissue Engineering and Artificial Organs.
Boca Raton: CRC Press.
Yang, F., & Elisseeff, J. (2007). Cartilage Tissue Engineering. In J. P. Fisher, A. Mikos
& J. Bronzino (Eds.), Tissue Engineering (pp. 1-11). Boca Raton: CRC Press.
Yun, K., & Moon, H. T. (2008). Inducing Chondrogenic Differentiation in Injectable
Hydrogels Embedded with Rabbit Chondrocytes and Growth Factor for
Neocartilage Formation. Journal of Bioscience and Bioengineering, 105(2),
122-126.
Yusoff, N. (2011). Design and Development of an Advanced Bioreactor for Mechanical
Cell Conditioning. Unpublished Master's thesis, University of Malaya, Kuala
Lumpur.
Zeiter, S., der Werf, M., & Ito, K. (2009). The fate of bovine bone marrow stromal cells
in hydrogels: a comparison to nucleus pulposus cells and articular chondrocytes.
Journal of Tissue Engineering and Regenerative Medicine, 3(4), 310-320.