Characterisation of raw sewage and performance assessment of primary settling tanks at Firle Sewage Treatment Works, Harare, Zimbabwe Simon Takawira Muserere a,b,⇑ , Zvikomborero Hoko a,1 , Innocent Nhapi a,2 a Civil Engineering Department, University of Zimbabwe, MP 167, Mt Pleasant, Harare, Zimbabwe b Harare Water Department, City of Harare, 2nd Floor, Old Mutual House Corner, Sam Nujoma and Speke Avenue, Harare, Zimbabwe article info Article history: Available online 25 October 2013 Keywords: Biological Nutrient Removal Characterise Firle Sewage Treatment Works Settled sewage Treatability of sewage abstract The need for more stringent effluent discharge standards as prescribed by the Environmental Manage- ment Act 20:27 to protect the environment can be sustainably achieved with the aid of Activated Sludge Models. Thus, the researchers believe it is time to re-evaluate wastewater characteristics at Firle Sewage Treatment Works (STW) and make use of activated sludge simulators to address pollution challenges caused by the sewage plant. Therefore, this paper characterizes raw sewage and assesses settled and unsettled sewage in order to evaluate the performance of the primary treatment system and the suitabil- ity of the settled sewage for treatment by the subsequent Biological Nutrient Removal (BNR) system at Firle STW. Parameters studied included COD, BOD, TKN, TP, NH 3 , TSS, pH and Alkalinity. Composite sam- ples were collected over a 9-day campaign period (27 June to 6 July 2012), hourly grab samples over 24 hrs and composite samples on 6 March 2012 which were then analysed in the lab in accordance with Standard Methods for the Examination of Water and Wastewater to support the City of Harare 2004– 2012 lab historical records. Concentrations for unsettled sewage in mg/L were COD (527 ± 32), BOD (297 ± 83) TKN (19.0 ± 2.0), TP (18 ± 3), NH 3 (24.0 ± 12.9), TSS (219 ± 57), while pH was 7.0 ± 0 and Alka- linity 266 ± 36 mg/L. For settled sewage the corresponding values in mg/L were COD (522 ± 15), BOD (324 ± 102), TKN (21.0 ± 3.0), TP (19.0 ± 2.0), NH 3 (25.6 ± 11.2), TSS (250 ± 66), while pH was 7.0 ± 0 and Alkalinity 271 ± 17 mg/L. The plant design values for raw sewage are COD (650 mg/L), BOD (200 mg/L), TKN (40 mg/L) and TP (11 mg/L). Thus, COD and nitrogen were within the plant design range while BOD and TP were higher. Treatability of sewage in BNR systems is often inferred from the levels of critical parameters and also the ratios of TKN/COD and COD/TP. The wastewater average settled COD/ BOD, COD/TP and TKN/COD ratio were 1.7 ± 0.5, 27.1 ± 3.1 and 0.04 ± 0.01 respectively and corresponding unsettled ratios were 1.8 ± 0.5, 30.77 ± 6.8 and 0.04 ± 0 respectively. Thus, treatability by the 3-stage BNR system appears highly feasible for nitrogen and is likely to be complex for phosphorous. Fractionation of COD, TP and TN is recommended to appropriately advise further steps to optimise the plant operations. Ó 2013 The Authors. Published by Elsevier Ltd. 1. Introduction The availability of up to date information on wastewater gener- ation, treatment, and use is important for policy makers, research- ers, and practitioners, as well as public institutions, in order to develop national and local action plans aiming at safe and produc- tive use of wastewater (Sato et al., 2013). According to environmental experts, a fast growing population produces a great deal of waste around the globe, hence in order to ensure that the world is a safer and cleaner place for future generations to live in, there is an ever-increasing pressure to reduce waste and im- prove waste treatment from both a moral and legal perspective. A recent World Bank study found that for improved sanitation there are almost 90% of the population in developed countries, but only about 30% of the population in developing countries, has access to improved sanitation. As water supplies fall and stress rises in many areas, the potential resource of wastewater is being widely recognized, says the study published in 2013 by Elsevier Journal Agricultural Water Management. According to a United Na- tions (UN) study of 2013 among 48 Sub-Saharan African countries, complete information on wastewater generation, treatment, and http://dx.doi.org/10.1016/j.pce.2013.10.004 1474-7065 Ó 2013 The Authors. Published by Elsevier Ltd. ⇑ Corresponding author at: Civil Engineering Department, University of Zimbabwe, MP 167, Mt Pleasant, Harare, Zimbabwe. Mobile: +263 773142217; fax: +263 4706221. E-mail addresses: [email protected], [email protected](S.T. Muserere), [email protected](Z. Hoko), [email protected](I. Nhapi). 1 Mobile: +263 772338899. 2 Mobile: +263 772111487. Physics and Chemistry of the Earth 67–69 (2014) 226–235 Contents lists available at ScienceDirect Physics and Chemistry of the Earth journal homepage: www.elsevier.com/locate/pce Open access under CC BY-NC-ND license. Open access under CC BY-NC-ND license.
Transcript
Physics and Chemistry of the Earth 67–69 (2014) 226–235
Contents lists available at ScienceDirect
Physics and Chemistry of the Earth
journal homepage: www.elsevier .com/locate /pce
Characterisation of raw sewage and performance assessment of primarysettling tanks at Firle Sewage Treatment Works, Harare, Zimbabwe
http://dx.doi.org/10.1016/j.pce.2013.10.0041474-7065 � 2013 The Authors. Published by Elsevier Ltd.
Simon Takawira Muserere a,b,⇑, Zvikomborero Hoko a,1, Innocent Nhapi a,2
a Civil Engineering Department, University of Zimbabwe, MP 167, Mt Pleasant, Harare, Zimbabweb Harare Water Department, City of Harare, 2nd Floor, Old Mutual House Corner, Sam Nujoma and Speke Avenue, Harare, Zimbabwe
a r t i c l e i n f o
Article history:Available online 25 October 2013
Keywords:Biological Nutrient RemovalCharacteriseFirle Sewage Treatment WorksSettled sewageTreatability of sewage
a b s t r a c t
The need for more stringent effluent discharge standards as prescribed by the Environmental Manage-ment Act 20:27 to protect the environment can be sustainably achieved with the aid of Activated SludgeModels. Thus, the researchers believe it is time to re-evaluate wastewater characteristics at Firle SewageTreatment Works (STW) and make use of activated sludge simulators to address pollution challengescaused by the sewage plant. Therefore, this paper characterizes raw sewage and assesses settled andunsettled sewage in order to evaluate the performance of the primary treatment system and the suitabil-ity of the settled sewage for treatment by the subsequent Biological Nutrient Removal (BNR) system atFirle STW. Parameters studied included COD, BOD, TKN, TP, NH3, TSS, pH and Alkalinity. Composite sam-ples were collected over a 9-day campaign period (27 June to 6 July 2012), hourly grab samples over24 hrs and composite samples on 6 March 2012 which were then analysed in the lab in accordance withStandard Methods for the Examination of Water and Wastewater to support the City of Harare 2004–2012 lab historical records. Concentrations for unsettled sewage in mg/L were COD (527 ± 32), BOD(297 ± 83) TKN (19.0 ± 2.0), TP (18 ± 3), NH3 (24.0 ± 12.9), TSS (219 ± 57), while pH was 7.0 ± 0 and Alka-linity 266 ± 36 mg/L. For settled sewage the corresponding values in mg/L were COD (522 ± 15), BOD(324 ± 102), TKN (21.0 ± 3.0), TP (19.0 ± 2.0), NH3 (25.6 ± 11.2), TSS (250 ± 66), while pH was 7.0 ± 0and Alkalinity 271 ± 17 mg/L. The plant design values for raw sewage are COD (650 mg/L), BOD(200 mg/L), TKN (40 mg/L) and TP (11 mg/L). Thus, COD and nitrogen were within the plant design rangewhile BOD and TP were higher. Treatability of sewage in BNR systems is often inferred from the levels ofcritical parameters and also the ratios of TKN/COD and COD/TP. The wastewater average settled COD/BOD, COD/TP and TKN/COD ratio were 1.7 ± 0.5, 27.1 ± 3.1 and 0.04 ± 0.01 respectively and correspondingunsettled ratios were 1.8 ± 0.5, 30.77 ± 6.8 and 0.04 ± 0 respectively. Thus, treatability by the 3-stage BNRsystem appears highly feasible for nitrogen and is likely to be complex for phosphorous. Fractionation ofCOD, TP and TN is recommended to appropriately advise further steps to optimise the plant operations.
� 2013 The Authors. Published by Elsevier Ltd. Open access under CC BY-NC-ND license.
1. Introduction develop national and local action plans aiming at safe and produc-
The availability of up to date information on wastewater gener-ation, treatment, and use is important for policy makers, research-ers, and practitioners, as well as public institutions, in order to
tive use of wastewater (Sato et al., 2013). According toenvironmental experts, a fast growing population produces a greatdeal of waste around the globe, hence in order to ensure that theworld is a safer and cleaner place for future generations to livein, there is an ever-increasing pressure to reduce waste and im-prove waste treatment from both a moral and legal perspective.A recent World Bank study found that for improved sanitationthere are almost 90% of the population in developed countries,but only about 30% of the population in developing countries,has access to improved sanitation. As water supplies fall and stressrises in many areas, the potential resource of wastewater is beingwidely recognized, says the study published in 2013 by ElsevierJournal Agricultural Water Management. According to a United Na-tions (UN) study of 2013 among 48 Sub-Saharan African countries,complete information on wastewater generation, treatment, and
S.T. Muserere et al. / Physics and Chemistry of the Earth 67–69 (2014) 226–235 227
use is available from only three countries which are Senegal, Sey-chelles and South Africa. The study argues that even this informa-tion is old, as the data from Seychelles and South Africa relate to2000–2003. The countries with partial data available are 11 withthe remaining 32 countries including Zimbabwe having no dataon wastewater. The study found out that most wastewater goesuntreated in Sub-Saharan Africa, where water pollution triggersthe spread of waterborne diseases such as diarrhoea and cholera.
The characterization of wastewater in terms of quantity andquality is principally a function of the wastewater origin i.e. indus-trial or domestic. The Federal Clean Water Act defines pollutant asmeaning ‘‘dredged spoil, solid waste, incinerator residue, sewage,garbage, sewage sludge, munitions, chemical wastes, biologicalmaterials, radioactive materials, heat, wrecked or discardedequipment, rock, sand, cellar dirt, and industrial, municipal, andagricultural waste discharged into water’’. Despite this broad,all-encompassing definition, wastewater can typically be charac-terized as either domestic, industrial, or some combination of bothas suggested by Corbitt (1999). According to EnvironmentalProtection Agency the first step in addressing wastewater prob-lems is to develop a source reduction program and selecting anappropriate pre-treatment system, this can only be possible byanalysing the physical and chemical characteristics of the processwastewater stream in question. The measured levels of pollutantsare subsequently compared with the discharge regulations limitsapplicable to each area.
Environmental friendly wastewater disposal methods can bethrough surface, subsurface or dilution means, and is much de-pended on the degree of treatment. Appropriate wastewater treat-ment is necessary to prevent contamination of receiving waters tolevels which will interfere with their intended use. Intended wateruse varies from water supply, recreation, or any other requiredpurpose such as irrigation. Thus, wastewater treatment consistsof applying a series of processes to improve its quality suitablefor disposal. Usually wastewater treatment will involve collectingthe wastewater in a central isolated location, the WastewaterTreatment Plant, and then process it to acceptable standard. Gener-ally, large volumes of wastewater are involved, such that treatmentprocesses are carried out on continuously flowing wastewatersrather than batches. Wastewater treatment can then be catego-rized by the nature of the treatment process operation being usedsuch as, physical, chemical or biological.
According to previous research findings Harare’s current watermanagement challenges are caused by discharging poorly treatedwastewater into Lake Chivero, the city’s raw water source accord-ing to (Nhapi, 2004). Primarily the water and wastewater chal-lenges in Harare are a symptom of lack of adequate skills andtechnical knowhow to manage the high tech systems for waterand wastewater supply infrastructure. It is believed that FirleSTW, the largest sewage treatment plant in Harare, with a designcapacity of 144,000 m3/day and approximately 10 km upstreamof the lake is the major single polluter of Lake Chivero accordingto (Japan International Cooperation Agency, 1996). Harare WaterQuality Laboratory wastewater effluent reports of 2012 revealedthat Firle STW normally operates in the high environmental hazardrange in terms of Environmental Management Act Chapter 20:27effluent discharge standards.
Designs of wastewater plants are normally based on assump-tions derived from historical records and at design stage it is as-sumed that the wastewater treatment processes will work as perdesign. Resultantly wastewater plants are seldom optimised sincein practice wastewater characteristics change with changing tech-nology while operations normally remain static. Plant performanceassessment involves adjusting primary settling tank performance(i.e. solids removal) to correctly reflect primary effluent TSS andBOD5 concentration variations suggests Dold et al. (2011). Thus,
this study characterizes unsettled and settled sewage concentra-tions at Firle STW in order to assess the efficiency of the primarytreatment system and subsequent treatability of the settled sew-age by the 3-stage BNR system at the plant.
2. Study area description
2.1. Population and socio-economic issues
Population of Zimbabwe is approximately 12.97 million (Zim-babwe National Statistics Agency, 2012) with 16.9% leaving ingreater Harare (City of Harare, Chitungwiza, Ruwa, Norton and Ep-worth). It is reported that in 2011 only 850,000 people out of the12.97 million people were formally employed, John Robertson aneconomic analyst claims that the number of formally employedZimbabweans in 2011 equals that of 1970. Thus, it is critical to pro-vide sustainable wastewater management system for Harare, giventhe economic environment in the country.
2.2. Sewer infrastructure in Harare
The sewer network of Harare consists mainly of reinforced con-crete pipes for diameters greater than 450 mm and PVC for400 mm diameters and below, and steel pipes for river crossings.The total length of sewer network is approximately 4,500 km with75% of Harare on sewer reticulation and the rest on septic tanksaccording to Harare Sewage Master Plan report by Société Anon-yme Française d’ Etude de Gestion et d’ Entreprises (Safege)(2003) a French consortium. This scenario has not changed muchsince then because of economic decline over the past ten years.The sewage treatment plants in Harare are overloaded with totaldesign capacity of 219,500 m3/d while current inflows average287,000 m3/d. Firle STW catchment mainly comprises the wa-tershed of the Mukuvisi River to the South and South East of down-town Harare (Fig. 1).
2.3. Firle works Unit 4
The study site was Firle Unit 4 which has course and finescreens that are manually racked, with two mechanically operateddetritor grit removal system linked to a division box splitting flowto Units 1, 2, 3 and 4. A 1200 mm diameter gravity line at a slope of1 in 790 connects this division box to a central distribution box forUnit 4’s four Dortmund Primary Settling Tanks (PSTs). The PSTs arelinked by a 275 mm diameter 6 m deep reinforced concrete pipe-line gravitating raw sludge to a raw sludge pump station, whichthen pumps sludge to anaerobic digesters. Effluent from the fourPSTs gravitates through a 400 mm diameter gravity line into achannel that directs tank effluent into the fermentation basin viaa box flume equipped with a digital flow recorder. The four Dort-mund PSTs have a total surface area of 530.9 m2 and designed for45% COD reduction efficiency according to the designer StewartScott International (1984). In the settling tank the solids (sludge)and liquid (effluent) portions of the incoming raw sewage are sep-arated. The effluent overflows a circular weir and gravitates to theBNR unit (Fig. 2).
3. Materials and methods
3.1. Data collection and verification
Data was gathered from the City of Harare Laboratory recordsfor the period 2004–2012. To supplement the historical data, anal-yses were also carried out over a 9-day period from 27 June to 6July 2012. Samples were taken from a division box upstream ofPSTs (S2) and in the collection chamber downstream of PSTs (S3).
Fig. 1. Location map of Firle Sewage Treatment Works.
Fig. 2. Schematic diagram of Firle Unit 4 and sampling points: (S1. . ..S9 denotes sampling points).
228 S.T. Muserere et al. / Physics and Chemistry of the Earth 67–69 (2014) 226–235
The sampling points were selected such that sewage is completelymixed at these points.
The raw data collected from the City of Harare laboratory re-cords were processed, filtered, cleaned, and corrected before beingused. To ensure quality compliance, sampling procedures were re-examined and established. The positions where the samples were
taken were inspected to check if the samples were representativeof the processes (especially well-mixing at sampling points), if allother recommended procedures were being followed (such assample preservation and processing according to standard meth-ods), and if analyses were repeatable as suggested by Dold et al.(2011).
Table 1Typical municipal wastewater characterisation adopted from (Metcalf and Eddy Inc.,2003).
S.T. Muserere et al. / Physics and Chemistry of the Earth 67–69 (2014) 226–235 229
3.2. Selection of parameters
Common parameters used to assess the constituents found inwastewater include the following TS, TSS, TFS, TVS, VSS, ISS, FSS,TDS, VDS, FDS, NH4
+, Org N, TN, TKN, TP, NO�2 , NO�3 , Org P, pH,COD, BOD5, TOC, NO�3 , NO�2 , Temperature, Alkalinity and variousgases as suggested by Metcalf and Eddy Inc (2003). In plantmodels, influent flow rate, TKN, COD and TP concentrations areessential data according to Dold et al. (2011). Information on influ-ent ammonia, BOD, TSS and VSS is useful for supporting influentwastewater characteristic fractions and for determining influentinorganic solids which impact on sludge production (Water Envi-ronmental Research Foundation, 2003). At a minimum, daily aver-age flow and flow-weighted composite concentrations are required(Dold et al., 2011). Therefore, the following parameters were se-lected for analyses: COD, BOD5, TKN, TP, NH3, TSS, pH andalkalinity.
3.3. Sampling method
The six criteria for quality data collection were followed i.e. col-lecting representative samples, formulating the objective of the
(a) (
(c)
Fig. 3. Settled and unsettled COD for Firle Sewage Treatment Plant: (a) Hourly grab samp2012. (c) Raw sewage COD concentrations for the period 2004–2006: Firle Sewage Trea
sampling program, proper handling and preservation of samples,tracking chain of custody, sample ID procedures, field qualityassurance and proper analysis as suggested by Tjandraatmadiaet al. (2009). A one day flow weighted composite and hourly grabsampling campaign on 6 March 2012 and a 9-day flow weightedsampling campaign starting from 27 June to 6 July 2012 were car-ried out to support the historical data. To ensure quality control,split sampling was done. The split sample was thoroughly mixedbefore splitting it with one portion used as a control measure. Sam-ples were taken to the lab within an hour after taking the last sam-ple fraction and were preserved by keeping them in a freezer attemperatures below 4 �C in accordance with Standard Methodsfor the Examination of Water and Wastewater by American PublicHealth Association, American Water Works Association and WaterEnvironment Federation (APHA-AWWA-WEF, 2005). Each samplewas re-analysed to check for repeatability of results.
The samples were collected by Firle STW samplers with re-quired expertise. A calibrated beaker tied to a 2 m long steel rodwas used to collect samples at the mid-depth of each samplingpoint. The beaker was rinsed with acidified water first then threetimes with sample water before final sample collection. The sam-pling containers were filled to capacity and tightly closed.
3.4. Testing methods
To select an appropriate laboratory, initially 6 L containers wereused which were then split into three 2 L samples and send tothree different laboratories, Zimlab (a SANAS accredited privatelaboratory), Standards Association of Zimbabwe (SAZ) laboratoryand City of Harare (COH) laboratory. Results of the three laborato-ries were analysed and upon noticing missing COD and BOD resultson SAZ and COH laboratories records further enquiries revealedthis was due to broken down lab equipment. Zimlab equipmentwas fully operational and SANAS accredited hence was selectedfor further sample analyses. The researchers participated in sam-pling and analysis of the samples. Sample analyses were in accor-dance with (APHA-AWWA-WEF, 2005). COD was analysed in
b)
les on 6 March 2012 and (b) daily composite samples for the period 27 June to 6 Julytment Plant.
(a) (b)
(c)
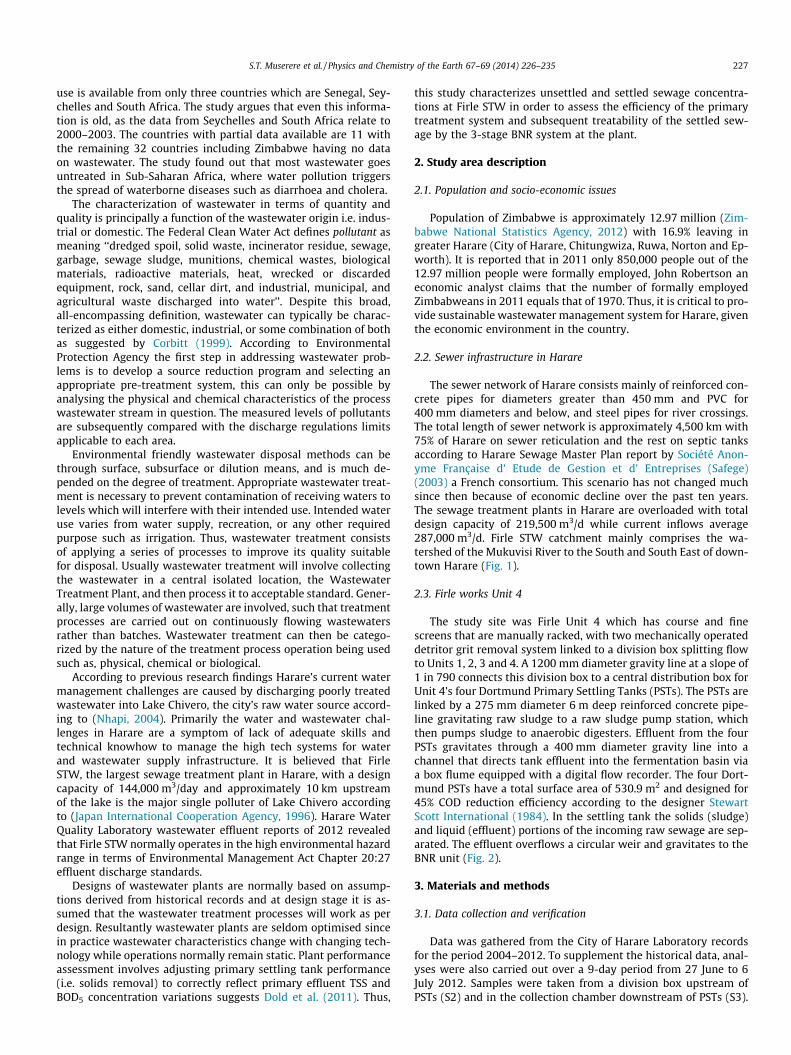
Fig. 4. Settled and unsettled BOD5 concentrations for Firle Sewage Treatment Plant: (a) Hourly grab samples on 6 March 2012 and (b) daily composite samples for the period27 June to 6 July 2012. (c) Raw sewage BOD5 concentration for the period 2004–2012: Firle Sewage Treatment Plant.
(a) (b)
(c)
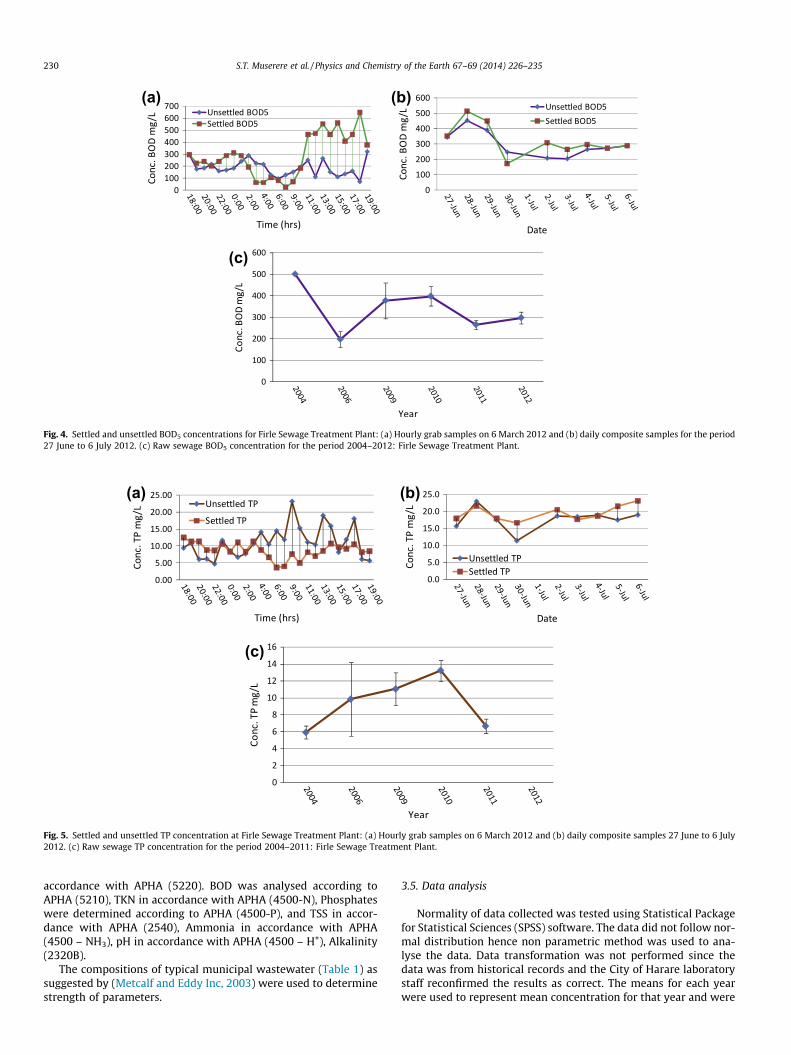
Fig. 5. Settled and unsettled TP concentration at Firle Sewage Treatment Plant: (a) Hourly grab samples on 6 March 2012 and (b) daily composite samples 27 June to 6 July2012. (c) Raw sewage TP concentration for the period 2004–2011: Firle Sewage Treatment Plant.
230 S.T. Muserere et al. / Physics and Chemistry of the Earth 67–69 (2014) 226–235
accordance with APHA (5220). BOD was analysed according toAPHA (5210), TKN in accordance with APHA (4500-N), Phosphateswere determined according to APHA (4500-P), and TSS in accor-dance with APHA (2540), Ammonia in accordance with APHA(4500 – NH3), pH in accordance with APHA (4500 – H+), Alkalinity(2320B).
The compositions of typical municipal wastewater (Table 1) assuggested by (Metcalf and Eddy Inc, 2003) were used to determinestrength of parameters.
3.5. Data analysis
Normality of data collected was tested using Statistical Packagefor Statistical Sciences (SPSS) software. The data did not follow nor-mal distribution hence non parametric method was used to ana-lyse the data. Data transformation was not performed since thedata was from historical records and the City of Harare laboratorystaff reconfirmed the results as correct. The means for each yearwere used to represent mean concentration for that year and were
(a) (b)
(c)
Fig. 6. Settled and unsettled TSS concentrations for Firle Sewage Treatment Plant: (a) hourly grab samples on 6 March 2012 and (b) daily composite samples from 27 June to 6July 2012. (c) Raw sewage TSS concentrations for the period 2004–2012: Firle Sewage Treatment Plant.
(a) (b)
(c)
Fig. 7. Settled and unsettled TA concentrations for Firle Sewage Treatment Plant: (a) Hourly grab samples on 6 March 2012 and (b) daily composite samples for the period 27June to 6 July 2012. (c) Raw sewage TA concentrations for the period 2004–2012: Firle Sewage Treatment Plant.
S.T. Muserere et al. / Physics and Chemistry of the Earth 67–69 (2014) 226–235 231
used in analysing City of Harare historical results (secondary data).However, average concentrations and standard deviations werecalculated for Zimlab analysed results (primary data). Standarddeviations were representing ±in the research results. City of Har-are has five sewage treatment plants and does not have the capac-ity to analyse samples for each plant on a daily basis. Thelaboratory has a rotational plant assessment system, hence a total
of four samples were analysed per month, giving a maximum of 48samples per year per parameter. SPSS was self adjusting hence theN-value was not necessarily the same from 1 year to the next;therefore N = 48 was maximum and N = 9 was the minimum onall the parameters analysed. Significance tests on concentrationchange with state, settled and unsettled, were performed to assessPSTs performance. Simply using the average concentrations and
Fig. 8. Settled and unsettled TKN concentrations for the period 27 June to 6 July2012: Firle Sewage Treatment Plant.
Fig. 9. Hourly grab settled and unsettled Ammonia concentration on 6 March 2012:Firle Sewage Treatment Plant.
Fig. 10. Settled and unsettled sewage pH values for the period 27 June to 6 July2012: Firle Sewage Treatment Plant.
232 S.T. Muserere et al. / Physics and Chemistry of the Earth 67–69 (2014) 226–235
standard deviation could not expose extent of concentrationchange given the unexpected low removal efficiencies of PrimarySettling Tanks.
4. Results and discussions
Concentrations were plotted against time based on 6 March2012 hourly grab sampling results (Figs. 3a–10a), concentrationsagainst date for the 27 June to 6 July 2012 flow weighted compos-ite sampling results (Figs. 3b–10b) and concentration against yearfor historical results (City of Harare laboratory records) (Figs. 3c–10c). Daily flow weighted composite sampling results for the per-
iod 27 June to 6 July 2012 were plotted against date for TKN(Fig. 8), NH3 (Fig. 9) and pH (Fig. 10). Settled and unsettled treat-ability ratios were plotted against time for hourly grab samplingresults and against date for daily composite sampling resultsrespectively (Figs. 11–13).
4.1. Wastewater characterisation
Wastewater characterisation was based on average settled andunsettled parameters concentrations (Table 2) and the concentra-tions variation over time were also analysed using graphs(Figs. 3–10).
4.1.1. COD classificationThe COD concentration at Firle STW was 527 ± 32 mg/L and
522 ± 15 mg/L for unsettled and settled sewage respectively. ThusCOD concentration was in the low range for both settled and unset-tled sewage according to Metcalf and Eddy Inc (2003) (Table 1).
The Firle STW COD concentration decreased from 2004 to2006 and then increased from 2006 to 2010 when another de-cline was experienced (Fig. 3c). This trend was also noted inBOD5 (Fig. 4c) and TSS (Fig. 6c). The changes in quantity andquality of wastewater such as the one experienced at FirleSTW is determined by many factors as suggested by (Henzeand Comeau, 2008), these include the behaviour and lifestyleof inhabitants, technical and judiciary framework by which thecommunity is surrounded. At household level and industrial pro-duction solid and liquid wastes are generated with significantpossibilities for changing the amounts and composition of thewaste streams generated. The concentration of pollutant is acombination of pollutant load and the amount of water mixedwith the pollutant, thus the daily or yearly polluting load suchas the measurements being analysed at Firle STW form a goodbasis for an evaluation of the composition of sewage as suggestby Metcalf and Eddy Inc (2003). It therefore, follows that thedaily and yearly concentrations data collected for Firle STW givesa good evaluation of its wastewater characteristics. According toHenze and Comeau (2008) composition of wastewater can varywith time on a given location partly due to variations in the dis-charged amounts of substances. The major reasons for thesevariations are water consumption and underground infiltrationduring wastewater transportation. Thus, the COD concentrationsvariations noted at Firle STW during the period under study arenormal for municipal sewers.
4.1.2. BOD5 classificationThe settled and unsettled BOD5 concentrations were 324 ± 102
and 297 ± 83 mg/L respectively. The BOD5 concentrations weretherefore, in the low to medium category according to Metcalfand Eddy Inc (2003) (Table 1).
Biochemical Oxygen Demand (BOD) is an important water pol-lutant to be studied for Firle STW Unit 4 since it employs biologicaltreatment processes. The pollutant degrade biochemically and af-fect water quality according to the location as well as the strengthof the discharge. The BOD changed from one year to the next(Fig. 4c). It becomes critical to analyse the concentration of thisparameter considering that Firle STW is located 10 km upstreamof Lake Chivero. The BOD5 concentrations measured exceeded thedesign level of 200 mg/L as recommended by Stewart Scott Inter-national (1984) the designer of the plant. Therefore, it is importantto examine carefully the concentration levels of influent and efflu-ent BOD to establish potential water quality impacts in order toregulate these discharges as suggested by Brill et al. (2010). How-ever, given the COD concentrations measured at Firle STW theBOD5 concentration may be favourable to the plant since they
(a) (b)
Fig. 11. Unsettled and settled COD/BOD ratio for Firle Sewage Treatment Plant. (a) Ratio on 6 March 2012 and (b) for period 27 June to 6 July 2012.
(a) (b)
Fig. 12. Unsettled and settled COD/TP concentrations for Firle Sewage Treatment Plant. (a) Ratio on 6 March 2012 and (b) ratio for period 27 June to 6 July 2012.
Fig. 13. Settled and unsettled TKN/COD for the period 27 June to 6 July 2012: FirleSewage Treatment Plant.
S.T. Muserere et al. / Physics and Chemistry of the Earth 67–69 (2014) 226–235 233
provide the much needed readily biodegradable COD for phospho-rous removal.
4.1.3. TP classificationUnsettled TP concentration was 18.0 ± 3 mg/L and settled TP
was 19.0 ± 2 mg/L, which was classified as medium to highstrength (Table 1). The TP concentration (Fig. 5) was generallyhigher than the design value 11 mg/L according to the design byStewart Scott International (1984).
The concentrations of TP measured at Firle STW were high com-pared to plant design assumptions of 11 mg/L. According to Henzeand Comeau (2008) most of the nutrients (phosphorous) are nor-mally soluble and cannot be removed by settling, filtration, floccu-lation and any other means of solid–liquid separation. The totalphosphorous in municipal wastewater consists of 70–90% solubleorthophosphates and 30–10% organically bound phosphorouswhich is in soluble or particulate form, a small fraction of unbiode-gradable phosphorous (Ekama and Marais, 1984). The organicallybound phosphorous is converted to orthophosphate in the acti-vated sludge and then used by bacterium (Metcalf and Eddy Inc,2003f). Given the high concentrations of TP at Firle STW and thecomplexities of TP treatment it is important to fractionate theparameter to appropriately recommend best methods to manageit. Previous researches carried out downstream of Firle STW have
recommended that TP concentrations be reduced at Harare sewagetreatment plants among other sources. In addition to pollutionchallenges, there is a range of potential health impacts arising fromwater-borne diseases and water-related disease vectors caused bypoor wastewater management upstream of a water reservoir suchas river blindness (onchocerciasis), bilharzia (schistosomiasis), andguinea worm disease (dracunculiasis) as reported by Thorntonet al. (1996). Lake Chivero is a system under extreme pressure bothas a source of water and as a means of waste removal for the city ofHarare, two diametrically opposing functions according to Mhlan-ga in a recent study on limnology of lakes and rivers.
4.1.4. TSS classificationTSS settled and unsettled concentrations were 250 ± 66 mg/L
and 219 ± 57 mg/L respectively. The TSS concentrations were cate-gorised as low strength (Table 1).
4.1.5. TA classificationTotal Alkalinity settled and unsettled concentrations were
271 ± 17 and 266 ± 36 mg/L respectively. The TA concentrationswere categorised as low strength (Table 1).
4.1.6. TKN classificationThe unsettled TKN concentration was 19 ± 2 mg/L and settled
concentration was 21 ± 3 mg/L. Thus, the TKN concentrations werein the low strength category according to Mamais et al. (1993).
The TKN concentrations measured are within design assump-tions of the plant and typical of municipal sewer with low indus-trial contribution such as Firle STW. Total nitrogen and itscomponents are important in designing the nitrification and deni-trification processes. The nitrification efficiency of an activatedsludge process decreases under cyclic loading conditions (Loosdr-echt, 2008).
4.1.7. Ammonia classificationThe unsettled Ammonia concentration was 24.0 ± 12.9 mg/L and
settled concentration was 25.6 ± 11.2 mg/L. Thus, the Ammonia
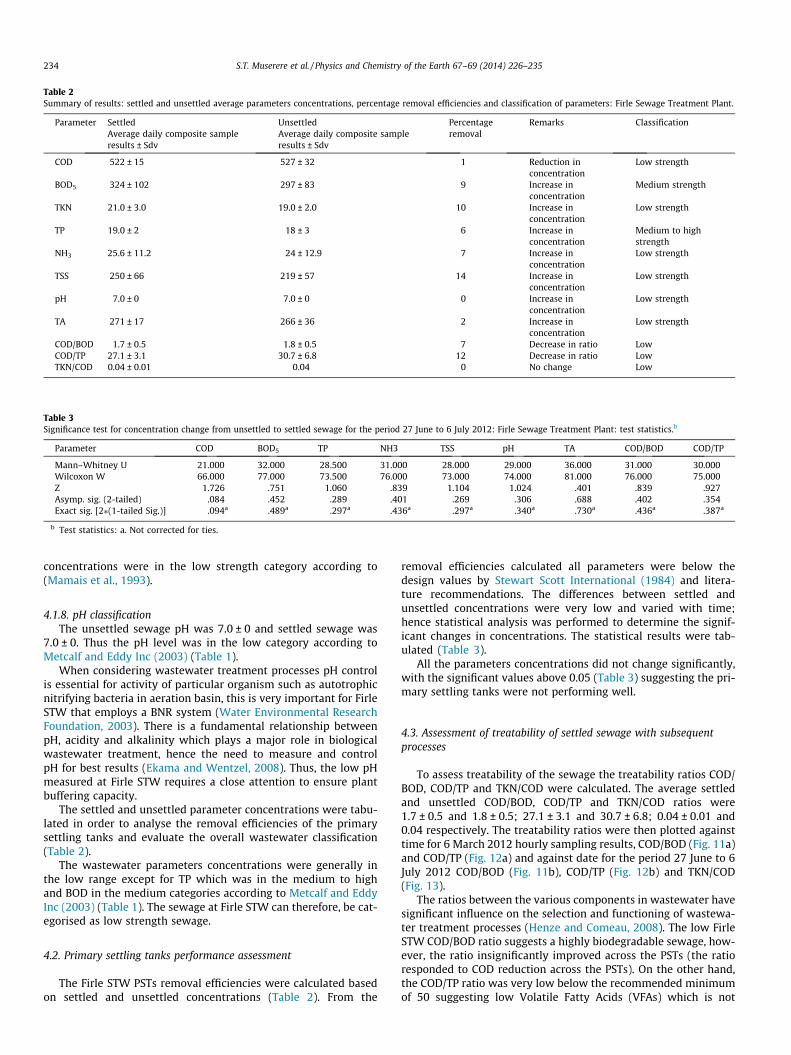
Table 2Summary of results: settled and unsettled average parameters concentrations, percentage removal efficiencies and classification of parameters: Firle Sewage Treatment Plant.
COD/BOD 1.7 ± 0.5 1.8 ± 0.5 �7 Decrease in ratio LowCOD/TP 27.1 ± 3.1 30.7 ± 6.8 �12 Decrease in ratio LowTKN/COD 0.04 ± 0.01 0.04 0 No change Low
Table 3Significance test for concentration change from unsettled to settled sewage for the period 27 June to 6 July 2012: Firle Sewage Treatment Plant: test statistics.b
Parameter COD BOD5 TP NH3 TSS pH TA COD/BOD COD/TP
234 S.T. Muserere et al. / Physics and Chemistry of the Earth 67–69 (2014) 226–235
concentrations were in the low strength category according to(Mamais et al., 1993).
4.1.8. pH classificationThe unsettled sewage pH was 7.0 ± 0 and settled sewage was
7.0 ± 0. Thus the pH level was in the low category according toMetcalf and Eddy Inc (2003) (Table 1).
When considering wastewater treatment processes pH controlis essential for activity of particular organism such as autotrophicnitrifying bacteria in aeration basin, this is very important for FirleSTW that employs a BNR system (Water Environmental ResearchFoundation, 2003). There is a fundamental relationship betweenpH, acidity and alkalinity which plays a major role in biologicalwastewater treatment, hence the need to measure and controlpH for best results (Ekama and Wentzel, 2008). Thus, the low pHmeasured at Firle STW requires a close attention to ensure plantbuffering capacity.
The settled and unsettled parameter concentrations were tabu-lated in order to analyse the removal efficiencies of the primarysettling tanks and evaluate the overall wastewater classification(Table 2).
The wastewater parameters concentrations were generally inthe low range except for TP which was in the medium to highand BOD in the medium categories according to Metcalf and EddyInc (2003) (Table 1). The sewage at Firle STW can therefore, be cat-egorised as low strength sewage.
The Firle STW PSTs removal efficiencies were calculated basedon settled and unsettled concentrations (Table 2). From the
removal efficiencies calculated all parameters were below thedesign values by Stewart Scott International (1984) and litera-ture recommendations. The differences between settled andunsettled concentrations were very low and varied with time;hence statistical analysis was performed to determine the signif-icant changes in concentrations. The statistical results were tab-ulated (Table 3).
All the parameters concentrations did not change significantly,with the significant values above 0.05 (Table 3) suggesting the pri-mary settling tanks were not performing well.
4.3. Assessment of treatability of settled sewage with subsequentprocesses
To assess treatability of the sewage the treatability ratios COD/BOD, COD/TP and TKN/COD were calculated. The average settledand unsettled COD/BOD, COD/TP and TKN/COD ratios were1.7 ± 0.5 and 1.8 ± 0.5; 27.1 ± 3.1 and 30.7 ± 6.8; 0.04 ± 0.01 and0.04 respectively. The treatability ratios were then plotted againsttime for 6 March 2012 hourly sampling results, COD/BOD (Fig. 11a)and COD/TP (Fig. 12a) and against date for the period 27 June to 6July 2012 COD/BOD (Fig. 11b), COD/TP (Fig. 12b) and TKN/COD(Fig. 13).
The ratios between the various components in wastewater havesignificant influence on the selection and functioning of wastewa-ter treatment processes (Henze and Comeau, 2008). The low FirleSTW COD/BOD ratio suggests a highly biodegradable sewage, how-ever, the ratio insignificantly improved across the PSTs (the ratioresponded to COD reduction across the PSTs). On the other hand,the COD/TP ratio was very low below the recommended minimumof 50 suggesting low Volatile Fatty Acids (VFAs) which is not
S.T. Muserere et al. / Physics and Chemistry of the Earth 67–69 (2014) 226–235 235
suitable for biological phosphorous removal as suggested by (Eka-ma and Wentzel, 2008). The COD/TP ratio decreased across PSTswhich is not favourable for biological phosphorous removal, thedecrease was a response to TP increase across the PSTs. The TKN/COD ratio was below 0.09 which is favourable for nitrogen re-moval. According to (Ekama and Wentzel, 2008) as the TKN/CODratio decreases below 0.09 the size of the anoxic reactor decreases,hence the lower the ratio the better the biological nitrogen re-moval. The denitrification potential are approximately propor-tional to the influent COD concentration. The nitrificationcapacity is approximately proportional to the influent TKN. Conse-quently the TKN/COD ratio of the influent is a good parameter interms of which to assess process nitrification–denitrificationbehaviour because it gives approximately the ratio of the nitrategenerated to the dentrification potential (Ekama and Marais,1984).
5. Conclusions
Firle STW raw sewage is generally in the low to medium rangefor most parameters it can be concluded that the sewage is rela-tively easy to treat by biological processes. The PSTs are not per-forming as per design specifications hence are not optimallyperforming. From the treatability ratios it can be concluded thattreatability of the sewage by Firle Works Unit 4 BNR is highly fea-sible for nitrogen and is likely to be complex for phosphorous.
6. Recommendations
Fractionation of COD, TP and TN is recommended to clearly de-fine characteristics of the sewage and appropriately advise furthersteps to optimise plant processes.
Acknowledgements
This paper presents part of the research results of an MPhilstudy by Simon Takawira Muserere at the University of Zimbabwe.The Department of Civil Engineering at the University of Zimbabweare acknowledged for guidance to the production of this paper. Theauthors acknowledge Harare municipality for assisting in data col-lection and for granting permission to carry out the study. Theauthors thank Mrs. E. Mukanganya of the Surveyor General Depart-ment for assisting in the drawing of the map of the location of thestudy area. Finally the authors are grateful to Zimlab a SANASaccredited laboratory, who assisted with sample analyses. Theauthors acknowledge 13th WaterNet Symposium were this paper
was presented with constructive comments from delegates assist-ing in finalising the paper.
References
APHA-AWWA-WEF, 2005. Standard Methods for the Examination of Water andWastewater twenty first edition. American Publishing Health Association,American Water Works Association and Water Environment Federation, NewYork.
Corbitt, R.A., 1999. Standard Handbook of Environmental Engineering. McGraw-HillCompanies, Inc., London.
Dold, P.L., Jones, R.M., Takacs, I., 2011. Practical guidance for WWTP modelcalibration and associated data gathering requirements. EnviroSim AssociatesLtd., Ontario.
Ekama, G.A., Marais, G.V.R., 1984. Nature of municipal wastewaters. Theory, design,and operation of nutrient removal activated sludge processes. Water ResearchCommission, Pretoria.
Ekama, G.A., Wentzel, M.C., 2008. Organic material removal. In: Hence, M., vanLoosdrecht, M.C.M., Ekama, G.A., Brdjanovic, D. (Eds.), Biological WastewaterTreatment: Principles, Design and Modelling. London, IWA Publishing, London.
Henze, M., Comeau, Y., 2008. Wastewater characterisation. In: Hence, M., vanLoosdrecht, M.C.M., Ekama, G.A., Brdjanovic, D. (Eds.), Biological WastewaterTreatment: Principles, Design and Modelling. IWA Publishing, London.
Japan International Cooperation Agency, 1996. The study on water pollution controlin the upper manyame river basin Main report. Ministry of Local Government,Rural and Urban Development of the Republic of Zimbabwe, Harare(unpublished).
Mamais, D., Jenkins, D., Pitt, P., 1993. A rapid physical–chemical method for thedetermination of readily biodegradable soluble COD in municipal wastewater.Water Research 27.
Metcalf and Eddy Inc, 2003. Metcalf and Eddy: Wastewater Engineering: Treatmentand Reuse. McGraw-Hill Companies, Inc., London.
Nhapi, I., 2004. Options for wastewater management in Harare, Zimbabwe,Dissertation Submitted in Fulfilment of the requirements of the AcademicBoard of Wageningen University and the Academic Board of the UNESCO-IHEInstitute for Water Education, Delft, The Netherlands.
Safege, 2003. Harare Sewerage Master Plan Final Report. Harare, City of Harare.Sato, T., Qadirb, M., Yamamotoe, S., Endoe, T., Zahoora, A., 2013. Global, regional,
and country level need for data on wastewater generation, treatment, and use.Agricultural Waste Management 130, 1–13.
Stewart Scott International, 1984. Firle Sewage Works Unit 4 MAS Plant Operatingand Maintenance Instructions (unpublished).
Thornton, J., Steel, A., Rast, W. 1996. Water Quality Assessments – A Guide to Use ofBiota, Sediments and Water in Environmental Monitoring, second ed., SouthAfrica.
van Loosdrecht, M.C.M., Ekama, G.A., Wentzel, M.C., Brdjanovic, D., Hoolijmans,C.M., 2008. Modelling Activated Sludge Processes. In: Henze, M., vanLoosdrecht, M.C.M., Ekama, G.A., Brdjanovic, D. (Eds.), Biological WastewaterTreatment: Principles, Modelling and Design. IWA Publishing, London.
Water Environmental Research Foundation, 2003. Methods for wastewatercharacterisation in activated sludge modelling. IWA. Water EnvironmentalFederation, New York.
Zimbabwe Statistical Agency, 2012. Preliminary Report Census 2012. HarareZimbabwe, Government of Zimbabwe.