63
Characteristics, challenges, and determinants of data quality J. Marc Overhage, MD, PhD Chief Medical Informatics Officer Siemens Health Services
Characteristics, challenges, and
determinants of data quality
J. Marc Overhage, MD, PhD
Chief Medical Informatics Officer
Siemens Health Services
Spontaneous Generation?
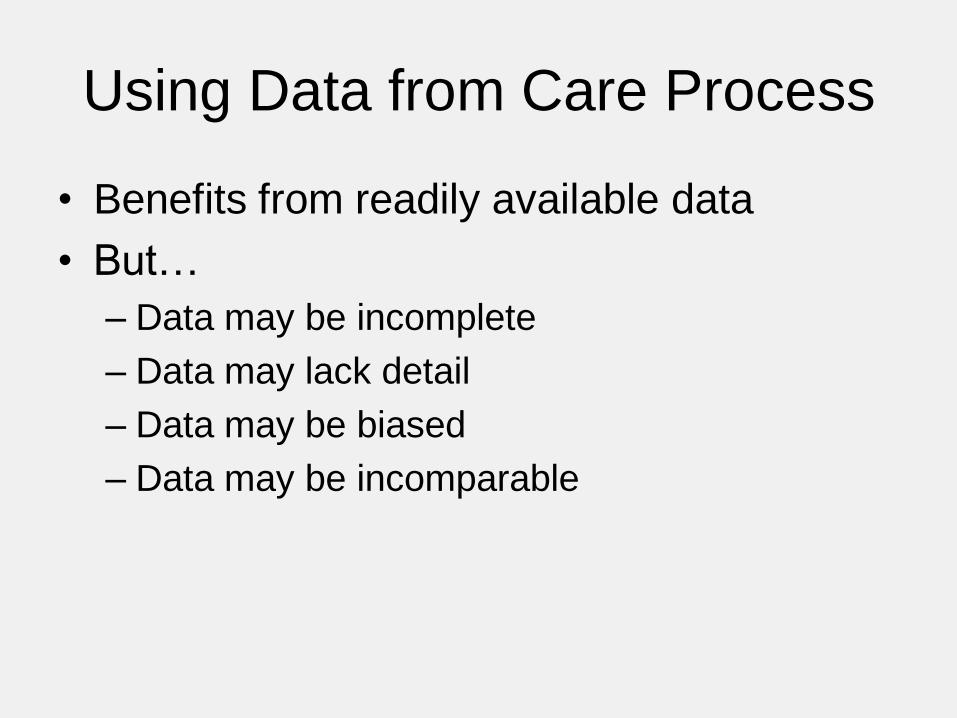
Using Data from Care Process
• Benefits from readily available data
• But…
– Data may be incomplete
– Data may lack detail
– Data may be biased
– Data may be incomparable
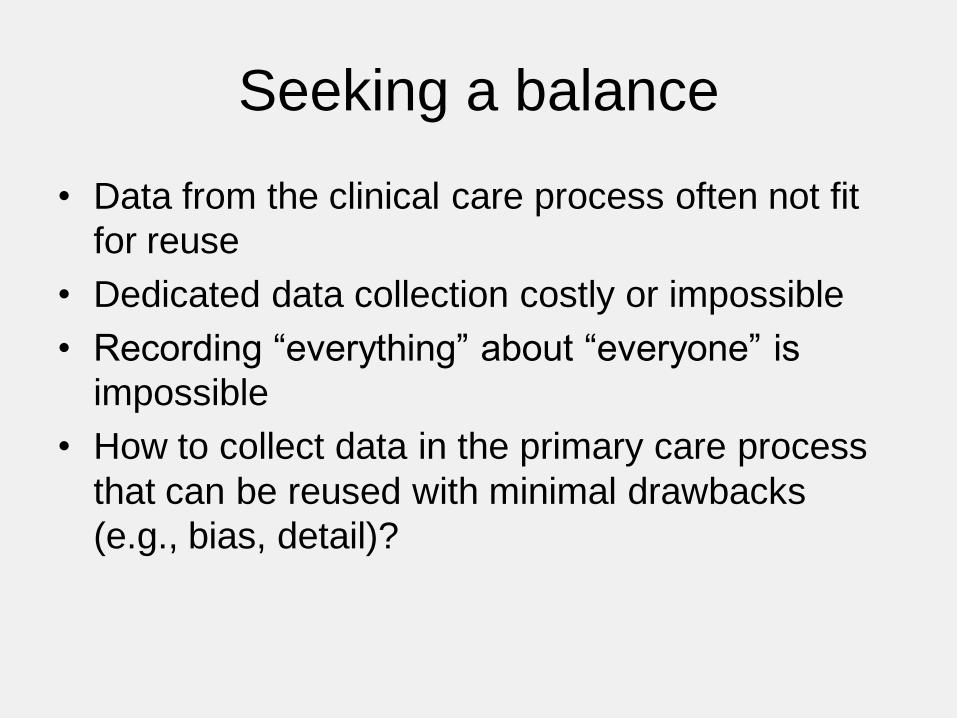
Seeking a balance
• Data from the clinical care process often not fit
for reuse
• Dedicated data collection costly or impossible
• Recording “everything” about “everyone” is
impossible
• How to collect data in the primary care process
that can be reused with minimal drawbacks
(e.g., bias, detail)?
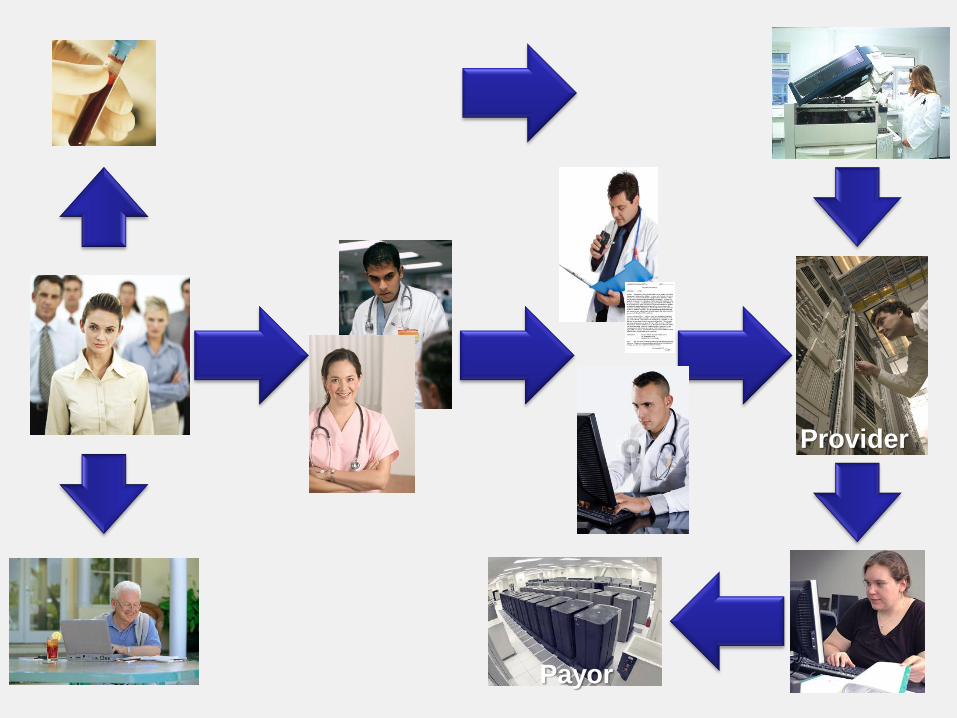
Payor
Provider
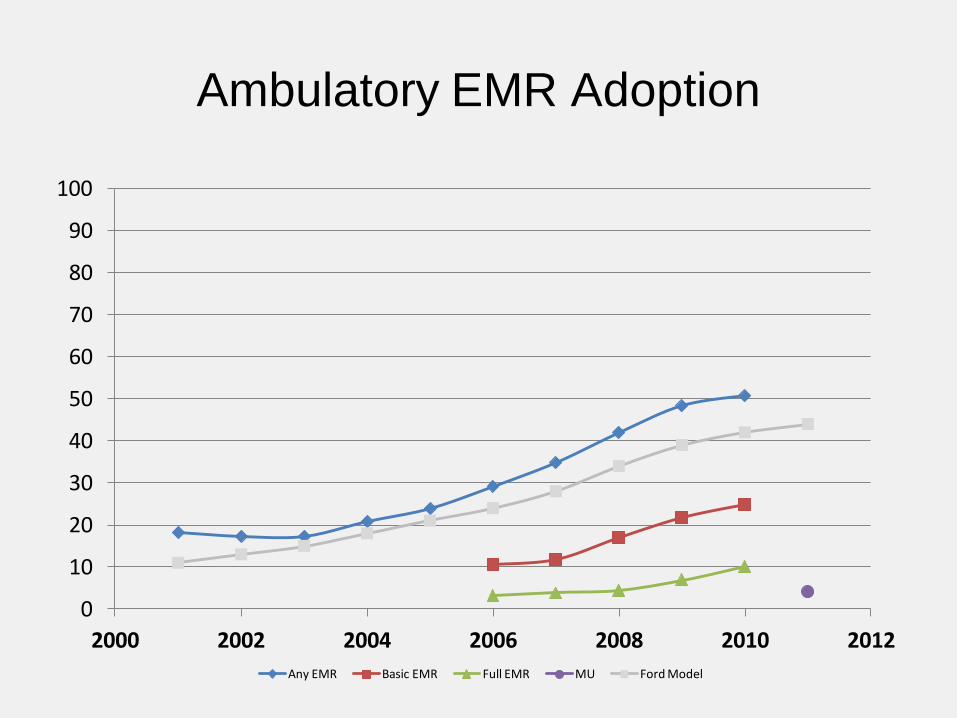
Ambulatory EMR Adoption
0
10
20
30
40
50
60
70
80
90
100
2000 2002 2004 2006 2008 2010 2012
Any EMR Basic EMR Full EMR MU Ford Model
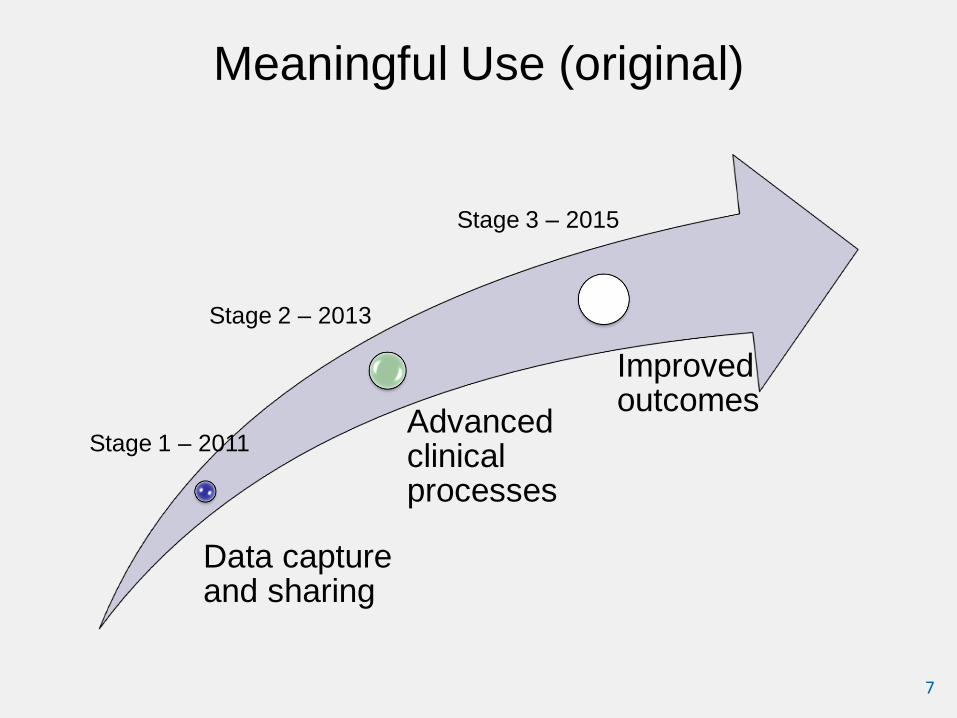
Data capture and sharing
Advanced clinical processes
Improved outcomes
Meaningful Use (original)
7
Stage 1 – 2011
Stage 2 – 2013
Stage 3 – 2015
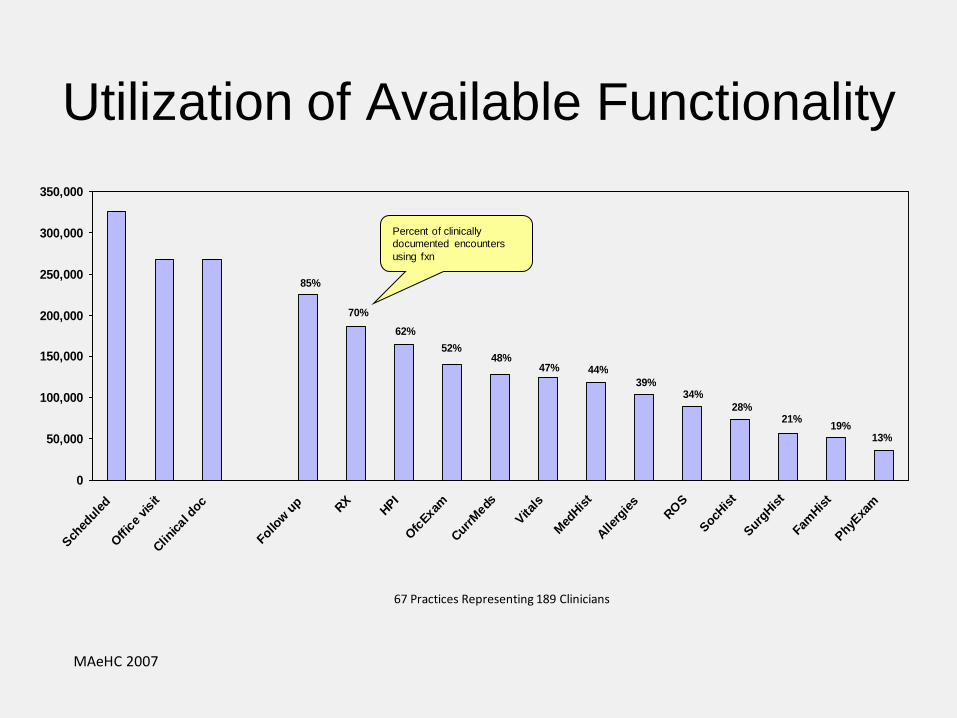
Utilization of Available Functionality
0
50,000
100,000
150,000
200,000
250,000
300,000
350,000
Sch
edule
d
Offic
e visit
Clin
ical d
oc
Follow u
p RX
HPI
Ofc
Exam
Curr
Meds
Vita
ls
Med
His
t
Alle
rgie
sRO
S
SocH
ist
Surg
His
t
FamHis
t
PhyE
xam
85%
70%
62%
52%48%
47% 44%
39%34%
28%21%
19%13%
67 Practices Representing 189 Clinicians
Percent of clinically
documented encounters
using fxn
MAeHC 2007
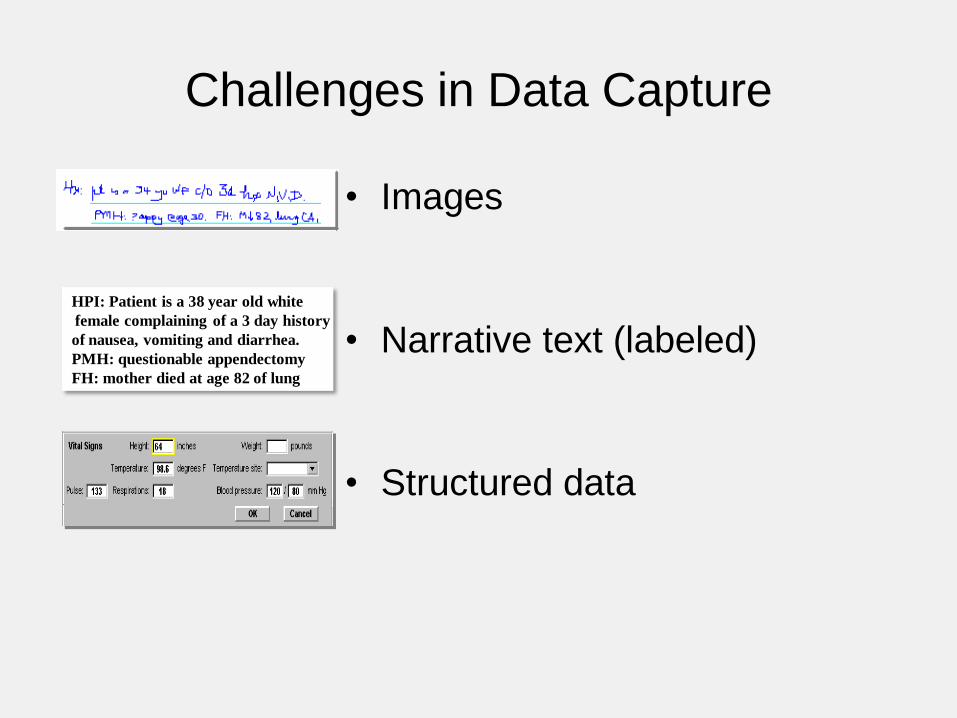
Challenges in Data Capture
• Images
• Narrative text (labeled)
• Structured data
HPI: Patient is a 38 year old white
female complaining of a 3 day history
of nausea, vomiting and diarrhea.
PMH: questionable appendectomy
FH: mother died at age 82 of lung
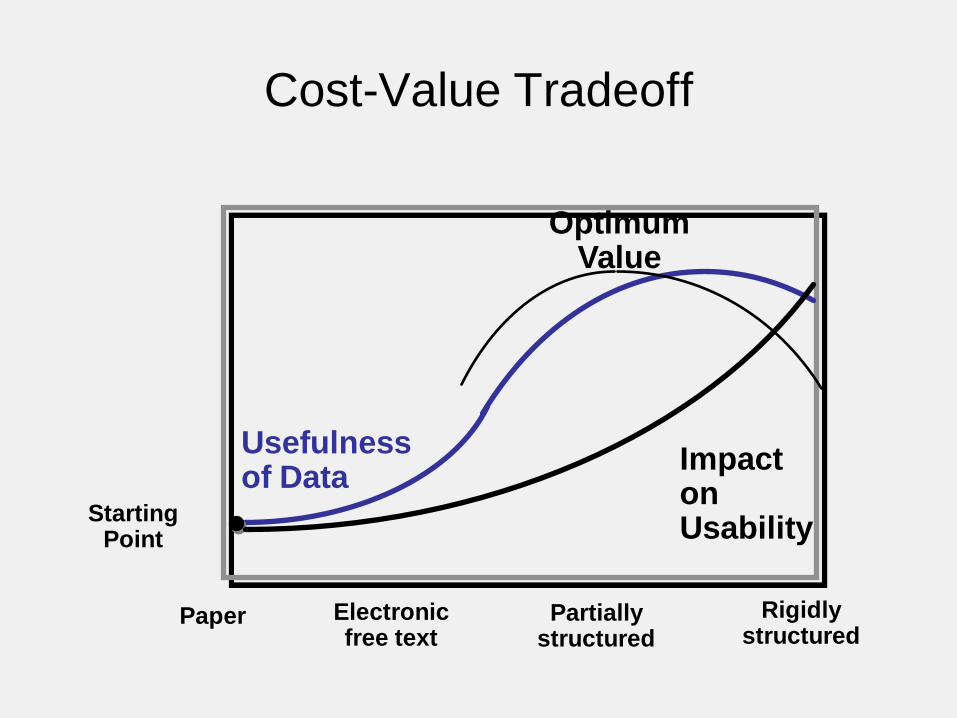
Cost-Value Tradeoff
Paper Partially structured
Rigidly structured
Usefulness of Data
Optimum Value
Electronic free text
Starting Point
Impact on Usability

12
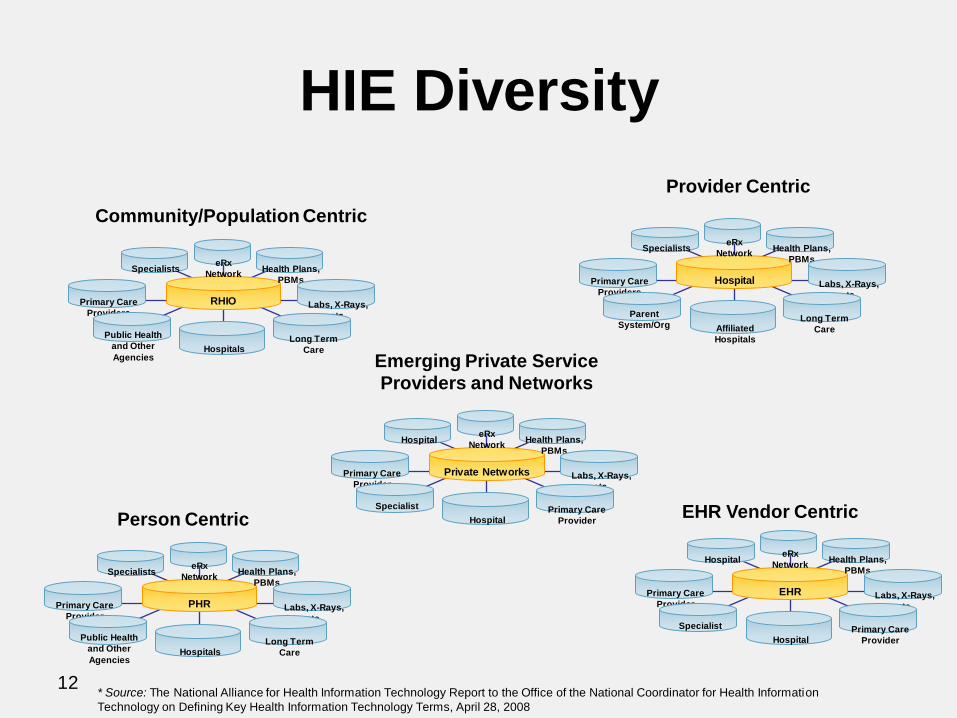
HIE Diversity
RHIO
eRx
Network Health Plans,
PBMs
Specialists
Primary Care
Providers Labs, X-Rays,
etc.
Long Term
Care Hospitals
Public Health
and Other
Agencies
Hospital
eRx
Network Health Plans,
PBMs
Specialists
Primary Care
Providers Labs, X-Rays,
etc.
Long Term
Care Affiliated
Hospitals
Parent
System/Org
Community/Population Centric
Person Centric EHR Vendor Centric
PHR
eRx
Network Health Plans,
PBMs
Specialists
Primary Care
Provider Labs, X-Rays,
etc.
Long Term
Care Hospitals
Public Health
and Other
Agencies
EHR
eRx
Network Health Plans,
PBMs
Hospital
Primary Care
Provider Labs, X-Rays,
etc.
Primary Care
Provider Hospital
Specialist
* Source: The National Alliance for Health Information Technology Report to the Office of the National Coordinator for Health Information
Technology on Defining Key Health Information Technology Terms, April 28, 2008
Provider Centric
Emerging Private Service
Providers and Networks
Private Networks
eRx
Network Health Plans,
PBMs
Hospital
Primary Care
Provider Labs, X-Rays,
etc.
Primary Care
Provider Hospital
Specialist
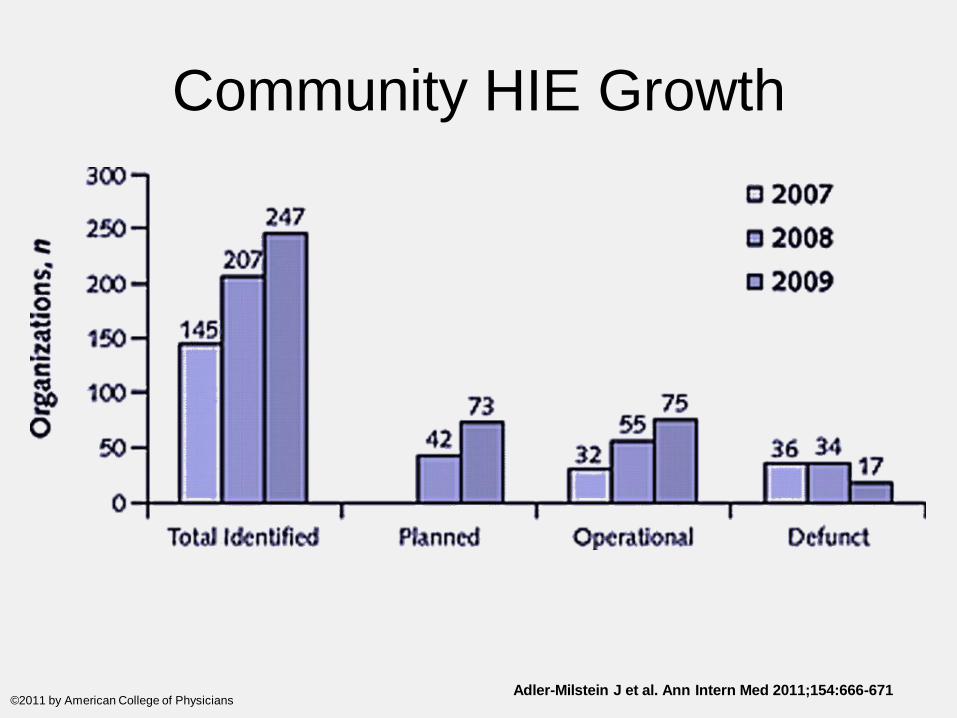
Adler-Milstein J et al. Ann Intern Med 2011;154:666-671 ©2011 by American College of Physicians
Community HIE Growth
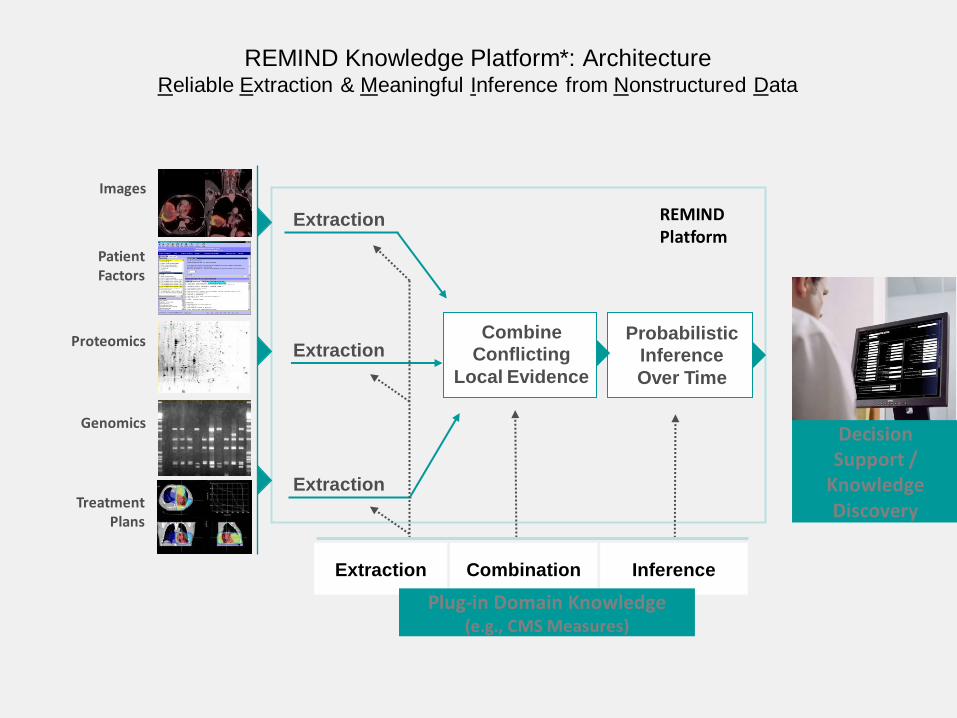
Extraction
Extraction
Extraction
REMIND Platform
Inference Combination Extraction
Treatment Plans
Genomics
Proteomics
Patient Factors
Images
Domain Knowledge
Combine
Conflicting
Local Evidence
Probabilistic
Inference
Over Time
Clinical Decision Support
Plug-in Domain Knowledge (e.g., CMS Measures)
Decision Support /
Knowledge Discovery
REMIND Knowledge Platform*: Architecture Reliable Extraction & Meaningful Inference from Nonstructured Data
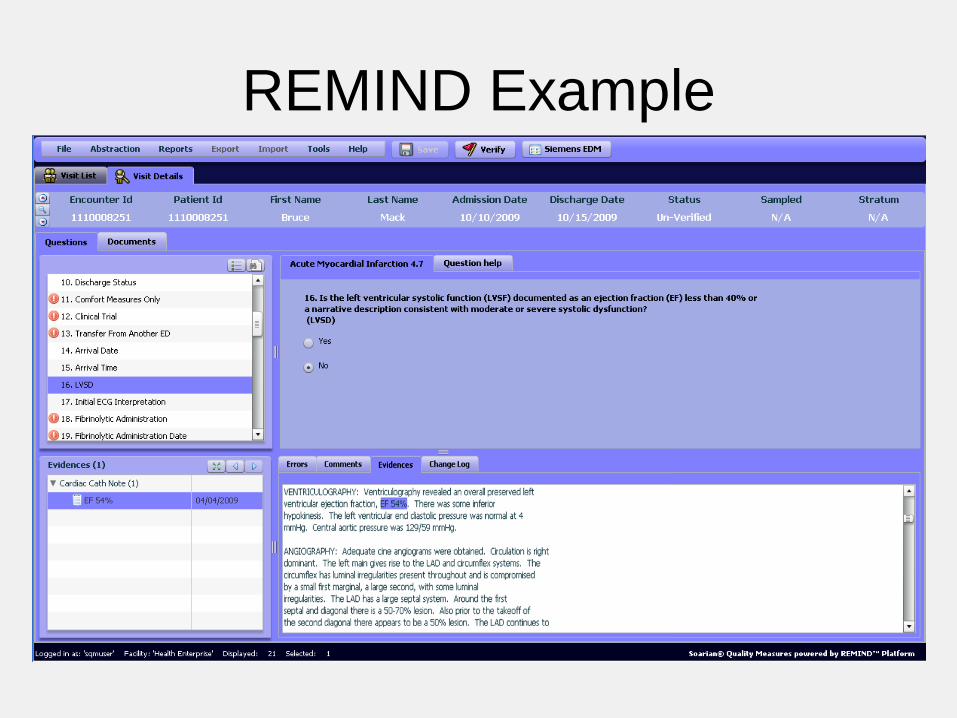
REMIND Example
Quality for purpose
• Clinical care
• Accountable care
• Public health reporting
• CER
• Drug/Device safety
• Health services research
19
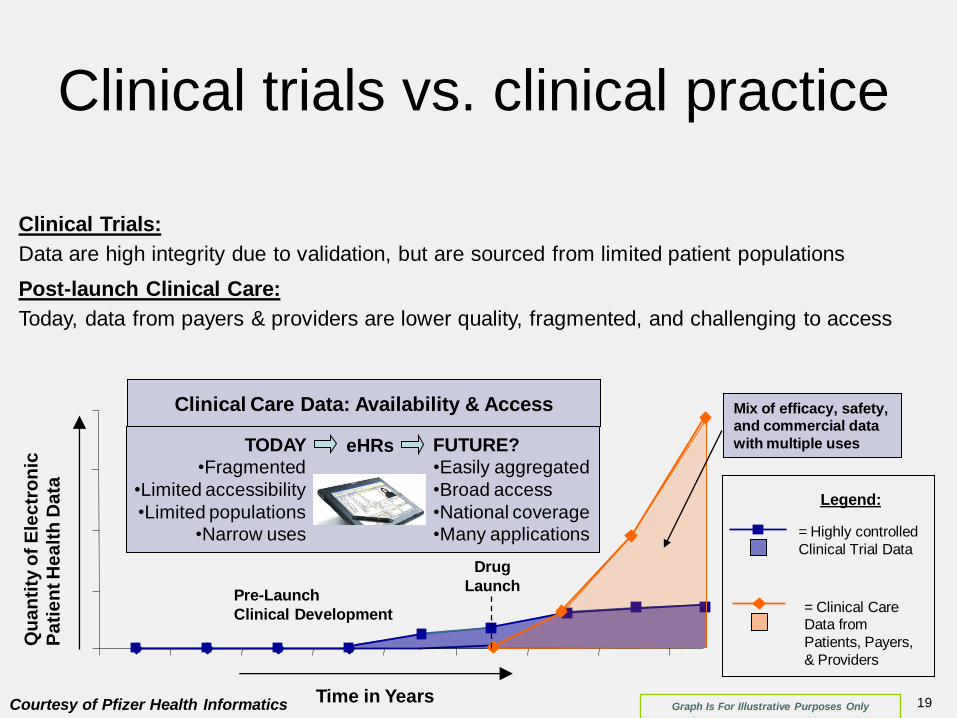
Clinical Trials:
Data are high integrity due to validation, but are sourced from limited patient populations
Post-launch Clinical Care:
Today, data from payers & providers are lower quality, fragmented, and challenging to access
Clinical trials vs. clinical practice
Graph Is For Illustrative Purposes Only Time in Years
Qu
an
tity
of
Ele
ctr
on
ic
Pa
tie
nt H
ea
lth
Da
ta
Pre-Launch
Clinical Development
Drug
Launch
Legend:
= Highly controlled
Clinical Trial Data
eHRs TODAY
•Fragmented
•Limited accessibility
•Limited populations
•Narrow uses
FUTURE?
•Easily aggregated
•Broad access
•National coverage
•Many applications
Clinical Care Data: Availability & Access Mix of efficacy, safety, and commercial data
with multiple uses
= Clinical Care Data from
Patients, Payers,
& Providers
Courtesy of Pfizer Health Informatics
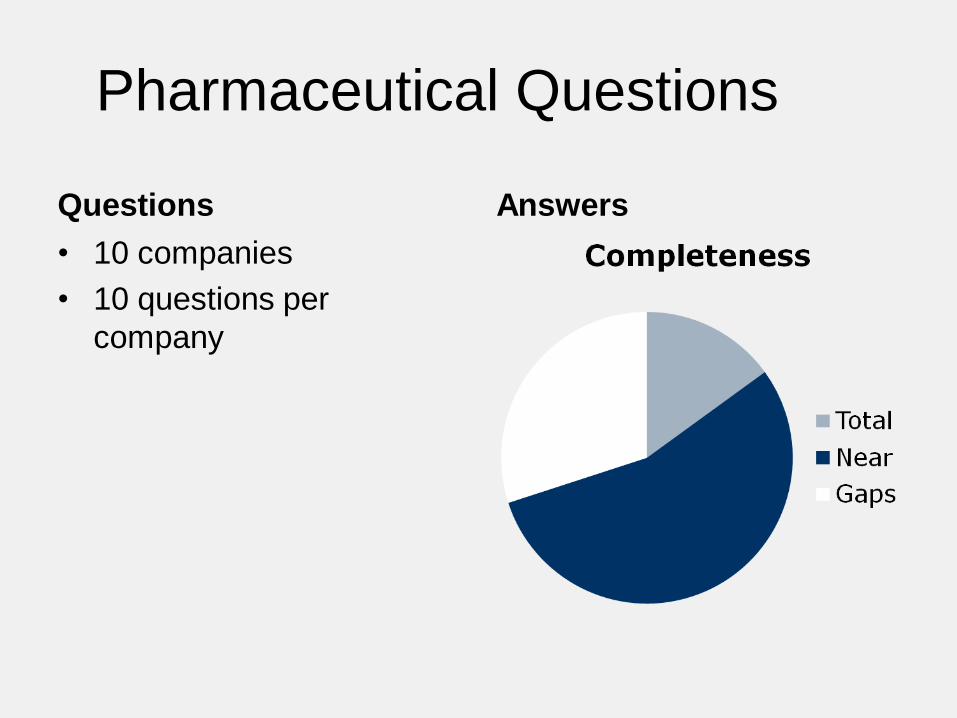
Pharmaceutical Questions
Questions
• 10 companies
• 10 questions per
company
Answers
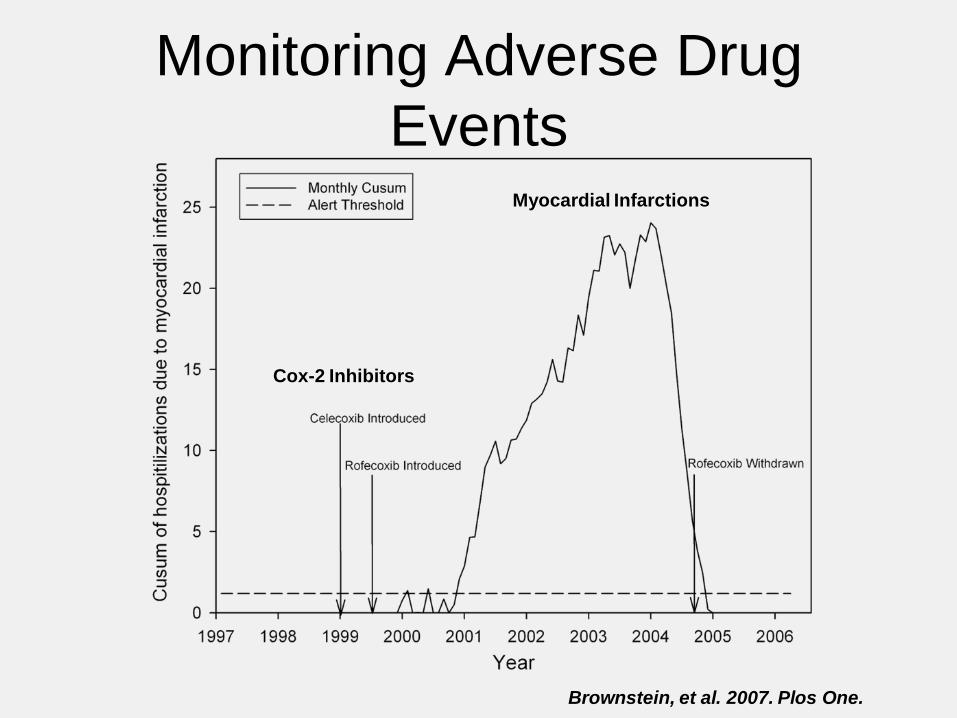
Monitoring Adverse Drug
Events Myocardial Infarctions
Cox-2 Inhibitors
Brownstein, et al. 2007. Plos One.
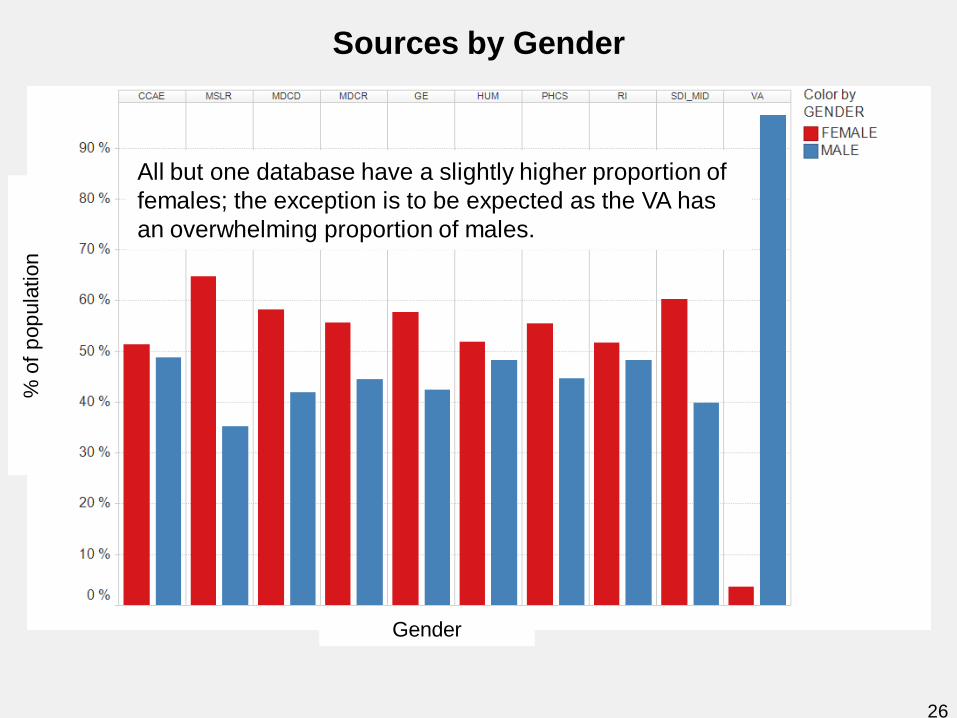
Sources by Gender
All but one database have a slightly higher proportion of
females; the exception is to be expected as the VA has
an overwhelming proportion of males.
% o
f p
op
ula
tion
Gender
26
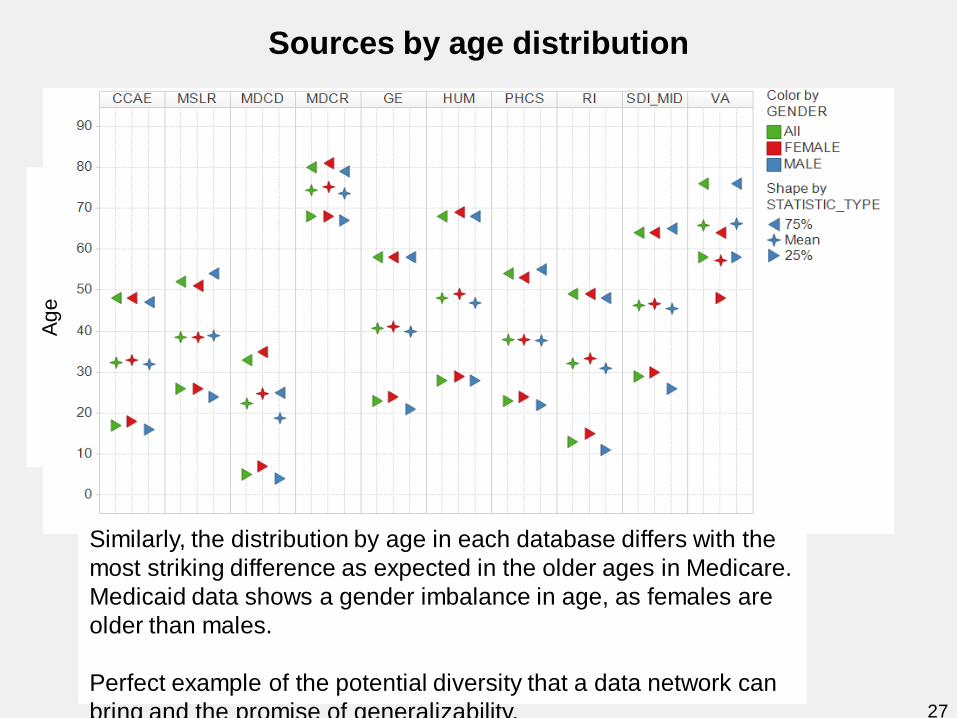
Sources by age distribution A
ge
Similarly, the distribution by age in each database differs with the
most striking difference as expected in the older ages in Medicare.
Medicaid data shows a gender imbalance in age, as females are
older than males.
Perfect example of the potential diversity that a data network can
bring and the promise of generalizability. 27
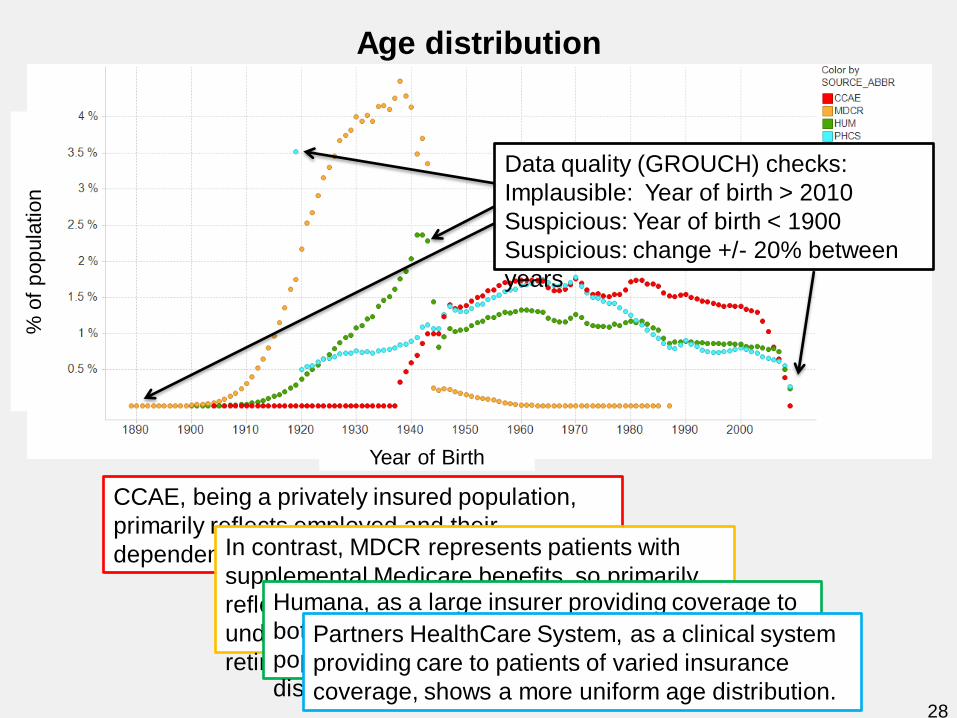
Age distribution
CCAE, being a privately insured population,
primarily reflects employed and their
dependents, so underrepresents > 65 years In contrast, MDCR represents patients with
supplemental Medicare benefits, so primarily
reflects persons > 65 years, but
underrepresents those younger than
retirement age
Humana, as a large insurer providing coverage to
both privately insured and the Medicare
populations, is observed to combine the two age
distribution patterns
Partners HealthCare System, as a clinical system
providing care to patients of varied insurance
coverage, shows a more uniform age distribution.
% o
f p
op
ula
tion
Year of Birth
28
Data quality (GROUCH) checks:
Implausible: Year of birth > 2010
Suspicious: Year of birth < 1900
Suspicious: change +/- 20% between
years
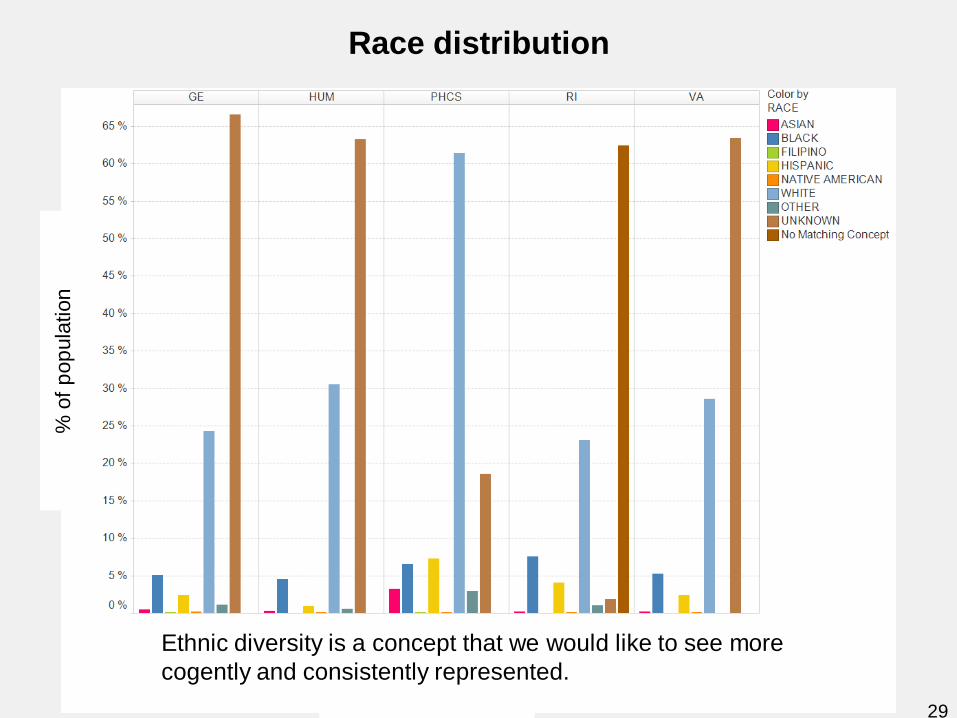
Race distribution
Ethnic diversity is a concept that we would like to see more
cogently and consistently represented.
% o
f p
op
ula
tion
29
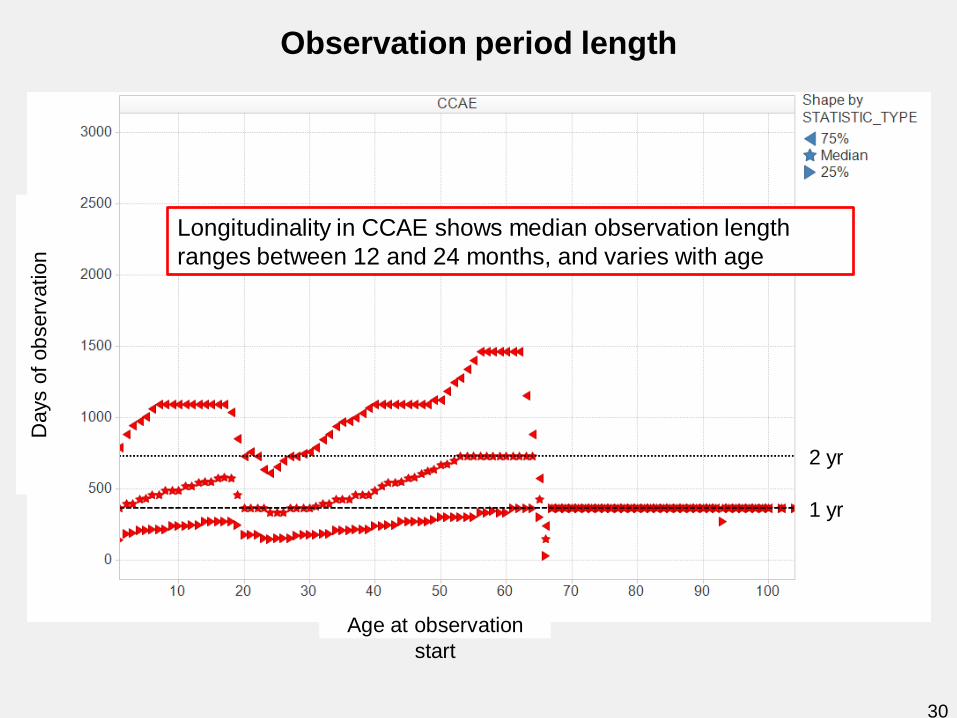
Observation period length
Longitudinality in CCAE shows median observation length
ranges between 12 and 24 months, and varies with age
Days o
f ob
serv
ation
Age at observation
start
1 yr
2 yr
30
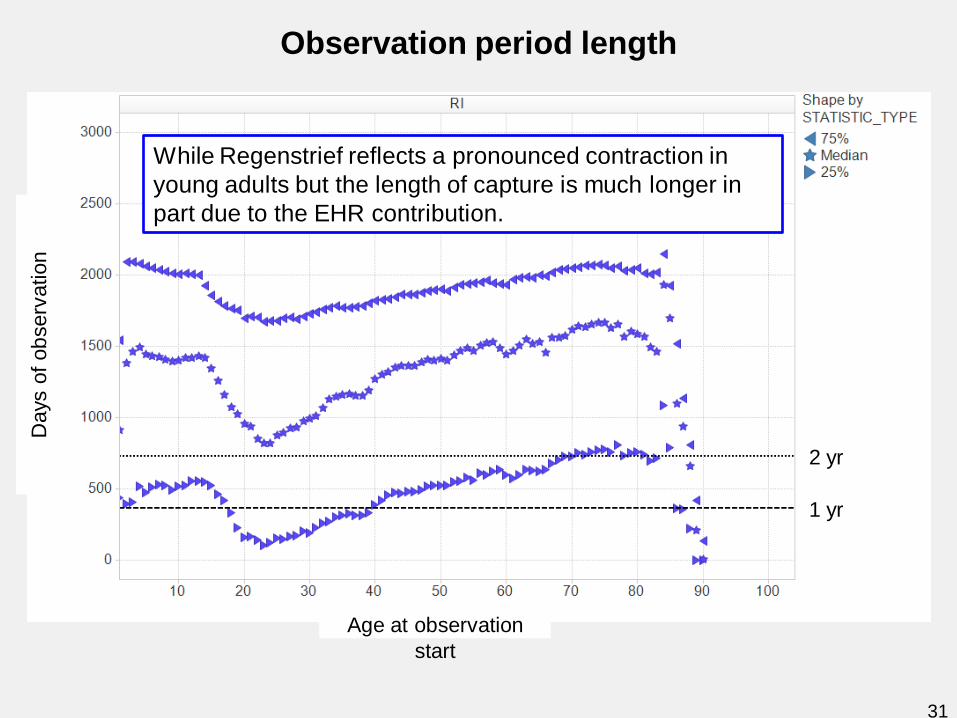
Observation period length D
ays o
f ob
serv
ation
Age at observation
start
1 yr
2 yr
While Regenstrief reflects a pronounced contraction in
young adults but the length of capture is much longer in
part due to the EHR contribution.
31
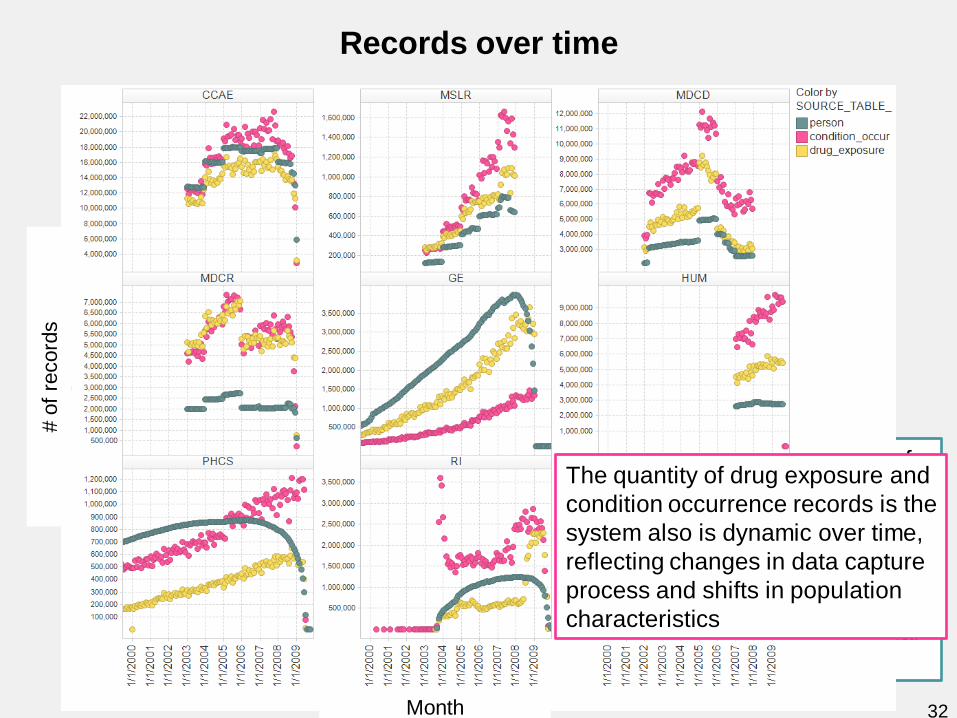
Records over time
Each database captures data for a different span of
time. The number of persons observed in any given
month varies substantially, eg.
• Humana maintains a consistent population size
• GE is consistently growing as more practices
adopt the Centricity EHR system
• Thomson databases are observed to have annual
changes as new data sources are aggregated
# o
f re
cord
s
Month
The quantity of drug exposure and
condition occurrence records is the
system also is dynamic over time,
reflecting changes in data capture
process and shifts in population
characteristics
32
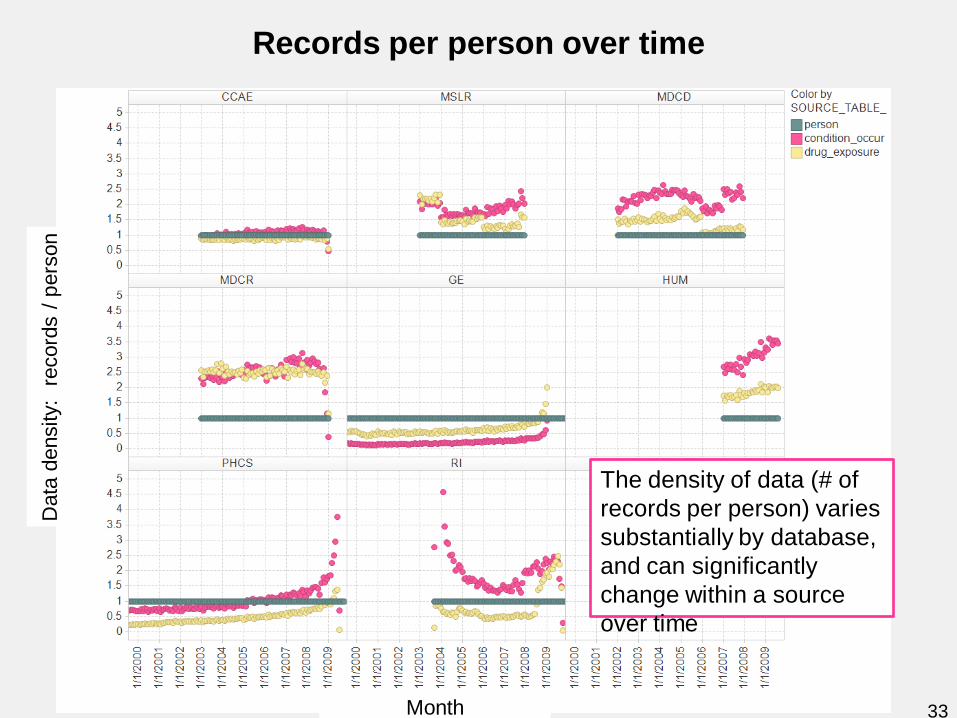
Records per person over time
The density of data (# of
records per person) varies
substantially by database,
and can significantly
change within a source
over time
Data
density:
record
s /
pers
on
Month 33
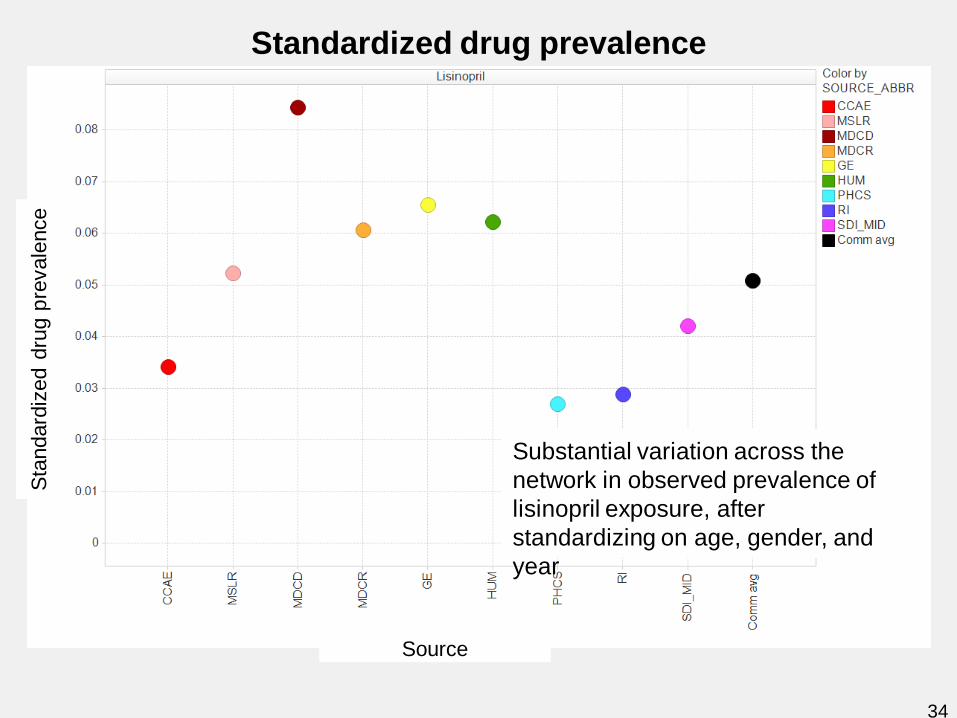
Standardized drug prevalence S
tandard
ized d
rug
pre
vale
nce
Source
Substantial variation across the
network in observed prevalence of
lisinopril exposure, after
standardizing on age, gender, and
year
34
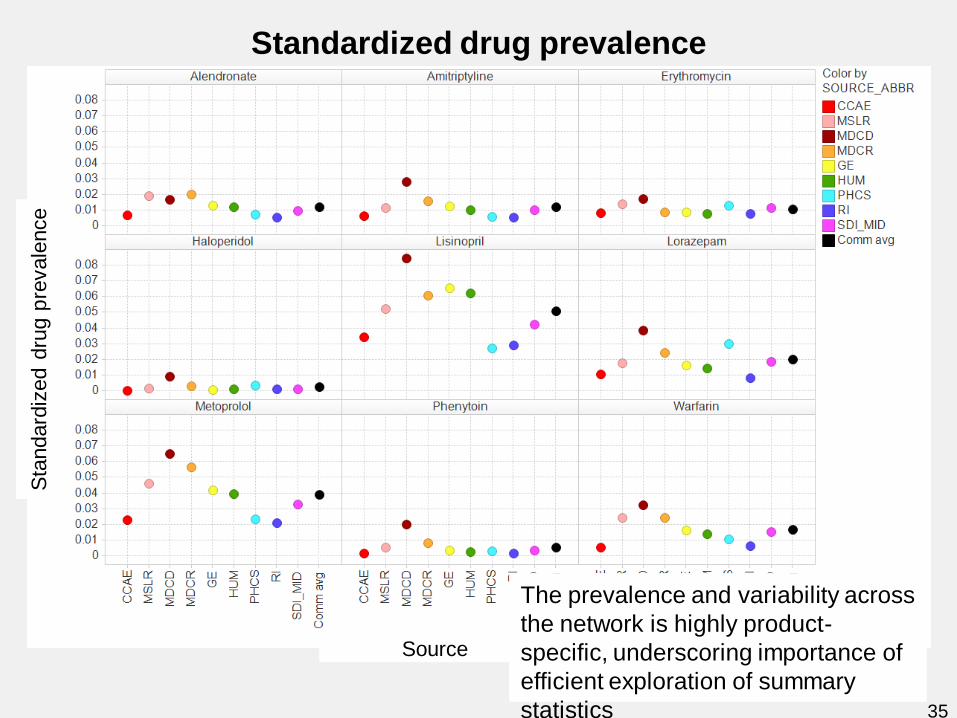
Standardized drug prevalence S
tandard
ized d
rug
pre
vale
nce
Source
The prevalence and variability across
the network is highly product-
specific, underscoring importance of
efficient exploration of summary
statistics 35
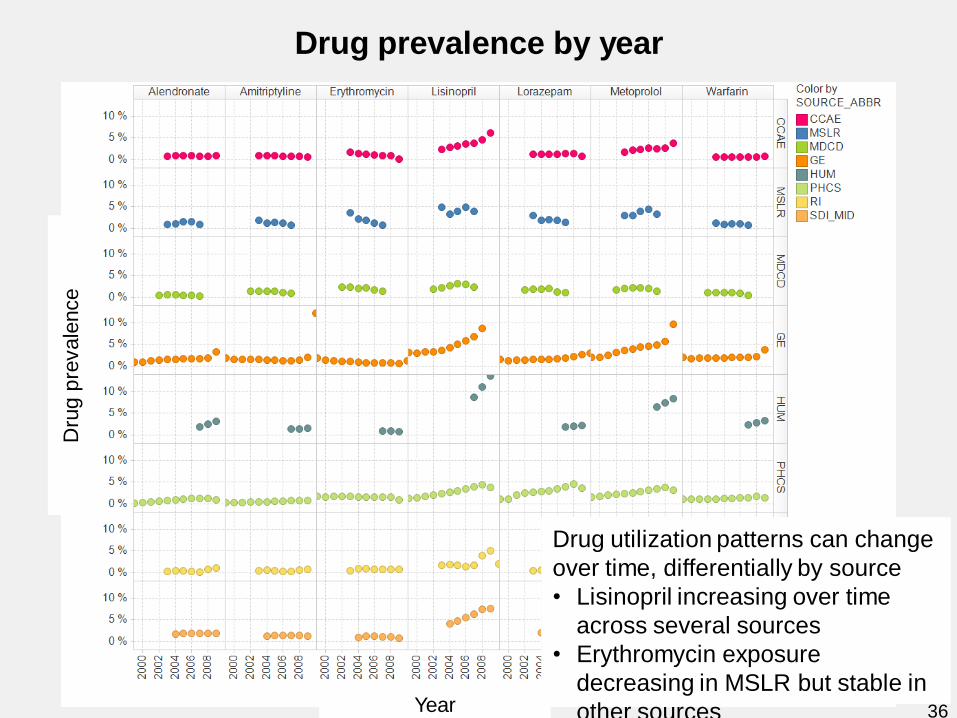
Drug prevalence by year D
rug
pre
vale
nce
Year
Drug utilization patterns can change
over time, differentially by source
• Lisinopril increasing over time
across several sources
• Erythromycin exposure
decreasing in MSLR but stable in
other sources 36
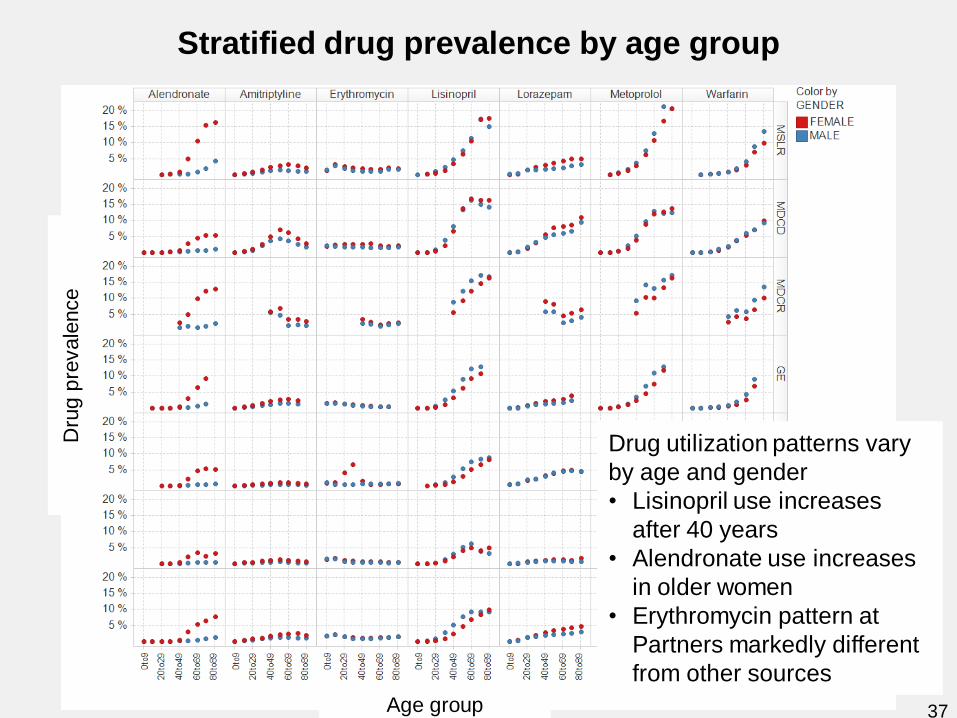
Stratified drug prevalence by age group
Drug utilization patterns vary
by age and gender
• Lisinopril use increases
after 40 years
• Alendronate use increases
in older women
• Erythromycin pattern at
Partners markedly different
from other sources
Dru
g p
revale
nce
Age group 37
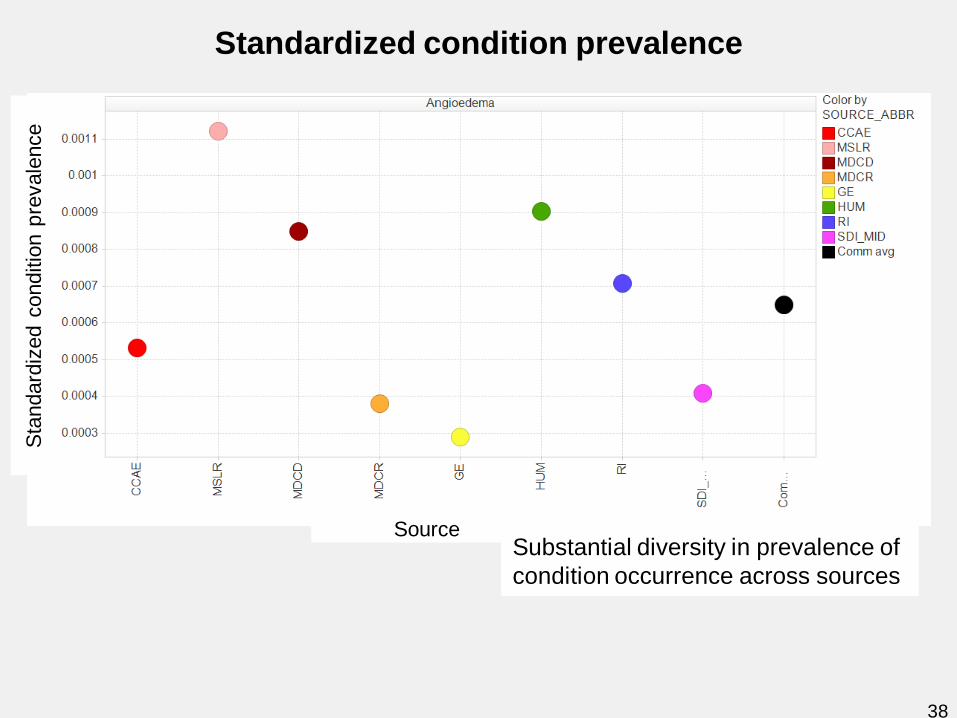
Standardized condition prevalence S
tandard
ized c
onditio
n p
revale
nce
Source Substantial diversity in prevalence of
condition occurrence across sources
38
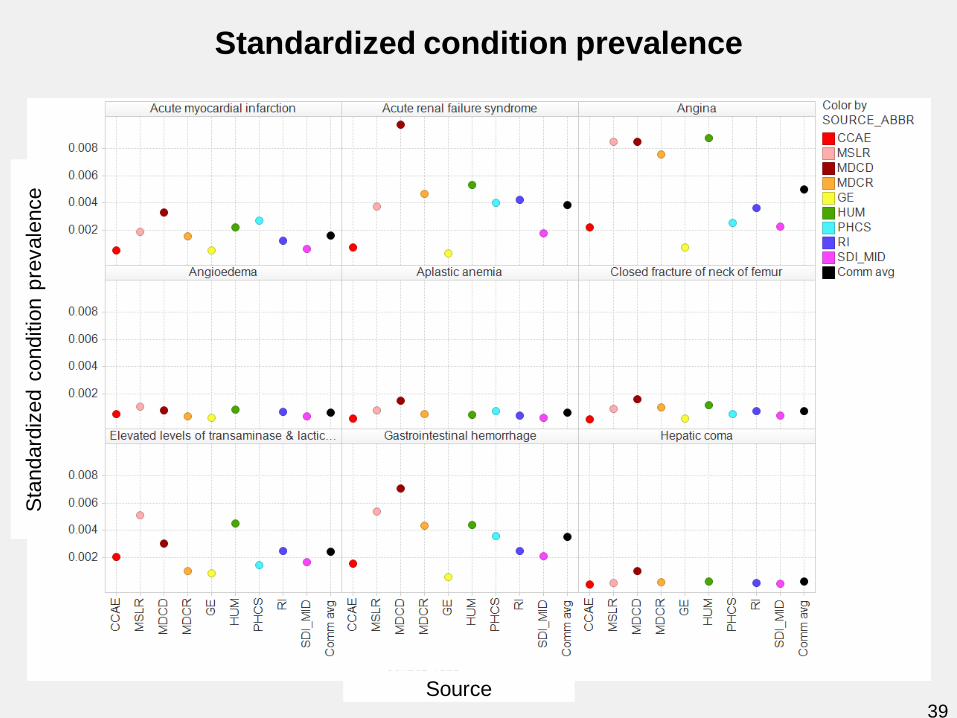
Standardized condition prevalence S
tandard
ized c
onditio
n p
revale
nce
Source 39
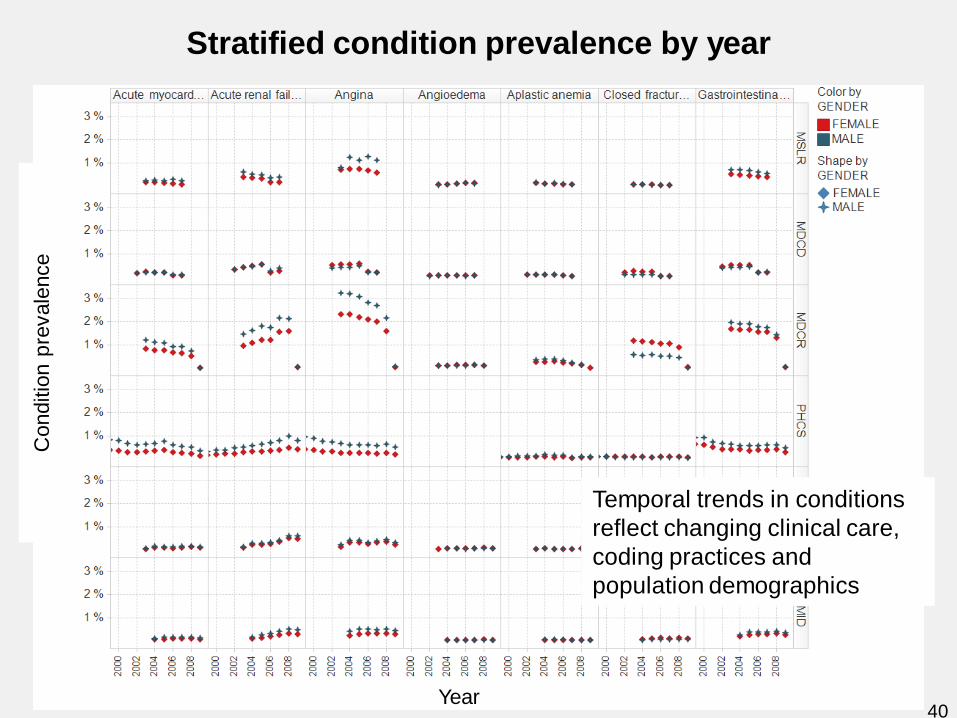
Stratified condition prevalence by year C
onditio
n p
revale
nce
Year
Temporal trends in conditions
reflect changing clinical care,
coding practices and
population demographics
40
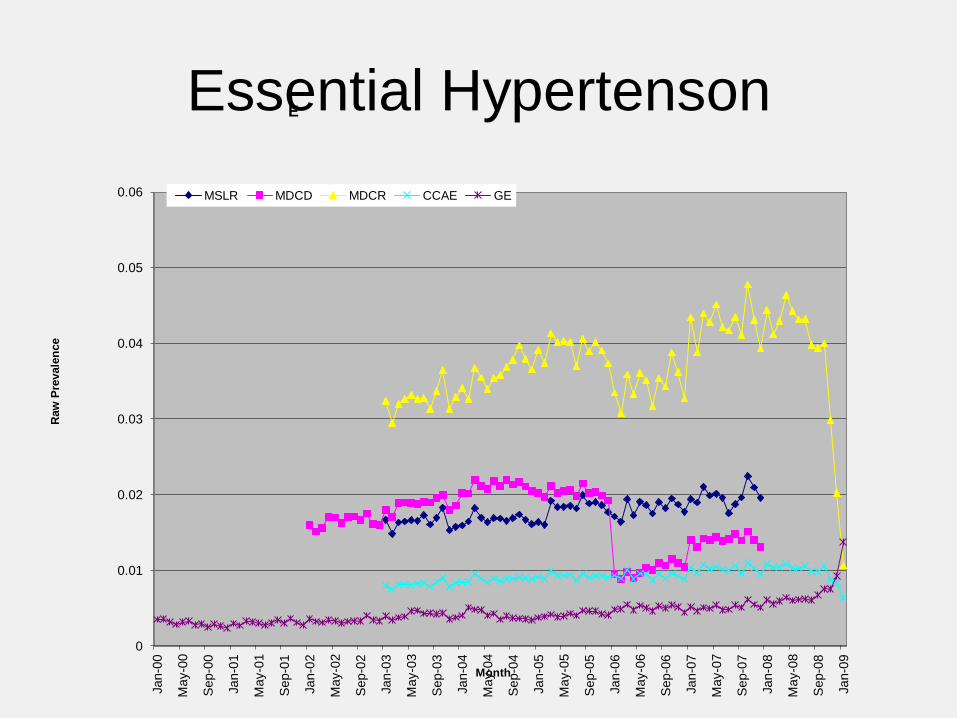
Essential Hypertenson
0
0.01
0.02
0.03
0.04
0.05
0.06
Ja
n-0
0
May-0
0
Sep-0
0
Ja
n-0
1
Ma
y-0
1
Sep-0
1
Ja
n-0
2
Ma
y-0
2
Sep-0
2
Ja
n-0
3
Ma
y-0
3
Sep-0
3
Ja
n-0
4
Ma
y-0
4
Sep-0
4
Jan-0
5
Ma
y-0
5
Sep-0
5
Ja
n-0
6
Ma
y-0
6
Sep-0
6
Ja
n-0
7
May-0
7
Sep-0
7
Ja
n-0
8
Ma
y-0
8
Sep-0
8
Ja
n-0
9
Raw
Pre
vale
nce
Month
E
MSLR MDCD MDCR CCAE GE
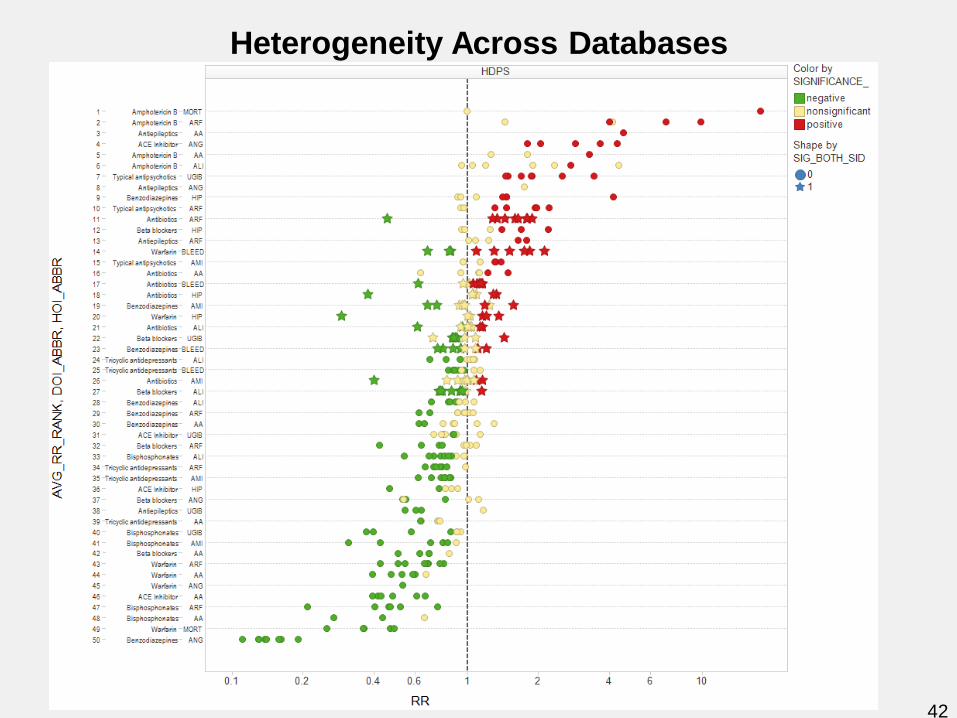
Heterogeneity Across Databases
42
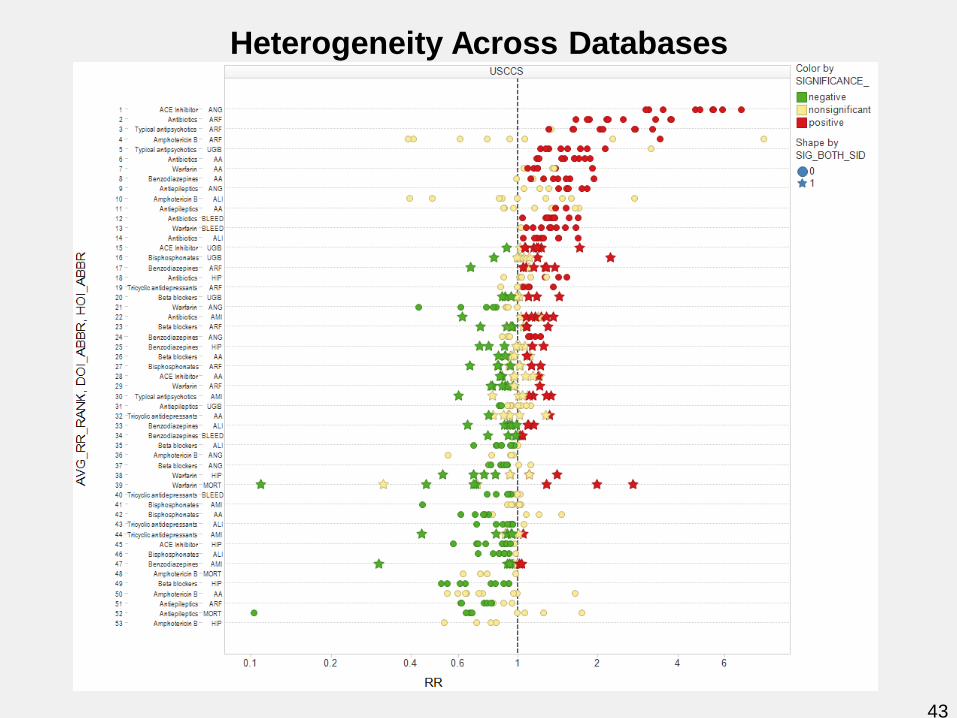
Heterogeneity Across Databases
43
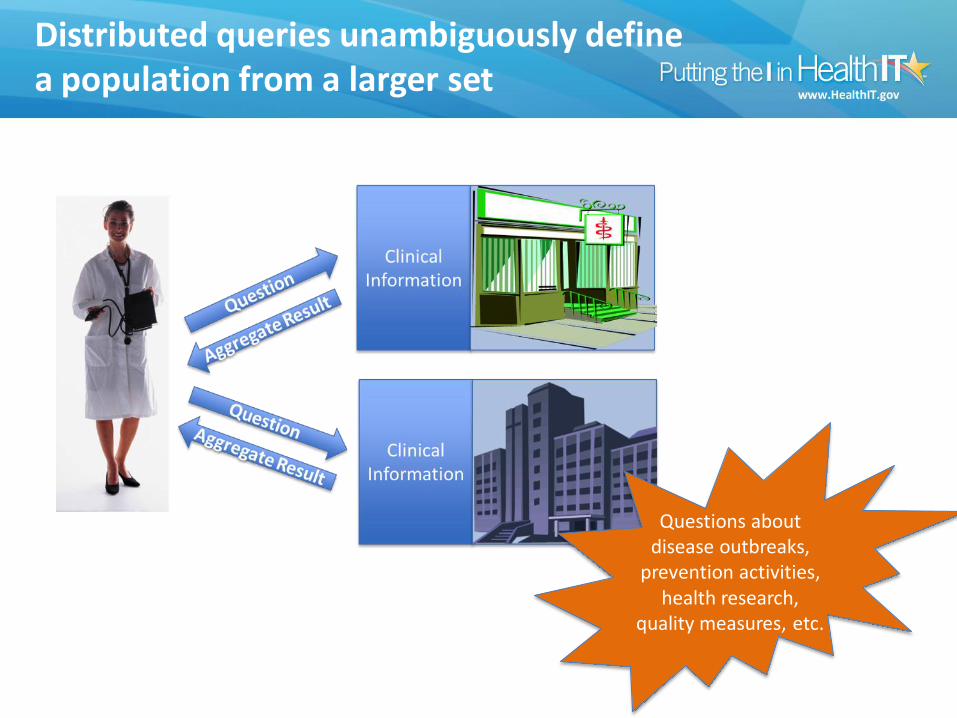
Distributed queries unambiguously define a population from a larger set
Questions about disease outbreaks,
prevention activities, health research,
quality measures, etc.
OBSERVATIONAL MEDICAL OUTCOMES PARTNERSHIP
OMOP 2011 Symposium Page 45
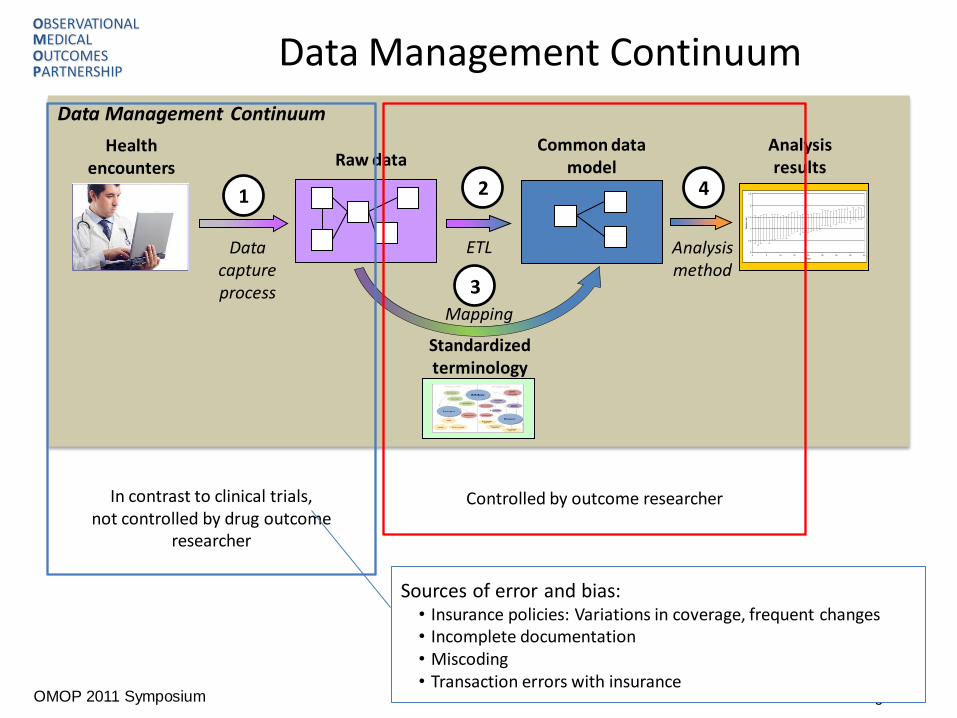
Raw data Common data
model Health
encounters
Standardized terminology
Analysis results
1 2 4
0
0.5
1
1.5
2
2.5
0 5 10 15 20 25 30 35 40
Time
Rela
tive r
isk
3
Data capture process
ETL Analysis method
Mapping
Data Management Continuum
Data Management Continuum
In contrast to clinical trials, not controlled by drug outcome
researcher
Sources of error and bias: • Insurance policies: Variations in coverage, frequent changes • Incomplete documentation • Miscoding • Transaction errors with insurance
Controlled by outcome researcher
OBSERVATIONAL MEDICAL OUTCOMES PARTNERSHIP
Page 46
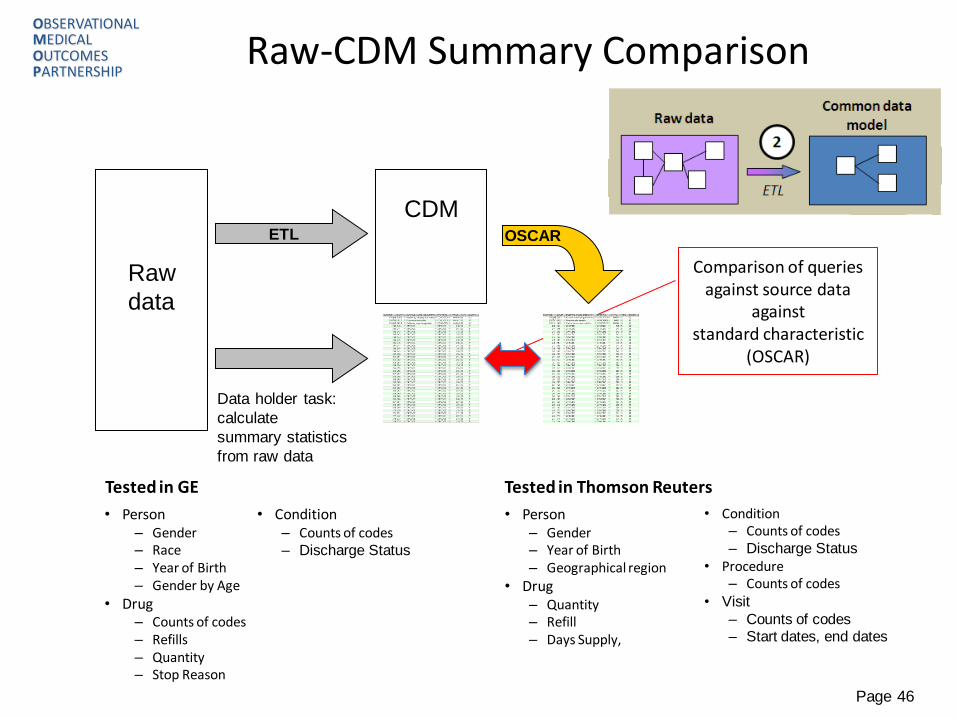
Raw-CDM Summary Comparison
Tested in GE
• Person – Gender – Race – Year of Birth – Gender by Age
• Drug – Counts of codes – Refills – Quantity – Stop Reason
Tested in Thomson Reuters
• Person – Gender – Year of Birth – Geographical region
• Drug – Quantity – Refill – Days Supply,
Raw
data
CDM
ETL OSCAR
• Condition – Counts of codes – Discharge Status
• Procedure – Counts of codes
• Visit
– Counts of codes – Start dates, end dates
Comparison of queries
against source data against
standard characteristic (OSCAR)
• Condition – Counts of codes – Discharge Status
Data holder task:
calculate
summary statistics
from raw data
OBSERVATIONAL MEDICAL OUTCOMES PARTNERSHIP
OMOP 2011 Symposium Page 47
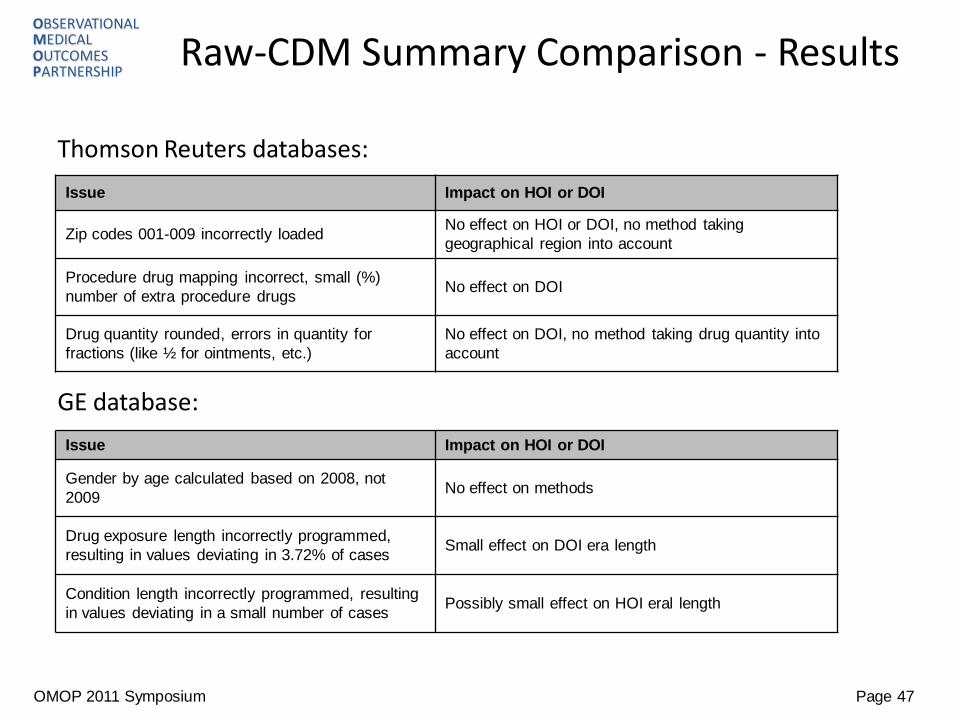
Raw-CDM Summary Comparison - Results
Thomson Reuters databases:
GE database:
Issue Impact on HOI or DOI
Zip codes 001-009 incorrectly loaded No effect on HOI or DOI, no method taking
geographical region into account
Procedure drug mapping incorrect, small (%)
number of extra procedure drugs No effect on DOI
Drug quantity rounded, errors in quantity for
fractions (like ½ for ointments, etc.)
No effect on DOI, no method taking drug quantity into
account
Issue Impact on HOI or DOI
Gender by age calculated based on 2008, not
2009 No effect on methods
Drug exposure length incorrectly programmed,
resulting in values deviating in 3.72% of cases Small effect on DOI era length
Condition length incorrectly programmed, resulting
in values deviating in a small number of cases Possibly small effect on HOI eral length
OBSERVATIONAL MEDICAL OUTCOMES PARTNERSHIP
OMOP 2011 Symposium Page 48
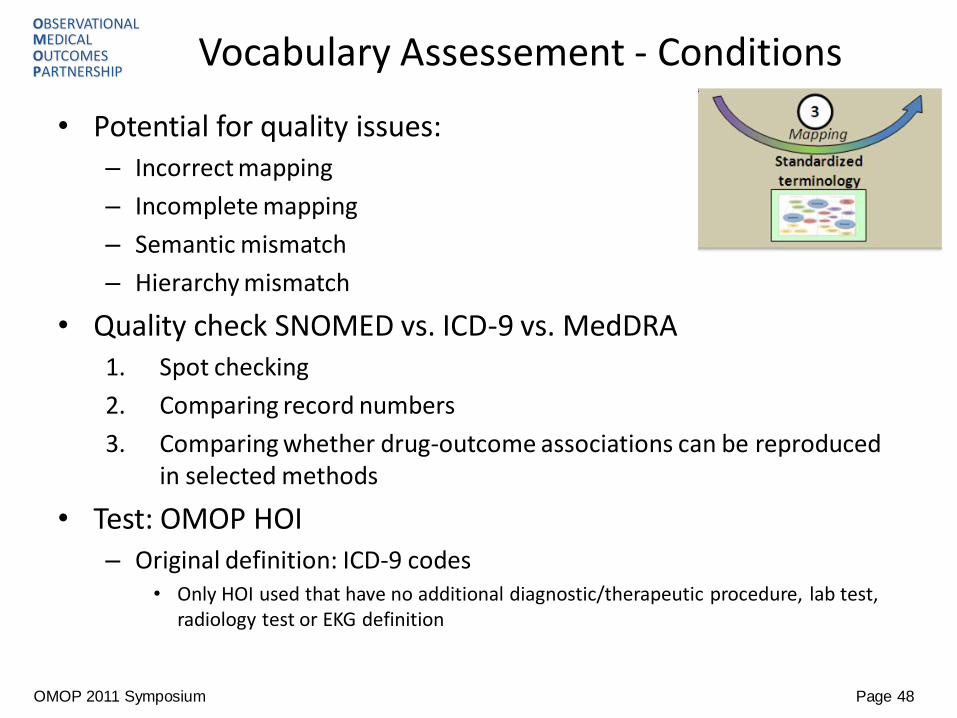
Vocabulary Assessement - Conditions
• Potential for quality issues: – Incorrect mapping
– Incomplete mapping
– Semantic mismatch
– Hierarchy mismatch
• Quality check SNOMED vs. ICD-9 vs. MedDRA 1. Spot checking
2. Comparing record numbers
3. Comparing whether drug-outcome associations can be reproduced in selected methods
• Test: OMOP HOI – Original definition: ICD-9 codes
• Only HOI used that have no additional diagnostic/therapeutic procedure, lab test, radiology test or EKG definition
OBSERVATIONAL MEDICAL OUTCOMES PARTNERSHIP
OMOP 2011 Symposium Page 49
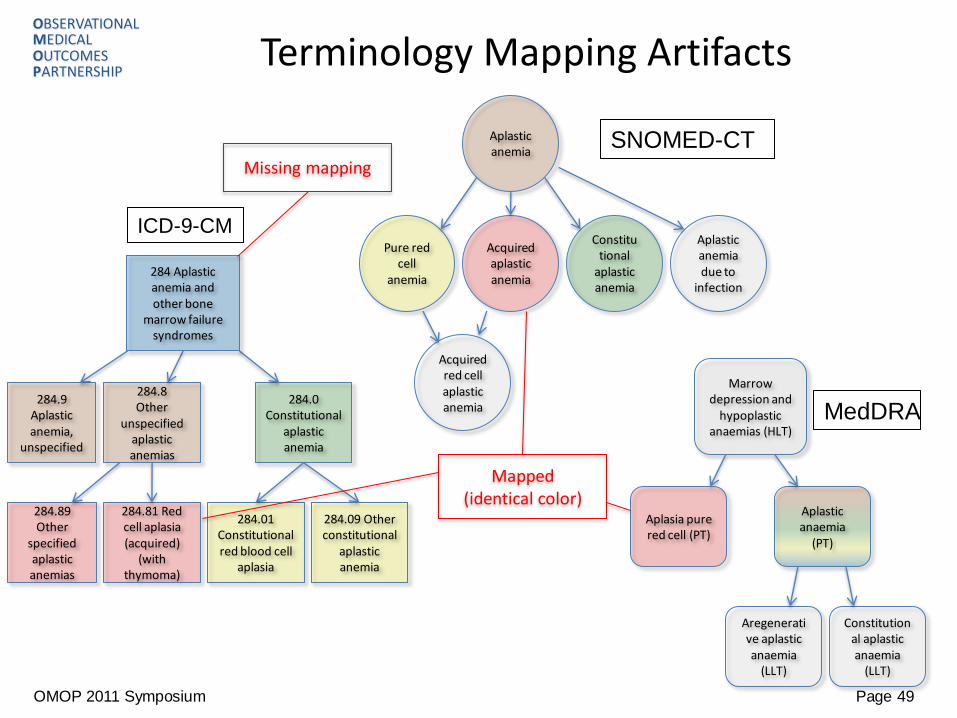
Terminology Mapping Artifacts
Aplastic anemia
ICD-9-CM
SNOMED-CT
Pure red cell
anemia
Acquired aplastic anemia
Constitutional
aplastic anemia
Acquired red cell aplastic anemia
284.8 Other
unspecified aplastic anemias
284.01 Constitutional red blood cell
aplasia
284.81 Red cell aplasia (acquired)
(with thymoma)
284.0 Constitutional
aplastic anemia
284.9 Aplastic anemia,
unspecified
284.09 Other constitutional
aplastic anemia
Aplastic anaemia
(PT)
Constitutional aplastic anaemia
(LLT)
Marrow depression and
hypoplastic anaemias (HLT)
MedDRA
Aregenerative aplastic anaemia
(LLT)
Aplastic anemia due to
infection
Aplasia pure red cell (PT)
284.89 Other
specified aplastic anemias
284 Aplastic anemia and other bone
marrow failure syndromes
Missing mapping
Mapped (identical color)
OBSERVATIONAL MEDICAL OUTCOMES PARTNERSHIP
OMOP 2011 Symposium Page 50
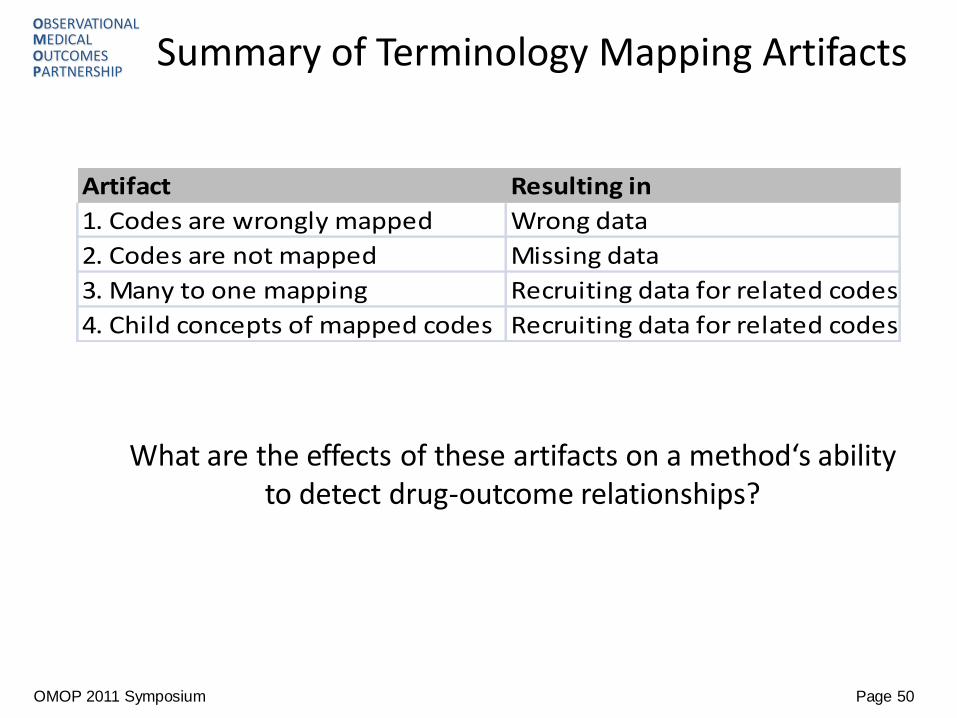
Summary of Terminology Mapping Artifacts
What are the effects of these artifacts on a method‘s ability to detect drug-outcome relationships?
Artifact Resulting in
1. Codes are wrongly mapped Wrong data
2. Codes are not mapped Missing data
3. Many to one mapping Recruiting data for related codes
4. Child concepts of mapped codes Recruiting data for related codes
OBSERVATIONAL MEDICAL OUTCOMES PARTNERSHIP
Page 51
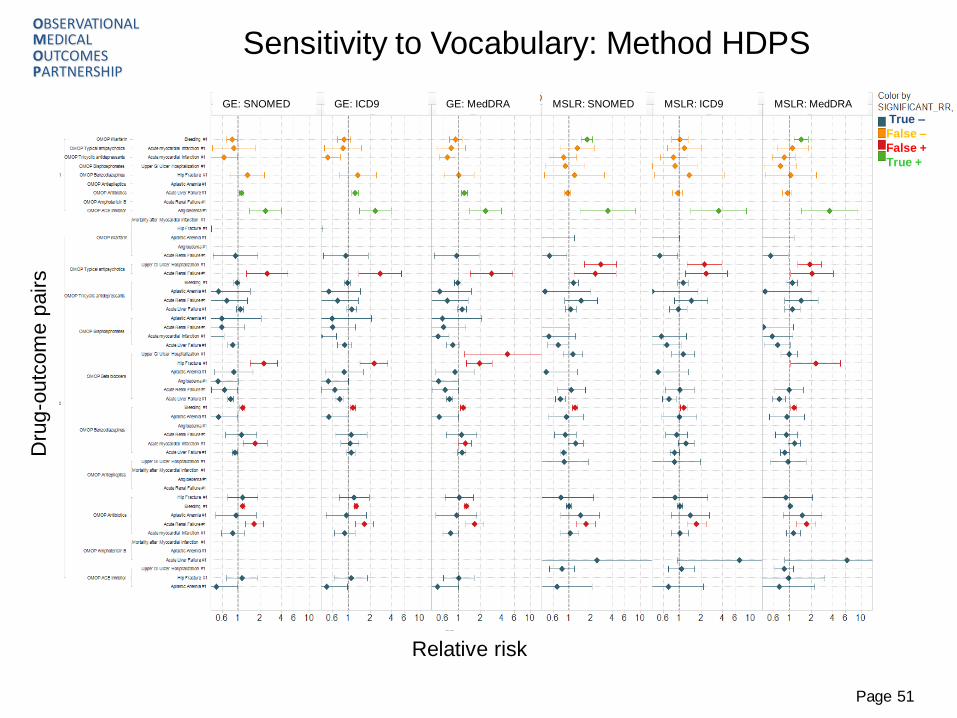
Sensitivity to Vocabulary: Method HDPS
True –
False –
False +
True +
Relative risk
Dru
g-o
utc
om
e p
air
s
GE: SNOMED GE: ICD9 GE: MedDRA MSLR: SNOMED MSLR: ICD9 MSLR: MedDRA
OBSERVATIONAL MEDICAL OUTCOMES PARTNERSHIP
Page 52
Relative risk
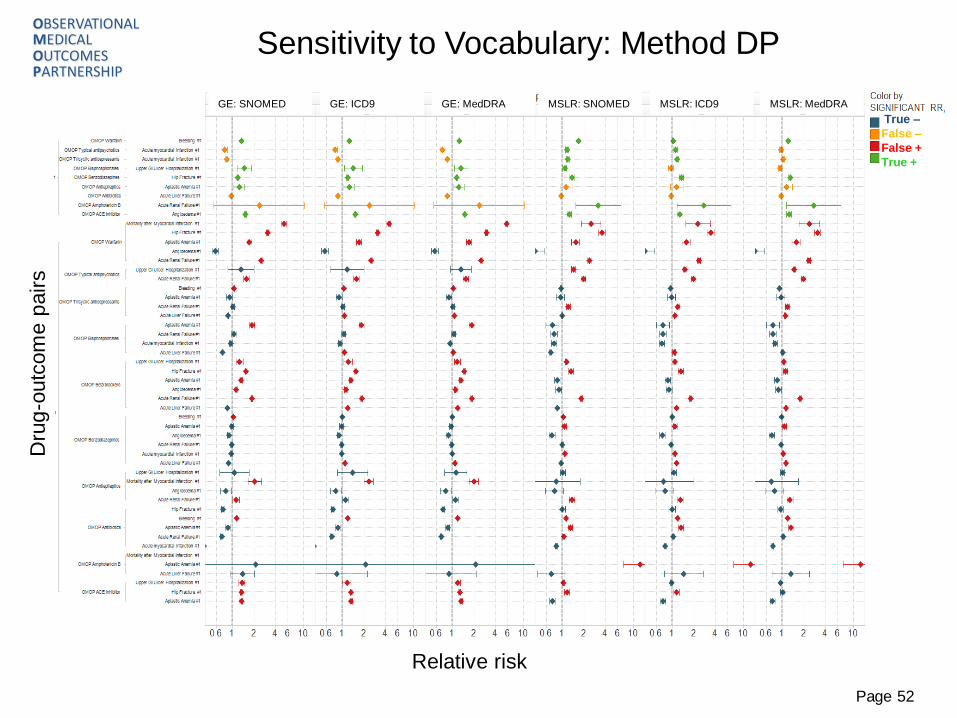
Sensitivity to Vocabulary: Method DP D
rug
-outc
om
e p
air
s
True –
False –
False +
True +
GE: SNOMED GE: ICD9 GE: MedDRA MSLR: SNOMED MSLR: ICD9 MSLR: MedDRA
OBSERVATIONAL MEDICAL OUTCOMES PARTNERSHIP
Page 53
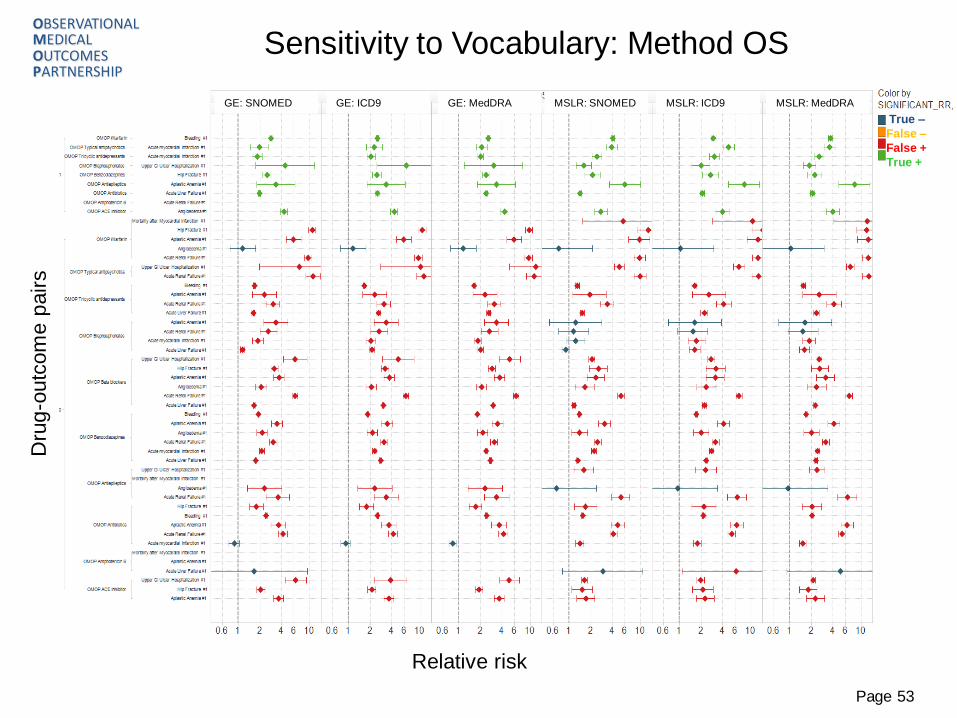
Sensitivity to Vocabulary: Method OS
Relative risk Relative risk
Dru
g-o
utc
om
e p
air
s
True –
False –
False +
True +
GE: SNOMED GE: ICD9 GE: MedDRA MSLR: SNOMED MSLR: ICD9 MSLR: MedDRA
OBSERVATIONAL MEDICAL OUTCOMES PARTNERSHIP
Page 54
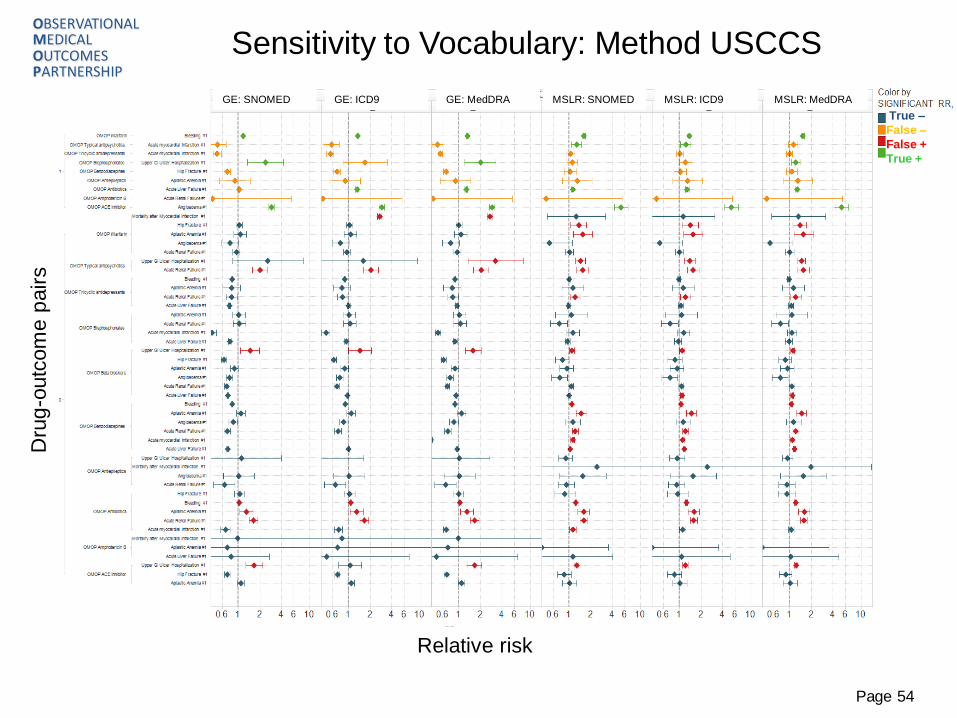
Sensitivity to Vocabulary: Method USCCS
False +
Relative risk
Dru
g-o
utc
om
e p
air
s
True –
False –
False +
True +
GE: SNOMED GE: ICD9 GE: MedDRA MSLR: SNOMED MSLR: ICD9 MSLR: MedDRA
OBSERVATIONAL MEDICAL OUTCOMES PARTNERSHIP
OMOP 2011 Symposium Page 55
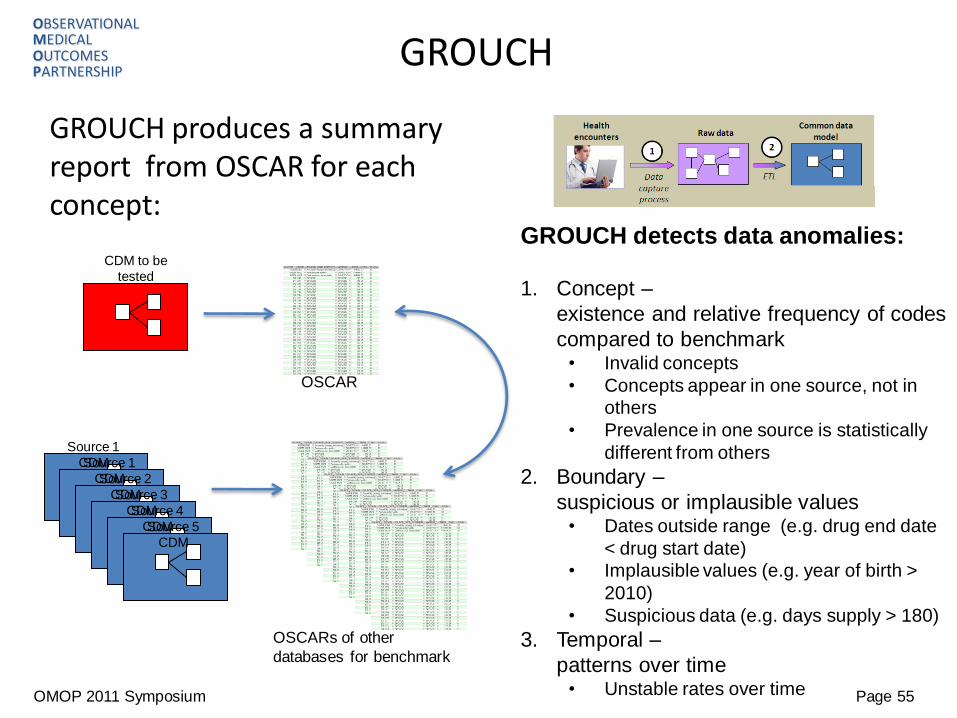
GROUCH
GROUCH produces a summary report from OSCAR for each concept:
Source 1
CDM Source 1
CDM Source 2
CDM Source 3
CDM Source 4
CDM Source 5
CDM
OSCARs of other
databases for benchmark
CDM to be
tested
OSCAR
GROUCH detects data anomalies:
1. Concept –
existence and relative frequency of codes
compared to benchmark • Invalid concepts
• Concepts appear in one source, not in
others
• Prevalence in one source is statistically
different from others
2. Boundary –
suspicious or implausible values • Dates outside range (e.g. drug end date
< drug start date)
• Implausible values (e.g. year of birth >
2010)
• Suspicious data (e.g. days supply > 180)
3. Temporal –
patterns over time • Unstable rates over time
OBSERVATIONAL MEDICAL OUTCOMES PARTNERSHIP
OMOP 2011 Symposium Page 56
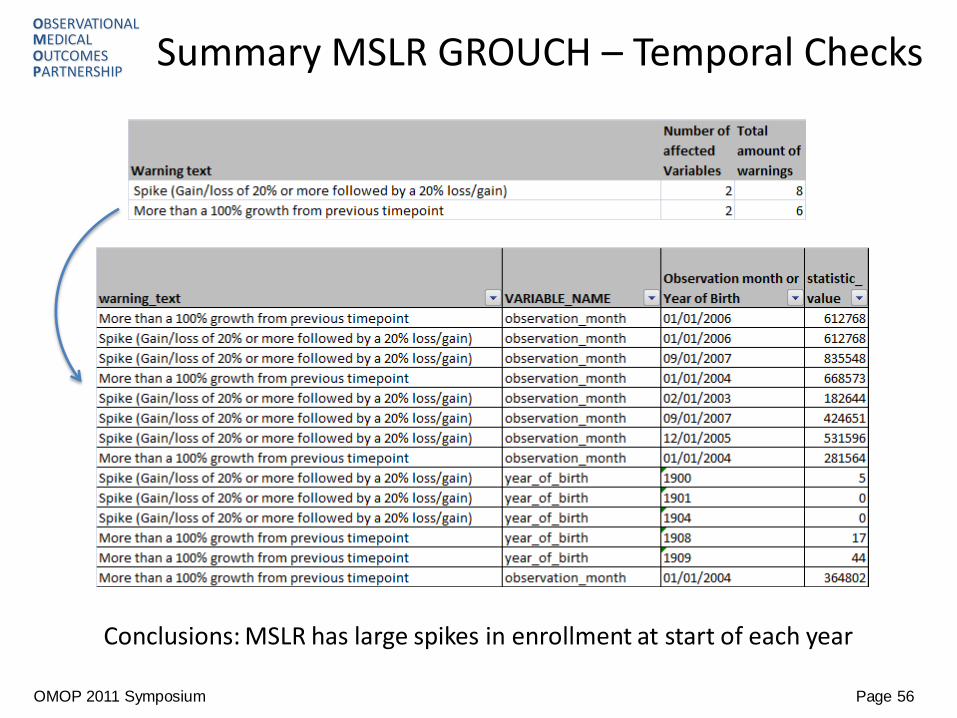
Summary MSLR GROUCH – Temporal Checks
Conclusions: MSLR has large spikes in enrollment at start of each year
OBSERVATIONAL MEDICAL OUTCOMES PARTNERSHIP
OMOP 2011 Symposium Page 57
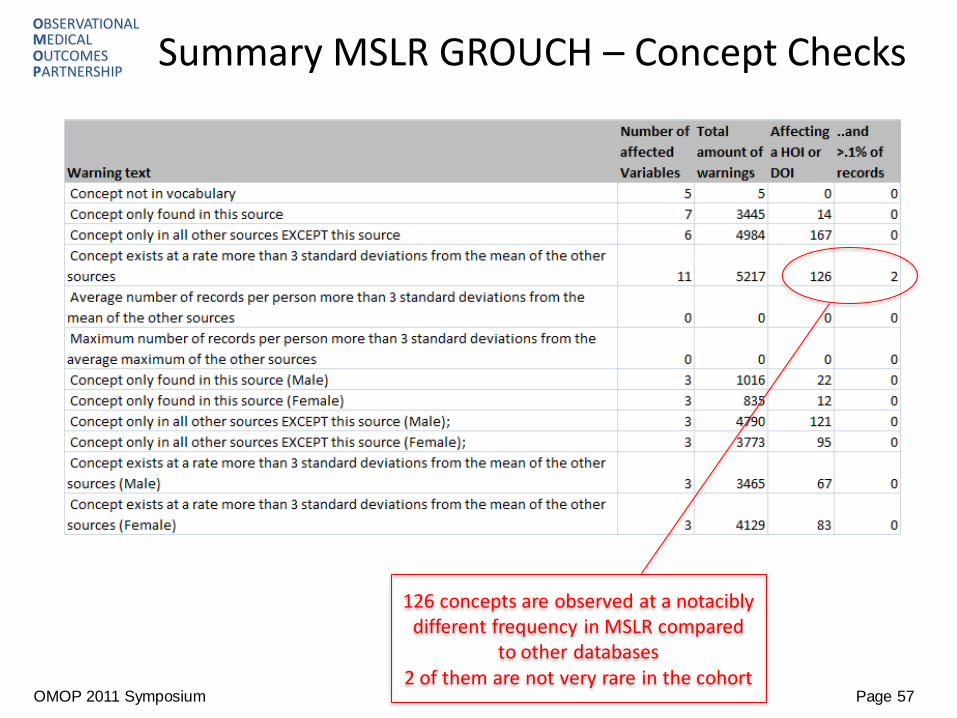
Summary MSLR GROUCH – Concept Checks
126 concepts are observed at a notacibly different frequency in MSLR compared
to other databases 2 of them are not very rare in the cohort
OBSERVATIONAL MEDICAL OUTCOMES PARTNERSHIP
OMOP 2011 Symposium Page 58
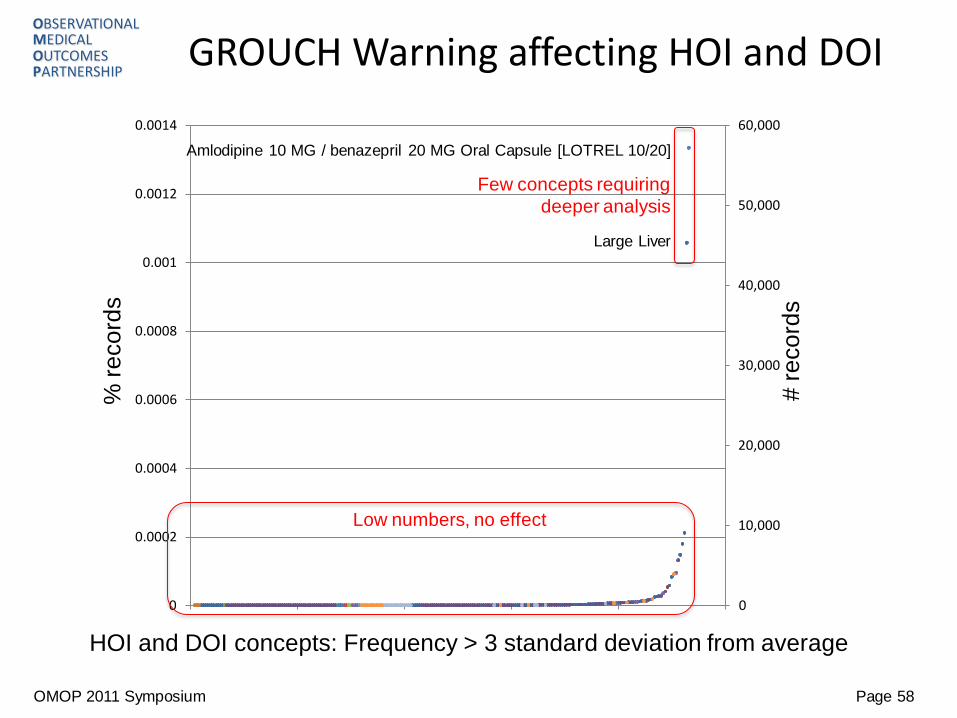
GROUCH Warning affecting HOI and DOI
0
10,000
20,000
30,000
40,000
50,000
60,000
0
0.0002
0.0004
0.0006
0.0008
0.001
0.0012
0.0014
HOI 301
HOI 303
HOI 401
HOI 501
HOI 601
HOI 603
DOI 1
DOI 2
DOI 3
DOI 5
DOI 6
DOI 8
DOI 9
% r
eco
rds
# r
eco
rds
HOI and DOI concepts: Frequency > 3 standard deviation from average
Amlodipine 10 MG / benazepril 20 MG Oral Capsule [LOTREL 10/20]
Large Liver
Low numbers, no effect
Few concepts requiring
deeper analysis
OBSERVATIONAL MEDICAL OUTCOMES PARTNERSHIP
OMOP 2011 Symposium Page 59
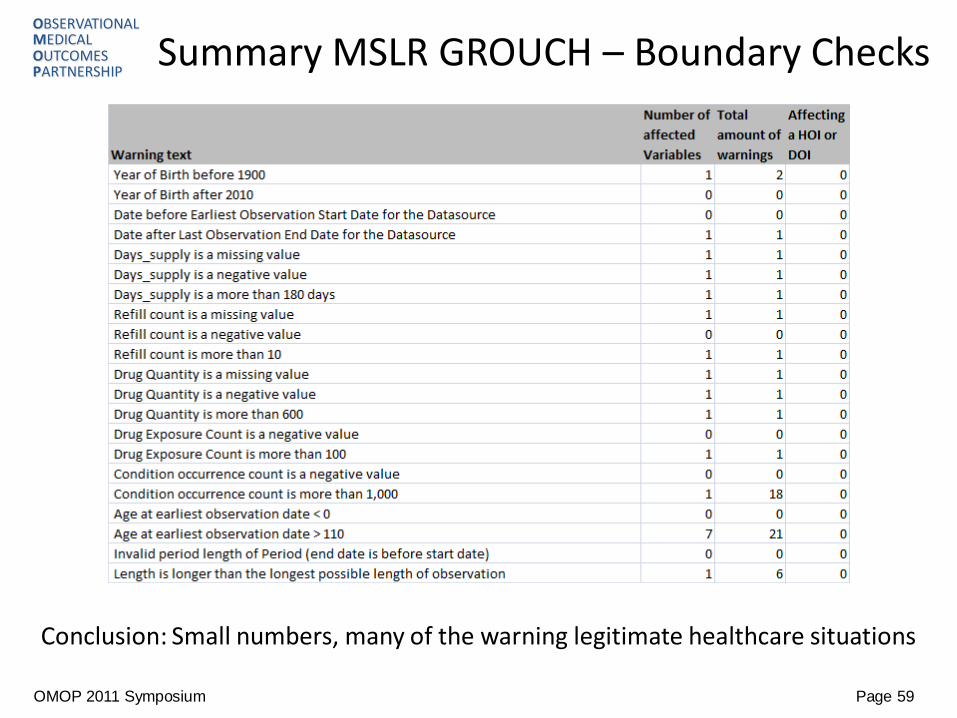
Summary MSLR GROUCH – Boundary Checks
Conclusion: Small numbers, many of the warning legitimate healthcare situations

60
Current Level of Interoperability
http://spanky.triumf.ca/
Key Points
• Data are not patients
• Data are Swiss cheese
• Data hide their meaning
• Data are dynamic over time
• Data may be truncated temporally
• Data are not data
• Data are biased
• Data are never as abundant as they appear
• Not all data comes from patients
The patient is waiting!


