Indian J PhysioI Pharmacol 1999; 43 (4): 435-442 THE CHARACTERISTICS AND DETERMINANTS OF MAXIMAL EXPIRATORY PRESSURE IN YOUNG, HEALTHY, INDIAN MALES T. T. UKYAB AND MARIO VAZ* Department of Physiology, St John's Medical College, Bangalore - 560 034 (Received on March 6, 1999) Abstract: Maximal expiratory pressure (MEP) can be used as an index of respiratory muscle strength and of the ability of an individual to cough effectively. The inf1uence of anthropomeiry, nutritional status and ethnicity on MEP was studied in 113 young healthy Indian males and 53 Tibetans between 18 and 30 years of age. All subjects underwent an anthropometric assessment. Anthropometric variables (EMI, log BMI) explained only 12.5% of the variance in MEP. MEP was significantly lower in chronically undernourished subjects when compared with anthropometrically similar underweight subjects (P<0.05). The Indian subjects had significantly lower MEP's than BMI matched Tibetan subjects (P<O.Ol>. This difference may have been due to the higher chest circumferences in the Tibetans (P<0.01). While general muscle strength (maximal hand grip) and MEP were significantly correlated (r=0.26, P<O.Ol>, the strength of the correlation was relatively low, suggesting that the determinants of the two measures were considerably different. Key words: maximal expiratory pressure undernutrition Indian anthropometry Tibetan INTRODUCTION Maximal expiratory pressure (MEP) and maximal inspiratory pressures (MIP) together provide a composite index of respiratory muscle strength (1-4). The measurement of MIP in the field requires either a negative pressure gauge or a pressure transducer (5), which adds to the cost of the measurement. The measurement of MEP on the other hand is extremely cost effective requiring no more than an aneroid blood pressure gauge attached to a mouth- *Corresponding Author piece of standard dimensions. The equipment can be assembled virtually anywhere. The use of MEP as an independent measure of respiratory muscle strength would require a correlation between MIP and MEP. This is in fact true. Results from literature suggest that correlations between the two parameters over a wide range of pressures range from + 0.62 to + 0.68 (5, 6). Thus, MEP can be used as a screening test of respiratory muscle strength in situations where MIP cannot be measured. In addition, MEP is
Transcript
Indian J PhysioI Pharmacol 1999; 43 (4): 435-442
THE CHARACTERISTICS AND DETERMINANTS OFMAXIMAL EXPIRATORY PRESSURE IN YOUNG,HEALTHY, INDIAN MALES
T. T. UKYAB AND MARIO VAZ*
Department of Physiology,St John's Medical College,Bangalore - 560 034
(Received on March 6, 1999)
Abstract: Maximal expiratory pressure (MEP) can be used as an indexof respiratory muscle strength and of the ability of an individual to cougheffectively. The inf1uence of anthropomeiry, nutritional status and ethnicityon MEP was studied in 113 young healthy Indian males and 53 Tibetansbetween 18 and 30 years of age. All subjects underwent an anthropometricassessment. Anthropometric variables (EMI, log BMI) explained only 12.5%of the variance in MEP. MEP was significantly lower in chronicallyundernourished subjects when compared with anthropometrically similarunderweight subjects (P<0.05). The Indian subjects had significantly lowerMEP's than BMI matched Tibetan subjects (P<O.Ol>. This difference mayhave been due to the higher chest circumferences in the Tibetans (P<0.01).While general muscle strength (maximal hand grip) and MEP weresignificantly correlated (r=0.26, P<O.Ol>, the strength of the correlationwas relatively low, suggesting that the determinants of the two measureswere considerably different.
Key words: maximal expiratory pressureundernutrition Indian
anthropometryTibetan
INTRODUCTION
Maximal expiratory pressure (MEP) andmaximal inspiratory pressures (MIP)together provide a composite index ofrespiratory muscle strength (1-4). Themeasurement of MIP in the field requireseither a negative pressure gauge or apressure transducer (5), which adds to thecost of the measurement. The measurementof MEP on the other hand is extremely costeffective requiring no more than an aneroidblood pressure gauge attached to a mouth-
*Corresponding Author
piece of standard dimensions. Theequipment can be assembled virtuallyanywhere. The use of MEP as anindependent measure of respiratory musclestrength would require a correlationbetween MIP and MEP. This is in fact true.Results from literature suggest thatcorrelations between the two parametersover a wide range of pressures range from+ 0.62 to + 0.68 (5, 6). Thus, MEP can beused as a screening test of respiratorymuscle strength in situations where MIPcannot be measured. In addition, MEP is
436 Ukyab and Vaz
an independent indicator of the ability ofan individual to cough effectively (7). Thisis an important assessment in susceptiblegroups, where the inability to cougheffectively predicts the developmentof atelectasis and respiratory infection.A reduced MEP has also been shown tobe associated with a sensation of dyspnoea(3).
There IS limited data on thedeterminants of MEP in Indians (5), and nodata to the best of our knowledge on thepossible predictors of MEP in a normalIndian population. This study was carriedout with the following aims:
1. To determine the anthropometricpredictors of MEP in a population ofhealthy, young Indian males between theages of 18 and 30 years.
2. To determine whether MEP was reducedin chronically undernourished subjects.
3. To determine differences in MEPbetween BMI-matched healthy Tibetansand Indians.
4. To determine whether MEP as an indexof respiratory muscle strength wascorrelated with general muscle strengthderived from hand dynamometry.
METHODS
Subjects: A total of 113 healthy, adult(between the ages of 18 and 30 years) Indianmales were recruited as part of this study.The well nourished subjects were recruitedfrom among the staff and students of themedical college, while the undernourished
Indian J Physial Pharmacal 1999; 43(4)
subjects were recruited from thesurrounding urban slums and from thecatchment area of a rural hospital.Exclusion criteria for subjects were thepresence of asthma or other chronicrespiratory ailments, habitual smoking,chronic disease and chronic medication.Subjects with BMI's (kg/m 2
) less than 18.5were divided into an undernourished groupand an underweight group on the basis ofsocio-economic status (8) (Undernourished;BMI<18.5, SE Class IV, Underweight;BMI<18.5, SE class I and II). Thisdifferentiation has allowed for theuncovering of functional differences betweenthese two groups in a variety ofphysiological parameters (9, 10, 11). Inaddition 53 healthy Buddhist monks werestudied at the Sera Mahayana BuddhistUniversity in Bylakuppe, Mysore Dt.,Karnataka. Anthropometric data on thissubgroup has been reported in an earlierpaper (12). All subjects gave fully informedconsent to the protocol which was approvedby the Human Ethics Review Committee ofthe Medical College.
Anthropometry: Height was measured tothe nearest 0.1 cm using a portablestadiometer (Nivotise Brivete-Depose,France). Weight was measured to thenearest 0.1 kg using a calibrated digitalweighing scale (Soehnle Digital S,Germany). Body mass index was calculatedas weight (kg)/heighF (m). Mid upper armcircumference (MAC) and chestcircumference were measured usingtechniques described by Lohman (13) andadopted at the NIH sponsored ArlieConference on the standardisation ofanthropometric measurements. Maximalforearm circumference and the forearm
Indian J Physiol Pharmacal 1999; 43(4) Maximal Expiratory Pressure 437
Measurement of general and respiratory
muscle strength: General muscle strengthwas measured as the maximal voluntarycontraction (MVC) on the non dominant sideusing a Harpenden handgrip dynamometer(CMS Weighing Equipment Ltd. England).Three measurements were taken with thesubject. slanding up and the dynamometerheld slightly away from the body. Thehighest of the three readings was taken foranalysis.
could be compared while controlling forBM!. Comparisons between Indians andTibetans were made using a Two-wayANOVA (EMI x Group). Differences betweenthe BMI quintiles in each group wereassessed using a One-way ANOVA, withScheffe as the post-hoc test. Linearassociations were established usingPearson's Correlations. A multiple stepwiseregression was performed to predict MEPusing various anthropometric indices.Differences between the "underweight"group and the "undernourished" group wereassessed using an independent 't' test. Inall instances the null hypothesis wasrejected at P<0.05
Respiratory muscle strength wasassessed by measuring maximal expiratorypressure (MEP). This was determined usinga modified Black's apparatus (1). Thisconsisted of a small cylinder of specificdimensions, as described by Black,connected to an aneroid pressure gauge. Athree way connector allowed the cylinderand the pressure gauge to be connected toa mercury manometer for calibration checks.Maximal expiratory pressure wasdetermined by asking the subject to blowinto the cylinder after a maximal inspiratoryeffort. Three readings were obtained on eachsubject and the highest of the three readingswas used in the statistical analysis.
Statistical analysis: All data are presentedas mean ± SEM (standard error of themean). For the analysis of differencesbetween Indian and Tibetan subjects, theIndian study sample was divided into fivegroups, using BMI quintiles. The Tibetansubjects were assigned to the quintilesgenerated for Indians so that the two groups
RESULTS
An analysis of the correlations betweenMEP and the anthropometric measurementsshowed that log transformed BMI wasthe only significant correlate of MEP(r=0.19, P<0.05) although several otheranthropometric parameters including BMI(r=0.17, P=0.09) had correlates that werejust short of statistical significance. Whenall the anthropometric variables wereincluded into a stepwise regression modelfor the prediction of MEP, only BMI andlog BMI werf).. accepted into the model.However, the multiple correlation coefficientof the model was only 0.353 accounting forjust 12.5% of the variance in MEP .. Theresultant prediction equation was givenby :-16.01 *BMI + 856.3*log BMI-688.7.
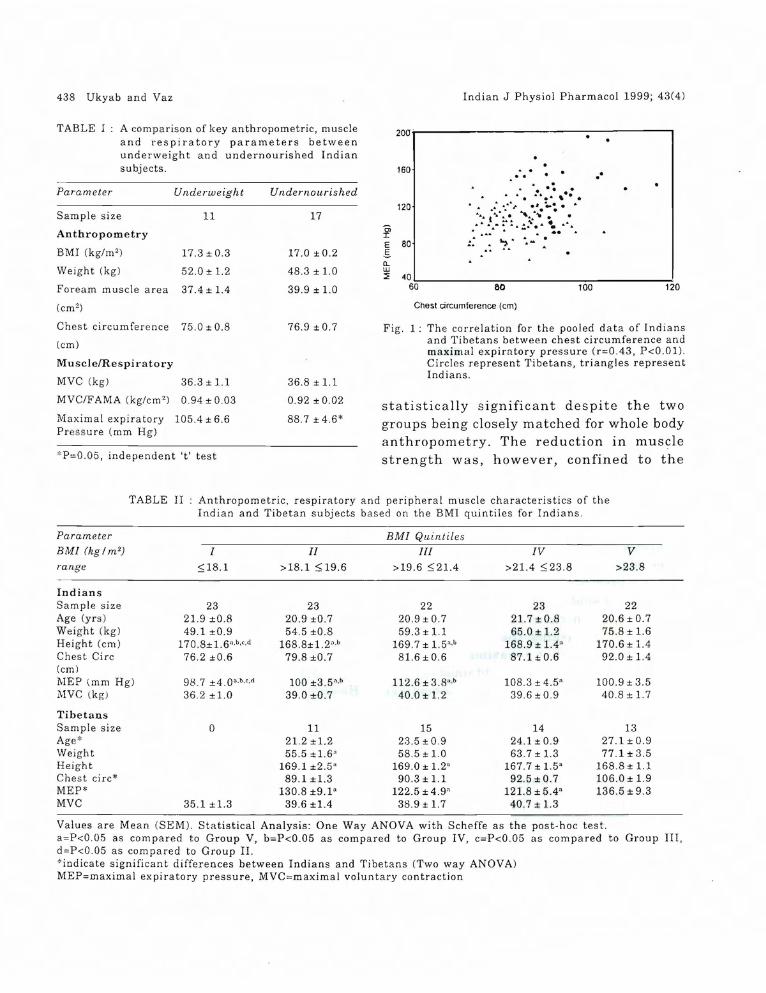
Comparisons between underweight andundernourished subjects (Table II revealedthat undernourished subjects had MEP'sthat were -15% lower when compared withunderweight subjects. This reduction was
438 Ukyab and Vaz Indian J Physiol Pharmacol 1999; 43(4)
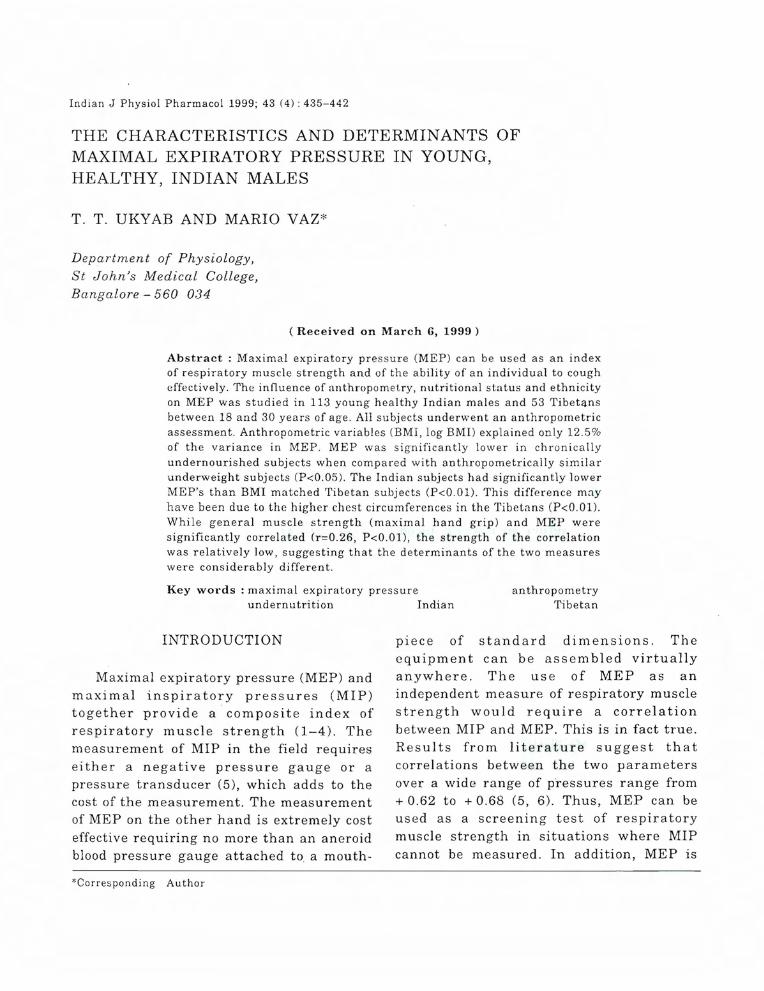
Fig, 1: The correlation for the pooled data of Indiansand Tibetans between chest circumference andmaximal expiratory pressure (r=0.43, P<O,Ol).Circles represent Tibetans, triangles representIndians,
statistically significant despite the twogroups being closely matched for whole bodyanthropometry. The reduction in musclestrength was, however, confined to the
Values are Mean (SEM), Statistical Analysis: One Way ANOVA with Scheffe as the post-hoc test.a=P<0,05 as compared to Group V, b=P<0.05 as compared to Group IV, c=P<0,05 as compared to Group III,d=P<0,05 as compared to Group II.*indicate significan t differences between Indians and Tibetans (Two way ANOVA)MEP=maximal expiratory pressure, MVC=maximal voluntary contraction
Indian J Physiol Pharmacal 1999; 43(4) Maximal Expiratory Pressure 439
respiratory muscles, since maximalhandgrip was comparable in the two groups.
low (1'=0.26, P<O.OI). In general, whole bodyanthropometric indices were bettercorrelated with MVC than with MEP.
TABLE III A comparison of the correlationcoefficients (r) between indices of generaland respiratory muscle function andanthropometric indices in the Indiansubjects.
Table III compares the anthropometriccorrelates of respiratory and general musclestrength in Indians. MVC and MEP weresignificantly correlated, although thestrength of the correlation was relatively
Table II compares anthropometricparameters, and general and respiratorymuscle strength in Indians and Tibetans. ATwo-way ANOVA indicated that theTibetans were significantly older than theIndians (P<O.OI). Height, weight and BMIwere comparable in the two groups. Chestcircumference and mid arm circumferencewere both greater in the Tibetans (P<O.OI)as was MEP (P<O.Ol). In contrast, maximalhand grip (MVC) was similar in thetwo groups. When the data of the twogroups was pooled to determine whatanthropometric parameters were bestcorrelated with MEP for both the groups,chest circumference emerged as thebest correlate of MEP (1'=0.43, P<O.OI)(Fig 1).
*=P<0.05, *"=P<O.Ol
DISCUSSION
Chronically undernourished subjects arecharacterised by sarcopenia, a reduction inmuscle mass (11). This reduction results indiminished hand grip strength, even whencorrected for local muscle area (11). Thereduction in muscle strength may be relatedto the effects of food deprivation on the ratesof protein synthesis and degradation inskeletal muscle (18) and on enzyme profiles(19). In addition, undernutrition is alsocharacterised by a preservation of Type I
Our data suggests that anthropometrycan explain only a small percentage of thevariance in MEP. This is in contrast withsome earlier data obtained in a westernpopulation (15), where body weight wasfound to be a significant predictor of MEP.In the earlier study, however, no attemptwas made to control for gender, althoughgender is an important determinant of MEP(5). Similarly, the low body weight subjectshad major illnesses resulting in relativelyrecent weight losses prior to the MEPmeasurements (15). Other variables thathave been shown to predict respiratorymuscle strength include age (6) andrespiratory parameters such as vitalcapacity (15, 16). Since vital capacity mayin part be determined by the level ofphysical training of the individu-al (17), thephysical activity level of the individual mayalso predict MEP. However, the inclusionof these predictor variables requires specialmeasurements which may not be availableat the bedside of a patient.
- 0.09
0.128
0.19*
0.19*
Maximal expiratorypressure (ME?)
0.33*"
0.41**
0.29**
0.41 **0.29**
Maximal voluntarycontraction (MVC)
MVC
Height
Weight
BMI
Chest eire.
440 Ukyab and Vaz
fibres, a selective atrophy of Type II fibresand an increased conversion of Type II toType I fibres (20). Acute starvation inrats is associated with a reduction In
diaphragmatic weight accompanied byreduced strength and endurance capacity(21). These findings have been confirmed innecroscopic studies in humans which haveindicated that diaphragmatic weight is alsoreduced in poorly nourished subjects (22).This reduction in muscle mass would havebeen expected to result In reducedrespiratory muscle strength. In order tocontrol for changes in anthropometry, wecompared undernourished subjects withanthropometrically similar underweightsubjects and found that MEP was lower inthe undernourished group. Assumingproportional diaphragmatic weights in thetwo groups based on body weight, the datawould suggest that the reduction in MEPin the undernourished group was not relatedto muscle mass but to some other factor.
The practical consequences of diminished respiratory muscle strength inundernourished subjects need to beevaluated prospectively. However, reducedMEP has been associated with reducedmaximal voluntary ventilation (15). It isconceivable, therefore, that the reduction inMEP may in part contribute to the reducedwork capacity described in undernourishedsubjects (23), since cardio-respiratory factorsare also operative in addition to skeletalmuscle factors in limiting whole bodyexercise (17).
The data also demonstrates that BMImatched Tibetans have greater MEP's thanIndians. The significantly higher chestcircumference in the Tibetans could have
Indian J Physiol Pharmacol 1999; 43(4)
resulted in the higher MEP in this group.The enhanced chest circumference in theTibetans is in keeping with earlierdescriptions of the anthropometry ofTibetans and other highland groups (24).The average residence of the Tibetans atthe monastery (altitude: -3000 ft.) was6.6 ± 1.0 yrs. The location of the priorresidence of the Tibetan monks was notascertained. This is a lacuna since chest sizeand shape is both genetically andenvironmentally determined (24). In thecase of the latter, lung growth is stimulatedby hypoxia in children born and raised athigh altitudes (25). It would be interestingto explore the possibility of enhanced MEPas an adaptation in native highlanders.Despite considerable research intorespiratory physiology at high altitudes (24),there is little information about the changesIn respiratory muscle strength.
Our data further demonstrates thatwhile respiratory and general musclestrength are correlated, the strength of thecorrelation is quite low. This suggests thatthe determinants of respiratory musclestrength and hand grip are considerablydifferent. This is not surprising given thatskeletal muscle is quite heterogeneous andthat the fibre composition varies in differentmuscle groups (17).
Limitations of the study: The dietary intakeof the undernourished and underweightgroups was not assessed in the presentstudy. The quality of the diet, especiallyprotein intakes is important in determiningmuscle strength (26). Earlier studies haveindicated that the energy intakes ofunderweight subjects similar to the groupin the present study are approximately 10
Indian J Physiol Pharmacol 1999; 43(4)
MJ/day as compared to -8.5 MJ/day for theundernourished subjects (27). Maintenanceof body weight at the same level in the twogroups, in the presence of differentialenergy intakes could only be achieved byeither greater physical activity or reducedmetabolic efficiency in the underweightsubjects. Differential physical activitypatterns resulting in differential levels ofaerobic fitness could thus conceivablyexplain the lower MEP's In theundernourished group of our study. It wouldtherefore be pertinent to evaluate the role
Maximal Expiratory Pressure 441
')f diet and habitual physical activity ascauses of the differences in undernourishedand underweight subjects.
ACKNOWLEDGEMENT
This study was funded by the ResearchSociety, St John's Medical College. TTUkyab was the recipient of an ICMRsummer studentship. The assistance of DrSumithra Muthayya and Ms Bronwyn Diffeyin the collection of anthropometric data onthe Tibetans is gratefully acknowledged.
REFERENCES
1. Black LF, Hyatt RE. Maximal respiratorypressures: normal values and relationship to ageand sex. Am Rev Respir Dis 1969; 99: 696-702.
2. Tobin MJ, Walsh JM. Respiratory neuromuscularfunction. In Tobin MJ, ed. Contemporarymanagement in Critical Care. RespiratoryMonitoring. New York, Churchill Livingstone 1991;137-162.
3. Sahebjami H. Dyspnea in obese healthy men. Chest1998; 114: 1373-1377.
4. Aldrich TK, Arora NS, Rochester DF. The influenceof airway obstruction and respiratory musclestrength on maximal voluntary ventilation in lungdisease. Am Rev Respir Dis 1982; 126: 195-199.
5. Maruthy KN, Vaz M. The development andvalidation of a digital peak respiratory pressuremonitor and its characteristics in healthy humansubjects. Indian J Physiol Pharmacol 1999; 43:186-192.
6. Berry JK, Vitalo CA, Larson JL, Patel M, Kim MJ.Respiratory muscle strength in older adults.Nursing Research 1996; 45: 154-159.
7. O'Donohue WJ Jr, Baker JP, Bell GM, Muren 0,Parker CL, Patterson JL Jr. Respiratory Failurein Neuromuscular Disease. Management in aRespiratory Intensive Care Unit. JAMA 1976; 235 :733-735.
8. Kuppuswamy B. Socio-economic Status Scale(Urban) Delhi: Manasayan, 1984.
9. Kurpad AV, Kulkarni RN, Shetty PS. Reducedthermoregulatory thermogenesis in undernutrition.Eur J Clin Nutr 1989; 43: 27-33.
10. Kulkarni RN, Kurpad AV, Shetty PS.Vascular adrenoceptor sensitivity to gradeddoses of noradrenaline infusions inundernourished subjects. Indian J Med Res 1988;88: 427-433.
11. Vaz M, Thangam S, Prabhu A, Shetty PS. Maximalvoluntary contraction as a functional indicator ofadult chronic undernutrition. Br J Nutr 1996; 76 :9-15.
12. Vaz M, Ukyab TT, Padmavathi R et al. Body fattopography in Indian and Tibetan males of low andnormal body mass index. Indian J PhysiolPharmacol 1999; 43: 179-185.
13. Lohman TG, Roche AF, Martorell R.Anthropometric standardisation reference manual.Champaign, Illinois: Human Kinetic Books, 1988.
14. Heymsfield SB, McManus C, Smith J, Stevens V,Nixon DW. Anthropometric measurement of musclearea. Am J Clin Nutr 1982; 36 : 680-690.
15. Arora NS, Rochester DF. Respiratory MuscleStrength and Maximal Voluntary Ventilation inUndernourished patients. Am Rev Respir Dis 1982;126: 5-8.
16. Leech JA, Ghezzo H, Stevens D, Becklake MR.Respiratory pressures and function in young adults.Am Rev Respir Dis 1983; 128: 17-23.
442 Ukyab and Vaz
17. Astrand P-O, Rodahl K. Textbook of WorkPhysiology. Physiological Basis of Exercise. NewYork, McGraw Hill Book Co 1986.
18. Li JB, Gold berg AL. Effects of food deprivation onprotein synthesis and degradation in rat skeletalmuscles. Am J Physiol 1976; 231 : 441-448.
19. Brooks BA, Goll DE, Peng Y-S, Greweling JA,Hennecke G. Effect of starvation and refeeding onactivity of a rodent protease in Skeletal muscle. JNut,. 1983; 113: 145-158.
20. Lopez J, Russell DM, Whitwell J et at. Skeletalmuscle function in malnutrition. Am J Clin Nutr1982; 36: 602-610.
21. Dureuil B, Vii res N, Veber B et al. Acutediaphragmatic changes induced by starvation inrals. Am J Clin Nutr 1989; 49: 738-744.
22. Arora NS, Rochester DF. Effect of body weight andmuscularity on human diaphragm musclemass, thickness and area. J Appl Physiol 1982; 52 :64-70.
Indian J Physiol Pharmacol 1999; 43(4)
23. Satyanarayana K, Naid u AN, NarasingaRao BS. Nutrition, physical work capacity andwork output. Indian J Med Res 1978; 68 (Supp!):88-93.
24. Monge C, Leon-Velarde F. Physiological adaptationto high altitude: Oxygen transport in mammalsand birds. Physiological Reuiews 1991; 71:1135-1172.
25. Case RM, Waterhouse JM. Human Physiology. Age,Stress, and the Environment. Oxford, OxfordUniversity Press 1994: 176.
26. Meredith CN, Frontera WR, O'Reilly KP, EvansWJ. Body composition in elderly men: Effect ofdietary modification during strength training. JAmGeriatric Soc 1992; 40: 155-162.
27. Kurpad AV, Kulkarni RN, Sheela ML, Shetty PS.Thermogenic responses to graded doses ofnoradrenaline in undernourished Indian malesubjects. Br J Nutr 1989; 61 : 201-208.