RESEARCH ARTICLE Characteristics of ammonia, acid gases, and PM 2.5 for three typical land-use types in the North China Plain Wen Xu 1 & Qinghua Wu 1 & Xuejun Liu 1 & Aohan Tang 1 & Anthony J. Dore 2 & Mathew R. Heal 3 Received: 18 April 2015 /Accepted: 19 October 2015 /Published online: 27 October 2015 # The Author(s) 2015. This article is published with open access at Springerlink.com Abstract Air pollution is one of the most serious environ- mental problems in China due to its rapid economic develop- ment alongside a very large consumption of fossil fuel, partic- ularly in the North China Plain (NCP). During the period 2011–2014, we integrated active and passive sampling methods to perform continuous measurements of NH 3 , HNO 3 , NO 2 , and PM 2.5 at two urban, one suburban, and two rural sites in the NCP. The annual average concentrations of NH 3 , NO 2 , and HNO 3 across the five sites were in the ranges 8.5–23.0, 22.2–50.5, and 5.5–9.7 μgm -3 , respectively, showing no significant spatial differences for NH 3 and HNO 3 but significantly higher NO 2 concentration at the urban sites. At each site, annual average concentrations of NH 3 and NO 2 showed increasing and decreasing trends, respectively, while there was no obvious trend in annual HNO 3 concentrations. Daily PM 2.5 concentrations ranged from 11.8 to 621.0 μgm -3 at the urban site, from 19.8 to 692.9 μgm -3 at the suburban site, and from 23.9 to 754.5 μgm -3 at the two rural sites, with more than 70 % of sampling days exceeding 75 μgm -3 . Concentrations of water-soluble ions in PM 2.5 ranked differently between the non-rural and rural sites. The three dominant ions were NH 4 + , NO 3 - , and SO 4 2- and mainly existed as (NH 4 ) 2 SO 4 , NH 4 HSO 4 , and NH 4 NO 3 , and their concentrations averaged 48.6±44.9, 41.2±40.8, and 49.6± 35.9 μgm -3 at the urban, suburban, and rural sites, respec- tively. Ion balance calculations indicated that PM 2.5 was neu- tral at the non-rural sites but acidic at the rural sites. Seasonal variations of the gases and aerosols exhibited different pat- terns, depending on source emission strength and meteorolog- ical conditions. Our results suggest that a feasible pathway to control PM 2.5 pollution in the NCP should target ammonia and acid gases together. Keywords Air pollution . Reactive N . PM 2.5 . Control strategies . Chemical characteristics . The North China Plain Introduction In China, the atmospheric environment has been greatly affected over recent decades by various anthropogenic factors, such as a dramatic economic rise, rapid industrial develop- ment, population growth, and construction and demolition projects. The increase of traffic flow is also of central impor- tance. As a consequence, complex air pollution events char- acterized by regional photochemical smog and haze occur frequently in many regions of China (Wang et al. 2014a), arousing increasing attention from the private citizen as well as environmental scientists and policy makers. The smog and haze largely result from high levels of particulate matter (PM), especially PM 2.5 (particular matter less than 2.5 μm), which limits atmospheric visibility by light extinction (absorption and scattering) (Sun et al. 2006; Wang et al. 2012a). Several studies focusing on health effects have revealed associations between PM pollution and morbidity and mortality, including Responsible editor: Philippe Garrigues Electronic supplementary material The online version of this article (doi:10.1007/s11356-015-5648-3) contains supplementary material, which is available to authorized users. * Xuejun Liu [email protected]1 College of Resources and Environmental Sciences, China Agricultural University, Beijing 100193, China 2 Centre for Ecology and Hydrology, Edinburgh, Bush Estate, Penicuik, Midlothian EH26 0QB, UK 3 School of Chemistry, The University of Edinburgh, David Brewster Road, Edinburgh EH9 3FJ, UK Environ Sci Pollut Res (2016) 23:1158–1172 DOI 10.1007/s11356-015-5648-3
Transcript
RESEARCH ARTICLE
Characteristics of ammonia, acid gases, and PM2.5 for threetypical land-use types in the North China Plain
Wen Xu1& Qinghua Wu1
& Xuejun Liu1& Aohan Tang1 & Anthony J. Dore2 &
Mathew R. Heal3
Received: 18 April 2015 /Accepted: 19 October 2015 /Published online: 27 October 2015# The Author(s) 2015. This article is published with open access at Springerlink.com
Abstract Air pollution is one of the most serious environ-mental problems in China due to its rapid economic develop-ment alongside a very large consumption of fossil fuel, partic-ularly in the North China Plain (NCP). During the period2011–2014, we integrated active and passive samplingmethods to perform continuous measurements of NH3,HNO3, NO2, and PM2.5 at two urban, one suburban, andtwo rural sites in the NCP. The annual average concentrationsof NH3, NO2, and HNO3 across the five sites were in theranges 8.5–23.0, 22.2–50.5, and 5.5–9.7 μg m−3, respectively,showing no significant spatial differences for NH3 and HNO3
but significantly higher NO2 concentration at the urban sites.At each site, annual average concentrations of NH3 and NO2
showed increasing and decreasing trends, respectively, whilethere was no obvious trend in annual HNO3 concentrations.Daily PM2.5 concentrations ranged from 11.8 to 621.0 μg m−3
at the urban site, from 19.8 to 692.9 μg m−3 at the suburbansite, and from 23.9 to 754.5 μg m−3 at the two rural sites, withmore than 70 % of sampling days exceeding 75 μg m−3.Concentrations of water-soluble ions in PM2.5 ranked
differently between the non-rural and rural sites. The threedominant ions were NH4
+, NO3−, and SO4
2− and mainlyexisted as (NH4)2SO4, NH4HSO4, and NH4NO3, and theirconcentrations averaged 48.6±44.9, 41.2±40.8, and 49.6±35.9 μg m−3 at the urban, suburban, and rural sites, respec-tively. Ion balance calculations indicated that PM2.5 was neu-tral at the non-rural sites but acidic at the rural sites. Seasonalvariations of the gases and aerosols exhibited different pat-terns, depending on source emission strength and meteorolog-ical conditions. Our results suggest that a feasible pathway tocontrol PM2.5 pollution in the NCP should target ammoniaand acid gases together.
Keywords Air pollution . Reactive N . PM2.5. Control
strategies . Chemical characteristics . The North China Plain
Introduction
In China, the atmospheric environment has been greatlyaffected over recent decades by various anthropogenic factors,such as a dramatic economic rise, rapid industrial develop-ment, population growth, and construction and demolitionprojects. The increase of traffic flow is also of central impor-tance. As a consequence, complex air pollution events char-acterized by regional photochemical smog and haze occurfrequently in many regions of China (Wang et al. 2014a),arousing increasing attention from the private citizen as wellas environmental scientists and policy makers. The smog andhaze largely result from high levels of particulate matter (PM),especially PM2.5 (particular matter less than 2.5 μm), whichlimits atmospheric visibility by light extinction (absorptionand scattering) (Sun et al. 2006; Wang et al. 2012a). Severalstudies focusing on health effects have revealed associationsbetween PM pollution and morbidity and mortality, including
Responsible editor: Philippe Garrigues
Electronic supplementary material The online version of this article(doi:10.1007/s11356-015-5648-3) contains supplementary material,which is available to authorized users.
in the USA (Doninici et al. 2014) and China (Guo et al. 2009;Wu et al. 2010). It has been estimated that 350,000–400,000premature deaths can be ascribed to ambient air pollution inChina, and the economic burden of premature mortality andmorbidity was conservatively estimated at approximately 157billion RMB (1.16 % of the GDP) in 2003 (Zhang and Smith2007; WB 2007).
Airborne PM2.5 can be directly emitted by anthropogenicsources or generated by gas-to-particle conversion (secondaryPM) (Watson 2002). The primary precursors for formation ofammonium sulfate (or bisulfate) and ammonium nitrate areNH3, SO2, and NOx (NO+NO2). Atmospheric NH3 is emittedprimarily from livestock wastes and volatilization of N fertil-izers. Other sources include biomass burning, excreta of hu-man and pets, and wastewater (Clarisse et al. 2009). NOx andSO2 are mainly derived from combustion processes and aresubsequently oxidized to HNO3 and H2SO4 in the atmosphere(Sharma et al. 2007).
In order to prevent further deterioration of air quality, Chinahas made tremendous efforts since 2005. For example, the11th Five-Year Plan (FYP) (2006–2010) for national environ-mental protection required the reduction of annual SO2 emis-sions in 2010 by 10 % from its 2005 level, which requiredinstallation of flue-gas desulfurization systems to coal-firedpower plants as a primary control measure and a strongervehicle emissions standard. As a consequence, national SO2
emissions decreased by 14.3 % from 2005 to 2010 (MEPC2011). In the 12th FYP (2011–2015), China is mainly focusedon the reduction of national NOx emissions by 10 % in 2015from the 2010 level, as well as controls on SO2 and primaryparticle emissions. To achieve this binding target, China’sMinistry of Environmental Protection (MEP) released a newBemission standard of air pollutants for thermal power plants^(GB 13223-2011) in 2011 to further strengthen the NOx con-trols. Furthermore, a stricter vehicle emissions standard(equivalent to the European Union’s Euro IV standard) wasalso released in late 2012. Unfortunately, legislation to simul-taneously reduce NH3 emissions has not been implemented inChina. Such legislation is urgently needed given that the esti-mated health costs associated with NH3 emissions were great-er than those associated with NOx emissions in more than77 % of provinces in China, particularly in the North ChinaPlain (NCP) (Gu et al. 2014).
The NCP is an intensively managed agricultural and eco-nomically developed region, which comprises only 8 % of thetotal area of China but contributes 40 % of the total nationalGDP (CSY 2014). The consumption of N fertilizer and energyin the NCP accounted for 35 and 34 % of their respective totalnational consumption (CSY 2014). This makes the NCP oneof the greatest emitters of air pollutants (e.g., NH3, NOx, andSO2) nationally and globally (Clarisse et al. 2009; Zhang et al.2009; Gu et al. 2012; Huang et al. 2012) and a serious PM2.5
pollution region in China (Wang et al. 2014b). Some studies
have focused on the measurements of atmospheric NO2 andNH3 at various sites in the NCP (Shen et al. 2009, 2011; Menget al. 2011; Pan et al. 2012; Luo et al. 2013) and on estimatingof emissions of NO2 and NH3 from anthropogenic sources(Zhang et al. 2010, 2011b). Very few studies in the NCP haveconsidered ambient HNO3 measurements (Shen et al. 2009;Luo et al. 2013). PM2.5 has been systematically analyzed inmany studies in the NCP. Most of the studies have providedthe general characteristics of the chemical compositions ofPM2.5 and discussed its seasonal variations, correlations, orsources (Sun et al. 2004; Song et al. 2006). Additionally, theconcentration, correlations, sources, or formation of some spe-cific species (e.g., inorganic ions, carbonaceous components,or organic matter) and their spatial variations have been inves-tigated in the NCP (Ianniello et al. 2011; Zhao et al. 2013; Huet al. 2014). However, few studies have measured NOx, NH3,HNO3, and PM2.5 simultaneously. In addition, previous workhas mainly included short-term studies before the year 2010and has been limited to single land-use types (e.g., urbanareas). In the absence of long-term and simultaneous observa-tions, the characteristics of these air pollutants and their im-plications cannot be determined accurately.
In the present study, ambient NOx, NH3, and HNO3 werecontinuously monitored at five typical sites (two urban, onesuburban, and two rural) in the NCP during the period 2011–2014, and PM2.5 was sampled at four of the five sites. Theobjectives of this study were (1) to characterize spatial, sea-sonal, and annual variations of concentrations for the mea-sured gases and evaluate their pollution status during the pe-riod from 2011 to 2014 and (2) to analyze the concentrationsand seasonal variations of PM2.5 and its secondary inorganiccomponents over different land-use types. The intention of thestudy was to provide accurate and current insight into thecharacteristics of air pollutants and to support interpretationof the effectiveness of major national control policies imple-mented recently in the NCP.
Materials and methods
Sampling sites
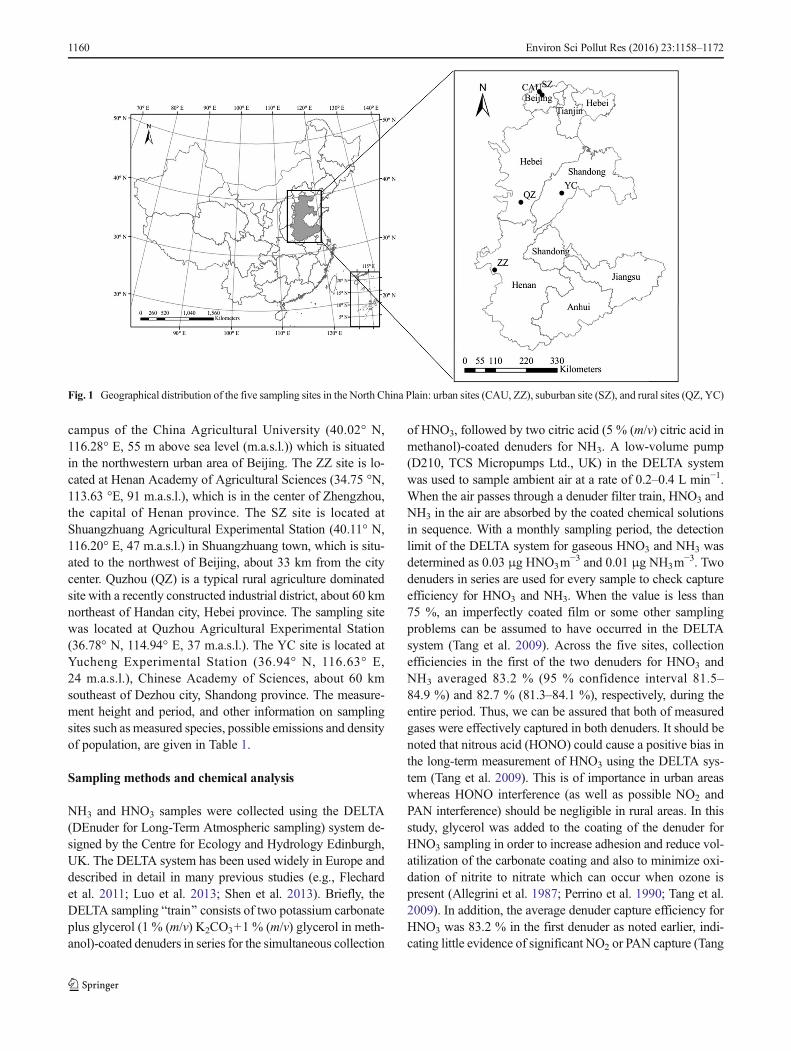
Sampling was conducted between January 2011 and Decem-ber 2014 at five sites in Beijing and in Henan, Shandong, andHebei provinces (Fig. 1), which are located in the North ChinaPlain. The area has a typical temperate and monsoonal climatewith dry winters and wet summers. The prevailing wind di-rection is from the southeast in the summer and northwest inthe winter.
Two urban sites were at the China Agricultural University(CAU) and Zhengzhou (ZZ), a suburban site was atShangzhuang (SZ), and two rural sites were at Quzhou (QZ)and Yucheng (YC). The CAU site is located at the west
Environ Sci Pollut Res (2016) 23:1158–1172 1159
campus of the China Agricultural University (40.02° N,116.28° E, 55 m above sea level (m.a.s.l.)) which is situatedin the northwestern urban area of Beijing. The ZZ site is lo-cated at Henan Academy of Agricultural Sciences (34.75 °N,113.63 °E, 91 m.a.s.l.), which is in the center of Zhengzhou,the capital of Henan province. The SZ site is located atShuangzhuang Agricultural Experimental Station (40.11° N,116.20° E, 47 m.a.s.l.) in Shuangzhuang town, which is situ-ated to the northwest of Beijing, about 33 km from the citycenter. Quzhou (QZ) is a typical rural agriculture dominatedsite with a recently constructed industrial district, about 60 kmnortheast of Handan city, Hebei province. The sampling sitewas located at Quzhou Agricultural Experimental Station(36.78° N, 114.94° E, 37 m.a.s.l.). The YC site is located atYucheng Experimental Station (36.94° N, 116.63° E,24 m.a.s.l.), Chinese Academy of Sciences, about 60 kmsoutheast of Dezhou city, Shandong province. The measure-ment height and period, and other information on samplingsites such as measured species, possible emissions and densityof population, are given in Table 1.
Sampling methods and chemical analysis
NH3 and HNO3 samples were collected using the DELTA(DEnuder for Long-Term Atmospheric sampling) system de-signed by the Centre for Ecology and Hydrology Edinburgh,UK. The DELTA system has been used widely in Europe anddescribed in detail in many previous studies (e.g., Flechardet al. 2011; Luo et al. 2013; Shen et al. 2013). Briefly, theDELTA sampling Btrain^ consists of two potassium carbonateplus glycerol (1 % (m/v) K2CO3+1 % (m/v) glycerol in meth-anol)-coated denuders in series for the simultaneous collection
of HNO3, followed by two citric acid (5 % (m/v) citric acid inmethanol)-coated denuders for NH3. A low-volume pump(D210, TCS Micropumps Ltd., UK) in the DELTA systemwas used to sample ambient air at a rate of 0.2–0.4 L min−1.When the air passes through a denuder filter train, HNO3 andNH3 in the air are absorbed by the coated chemical solutionsin sequence. With a monthly sampling period, the detectionlimit of the DELTA system for gaseous HNO3 and NH3 wasdetermined as 0.03 μg HNO3m
−3 and 0.01 μg NH3m−3. Two
denuders in series are used for every sample to check captureefficiency for HNO3 and NH3. When the value is less than75 %, an imperfectly coated film or some other samplingproblems can be assumed to have occurred in the DELTAsystem (Tang et al. 2009). Across the five sites, collectionefficiencies in the first of the two denuders for HNO3 andNH3 averaged 83.2 % (95 % confidence interval 81.5–84.9 %) and 82.7 % (81.3–84.1 %), respectively, during theentire period. Thus, we can be assured that both of measuredgases were effectively captured in both denuders. It should benoted that nitrous acid (HONO) could cause a positive bias inthe long-term measurement of HNO3 using the DELTA sys-tem (Tang et al. 2009). This is of importance in urban areaswhereas HONO interference (as well as possible NO2 andPAN interference) should be negligible in rural areas. In thisstudy, glycerol was added to the coating of the denuder forHNO3 sampling in order to increase adhesion and reduce vol-atilization of the carbonate coating and also to minimize oxi-dation of nitrite to nitrate which can occur when ozone ispresent (Allegrini et al. 1987; Perrino et al. 1990; Tang et al.2009). In addition, the average denuder capture efficiency forHNO3 was 83.2 % in the first denuder as noted earlier, indi-cating little evidence of significant NO2 or PAN capture (Tang
Fig. 1 Geographical distribution of the five sampling sites in the North China Plain: urban sites (CAU, ZZ), suburban site (SZ), and rural sites (QZ, YC)
1160 Environ Sci Pollut Res (2016) 23:1158–1172
et al. 2009). Nevertheless, measured HNO3 concentrationsmay be overestimated to some extent at the urban CAU sitebut could reflect actual levels at suburban and rural sites. Infuture work, HNO3 should be selectively removed from thesampling air by first using a sodium fluoride or sodiumfluoride-coated denuder as widely used in previous studies(Allegrini et al. 1987; Spataro et al. 2013). For NH3 sampling,Perrino and Gherardi (1999) have highlighted that in the caseof citric acid, about 8 % of the collected ammonia was re-leased after 2 h and more than 40 % after 12 h. In contrast,phosphorous acid is a suitable coating layer for a denuder lineintended to determine gaseous ammonia in the atmosphere(Perrino and Gherardi 1999). However, an intercomparisonstudy conducted by Tang et al. (2009) showed that the 14-day mean NH3 concentration from citric acid-coated denudersof a DELTA system was about 9 % lower than that fromH3PO3-coated denuders of an Annular Denuder System.Given this, together with an overall 82.7 % NH3 capture effi-ciency as noted earlier, NH3 concentrations sampled at the fivesites should be reasonable and acceptable, albeit with somedegree of underestimation.
NO2 samples were collected by Gradko diffusion tubes(Gradko International Limited, UK). Each sampler consistsof a 71.0-mm long×11.0-mm internal diameter acrylic tubewith colored and white thermoplastic rubber caps. Three NO2
samplers at each site were exposed under a PVC shelter whichprotected the samplers from precipitation and direct sunshine.The NO2 was absorbed into a 20 % triethanolamine/deionizedwater solution coated onto two stainless steel wire mesheswithin the colored cap. As indicated by the manufacturer(Gradko International Ltd, UK), the uptake rate of the tubeis 68.8×10⁻⁶ m−3 h−1, the desorption efficiency is 0.98, thelimit of detection is 1.6 μg NO2m
−3 over a 2-week exposureperiod, and the analytical expanded measurement uncertaintyis ±10 %. Over the entire period, the standard deviations ofeach sampling across all sites ranged from 0.01 to 2.9 μg NO2
m−3 and averaged 0.8 μg NO2m−3 (95 % confidence interval
0.7–0.9).All the samplers were exposed for 1 month at each site and
returned to the laboratory for analysis. In the laboratory, all theexposed samples were stored at 4 °C and analyzed at 1-monthintervals. The HNO3 denuders were extracted with 10 mL0.05%H2O2 solution. The NH3 denuders were extracted with10 mL high-purity water. Ammonium and nitrate in the ex-tracted solutions were measured with an AA3 continuous-flow analyzer (Bran+Luebbe GmbH, Norderstedt, Germany).The detection limits were determined as 0.01 mg N L−1 forNH4
+ and NO3−. The meshes from the NO2 diffusion tubes
were extracted with a solution containing sulfanilamide,H3PO4, and N-1-naphthylethylene-diamine, and the NO2 con-tent in the extract determined using a colorimetric method byabsorption at a wavelength of 542 nm. The detection limit forNO2 was 0.01 mg N L−1. The laboratory and field blankT
samples were extracted and analyzed using the same methodsas the exposed samples. After correcting for the correspondingblanks, the results were used for the calculation ofconcentrations for all measured gases.
Samples of PM2.5 were collected by medium-volumesamplers (TH-150CIII, 100 L min−1, Tianhong Co., Wuhan,China) onto 90-mm quartz fiber filters (Whatman QM/A,Maidstone, UK) at all sites except ZZ because only four par-ticle samplers were available. The quartz fiber filters werebaked at 500 °C for 4 h prior to sampling to remove contam-inants. The PM2.5 samples were collected on a 24 hourly basisfrom 08:00 hours to 08:00 hours the next day. More than 25valid samples were obtained for most seasons during the sam-pling period at each site. Owing to precipitation or occasionalsampler failure, a number of seasons have less than 20samples.
Before and after sampling, the filters were equilibrated for24 h in a desiccator at 25 °C and 40±5 % relative humidityand then weighed with a microbalance (Sartorius, precision10 μg). The PM2.5 concentrations were calculated by weightdifferences divided by sampling air flows. A quarter of eachfilter was put into a 50-mL beaker with 10 mL of high-puritywater (18.2 MΩ resistivity). After a 30-min ultrasonic extrac-tion, the extracts were filtered using 0.22-μm syringe filters,and the filtrates were stored in clean tubes at 4 °C until ana-lyzed within 1 month of extraction. The cations (NH4
+, Na+,Ca2+, K+, Mg2+) and anions (NO3
−, SO42−, F−, Cl−) in the
filtrates were determined by Dionex-600 and Dionex-2100Ion Chromatograph (Dionex Inc., Sunnyvale, CA, USA), re-spectively. Details of the instruments and detection limits havebeen provided elsewhere (Zhang et al. 2011a; Tao et al. 2014).Field blank measurements were made each month or eachseason at all sites.
Meteorological data
Hourly wind speed (WS), temperature (T), relative humidity(RH), and daily precipitation for each site for 2011–2014 weretaken from Weather Underground (http://www.underground.com/). The monthly and annual WS, T, RH and precipitationare respectively displayed in Fig. S1 and Table S1 in theSupplementary Information (SI). Year-to-year variations inall meteorological parameters were not significant at each site(all p>0.05) except RH for CAU, SZ, and QZ.
Statistical analyses
One-way analysis of variance (ANOVA) and paired-sample ttests were used to decide the significance of the differences inannual average gas (i.e., NH3, NO2, and HNO3) concentra-tions and annual average meteorological data among sites oryears, as well as daily average PM2.5 concentrations amongseasons at each site. Pearson correlation and linear regression
analyses were conducted for the water-soluble inorganic ionsin PM2.5. All statistical analyses were performed using SPSS11.5 (SPSS Inc., Chicago, IL, USA), and significance wasdefined as p<0.05.
Results and discussion
Spatial and annual variations of NH3, NO2, and HNO3
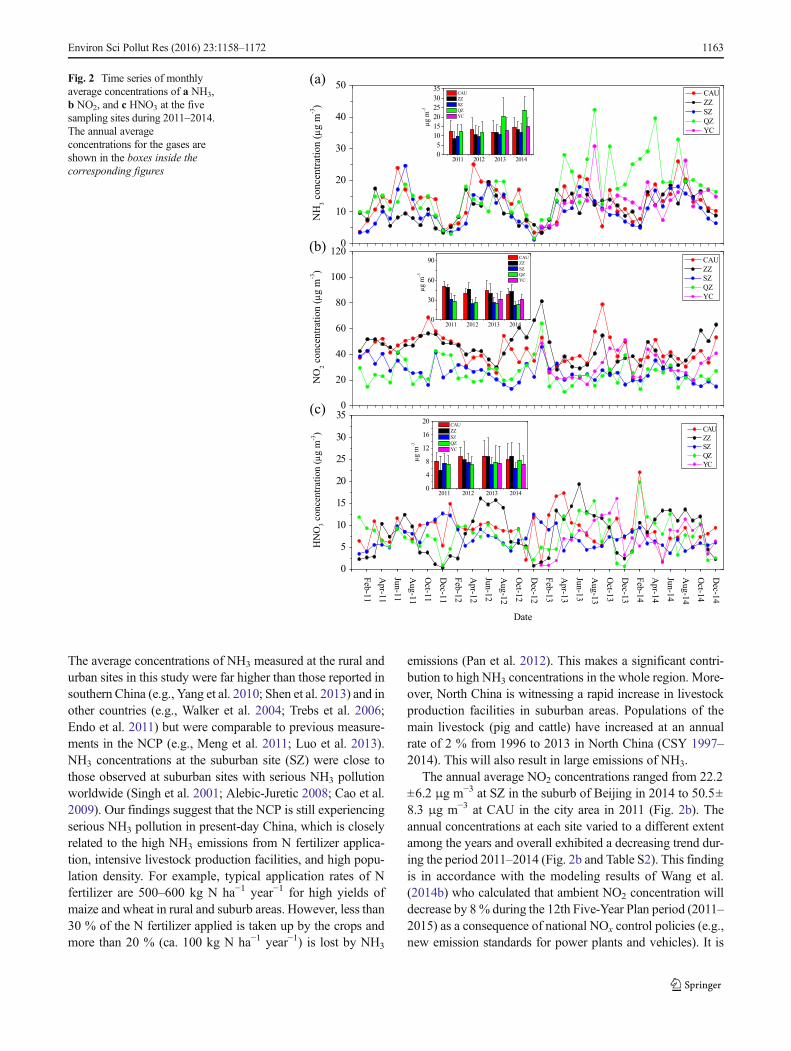
Monthly mean concentrations of NH3, NO2, and HNO3 at thefive sites are shown in Fig. 2. The concentrations of NH3,NO2, and HNO3 across all sites were in the ranges of 1.2–42.3, 10.6–81.3, and 0.3–22.1 μg m−3, respectively. Theirconcentrations varied greatly across sites for all measured gas-es. The annual mean concentrations of NH3, NO2, and HNO3
at the five sites for the years between 2011 and 2014 are alsopresented in Fig. 2. The annual NH3 concentrations variedfrom 8.5±3.7 μg m−3 at ZZ in 2011 to 23.7±7.2 μg m−3 atQZ in 2014 (Fig. 2a). The year-to-year variations in annualconcentrations of NH3 were sometimes significant at all sitesexcept CAU and YC (details are given in Table S2). However,it is important to note that annual NH3 levels show a slightincreasing trend at the five sites. This finding is consistentwith the increasing trend of NH3 emissions during recentyears in the NCP due to intensified agricultural activities(Zhang et al. 2010, 2011b). The largest annual mean NH3
concentration was observed at QZ (16.9±5.9 μg m−3), follow-ed by YC (13.8±1.5 μg m−3), CAU (13.1±1.0 μg m−3), ZZ(11.1±2.0 μg m−3), and SZ (10.5±1.1 μg m−3) (Fig. S2). Thisis likely due to the fact that QZ is a typical agricultural ruralsite with excessive N fertilizer input (about 500–600 kg N ha−1 year−1) over a large amount of agricultural land(75 % of the total land), which is the main source of NH3
(Clarisse et al. 2009). However, the difference in the annualNH3 concentrations during 2011–2014 across the five siteswas not significant. High NH3 concentration in urban areasis associated with NH3 emissions from biological sources,such as humans, sewage systems, and garbage containers(Reche et al. 2002). NH3 is a secondary pollutant in gasolinevehicle emissions that results from the reaction which occursin the catalytic converter between NO and H (Moeckli et al.1996). Between 2006 and 2013, the number of civil vehiclesincreased from 2.39 to 5.17 million in Beijing and from 0.46to 1.72 million in Zhengzhou (CSY 2007–2014), which couldresult in elevated NH3 emissions. In addition, large cities inChina (e.g., Beijing and Zhengzhou) can receive large amountof agricultural NH3 from the suburban areas (Gu et al. 2014;Xu et al. 2014). In the present study, annual NH3 concentra-tions at the five sites were 4~11 times higher than the annualbackground atmospheric NH3 in North China (ca. 2.1 μg m
−3)reported by Meng et al. (2010). NH3 levels at different urban,suburban, and rural sites in the world are listed in Table S3.
The average concentrations of NH3 measured at the rural andurban sites in this study were far higher than those reported insouthern China (e.g., Yang et al. 2010; Shen et al. 2013) and inother countries (e.g., Walker et al. 2004; Trebs et al. 2006;Endo et al. 2011) but were comparable to previous measure-ments in the NCP (e.g., Meng et al. 2011; Luo et al. 2013).NH3 concentrations at the suburban site (SZ) were close tothose observed at suburban sites with serious NH3 pollutionworldwide (Singh et al. 2001; Alebic-Juretic 2008; Cao et al.2009). Our findings suggest that the NCP is still experiencingserious NH3 pollution in present-day China, which is closelyrelated to the high NH3 emissions from N fertilizer applica-tion, intensive livestock production facilities, and high popu-lation density. For example, typical application rates of Nfertilizer are 500–600 kg N ha−1 year−1 for high yields ofmaize and wheat in rural and suburb areas. However, less than30 % of the N fertilizer applied is taken up by the crops andmore than 20 % (ca. 100 kg N ha−1 year−1) is lost by NH3
emissions (Pan et al. 2012). This makes a significant contri-bution to high NH3 concentrations in the whole region. More-over, North China is witnessing a rapid increase in livestockproduction facilities in suburban areas. Populations of themain livestock (pig and cattle) have increased at an annualrate of 2 % from 1996 to 2013 in North China (CSY 1997–2014). This will also result in large emissions of NH3.
The annual average NO2 concentrations ranged from 22.2±6.2 μg m−3 at SZ in the suburb of Beijing in 2014 to 50.5±8.3 μg m−3 at CAU in the city area in 2011 (Fig. 2b). Theannual concentrations at each site varied to a different extentamong the years and overall exhibited a decreasing trend dur-ing the period 2011–2014 (Fig. 2b and Table S2). This findingis in accordance with the modeling results of Wang et al.(2014b) who calculated that ambient NO2 concentration willdecrease by 8 % during the 12th Five-Year Plan period (2011–2015) as a consequence of national NOx control policies (e.g.,new emission standards for power plants and vehicles). It is
0
10
20
30
40
50
NH
3 c
on
cen
trat
ion
(µg
m-3)
CAU
ZZ
SZ
QZ
YC
2011 2012 2013 20140
5
10
15
20
25
30
35
µg m
- 3
CAU
ZZ
SZ
QZ
YC
0
20
40
60
80
100
120
NO
2 c
on
cen
trat
ion
(µg
m-3
)
CAU
ZZ
SZ
QZ
YC
2011 2012 2013 20140
30
60
90
µ g m
-3
CAU
ZZ
SZ
QZ
YC
Feb
-11
Apr-1
1
Jun-1
1
Aug-1
1
Oct-1
1
Dec-1
1
Feb
-12
Apr-1
2
Jun-1
2
Aug-1
2
Oct-1
2
Dec-1
2
Feb
-13
Apr-1
3
Jun-1
3
Aug-1
3
Oct-1
3
Dec-1
3
Feb
-14
Apr-1
4
Jun-1
4
Aug-1
4
Oct-1
4
Dec-1
4
0
5
10
15
20
25
30
35
HN
O3 c
on
cen
trat
ion
(µg
m-3
) CAU
ZZ
SZ
QZ
YC
2011 2012 2013 20140
4
8
12
16
20µg
m-3
CAU
ZZ
SZ
QZ
YC
Date
(a)
(b)
(c)
Fig. 2 Time series of monthlyaverage concentrations of a NH3,b NO2, and c HNO3 at the fivesampling sites during 2011–2014.The annual averageconcentrations for the gases areshown in the boxes inside thecorresponding figures
Environ Sci Pollut Res (2016) 23:1158–1172 1163
interesting to observe that the year-to-year variation exhibitedthe same characteristic at CAU and SZ, i.e., monthly meanvalues were significantly lower (p<0.05) in 2014 than in 2011but were not significantly different (p>0.05) between otheryears (Table S2). This result suggests that NO2 produced inthe area of the urban site can greatly affect NO2 concentrationat the suburban site. As for inter-site comparisons, annual NO2
concentrations at the urban sites (CAU and ZZ, average 43.9±1.0 μg m−3) were significantly higher (p<0.05) than those atthe rural and suburban sites (QZ, YC, and SZ, average 27.5±3.2μgm−3). Differences in annual average values between thesuburban and rural sites were not significant (p>0.05)(Fig. S2). It is commonly accepted that NO2 is a ubiquitousair pollutant in urban regions derived mainly from fossil fuelcombustion processes including power plants, transportation,and industry (Streets et al. 2003). The background concentra-tion of atmospheric NO2 was only about 3.7 μg m
−3 in NorthChina (Meng et al. 2010). In the present study, annual NO2
concentrations at the rural sites (23.2–31.4 μg m−3) were low-er than those obtained in a rural area with serious NO2 pollu-tion in eastern China (average 42 μg m−3) (Yang et al. 2010)but were much greater than those obtained in the studies ofAas et al. (2007) and Shen et al. (2013) at several rural sites insouth China (Table S3), and exceed (or are close to) the annualmean NO2 guideline value of 30 μg m−3 set by the WorldHealth Organization (WHO 2000). Annual NO2 concentra-tions at the urban sites (38.3–50.5 μg m−3) exceeded theWHO guideline and mostly exceeded the Chinese annual ex-posure limit for humans of 40 μg m−3 for NO2 (MEPC 2012).Compared to urban sites in other studies (Table S3), the urbanNO2 concentrations in this study were similar to those obtain-ed at most capital cities reported byWang et al. (2014b) for theperiod of 2013–2014 in China and were higher than valuesreported for Thessaloniki, Greece (Anatolaki and Tsitouridou2007). Combining these findings, we conclude that manylarge cities in China, and rural and suburban regions in theNCP, are suffering from serous NO2 pollution, which mainlyresults from high NOx emission from the construction of newpower plants and the rapid increase of vehicle numbers. Ac-cording to Wang and Hao (2012), China increased its thermalpower generation by 195 % and vehicle production by 300 %during 2000–2010 and NOx emissions from power plants andtransport increased by over 100 and 200 %, respectively, overthe same period. The increased NO2 emissions from newlybuilt large power plants in North China can even be observedby satellite (Wang et al. 2012b).
NH3 and NO2 are two primary reactive N species in airwhich mainly come from human activity. The monthly meanmolar ratio of NH3 to NO2 were in the ranges of 0.11–1.92 atthe urban sites (CAU and ZZ), 0.15–2.55 at the suburban site,and 0.11–7.38 at the rural sites (QZ and YC), with overallannual values of 0.81, 1.19, and 1.74, respectively (Fig. S3).These results indicate that the concentrations of gaseous N
compounds in the air are predominantly influenced by fossilfuel combustion in urban areas and by agricultural activity innon-urban areas.
In contrast to NH3 and NO2, the annual mean concentra-tions of HNO3 at the five sites were lower and less variable,ranging from 5.5±4.1 μg m−3 (at ZZ in 2011) to 9.7±4.5 μg m−3 (at CAU in 2014) (Fig. 2c). The year-to-yearvariation in annual averages was comparatively small at eachsite except that ZZ and SZ showed a significant difference(p<0.05) in monthly mean values between 2014 and 2011and 2012, respectively (Table S2). Annual HNO3 concentra-tions were not significantly different (p>0.05) among the fivesites, with mean values of 8.9, 8.3, 7.1, 7.6, and 7.3 μg m−3 atCAU, ZZ, SZ, QZ, and YC, respectively (Fig. S2). This find-ing is not surprising because HNO3 is produced through manypathways in the atmosphere, including photooxidation of NO2
with OH, reaction of NO3 with VOC, hydrolysis of N2O5, anddissociation of NH4NO3 aerosol (Khoder 2002). The fate ofHNO3 is controlled by the reaction with NH3, which is influ-enced by ambient temperature, relatively humidity, and NH3
concentrations (Sharma et al. 2007). Therefore, the absence ofsignificant spatial difference of HNO3 in this study is likelylinked to the differences among sites in the extent of oxidationof NO2, the contribution from other sources, and the ratio ofHNO3 and NH3. For example, the correlations betweenmonthly mean concentrations of NO2 and HNO3 were notsignificant at each site except for a significantly negative cor-relation for ZZ (Fig. S4). Moreover, NH3 and HNO3 werefound to be highly positively corrected at ZZ, QZ, and YC(Fig. S5), suggesting that dissociation of NH4NO3 is the im-portant contributor for the ambient HNO3. Average HNO3
concentrations in this study were comparable to those mea-sured at two sites in the NCP reported by Luo et al. (2013) butmuch higher than those observed at three sites in south China(Shen et al. 2013) and at many sites worldwide (e.g., Endoet al. 2011; Trebs et al. 2006) (Table S3). The NCP has someof the highest air pollution in China due to the large amountsof coal combustion for industry and power plants and residen-tial heating leading to high HNO3 concentrations from oxida-tion of NO2.
Seasonal variation of gaseous NH3, NO2, and HNO3
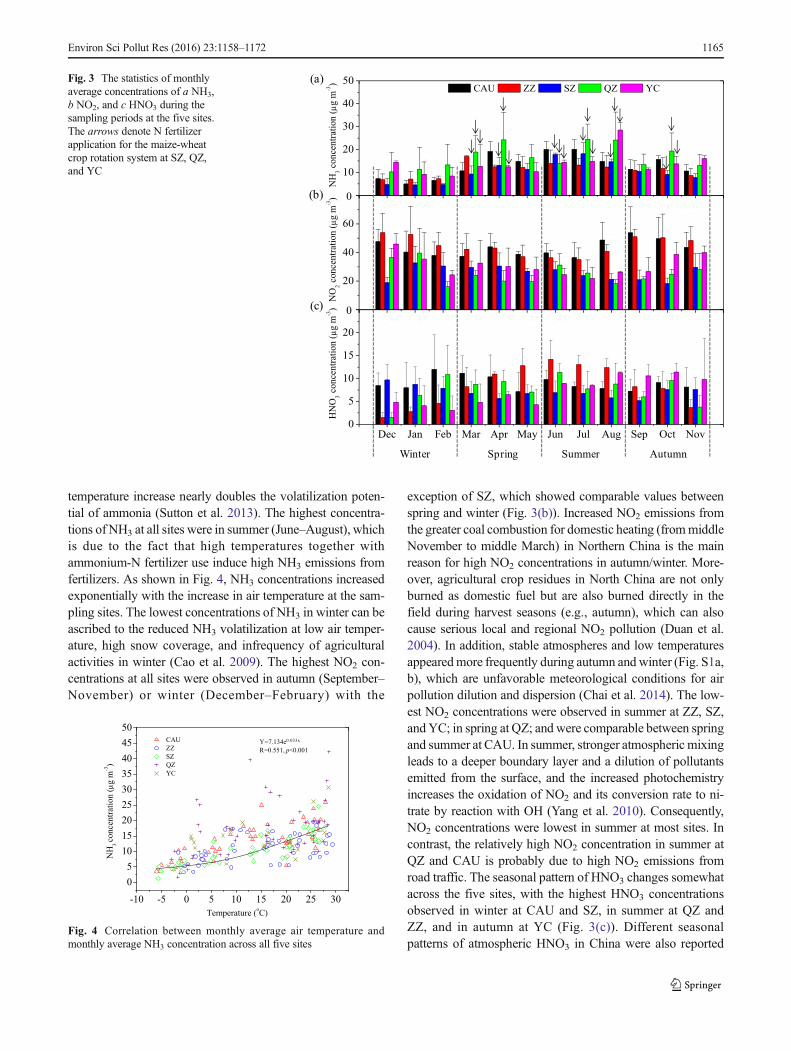
The seasonal concentrations of NH3, NO2, and HNO3 aredependent on their source strength and meteorological condi-tions. Figure 3 shows the monthly statistics of NH3, NO2, andHNO3 concentrations, averaged over the 4-year period, mea-sured at the five sites (2-year observation at YC). NH3 con-centrations across all sites were higher in March or April,especially at the rural sites (Fig. 3(a)). This can be partly ex-plained by the enhanced NH3 emission from natural and ag-ricultural sources and city garbage, caused by the abrupt tem-perature increase after winter (Fig. S1a); every 5 °C
1164 Environ Sci Pollut Res (2016) 23:1158–1172
temperature increase nearly doubles the volatilization poten-tial of ammonia (Sutton et al. 2013). The highest concentra-tions of NH3 at all sites were in summer (June–August), whichis due to the fact that high temperatures together withammonium-N fertilizer use induce high NH3 emissions fromfertilizers. As shown in Fig. 4, NH3 concentrations increasedexponentially with the increase in air temperature at the sam-pling sites. The lowest concentrations of NH3 in winter can beascribed to the reduced NH3 volatilization at low air temper-ature, high snow coverage, and infrequency of agriculturalactivities in winter (Cao et al. 2009). The highest NO2 con-centrations at all sites were observed in autumn (September–November) or winter (December–February) with the
exception of SZ, which showed comparable values betweenspring and winter (Fig. 3(b)). Increased NO2 emissions fromthe greater coal combustion for domestic heating (frommiddleNovember to middle March) in Northern China is the mainreason for high NO2 concentrations in autumn/winter. More-over, agricultural crop residues in North China are not onlyburned as domestic fuel but are also burned directly in thefield during harvest seasons (e.g., autumn), which can alsocause serious local and regional NO2 pollution (Duan et al.2004). In addition, stable atmospheres and low temperaturesappearedmore frequently during autumn and winter (Fig. S1a,b), which are unfavorable meteorological conditions for airpollution dilution and dispersion (Chai et al. 2014). The low-est NO2 concentrations were observed in summer at ZZ, SZ,and YC; in spring at QZ; and were comparable between springand summer at CAU. In summer, stronger atmospheric mixingleads to a deeper boundary layer and a dilution of pollutantsemitted from the surface, and the increased photochemistryincreases the oxidation of NO2 and its conversion rate to ni-trate by reaction with OH (Yang et al. 2010). Consequently,NO2 concentrations were lowest in summer at most sites. Incontrast, the relatively high NO2 concentration in summer atQZ and CAU is probably due to high NO2 emissions fromroad traffic. The seasonal pattern of HNO3 changes somewhatacross the five sites, with the highest HNO3 concentrationsobserved in winter at CAU and SZ, in summer at QZ andZZ, and in autumn at YC (Fig. 3(c)). Different seasonalpatterns of atmospheric HNO3 in China were also reported
0
20
40
60
80
NO
2 con
cent
ratio
n (
g m
-3)
CAU ZZ SZ QZ YC
0
10
20
30
40
50
NH
3 con
cent
ratio
n (
g m
-3)
Dec Jan Feb Mar Apr May Jun Jul Aug Sep Oct Nov0
5
10
15
20
25
HN
O3 c
once
ntra
tion
(g
m-3
)
0
0
Winter Spring Summer Autumn
(a)
(b)
(c)
µµ
µ
Fig. 3 The statistics of monthlyaverage concentrations of a NH3,b NO2, and c HNO3 during thesampling periods at the five sites.The arrows denote N fertilizerapplication for the maize-wheatcrop rotation system at SZ, QZ,and YC
-10 -5 0 5 10 15 20 25 30
0
5
10
15
20
25
30
35
40
45
50 CAU
ZZ
SZ
QZ
YC
NH
3 co
nce
ntr
atio
n (µ g
m-3
)
Temperature (oC)
Y=7.134e0.033x
R=0.551, p<0.001
Fig. 4 Correlation between monthly average air temperature andmonthly average NH3 concentration across all five sites
Environ Sci Pollut Res (2016) 23:1158–1172 1165
in previous studies (Li et al. 2013; Luo et al. 2013; Shen et al.2013).
Mass concentrations of PM2.5 and water-soluble ions
Table 2 presents the summary statistics for daily averagePM2.5 concentrations during the sampling periods at the foursites. The concentrations of PM2.5 were in the range 11.8–621.0, 19.8–692.9, 23.9–754.5, and 27.9–455.0 μg m−3 atCAU, SZ, QZ, and YC, respectively (data for each seasonper site during the sampling period are provided inTable S4). Daily average PM2.5 concentrations were not sig-nificantly different between the sites with the exception ofsignificantly higher PM2.5 concentrations at CAU than atSZ. The average PM2.5 concentration at the urban site(CAU, 159.4 μg m−3) was comparable to the annual meanvalue of 123.5 μg m−3 in 2009/2010 in the urban area ofBeijing (Zhao et al. 2013). Also, the average daily PM2.5 con-centration at the suburban (SZ, 141.5 μg m−3) and rural(153.9 μg m−3 at QZ and 141.8 μg m−3 at YC) sites wassimilar to those obtained at sites with corresponding land-use types in the NCP (Shen et al. 2011). The daily averagePM2.5 concentration was a factor of 2.1 (95 % confidenceinterval 1.99–2.25), 1.9 (1.72–2.04), 2.1 (1.89–2.21), and1.9 (1.75–2.03) greater than the Chinese Grade II standardfor daily PM2.5 concentration (75 μg m−3, MEPC 2012) atCAU, SZ, QZ, and YC, respectively. When compared to theWHO guideline for daily PM2.5 concentration (25 μg m−3,WHO 2005), the ratios were even higher, being 6.4 (5.99–6.76) at CAU, 5.7 (5.18–6.14) at SZ, 6.2 (5.67–6.64) at QZ,and 5.7 (5.24–6.11) at YC. More than 70 % of the samplingdays had daily average PM2.5 concentration above the ChineseGrade II standard at the four sites, especially at YC (94 %).Compared with the WHO standard for daily average PM2.5,
almost all (>98 %) of the daily PM2.5 concentration exceededthe standard. Obviously, severe PM2.5 pollution not onlyexisted in the urban area but also in suburban and rural areasin the NCP.
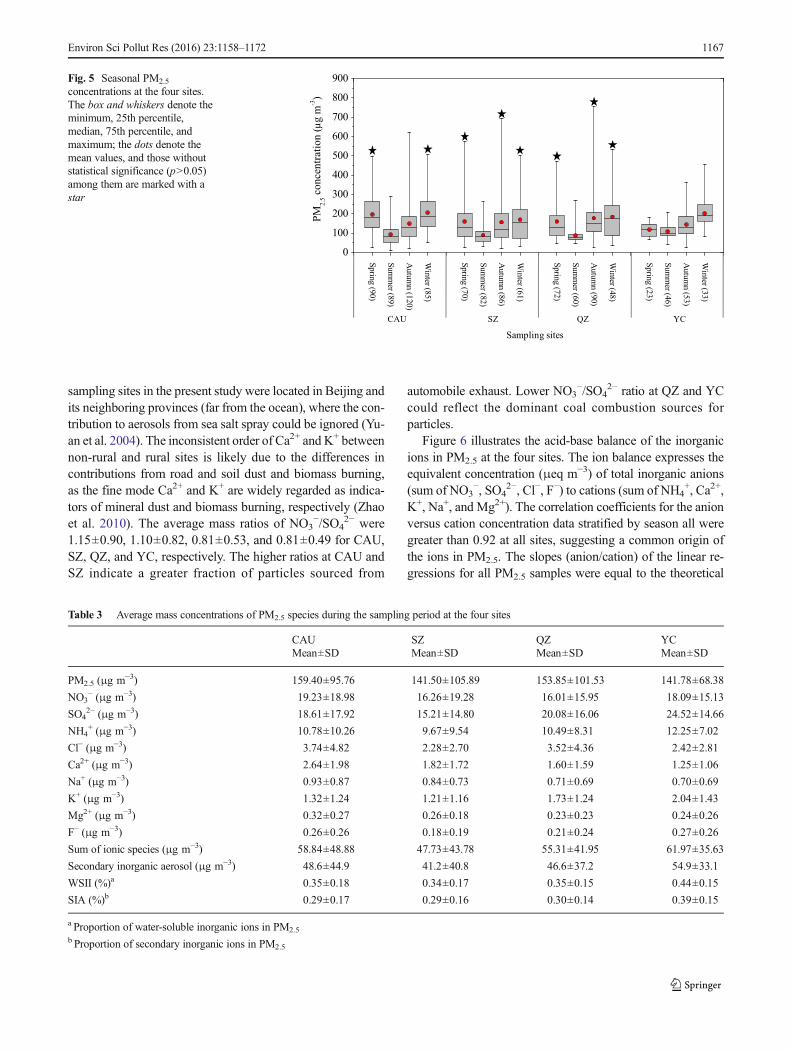
At four sites, the daily PM2.5 concentrations during sum-mer were lower than those in other seasons (Fig. 5). Higherrainfall in summer at all sites (Fig. S1d) promotes the scav-enging of particles by wet deposition. In addition, higher tem-peratures during summer (Fig. S1a) favor the volatilization offine particle nitrate to NH3 and HNO3 (Seinfeld and Pandis2006). Different seasonal characteristics for highest PM2.5
concentrations were found in the present study. At CAU, themaximum concentrations were in spring and winter, with nosignificant difference between the two seasons. This seasonalpattern is consistent with that for the period 2005–2008 inBeijing investigated by Yu et al. (2011) but is different fromthe finding of Zhao et al. (2013) who reported similar seasonalPM2.5 concentrations across seasons in Beijing in 2009/2010,ascribed to the promotion of electricity and natural gas use.So, our result may imply that combustion of fossil fuel is stillthe important source of PM2.5 in Beijing, regardless of differ-ences in meteorological conditions (e.g., wind direction, windspeed) during experiment periods between the two studies. AtQZ and SZ, the concentrations were not significantly differentbetween spring, autumn, and winter. As revealed by Yu et al.(2011), high PM2.5 concentrations in spring in Beijing weremainly dominated by geogenic particles from the west andnorthwest of China via atmospheric transport. In contrast, highconcentrations of PM2.5 in winter and autumn resulted fromthe combination of coal and biomass burning for domestichome heating and direct burning of agricultural residues inthe field (Hu et al. 2014). Moreover, stable meteorologicalconditions during autumn and winter (see BSeasonal variationof gaseous NH3, NO2, and HNO3^) also lead to the accumu-lation of air pollutants. The PM2.5 concentrations at YC weresignificantly higher only in winter as compared to the otherthree seasons, among which there was no significant differ-ence in PM2.5 concentration. Low PM2.5 concentration inspring at YC is associated with a combination of fewer sam-ples collected in the spring of 2013 (Table S4) and missingdays with serious particle pollution.
The average concentrations of water-soluble ionic speciesduring the sampling period at the four sites are presented inTable 3. The proportion of the water-soluble ions in PM2.5 wassimilar for the urban site (36 %), the suburban site (34 %), andthe rural sites (average 40 %). The concentrations of ions atthe urban and suburban sites were both in the order NH4
+>Ca2+>K+>Na+>Mg2+ for the cations and NO3
−>SO42−>
Cl−>F− for the anions. At the rural sites, the concentrationorder was NH4
+>K+>Ca2+>Na+>Mg2+ for the cations andSO4
2−>NO3−>Cl−>F− for the anions. The SO4
2−, NO3−, and
NH4+ are the dominant ionic species, contributing 29–39% of
the average PM2.5 mass across the four sites (Table 3). The
Table 2 Summary statistics for daily average PM2.5 concentrations(μg m−3) during the sampling period at the four sites
CAU SZ QZ YC
Mean 159.4 141.5 153.8 141.8
Median 137.3 110.3 126.4 127.7
Min 11.8 19.8 23.9 27.9
Max 621.0 692.9 754.5 455.0
SD 95.8 105.9 101.5 68.4
N 384 299 270 155
ECGS (%)a 80.5 72.6 79.6 93.5
EWHOS (%)b 98.2 99.7 99.6 100
N number of samplesa The proportion of sampling days which had concentrations of PM2.5
exceeded the Chinese Grade II standardb The proportion of sampling days which had concentrations of PM2.5
exceeded the WHO standard
1166 Environ Sci Pollut Res (2016) 23:1158–1172
sampling sites in the present study were located in Beijing andits neighboring provinces (far from the ocean), where the con-tribution to aerosols from sea salt spray could be ignored (Yu-an et al. 2004). The inconsistent order of Ca2+ and K+ betweennon-rural and rural sites is likely due to the differences incontributions from road and soil dust and biomass burning,as the fine mode Ca2+ and K+ are widely regarded as indica-tors of mineral dust and biomass burning, respectively (Zhaoet al. 2010). The average mass ratios of NO3
−/SO42− were
1.15±0.90, 1.10±0.82, 0.81±0.53, and 0.81±0.49 for CAU,SZ, QZ, and YC, respectively. The higher ratios at CAU andSZ indicate a greater fraction of particles sourced from
automobile exhaust. Lower NO3−/SO4
2− ratio at QZ and YCcould reflect the dominant coal combustion sources forparticles.
Figure 6 illustrates the acid-base balance of the inorganicions in PM2.5 at the four sites. The ion balance expresses theequivalent concentration (μeq m−3) of total inorganic anions(sum of NO3
−, SO42−, Cl−, F−) to cations (sum of NH4
+, Ca2+,K+, Na+, and Mg2+). The correlation coefficients for the anionversus cation concentration data stratified by season all weregreater than 0.92 at all sites, suggesting a common origin ofthe ions in PM2.5. The slopes (anion/cation) of the linear re-gressions for all PM2.5 samples were equal to the theoretical
Sprin
g (9
0)
Sum
mer (8
9)
Autu
mn (1
20)
Win
ter (85)
F1
Sprin
g (7
0)
Sum
mer (8
2)
Autu
mn (8
6)
Win
ter (61)
K1
Sprin
g (7
2)
Sum
mer (6
0)
Autu
mn (9
0)
Win
ter (48)
P1
Sprin
g (2
3)
Sum
mer (4
6)
Autu
mn (5
3)
Win
ter (33)
0
100
200
300
400
500
600
700
800
900
PM
2.5 c
on
cen
trat
ion
(µ g
m-3
)CAU SZ QZ YC
Sampling sites
Fig. 5 Seasonal PM2.5
concentrations at the four sites.The box and whiskers denote theminimum, 25th percentile,median, 75th percentile, andmaximum; the dots denote themean values, and those withoutstatistical significance (p>0.05)among them are marked with astar
Table 3 Average mass concentrations of PM2.5 species during the sampling period at the four sites
a Proportion of water-soluble inorganic ions in PM2.5
b Proportion of secondary inorganic ions in PM2.5
Environ Sci Pollut Res (2016) 23:1158–1172 1167
equivalent ratio of 1 at CAU (1.06) and SZ (1.01) but weregreater than 1.1 at QZ (1.13) and YC (1.22). These resultsimply that the aerosols were neutral at the urban and suburbansites but acidic at the rural sites. The acidic PM2.5 observed atthe rural sites is most likely due to relatively low concentra-tions of Ca2+ which play an important role in spatial distribu-tion of PM2.5 acidity (He et al. 2012). Fully neutralized aerosolhave beenwidely observed in different areas worldwide (Shonet al. 2012; Tao et al. 2014), but acidic aerosol has also beenreported by many previous studies (Wang et al. 2006; Zhanget al. 2011a; He et al. 2012). The seasonal anion/cation ratiosat the four sites, i.e., the slopes of linear regressions for theseasonally stratified data, were found to vary moderately(Fig. 6). This characteristic is consistent with the findings ofShon et al. (2012), who suggested that seasonal variation inratio of anion/cation was caused by unmeasured cations suchas ferric and non-ferric components.
Secondary inorganic aerosol
Ammonia in the atmosphere can react with H2SO4 to formammonium sulfate ((NH4)2SO4) and ammonium bisulfate(NH4HSO4) and react with HNO3 and HCl to form ammoni-um nitrate (NH4NO3) and ammonium chloride (NH4Cl)(Ianniello et al. 2010). These compounds are referred to asBsecondary inorganic aerosol (SIA)^ in this paper. The4Pearson correlation coefficients between the molar
concentrations of NO3−, SO4
2−, and Cl− in PM2.5 are present-ed in Table S5. At the four sites, the correlation coefficients(CCs) between NH4
+, SO42−, and NO3
−were comparable, butboth of them were higher than CCs between NH4
+ and Cl−.Moreover, the CCs between NH4
+ and the sum of NO3− and
SO42− at all sites (except SZ) were higher than those between
NH4+ and the sum of NO3
−, SO42−, and Cl−. These results
mean NH4+ was probably mainly combined with NO3
− andSO4
2−. In order to further understand the neutralization pro-cesses between them, we calculated the molar concentrationsof positive electric charges of NH4
+ (PEC=NH4+/18) and neg-
ative electric charges of NO3− and SO4
2− (NEC=NO3−/62+
2×SO42−/96). If all sulfate was assumed to be in the form of
HSO4−, then NEC=(NO3
−/62+SO42−/96) (Louie et al. 2005;
Zhao et al. 2013). The seasonal average PEC and NEC areshown in Fig. 7. At all sites, we found that NH4
+ was enoughto match NO3
− and SO42− to form NH4HSO4 in all four sea-
sons and not sufficient to meet the complete neutralization ofSO4
2− and NO3−for formation of (NH4)2SO4 aerosol in most
seasons. This indicates acid-rich conditions at the study sites.Interestingly, our findings at CAU differ from results for urbansites in Beijing and its surrounding provinces during 2009–2010 when NH4
+ concentrations were far from enough tomatch NO3
− and SO42− throughout the year (Zhao et al.
2013). We can infer the enhanced alkalization of the atmo-sphere in Beijing and/or its surrounding areas because thelevels of NO3
− and SO42− were closely comparable between
0 1 2 3 4 50
1
2
3
4
5
Spring (1.02)
Summer (0.98)
Autumn (1.03)
Winter (1.14)
To
tal
anio
ns
( µeq
m-3
)
Total cations (µeq m-3)
Y=1.057X-0.063
R=0.951, n=384
0 1 2 3 40
1
2
3
4
Spring (1.04)
Summer (0.97)
Autumn (0.94)
Winter (1.09)
Tota
l an
ion
s (µ
eq m
-3)
Total cations (µeq m-3)
Y=1.010X-0.071
R=0.924, n=299
0 1 2 3 40
1
2
3
4
Spring (1.16)
Summer (0.83)
Autumn (1.17)
Winter (1.23)
To
tal
anio
ns
(µeq
m-3
)
Total cations (µeq m-3
)
Y=1.130X-0.069
R=0.969, n=270
0 1 2 3 40
1
2
3
4
Spring (1.06)
Summer (1.11)
Autumn (1.14)
Winter (1.39)
Tota
l an
ion
s (µ
eq m
-3)
Total cations (µeq m-3)
Y=1.216X-0.143
R=0.974, n=155
(b)(a)
(c) (d)
Fig. 6 The molar inorganic ionbalance in PM2.5 at the four sites:a CAU, b SZ, c QZ, and d YC
1168 Environ Sci Pollut Res (2016) 23:1158–1172
the two studies. The average molar ratio of NH4+ to SO4
2−
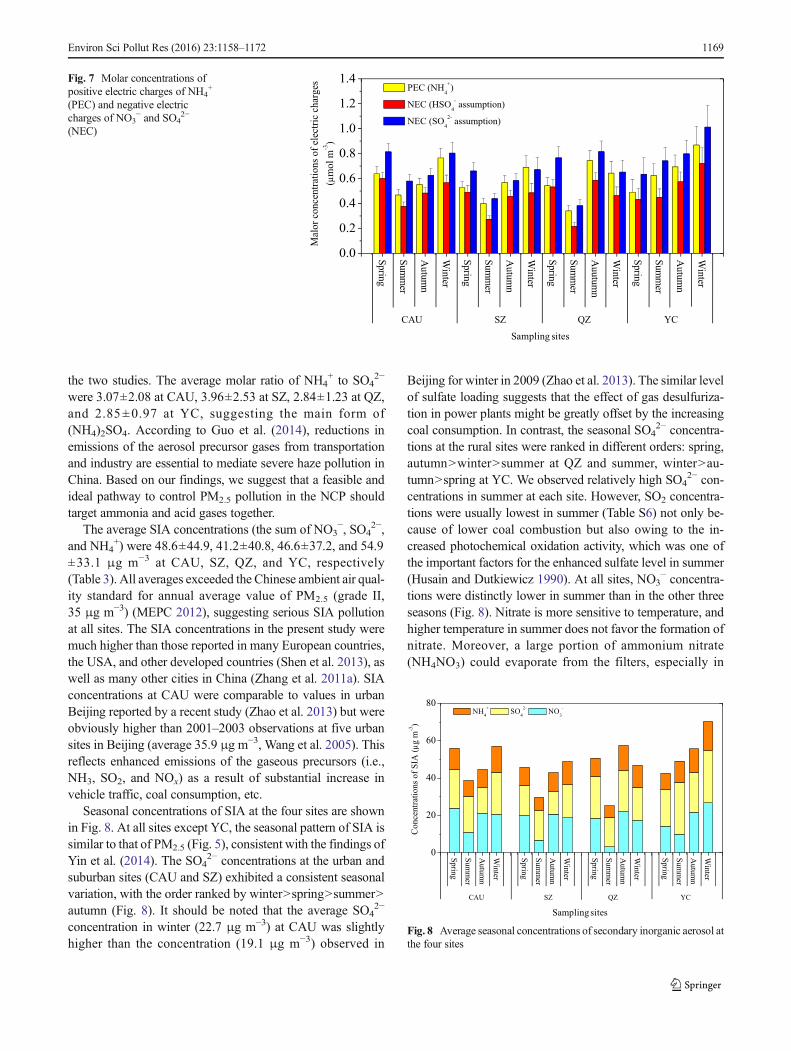
were 3.07±2.08 at CAU, 3.96±2.53 at SZ, 2.84±1.23 at QZ,and 2.85±0.97 at YC, suggesting the main form of(NH4)2SO4. According to Guo et al. (2014), reductions inemissions of the aerosol precursor gases from transportationand industry are essential to mediate severe haze pollution inChina. Based on our findings, we suggest that a feasible andideal pathway to control PM2.5 pollution in the NCP shouldtarget ammonia and acid gases together.
The average SIA concentrations (the sum of NO3−, SO4
2−,and NH4
+) were 48.6±44.9, 41.2±40.8, 46.6±37.2, and 54.9±33.1 μg m−3 at CAU, SZ, QZ, and YC, respectively(Table 3). All averages exceeded the Chinese ambient air qual-ity standard for annual average value of PM2.5 (grade II,35 μg m−3) (MEPC 2012), suggesting serious SIA pollutionat all sites. The SIA concentrations in the present study weremuch higher than those reported in many European countries,the USA, and other developed countries (Shen et al. 2013), aswell as many other cities in China (Zhang et al. 2011a). SIAconcentrations at CAU were comparable to values in urbanBeijing reported by a recent study (Zhao et al. 2013) but wereobviously higher than 2001–2003 observations at five urbansites in Beijing (average 35.9 μg m−3, Wang et al. 2005). Thisreflects enhanced emissions of the gaseous precursors (i.e.,NH3, SO2, and NOx) as a result of substantial increase invehicle traffic, coal consumption, etc.
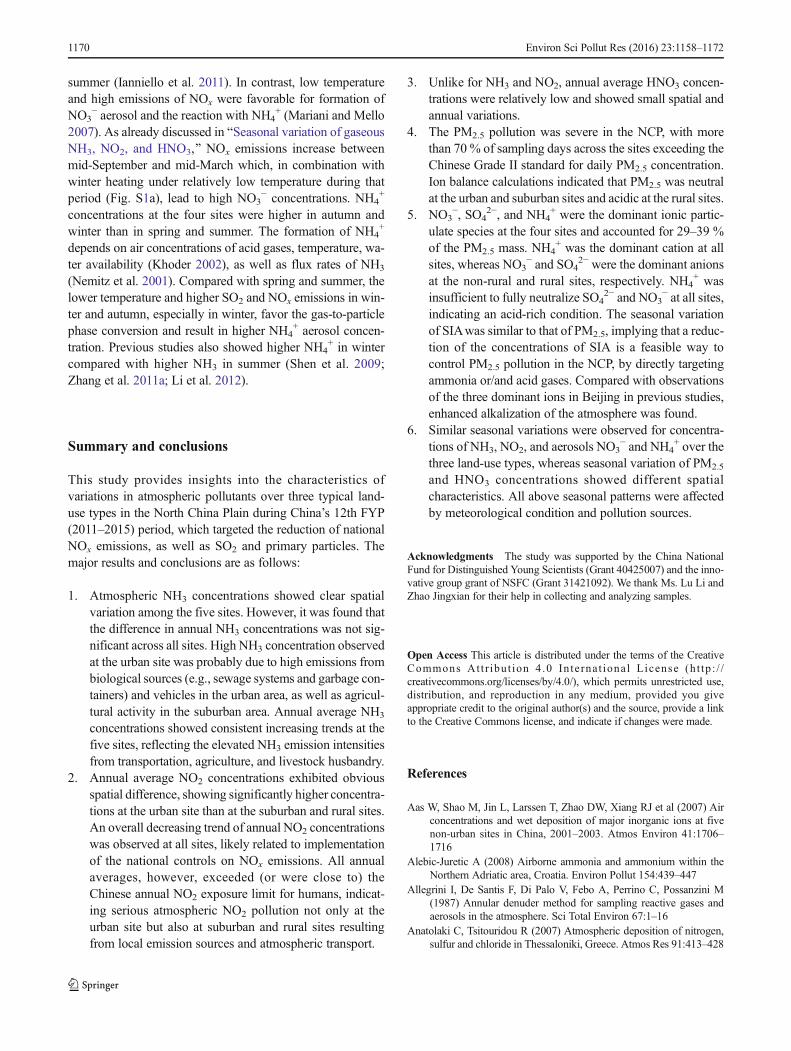
Seasonal concentrations of SIA at the four sites are shownin Fig. 8. At all sites except YC, the seasonal pattern of SIA issimilar to that of PM2.5 (Fig. 5), consistent with the findings ofYin et al. (2014). The SO4
2− concentrations at the urban andsuburban sites (CAU and SZ) exhibited a consistent seasonalvariation, with the order ranked by winter>spring>summer>autumn (Fig. 8). It should be noted that the average SO4
2−
concentration in winter (22.7 μg m−3) at CAU was slightlyhigher than the concentration (19.1 μg m−3) observed in
Beijing for winter in 2009 (Zhao et al. 2013). The similar levelof sulfate loading suggests that the effect of gas desulfuriza-tion in power plants might be greatly offset by the increasingcoal consumption. In contrast, the seasonal SO4
2− concentra-tions at the rural sites were ranked in different orders: spring,autumn>winter>summer at QZ and summer, winter>au-tumn>spring at YC. We observed relatively high SO4
2− con-centrations in summer at each site. However, SO2 concentra-tions were usually lowest in summer (Table S6) not only be-cause of lower coal combustion but also owing to the in-creased photochemical oxidation activity, which was one ofthe important factors for the enhanced sulfate level in summer(Husain and Dutkiewicz 1990). At all sites, NO3
− concentra-tions were distinctly lower in summer than in the other threeseasons (Fig. 8). Nitrate is more sensitive to temperature, andhigher temperature in summer does not favor the formation ofnitrate. Moreover, a large portion of ammonium nitrate(NH4NO3) could evaporate from the filters, especially in
Sprin
g
Sum
mer
Autu
mn
Win
ter
Sprin
g
Sum
mer
Autu
mn
Win
ter
Sprin
g
Sum
mer
Auutu
mn
Win
ter
Sprin
g
Sum
mer
Autu
mn
Win
ter
0.0
0.2
0.4
0.6
0.8
1.0
1.2
1.4
Mal
or
con
cen
trat
ion
s o
f el
ectr
ic c
har
ges
(m
ol
m-3
)
PEC (NH4
+)
NEC (HSO4
- assumption)
NEC (SO4
2- assumption)
CAU SZ QZ YC
Sampling sitesµ
Fig. 7 Molar concentrations ofpositive electric charges of NH4
+
(PEC) and negative electriccharges of NO3
− and SO42−
(NEC)
Sprin
g
Sum
mer
Autu
mn
Win
ter
-- Sprin
g
Sum
mer
Autu
mn
Win
ter
-- Sprin
g
Sum
mer
Autu
mn
Win
ter
-- Sprin
g
Sum
mer
Autu
mn
Win
ter
0
20
40
60
80
Conce
ntr
atio
ns
of
SIA
(µg
m-3)
NH4
+ SO
4
2- NO
3
-
CAU SZ QZ YC
Sampling sites
Fig. 8 Average seasonal concentrations of secondary inorganic aerosol atthe four sites
Environ Sci Pollut Res (2016) 23:1158–1172 1169
summer (Ianniello et al. 2011). In contrast, low temperatureand high emissions of NOx were favorable for formation ofNO3
− aerosol and the reaction with NH4+ (Mariani and Mello
2007). As already discussed in BSeasonal variation of gaseousNH3, NO2, and HNO3,^ NOx emissions increase betweenmid-September and mid-March which, in combination withwinter heating under relatively low temperature during thatperiod (Fig. S1a), lead to high NO3
− concentrations. NH4+
concentrations at the four sites were higher in autumn andwinter than in spring and summer. The formation of NH4
+
depends on air concentrations of acid gases, temperature, wa-ter availability (Khoder 2002), as well as flux rates of NH3
(Nemitz et al. 2001). Compared with spring and summer, thelower temperature and higher SO2 and NOx emissions in win-ter and autumn, especially in winter, favor the gas-to-particlephase conversion and result in higher NH4
+ aerosol concen-tration. Previous studies also showed higher NH4
+ in wintercompared with higher NH3 in summer (Shen et al. 2009;Zhang et al. 2011a; Li et al. 2012).
Summary and conclusions
This study provides insights into the characteristics ofvariations in atmospheric pollutants over three typical land-use types in the North China Plain during China’s 12th FYP(2011–2015) period, which targeted the reduction of nationalNOx emissions, as well as SO2 and primary particles. Themajor results and conclusions are as follows:
1. Atmospheric NH3 concentrations showed clear spatialvariation among the five sites. However, it was found thatthe difference in annual NH3 concentrations was not sig-nificant across all sites. High NH3 concentration observedat the urban site was probably due to high emissions frombiological sources (e.g., sewage systems and garbage con-tainers) and vehicles in the urban area, as well as agricul-tural activity in the suburban area. Annual average NH3
concentrations showed consistent increasing trends at thefive sites, reflecting the elevated NH3 emission intensitiesfrom transportation, agriculture, and livestock husbandry.
2. Annual average NO2 concentrations exhibited obviousspatial difference, showing significantly higher concentra-tions at the urban site than at the suburban and rural sites.An overall decreasing trend of annual NO2 concentrationswas observed at all sites, likely related to implementationof the national controls on NOx emissions. All annualaverages, however, exceeded (or were close to) theChinese annual NO2 exposure limit for humans, indicat-ing serious atmospheric NO2 pollution not only at theurban site but also at suburban and rural sites resultingfrom local emission sources and atmospheric transport.
3. Unlike for NH3 and NO2, annual average HNO3 concen-trations were relatively low and showed small spatial andannual variations.
4. The PM2.5 pollution was severe in the NCP, with morethan 70 % of sampling days across the sites exceeding theChinese Grade II standard for daily PM2.5 concentration.Ion balance calculations indicated that PM2.5 was neutralat the urban and suburban sites and acidic at the rural sites.
5. NO3−, SO4
2−, and NH4+ were the dominant ionic partic-
ulate species at the four sites and accounted for 29–39 %of the PM2.5 mass. NH4
+ was the dominant cation at allsites, whereas NO3
− and SO42− were the dominant anions
at the non-rural and rural sites, respectively. NH4+ was
insufficient to fully neutralize SO42− and NO3
− at all sites,indicating an acid-rich condition. The seasonal variationof SIAwas similar to that of PM2.5, implying that a reduc-tion of the concentrations of SIA is a feasible way tocontrol PM2.5 pollution in the NCP, by directly targetingammonia or/and acid gases. Compared with observationsof the three dominant ions in Beijing in previous studies,enhanced alkalization of the atmosphere was found.
6. Similar seasonal variations were observed for concentra-tions of NH3, NO2, and aerosols NO3
− and NH4+ over the
three land-use types, whereas seasonal variation of PM2.5
and HNO3 concentrations showed different spatialcharacteristics. All above seasonal patterns were affectedby meteorological condition and pollution sources.
Acknowledgments The study was supported by the China NationalFund for Distinguished Young Scientists (Grant 40425007) and the inno-vative group grant of NSFC (Grant 31421092). We thank Ms. Lu Li andZhao Jingxian for their help in collecting and analyzing samples.
Open Access This article is distributed under the terms of the CreativeCommons At t r ibut ion 4 .0 In te rna t ional License (h t tp : / /creativecommons.org/licenses/by/4.0/), which permits unrestricted use,distribution, and reproduction in any medium, provided you giveappropriate credit to the original author(s) and the source, provide a linkto the Creative Commons license, and indicate if changes were made.
References
Aas W, Shao M, Jin L, Larssen T, Zhao DW, Xiang RJ et al (2007) Airconcentrations and wet deposition of major inorganic ions at fivenon-urban sites in China, 2001–2003. Atmos Environ 41:1706–1716
Alebic-Juretic A (2008) Airborne ammonia and ammonium within theNorthern Adriatic area, Croatia. Environ Pollut 154:439–447
Allegrini I, De Santis F, Di Palo V, Febo A, Perrino C, Possanzini M(1987) Annular denuder method for sampling reactive gases andaerosols in the atmosphere. Sci Total Environ 67:1–16
Anatolaki C, Tsitouridou R (2007) Atmospheric deposition of nitrogen,sulfur and chloride in Thessaloniki, Greece. Atmos Res 91:413–428
1170 Environ Sci Pollut Res (2016) 23:1158–1172
Cao JJ, Zhang T, Chow JC, Watson JG, Wu F, Li H (2009)Characterization of atmospheric ammonia over Xi’an, China.Aerosol Air Qual Res 9:277–289
Chai FH, Gao J, Chen ZX, Wang SL, Zhang YC, Zhang JQ et al (2014)Spatial and temporal variation of particulate matter and gaseouspollutants in 26 cities in China. J Environ Sci 26:75–82
Clarisse L, Clerbaux C, Dentener F, Hurtmans D, Coheur PF (2009)Global ammonia distribution derived from infrared satelliteobservations. Nat Geosci 2:479–483
CSY (1997–2014) China Statistics Yearbook. Available at:http://www.stats.gov.cn
CSY (2007–2014) China Statistics Yearbook. Available at:http://www.stats.gov.cn
CSY (2014) China Statistical Yearbook. Available at:http://www.stats.gov.cn
Duan F, Liu X, Yu T, Cachier H (2004) Identification and estimate ofbiomass burning contribution to the urban aerosol organic carbonconcentrations in Beijing. Atmos Environ 38:1275–1282
Endo T, Yagoh H, Sato K, Matsuda K, Hayashi K, Noguchi I et al (2011)Regional characteristics of dry deposition of sulfur and nitrogencompounds at EANET sites in Japan from 2003 to 2008. AtmosEnviron 45:1259–1267
Flechard CR, Nemitz E, Smith RI, Fowler D, Vermeulen AT, Bleeker Aet al (2011) Dry deposition of reactive nitrogen to European ecosys-tems: a comparison of inferential models across the NitroEuropenetwork. Atmos Chem Phys 11:2703–2728
Gu BJ, Ge Y, Ren Y, Xu B, Luo WD, Jiang H et al (2012) Atmosphericreactive nitrogen in China: sources, recent trends, and damage costs.Environ Sci Technol 46:9240–9247
Gu BJ, Sutton MA, Chang SX, Ge Y, Jie C (2014) Agricultural ammoniaemissions contribute to China’s urban air pollution. Front EcolEnviron 12:265–266
GuoYM, Jia YP, Pan XC, Liu LQ,WichmannHE (2009) The associationbetween fine particulate air pollution and hospital emergency roomvisits for cardiovascular diseases in Beijing, China. Sci TotalEnviron 407:4826–4830
Guo S, Hu M, Zamora ML, Peng JF, Shang DJ, Zheng J et al (2014)Elucidating severe urban haze formation in China. Proc Natl AcadSci U S A 111:17373–17378
He K, Zhao Q, Ma Y, Duan F, Yang F, Shi Z et al (2012) Spatial andseasonal variability of PM2.5 acidity at two Chinese mega cities:insights into the formation of secondary inorganic aerosols. AtmosChem Phys 12:1377–1395
Hu J, Wang Y, Ying Q, Zhang H (2014) Spatial and temporal variabilityof PM2.5 and PM10 over the North China Plain and the YangtzeRiver Delta, China. Atmos Environ 95:598–609
Huang X, Song Y, Li MM, Li JF, Huo Q, Cai XH et al (2012) A high-resolution ammonia emission inventory in China. GlobalBiogeochem Cy 26:GB1030
Husain L, Dutkiewicz VA (1990) A long term (1975–1988) study ofatmospheric SO4
2−: regional contributions and concentration trends.Atmos Environ 24A:1175–1187
Ianniello A, Spataro F, Esposito G, Allegrini I, Rantica E, Ancora MPet al (2010) Occurrence of gas phase ammonia in the area of Beijing(China). Atmos Chem Phys 10:9487–9503
Ianniello A, Spataro F, Esposito G, Allegrini I, Hu M, Zhu T (2011)Chemical characteristics of inorganic ammonium salts in PM2.5 inthe atmosphere of Beijing (China). Atmos Chem Phys 11:10803–10822
Khoder MI (2002) Atmospheric conversion of sulfur dioxide to particu-late sulfate and nitrogen dioxide to particulate nitrate and gaseousnitric acid in an urban area. Chemosphere 49:675–684
Li KH, Song W, Liu XJ, Zhang W, Shen JL, Liu B et al (2012)Atmospheric reactive nitrogen concentrations at ten sites with
contrasting land use in an arid region of central Asia.Biogeosciences 9:4013–4021
Li KH, Liu XJ, Song W, Chang YH, Hu YK, Tian CY (2013)Atmospheric nitrogen deposition at two sites in an arid environmentof central Asia. PLoS ONE 8:e67018
Louie PKK, Chow JC, Antony Chen LW, Watson JG, Leung G, SinDWM (2005) PM2.5 chemical composition in Hong Kong: urbanand regional variations. Sci Total Environ 338:267–281
Luo XS, Liu P, Tang AH, Liu JY, Zong XY, Zhang Q et al (2013) Anevaluation of atmospheric Nr pollution and deposition in NorthChina after the Beijing Olympics. Atmos Environ 74:209–216
Mariani RL, Mello WZD (2007) PM2.5–10, PM2.5 and associated water-soluble inorganic species at a coastal urban site in the metropolitanregion of Rio de Janeiro. Atmos Environ 41:2887–2892
Meng ZY, Xu XB, Wang T, Zhang XY, Yu XL, Wang SF et al (2010)Ambient sulfur dioxide, nitrogen dioxide, and ammonia at ten back-ground and rural sites in China during 2007–2008. Atmos Environ44:2625–2631
Meng ZY, Lin WL, Jiang XM, Yan P, Wang Y, Zhang YM et al (2011)Characteristics of atmospheric ammonia over Beijing, China. AtmosChem Phys 11:6139–6151
MEPC (2011) Ministry of Environment Protection of China. Report onenvironmental quality in China, 2010. Available at: http://www.mep.gov.cn/ (accessed January 2011)
MEPC (2012) Ministry of Environment Protection of China. Ambient airquality standards (GB3095–2012). Available at: http://www.mep.gov.cn/ (accessed 29 February 2012)
Moeckli MA, Fierz M, Sigrist MW (1996) Emission factors for ethaneand ammonia from a tunnel study with a photoacoustic trace gasdetection system. Environ Sci Technol 30:2864–2867
Nemitz E, Milford C, Sutton MA (2001) A two-layer canopy compensa-tion point model for describing bi-directional biosphere–atmosphereexchange of ammonia. Q J Roy Meteor Soc 127:815–833
Pan YP, Wang YS, Tang GQ, Wu D (2012) Wet and dry deposition ofatmospheric nitrogen at ten sites in Northern China. Atmos ChemPhys 12:6515–6535
Perrino C, Gherardi M (1999) Optimization of the coating layer for themeasurement of ammonia by diffusion denuders. Atmos Environ33:4579–4587
Perrino C, De Santis F, Febo A (1990) Criteria for the choice of a denudersampling technique devoted to the measurement of atmosphericnitrous and nitric acids. Atmos Environ 24A:617–626
Reche C, Viana M, Pandolfi M, Alastuey A, Moreno T, Amato F et al(2002) Urban NH3 levels and sources in a Mediterranean environ-ment. Atmos Environ 57:153–164
Seinfeld J, Pandis S (2006) Atmospheric chemistry and physics: from airpollution to climate change, John Wiley and Sons, 2nd Edition,pp1203
SharmaM,Kishore S, Tripathi SN, Behera SN (2007) Role of atmospher-ic ammonia in the formation of inorganic secondary particulate mat-ter: a study at Kanpur, India. J Atmos Chem 58:1–17
Shen JL, Tang AH, Liu XJ, Fangmeier A, Goulding KTW, Zhang FS(2009) High concentrations and dry deposition of reactive nitrogenspecies at two sites in the North China Plain. Environ Pollut 157:3106–3113
Shen JL, Liu XJ, Fangmeier A, Goulding K, Zhang FS (2011)Atmospheric ammonia and particulate ammonium from agriculturalsources in the North China Plain. Atmos Environ 45:5033–5041
Shen JL, Li Y, Liu XJ, Luo XS, Tang AH, Zhang YZ et al (2013)Atmospheric dry and wet nitrogen deposition on three contrastingland use types of an agricultural catchment in subtropical centralChina. Atmos Environ 67:415–424
Shon ZH, Kim KH, Song SK, Jung K, Kim NJ, Lee JB (2012)Relationship between water-soluble ions in PM2.5 and their precur-sor gases in Seoul megacity. Atmos Environ 59:540–550
Singh SP, Satsangi GS, Khare P, Lakhani A, Maharaj KK et al (2001)Multiphase measurement of atmospheric ammonia. ChemosphereGlobal Change Sci 3:107–116
SongY, ZhangYH, Xie SD, Zeng LM, ZhengM, Salmon LG et al (2006)Source apportionment of PM2.5 in Beijing by positive matrix factor-ization. Atmos Environ 40:1526–1537
Spataro F, Ianniello A, Esposito G, Allegrini I, Zhu T, Hu M (2013)Occurrence of atmospheric nitrous acid in the urban area ofBeijing (China). Sci Total Environ 447:210–224
Streets DG, Bond TC, Carmichael GR, Fernandes SD, Fu Q, He D et al(2003) An inventory of gaseous and primary aerosol emissions inAsia in the year 2000. J Geophys Res 108:8809
Sun YL, Zhuang GS, Wang Y, Han LH, Guo JH, Dan M et al (2004) Theair-borne particulate pollution in Beijing-concentration, composi-tion, distribution and sources. Atmos Environ 38:5991–6004
Sun YL, Zhuang GS, Tang AH, Wang Y, An ZS (2006) Chemical char-acteristics of PM2.5 and PM10 in haze-fog episodes in Beijing.Environ Sci Technol 40:3148–3155
Sutton MA, Reis S, Riddick SN, Dragosits U, Nemitz E, Theobald MRet al (2013) Towards a climate-dependent paradigm of ammoniaemission and deposition. Philo T R Soc B 368:20130166
Tang YS, Simmons I, van Dijk N, Di Marco C, Nemitz E, Dammgen Uet al (2009) European scale application of atmospheric reactive ni-trogen measurements in a low-cost approach to infer dry depositionfluxes. Agr Ecosyst Environ 133:183–195
Tao Y, Yin Z, Ye XN, Ma Z, Che JM (2014) Size distribution of water-soluble inorganic ions in urban aerosols in Shanghai. Atmos PollutRes 5:639–647
Trebs I, Lara LL, Zeri LMM, Gatti LV, Artaxo P, Dlugi R et al (2006) Dryand wet deposition of inorganic nitrogen compounds to a tropicalpasture site (Rondônia, Brazil). Atmos Chem Phys 6:447–469
Walker JT, Whitall D, Robarge WP, Paerl H (2004) Ambient ammoniaand ammonium aerosol across a region of variable ammonia emis-sion density. Atmos Environ 38:1235–1246
Wang SX, Hao JM (2012) Air quality management in China: issues,challenges, and options. J Environ Sci 24:2–13
WangY, Zhuang GS, Tang A, Yuan H, Sun Y, Chen S et al (2005) The ionchemistry and the source of PM2.5 aerosol in Beijing. AtmosEnviron 39:3771–3784
Wang Y, Zhuang GS, Zhang XY, Huang K, Xu C, Tang AH et al (2006)The ion chemistry, seasonal cycle, and sources of PM2.5 and TSPaerosol in Shanghai. Atmos Environ 40:2935–2952
Wang X, Ding X, Fu X, He Q, Wang S, Bernard F et al (2012a) Aerosolscattering coefficients and major chemical compositions of fine par-ticles observed at a rural site in the central Pearl River Delta, SouthChina. J Environ Sci 24:72–77
Wang SW, Zhang Q, Streets DG, He KB, Martin RV, Lamsal LN et al(2012b) Growth in NOx emissions from power plants in China:bottom-up estimates and satellite observations. Atmos Chem Phys12:4429–4447
Wang SX, Xing J, Zhao B, Jang C, Hao JM (2014a) Effectiveness ofnational air pollution control policies on the air quality in metropol-itan areas of China. J Environ Sci 26:13–22
Wang YG, Ying Q, Hu JL, Zhang HL (2014b) Spatial and temporalvariations of six criteria air pollutants in 31 provincial capital citiesin China during 2013–2014. Environ Int 73:413–422
Watson JG (2002) Visibility: science and regulation. J Air Waste Manage52:628–713
WB (2007) World Bank (WB), State Environmental ProtectionAdministration, P.R. China. Cost of pollution in China. Economicestimates of physical damages. Available at www.worldbank.org/eapenvironment (accessed May 2013)
WHO (2000)World Health Organization (WHO), Air Quality Guidelinesfor Europe, WHO Regional Office for Europe. WHO RegionalPublications, European Series No. 91, Copenhagen
WHO (2005) World Health Organization (WHO), WHO air qualityguidelines for particulate matter, ozone, nitrogen dioxide and sulfurdioxide. Global Update. Summary of Risk Assessment. Geneva,Switzerland
Wu SW, Deng FR, Niu J, Huang QS, Liu YC, Guo XB (2010)Association of heart rate variability in taxi drivers with markedchanges in particulate air pollution in Beijing in 2008. EnvironHealth Persp 118:87–91
Xu W, Zheng K, Liu XJ, Meng LM, Huaitalla RM, Shen JL et al (2014)Atmospheric NH3 dynamics at a typical pig farm in China and theirimplications. Atmos Pollut Res 5:455–463
Yang R, Hayashi K, Zhu B, Li F, Yan X (2010) Atmospheric NH3 andNO2 concentration and nitrogen deposition in an agricultural catch-ment of Eastern China. Sci Total Environ 408:4624–4632
Yin LQ, Niu ZC, Chen XQ, Chen JS, Zhang FW, Xu LL (2014)Characteristics of water-soluble inorganic ions in PM2.5 and PM2.5-
10 in the coastal urban agglomeration along the Western TaiwanStrait Region, China. Environ Sci Pollut Res 21:5141–5156
Yu Y, Schleicher N, Norra S, Fricker M, Dietze V, Kaminski U et al(2011) Dynamics and origin of PM2.5 during a three-year samplingperiod in Beijing, China. J Environ Monitor 13:334–336
Yuan CS, Sau CC, Chen MC (2004) Influence of Asian dusts on thephysiochemical properties of atmospheric aerosols in Taiwan districtusing the Penchuis lands as an example. China Particuology 2:144–152
Zhang J, Smith K (2007) Household air pollution from coal and biomassfuels in China: measurements, health impacts, and interventions.Environ Health Persp 115:848–855
Zhang Q, Streets DG, Carmichael GR, He KB, Huo H, Kannari A et al(2009) Asian emissions in 2006 for the NASA INTEX-B mission.Atmos Chem Phys 9:5131–5153
Zhang Y, Dore AJ, Ma L, Liu XJ, Ma WQ, Cape JN et al (2010)Agricultural ammonia emissions inventory and spatial distributionin the North China Plain. Environ Pollut 158:490–501
Zhang T, Cao JJ, Tie XX, Shen ZX, Liu SX, Ding H et al (2011a) Water-soluble ions in atmospheric aerosols measured in Xi’an, China: sea-sonal variations and sources. Atmos Res 102:110–119
Zhang Y, Dore AJ, Liu X, Zhang F (2011b) Simulation of nitrogen de-position in the North China Plain by the FRAME model.Biogeosciences 8:3319–3329
Zhao Q, He K, Rahn KA, Ma Y, Jia Y, Yang F et al (2010) Dust stormscome to Central and Southwestern China, too: implications from amajor dust event in Chongqing. Atmos Chem Phys 10:2615–2630
Zhao PS, Dong F, He D, Zhao XJ, ZhangXL, ZhangWZ, Yao Q, Liu HY(2013) Characteristics of concentrations and chemical compositionsfor PM2.5 in the region of Beijing, Tianjin, and Hebei, China. AtmosChem Phys 13:4631–4644