Characterization of a Large Format HgCdTe on Si Focal Plane Array Brandon Hanold 1 , Donald Figer 1 , Joong Lee 1 , Elizabeth Corrales 2 , Lynn Mears 2 , James Bangs 2 , Jonathan Getty 2 , Mina Mitani 2 , C. Keasler 2 Rochester Institute of Technology 1 , Raytheon Vision Systems 2 ABSTRACT The Center for Detectors (CfD) at the Rochester Institute of Technology (RIT) and Raytheon Vision Systems (RVS) are advancing existing RVS techniques to produce large format HgCdTe focal plane arrays (FPAs) at lower cost by using Silicon (Si) substrate wafers. This paper presents the characterization of a 2K×2K HgCdTe on Si VIRGO FPA. Included is a project summary and progress report. This paper reports device performance characteristics conversion gain, dark current, read noise, linearity, and crosstalk. 1. INTRODUCTION Infrared HgCdTe (MCT) detector costs can be reduced by using Silicon (Si) as the growth substrate instead of CdZnTe (CZT) [1]. Si wafers are cheaper and larger, increasing the amount of die per wafer and reducing the cost per die. The Center for Detectors (CfD) at the Rochester Institute of Technology (RIT) and Raytheon Vision Systems (RVS) are developing low cost infrared detectors for astronomy as part of a long-term goal to produce larger detectors at lower cost with the use of Si substrate wafers. The project goal is to produce a 2K×2K MBE MCT/Si detector with competitive performance, and the longer-term goal is to produce an 8K×8K version of this device (Table 1-1). NSF and NASA have provided the majority of the funding for this effort. Table 1-1 Table below shows the project goals Parameter Project Goal Long-term Goal Format 2K×2K 8K×8K Pixel Size 20 m 15 m Read Noise (Fowler-16) 5 e 2 e Wavelength Range 0.4 – 2.5 m 0.4 – (2.5-5.5) m Dark Current (e /s/pixel) <0.01 @80 K <0.01 @80 K Substrate Si Si DQE (w/AR coating) >70% >70% Persistence (after 100% saturation) <0.1% <0.1% The key objective of our development efforts is to advance new large-format infrared detectors for astrophysics. The chosen technology of MCT on Si provides high sensitivity, broad wavelength coverage from the optical to infrared, low noise, low dark current, very low and characterizable interpixel capacitance (IPC), 1 [email protected]2 [email protected]
Transcript
Characterization of a Large Format HgCdTe on Si Focal Plane Array
Brandon Hanold1, Donald Figer1, Joong Lee1, Elizabeth Corrales2, Lynn Mears2, James Bangs2, Jonathan Getty2, Mina Mitani2, C. Keasler2
Rochester Institute of Technology1, Raytheon Vision Systems
2
ABSTRACT
The Center for Detectors (CfD) at the Rochester Institute of Technology (RIT) and Raytheon Vision Systems (RVS) are advancing existing RVS techniques to produce large format HgCdTe focal plane arrays (FPAs) at lower cost by using Silicon (Si) substrate wafers. This paper presents the characterization of a 2K×2K HgCdTe on Si VIRGO FPA. Included is a project summary and progress report. This paper reports device performance characteristics conversion gain, dark current, read noise, linearity, and crosstalk.
1. INTRODUCTION Infrared HgCdTe (MCT) detector costs can be reduced by using Silicon (Si) as the growth substrate instead of CdZnTe (CZT) [1]. Si wafers are cheaper and larger, increasing the amount of die per wafer and reducing the cost per die. The Center for Detectors (CfD) at the Rochester Institute of Technology (RIT) and Raytheon Vision Systems (RVS) are developing low cost infrared detectors for astronomy as part of a long-term goal to produce larger detectors at lower cost with the use of Si substrate wafers. The project goal is to produce a 2K×2K MBE MCT/Si detector with competitive performance, and the longer-term goal is to produce an 8K×8K version of this device (Table 1-1). NSF and NASA have provided the majority of the funding for this effort.
Table 1-1 Table below shows the project goals
Parameter Project Goal Long-term Goal
Format 2K×2K 8K×8K
Pixel Size 20 m 15 m
Read Noise (Fowler-16) 5 e 2 e
Wavelength Range 0.4 – 2.5 m 0.4 – (2.5-5.5) m
Dark Current (e/s/pixel) <0.01 @80 K <0.01 @80 K
Substrate Si Si
DQE (w/AR coating) >70% >70%
Persistence (after 100% saturation) <0.1% <0.1%
The key objective of our development efforts is to advance new large-format infrared detectors for astrophysics. The chosen technology of MCT on Si provides high sensitivity, broad wavelength coverage from the optical to infrared, low noise, low dark current, very low and characterizable interpixel capacitance (IPC),
low cost, and scalability to very large format sizes. By maturing this material and processing system, astronomers will have powerful new tools for fabricating extremely large infrared focal planes up to 14K×14K pixels in size. The plan includes design and fabrication of test structures and hybridized focal planes in 1K×1K and 2K×2K pixel formats. All of these parts will be rigorously evaluated using test equipment and procedures that have been used in other successful detector development programs, e.g., for James Webb Space Telescope (JWST).
The proposed devices are ideal for applications that require large format infrared and optical detectors, e.g., to study dark energy/matter, exoplanets, and general Astrophysics. One example of a future mission that is an ideal candidate for these detectors is the Wide Field Infrared Survey Telescope, the highest rated space Astrophysics mission to develop in the next decade. The devices will also be very valuable for Earth Science and Planetary Science missions.
The development will use the VIRGO multiplexer, a successfully deployed readout circuit that is being used for the VISTA telescope project [2].
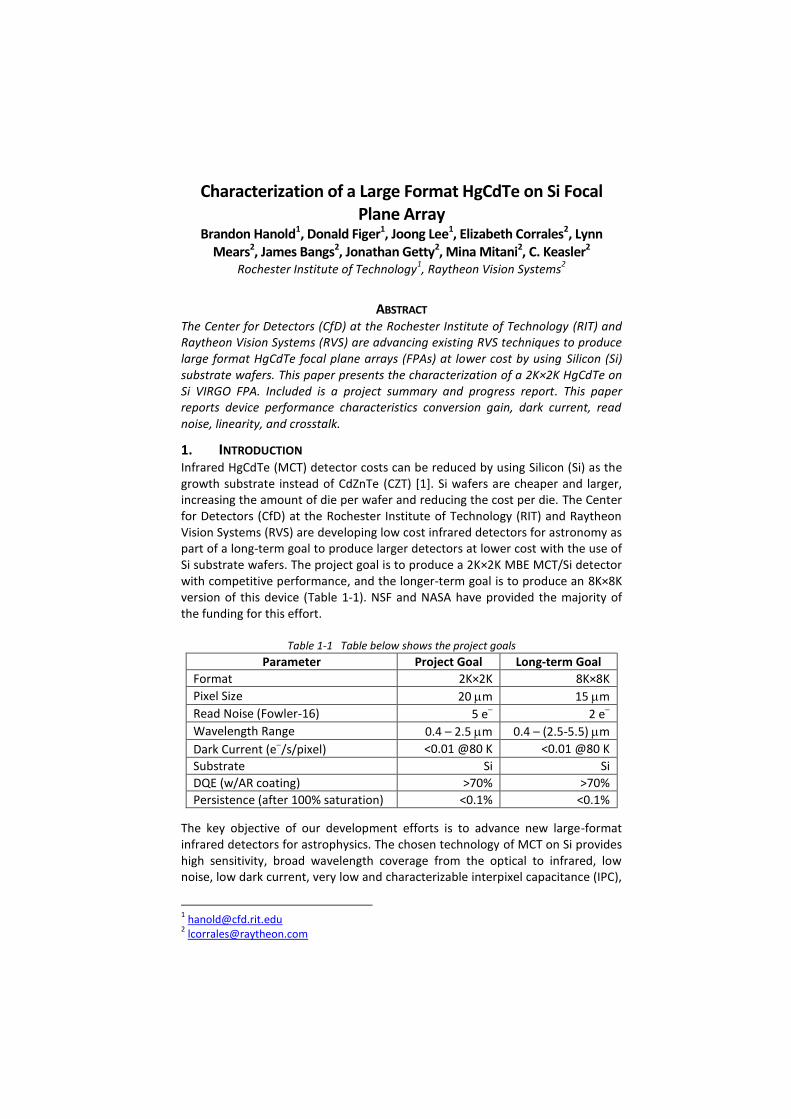
2. DETECTOR DESIGN The device structure for a sample device, and a photograph of a device wafer, are shown in Figure 2-1. The device was fabricated by depositing n-type HgCdTe:In on to a silicon substrate, one monolayer at a time, using MBE growth. The pn junction was completed by implanting p-type HgCdTe:As. Buffer layers of CdTe and ZnTe were grown between the silicon and the p-type layer in order to make the transition in the respective lattice spacings more gradual. Trenches on either side of the pixel sites were etched into the device, forming a mesa structure, and reducing pixel-to-pixel crosstalk. The metal contact serves to electrically connect the pn diode to the readout circuit through an indium bump. Photons enter the picture from the bottom in the left panel of the figure.
Figure 2-1 Pictured (right) is a wafer fabricated with 1K×1K variable unit cell die. (left) Shown is an example of HgCdTe growth process on a Si substrate.
Photons having energy less than the bandgap of silicon (1.1 eV) penetrate through the silicon wafer. If they have energy greater than the bandgap of the MCT, then they can be absorbed in the MCT. For very low energy photons, the absorption length is sufficiently long that the photons might traverse the thickness of the whole structure without being absorbed. The photons that are absorbed produce electron-hole pairs that drift to the depletion region of the pn junction. This causes a change in voltage that can be sensed in the readout circuit through the indium bump.
3
2.1 Variable Unit Cell Design Figure 2-2 shows the relative spectral response vs. wavelength for a number of unit cell designs optimized for quantum efficiency (right) and dark current (left). Dark current and quantum efficiency have been identified as the drivers for HgCdTe/Si design improvements. Multiple unit cell designs need to be tested to determine the optimal unit cell structure for the best spectral response while reducing dark current. We have devised a way to reduce the amount of testing by fabricating die with multiple unit cell designs.
A quad structure design on 1K×1K die with four different unit cell designs, each 512×512, was implemented. A wafer fabricated with this structure is pictured in Figure 2-1 (right). This variable unit cell (VUC) die design allows for a direct comparison of detector characteristics under the same test conditions. Figure 2-3 (right) shows a bonded VUC detector on a 124 LCC package mounted in a rigid-flex breakout board for cryogenic testing. Pictured in Figure 2-3 (left) is an image obtained using a VUC detector under the same illumination; the varied signal response from each quadrant is due to the difference in the unit cell design.
Figure 2-3 (left) Shown is an image from variable unit cell devices with flat field
illumination. (right) Pictured is a 1K×1K variable unit cell (VUC) detector mounted in a rigid-flex cryogenic breakout board.
A variety of VUC devices will be fabricated with different unit cell designs. Each design will be tested for dark current and quantum efficiency. The results will also be compared to results obtained from “benchmark” devices fabricated using RVS’ existing MCT/CZT and MCT/Si processes. Table 2-1 is a list of the detectors that have been fabricated to date. VIRGO-9A is the “benchmark” MCT/CZT detector and VIRGO-14 is the MCT/Si detector. Two VUC detectors have been fabricated. The characterization results for VIRGO-14 are presented.
Figure 2-2 Plots show unit cell designs optimized for dark current (left) and Quantum
Efficiency (right).
4
Table 2-1 Table below shows the detectors CfD has received for testing
Detector Format Cut-off (µm) substrate
VIRGO-9A 2K×2K 1.7 CZT
VIRGO-14 2K×2K 4.9 Si
VIRGO-V1 1K×1K 2.5 Si
VIRGO-V2 1K×1K 2.5 Si
V1 and V2 are Variable Unit Cell (VUC) detectors
None are substrate removed detectors
3. LABORATORY TESTING
3.1 RIDL Test System The bulk of the characterization is being done in the Rochester Imaging Detector Laboratory (RIDL), within the CfD. Two existing automated testing systems are dedicated to the project. One of the systems, shown in Figure 3-1, consists of software and hardware that has been used extensively to characterize infrared and optical detectors for space- and ground-based applications [3], [4], [5].
Figure 3-1 Pictured is the RIDL system. An orange dewar houses two filter wheels and a detector enclosure. A helium cryo-cooler cools the system. The picture shows an integrating
sphere and monochromator near the front of the dewar.
The modular architecture of the system allows for rapid acquisition and reduction of large datasets over a broad range of experimental conditions. Minimal effort is required to change between different detectors and different types of detectors. The system in Figure 3-1 can be transported for operation on a telescope or a radiation beam. The system includes a 16 inch diameter dewar (Universal Cryogenics, Tucson, AZ) with a 110 mm diameter CaF2 window, two cryogenic filter wheels, and a detector enclosure. The system is cooled with a two-stage cooler (CTI Model 1050, Brooks Automation, Chelmsford, MA), and the detector is thermally stabilized with a 10-channel temperature controller (Lakeshore Cryotronics, Westerville, OH). The detector enclosure provides thermal and electrical feedthroughs, an entrance window, and an otherwise light-tight cavity for the detector. The filter wheels can accommodate eight filters and/or radiation sources. We use two sets of readout electronics: 1) the
5
Generation III electronics from Astronomical Research Cameras, Inc. (San Diego, CA), and 2) the SIDECAR ASIC from Teledyne Scientific & Imaging, LLC (Thousand Oaks, CA).
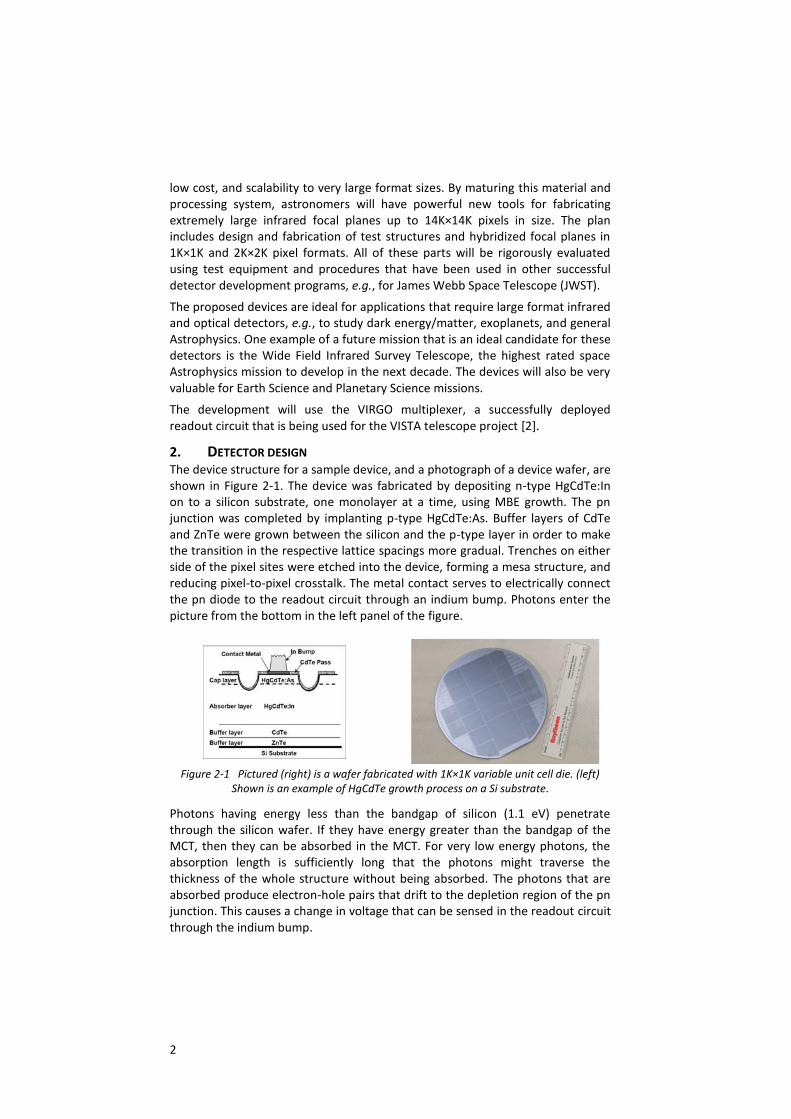
3.2 Control Electronics Modification The Astronomical Research Cameras (ARC) Gen. III controller was used to operate these detectors. A notable modification made to the controller was the addition of a current source board for the output buffer current supply. Figure 3-2 shows the modification to the ARC-46 video board. The new mezzanine board consists of a JFET current source for each input channel. A potentiometer in the circuit allows for the current to be tuned to the detector requirement. The 16V supply on the ARC-46 board was used to power the current sources. The board fits in the controller housing using an L-bracket from the jackpost hole on the edge mount D-Sub connectors. We performed simulations of the circuit design using OrCad and PSPICE and found excellent crosstalk suppression between channels. We measured ~7 electrons equivalent CDS noise including our cabling. The system noise did not increase significantly with the addition of the current source.
Figure 3-2 Pictured is the schematic (top) for the current sources added to the ARC
electronics. The board layout (middle) shows the 8 channel JFET current source design. The board installs on brackets (bottom) and fits the board’s original form factor.
3.3 Conversion Gain and Electronic Gain There are a number of electrical gain stages in the signal path, and they collectively produce a net conversion gain, Gnet, in units of e/ADU (Equation 1).
6
Figure 3-3 shows the results of the photon transfer experiment which measures Gnet, also called the system conversion gain. The pixel gain, Gpixel (e/V), represents the voltage change per unit charge, also known as the inverse of the capacitance. It is linear over small signal ranges, but becomes nonlinear when the pixel is near capacity. The detector readout has two source follower FETs between each pixel and the output pad. One is in each unit cell, and it induces a gain of GUC (V/V). The other, the output FET, introduces a similar gain, referred to as GOUT (V/V). The processing electronics amplify the signal, GAMP (V/V). Finally, GA/D (V/ADU) represents the conversion between volts and analog to digital units (ADUs). We have developed procedures to measure these gains.
Figure 3-3 Virgo-14 conversion gain measured using photon transfer method.
First, we establish GA/D by dividing the range of ADUs measured as a response to a well-characterized sawtooth pattern by the voltage range of that sawtooth. This measurement is done without the amplifier gain stage in the circuit. Next, we measure GAMP by repeating the sawtooth experiment with the gain stage in the circuit. Gelec is the convolution of these two gains as defined in Equation 2. We find Gdet by measuring the response to a varying reset voltage programmed onto the gate of the pixel FET. Equation 3 defines Gdet, which includes GUC and Gout in the measurement. Equation 4 shows GMUX is a measure of the combined output efficiency of the pixel FET and output FET in units of V/V. Measurements of Gdet and Gelec are shown in Figure 3-4.
Equation 1
Equation 2
Equation 3
Equation 4
Finally, Gpixel is inferred by inverting the equation above and using the full conversion gain from the photon transfer experiment. In this experiment, the detector is exposed to a flat field of light with a flux sufficient to saturate the detector within 100 up-the-ramp reads. The spatial variance is plotted against the median signal integration for each up-the-ramp read. The inverse of the slope gives the conversion gain (Gconv). Using Gdet we get Gpixel in e/V. Table 3-1
7
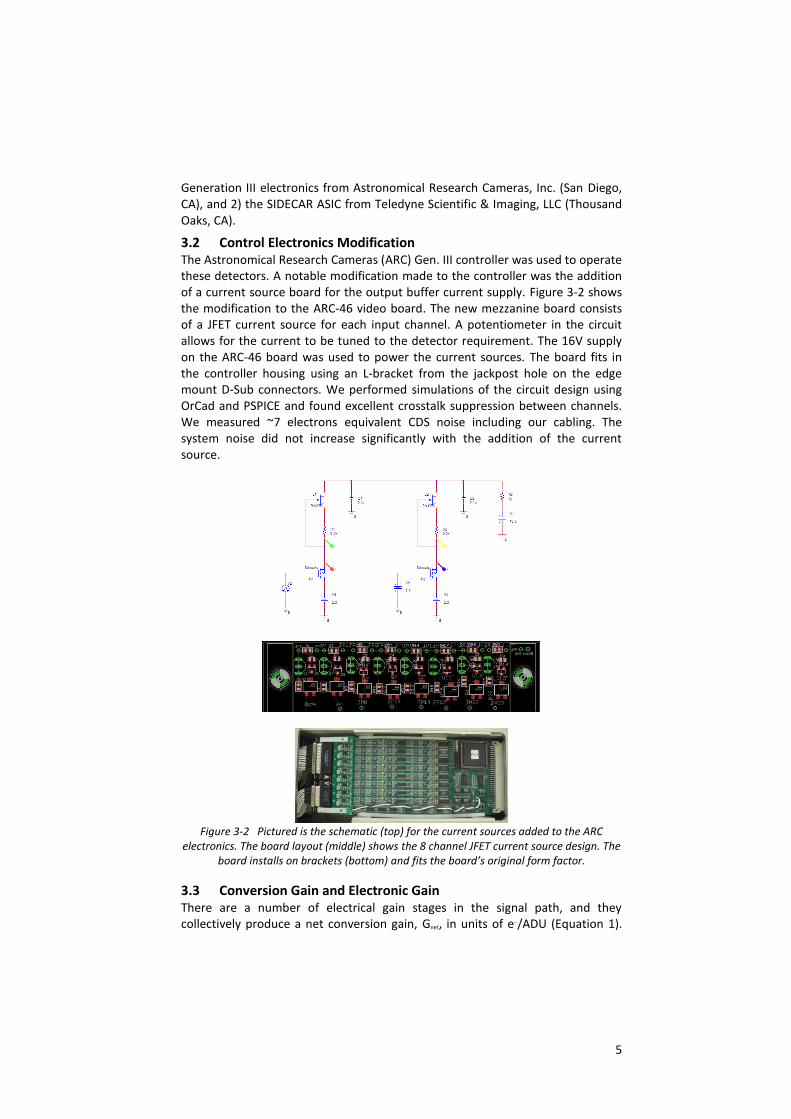
summarizes the gain measurements for the VIRGO-14 detector and the ARC electronics. Note that the measurements are given for two different amplifier gains.
Figure 3-4 Plots show the gain measurements made for the detector (top) and the
electronics only (bottom).
Table 3-1 Table of gain measurements and pixel capacitance for VIRGO-14.
VIRGO-14 GAmp
Gelec
V/ADU
Gdet
V/ADUGMUX V/V
Gconv e/ADU
1/ Gpixel
V/e
Ccell fF
ARC 6.5 11.69 13.23 0.88 2.50 5.29 30.23
23.4 3.26 3.66 0.89 0.63 5.81 27.54
3.4 Read Noise We measure the read noise as the standard deviation of signal values for a population of pixels distributed over a spatially contiguous region in the absence of illumination and dark signal. The measurement requires that the detector temperature be low enough and exposure time be short enough to prevent significant dark current from accumulating and contributing shot noise to the standard deviation. In addition, the off-chip electronics must have low enough noise such that it also does not contribute to the standard deviation.
The dark ramps contain the data that we use for measuring read noise. We process the data by averaging groups of adjacent reads to form “Fowler pairs” as shown in Figure 3-5. In general, the standard deviation appears to decrease as 1/√N, where N is the number of Fowler pairs. Deviations from this behavior
8
suggest 1/f noise. We find CDS read noise of about 17 e. Once the system read noise is subtracted in quadrature, we find a device read noise of about 15.5 e.
Figure 3-5 The plot shows the measured read noise for VIRGO-14. CDS read noise was
measured at ~17 e.
3.5 Linearity and Well Depth We measure the well depth and linearity by exposing the detector to a flat illumination source and obtaining a ramp with many reads through the saturation level. Figure 3-6 shows that the VIRGO-14 detector saturates at about 126 Ke. The linearity plot, in the bottom panel of Figure 3-6 shows the average of normalized slopes for all of the pixels on the detector at a particular signal. The normalization is with respect to the slope between the first and zero
th read of the
ramp for each pixel. The figure shows that the detector is linear to within about 5% over 90% of its well range, and that the non-linearity is well-fit by a second order polynomial, to within a few tenths of a percent over most of the well range. This non-linearity is reproducible to within a few tenths of a percent.
Figure 3-6 The plots show the measured well depth and linearity for VIRGO-14.
9
3.6 Dark Current We measure dark current as a function of temperature for each pixel by fitting a linear slope to the increasing signal values in a sequence of non-destructive reads up-the-ramp. Figure 3-7 shows the median dark current versus temperature for the VIRGO-14 detector. Note that the dark current for VIRGO-14 is ~0.02 e/sec/pixel at ~45 K.
Figure 3-7 The plot shows the measured dark current versus temperature for VIRGO-14.
3.7 Crosstalk We measure crosstalk using events in dark exposures generated by cosmic ray hits. A cosmic ray hit generates an instantaneous increase in signal during an up the ramp exposure where the slope before and after the event are the same. These events are identified and analyzed. Only cosmic ray hits that hit normal to the detector and centrally within a single pixel are used. The charge generated by the hit is collected within the central pixel. Any signal increase in neighboring pixels is attributed to induced signal from the central pixel. Figure 3-8 shows the signal crosstalk in the nearest neighbors to a hit on VIRGO-14. The values are reported as a percentage of the central hit signal.
Figure 3-8 Pictured is the crosstalk percentages for the nearest neighbors to signal spikes from cosmic ray hits on VIRGO-14.
10
4. PROJECT STATUS Four detectors have been made for this project, including two VUC detectors. Additionally, two were fabricated using existing RVS processes, one grown on traditional CZT and the other on Si. The two VUC detectors are under test; more VUC detectors will be tested to identify the optimal pixel design for quantum efficiency and dark current. The selected design will be scaled to full 1K×1K and 2K×2K detectors which will then be fully characterized.
5. CONCLUSIONS We fabricated and tested a new generation of large-format array detectors for astronomy. The dark current of one device is ~0.02 e/s/pixel, lower than previous measurements of MCT/Si detectors [1]. We are fabricating new devices that have design variations. These devices will be characterized in order to determine the optimal design.
6. ACKNOWLEDGEMENTS This material is based upon work supported by the National Aeronautics and Space Administration under Grant No. NNX13AH70G issued through the APRA Program and by the National Science Foundation under Award 1207827 through the ATI Program.
7. REFERENCES
[1] J. Bangs, M. Langell, M. Reddy, L. Melkonian, S. Johnson, L. Elizondo, K. Rybnicek, E. Norton, F. Jaworski, J. Asbrock and S. Baur, "Large format high-operability SWIR and MWIR focal plane array performance and capabilities," SPIE, vol. 8012, 2011.
[2] N. Bezawada, D. Ives and G. Woodhouse, "Characterisation of VISTA IR detectors," SPIE, vol. 5499, pp. 23-34, 2004.
[3] D. Figer, M. Agronin, J. Balleza, R. Barkhouser, L. Bergeron, G. Greene, S. McCandliss, B. J. Rauscher, T. Reeves, M. W. Regan, U. Sharma and H. S. Stockman, "The Independent Detector Testing Laboratory and the NGST Detector Program," SPIE, vol. 4850, p. 981, 2003.
[4] D. Figer, B. J. Rauscher, M. W. Regan, E. Morse, J. Balleza, L. Bergeron and H. Stockman, "Independent Testing of JWST Detector Prototypes," SPIE, vol. 5167, p. 270, 2004.
[5] L. M. Simms, D. F. Figer, B. J. Hanold, D. J. Kerr, D. K. Gilmore, S. M. Kahn and J. A. Tyson, "First results with a 4Kx4K Si PIN detector," SPIE, vol. 6619, 2007.